School Suicide Prevention, Intervention, & Postvention prevention... · School Suicide Prevention,...
40
School Suicide Prevention, Intervention, & Postvention Bret Harte High School February 26, 2010 Stephen E. Brock. Ph.D., NCSP, LEP 1 School Suicide Prevention, Intervention, & Postvention 1 Stephen E. Brock, Ph.D., NCSP California State University, Sacramento [email protected] http://www.csus.edu/indiv/b/brocks/ 916-278-5919 Bret Harte High School February 26, 2010 (8:00am -3:00pm) Angels Camp, CA Workshop Outline 1. Introduction a) Suicide Statistics 2. Levels of Suicide Prevention 3 Primary Prevention 2 3. Primary Prevention 4. Secondary Prevention 5. Tertiary Prevention National Youth Suicide Statistics Fourth leading cause of death among 10-14 year olds in 2006 (N = 216).* Third leading cause of death among 15 to 24 year olds in 2007 (N = 4030).** 2007 YRBS*** – 14.5% of high school students reported having seriously id d i id i th i 12 th 3 considered suicide in the prior 12 months. – 11.3% reported having made a suicide plan in the prior 12 months. – 6.9% of high school students reported having attempted suicide. – 2.0% indicated that the attempt required medical attention. 100 to 200 attempts for each completed youth suicide (vs. 4:1 among the elderly).**** *National Center for Injury Prevention and Control, 2009, http://webappa.cdc.gov/sasweb/ncipc/leadcaus10.html **National Vital Statistics Reports, 2009, www.cdc.gov/nchs/data/nvsr/nvsr58/nvsr58_01.pdf ***Youth Risk Behavior Surveillance, 2008, www.cdc.gov/mmwr/PDF/ss/ss5704.pdf ****Suicide Data Page, 2009, www.suicidology.org/c/document_library/get_file?folderId=228&name=DLFE-142.pdf
Transcript of School Suicide Prevention, Intervention, & Postvention prevention... · School Suicide Prevention,...

School Suicide Prevention, Intervention, & Postvention Bret Harte High SchoolFebruary 26, 2010
Stephen E. Brock. Ph.D., NCSP, LEP 1
School Suicide Prevention, Intervention, & Postvention
1
Stephen E. Brock, Ph.D., NCSPCalifornia State University, [email protected]://www.csus.edu/indiv/b/brocks/916-278-5919
Bret Harte High SchoolFebruary 26, 2010 (8:00am -3:00pm)Angels Camp, CA
Workshop Outline
1. Introductiona) Suicide Statistics
2. Levels of Suicide Prevention
3 Primary Prevention
2
3. Primary Prevention
4. Secondary Prevention
5. Tertiary Prevention
National Youth Suicide StatisticsFourth leading cause of death among 10-14 year olds in 2006 (N = 216).*Third leading cause of death among 15 to 24 year olds in 2007 (N = 4030).**2007 YRBS***– 14.5% of high school students reported having seriously
id d i id i th i 12 th
3
considered suicide in the prior 12 months.– 11.3% reported having made a suicide plan in the prior 12
months.– 6.9% of high school students reported having attempted
suicide.– 2.0% indicated that the attempt required medical attention.
100 to 200 attempts for each completed youth suicide (vs. 4:1 among the elderly).****
*National Center for Injury Prevention and Control, 2009, http://webappa.cdc.gov/sasweb/ncipc/leadcaus10.html**National Vital Statistics Reports, 2009, www.cdc.gov/nchs/data/nvsr/nvsr58/nvsr58_01.pdf***Youth Risk Behavior Surveillance, 2008, www.cdc.gov/mmwr/PDF/ss/ss5704.pdf****Suicide Data Page, 2009, www.suicidology.org/c/document_library/get_file?folderId=228&name=DLFE-142.pdf

School Suicide Prevention, Intervention, & Postvention Bret Harte High SchoolFebruary 26, 2010
Stephen E. Brock. Ph.D., NCSP, LEP 2
Other Suicide Facts: All Age Groups(2006 Final National Data)
Total number of deaths = 33,3001
– 11th leading cause of death2
More men die by suicide1
– Gender ratio 3.8 male suicides (N = 26,308) for each females suicide (N = 6,992)
Suicide Rate = 11.1/100,000 (males, 17.8; females, 4.6)1
4
50.7% of suicides were by firearms. 1,3
– Suicide by firearms rate = 5.60 (N = 16,883)– Suicide by firearms rate (15-19 yrs) = 3.30– Suicide by firearms rate (15-19 yrs male) = 5.87– Suicide by firearms rate (15-19 yrs female) = 0.60
Highest suicide rate is among white men over 85 (43.44/100,0003
vs 7.32/100,000 among 15-19 year olds3).– However the 6th highest rate is among American Indian/Alaskan Native
15-19 year old males3.1Suicide Data Page, 2009, www.suicidology.org/c/document_library/get_file?folderId=228&name=DLFE-142.pdf2National Vital Statistics Reports, 2009, www.cdc.gov/nchs/data/nvsr/nvsr58/nvsr58_01.pdf3 National Center for Injury Prevention and Control (2009), http://webappa.cdc.gov/sasweb/ncipc/mortrate10_sy.html
Suicide Rates by County
5
Source: http://www.cdc.gov/violenceprevention/suicide/statistics/suicide_map.html
Suicide Rate Ranges15 to 23.6 (12)12.4 to 15 (10)11.6 to 12.4 (6)10.2 to 11.6 (12)
US Suicide Rates by State
6
6 to 10.2 (11)

School Suicide Prevention, Intervention, & Postvention Bret Harte High SchoolFebruary 26, 2010
Stephen E. Brock. Ph.D., NCSP, LEP 3
Suicide Rates by State (2006 Final Data)
Rank State (2005 rank) # Rate1 Wyoming(4T) 116 22.52 Alaska (3) 135 20.13 Montana (1) 189 20.04 Nevada (2) 486 19.55 New Mexico (4T) 352 18.0
7
6 South Dakota (9) 125 16.07 Arizona (8) 979 15.98 Oregon (10) 579 15.69 Colorado (6) 730 15.410 Idaho (7) 222 15.2National Total 32,637 11.043 California (42) 3,334 9.1
Source: McIntosh (2008)
California Suicide Rates
8
10
12
14
per 1
00,0
00)
0
2
4
6
8
Suic
ide
Rat
e (p
5-12 13-15 16-20 Total8
Suicide Rates by Region
9
Source: www.suicidology.org/c/document_library/get_file?folderId=228&name=DLFE-143.pdf

School Suicide Prevention, Intervention, & Postvention Bret Harte High SchoolFebruary 26, 2010
Stephen E. Brock. Ph.D., NCSP, LEP 4
Suicide Rates by Country
World Health Organization (most recent year
available; as of 2009)– http://www.who.int/mental health/preventio
10
http://www.who.int/mental_health/prevention/suicide_rates/en/index.html
World Wide Suicide Rates
11
Male Suicide Rates by Country
12
Male Suicide Rates58.8 to 73.7 (4)44.1 to 58.8 (5)29.4 to 44.1 (6)14.7 to 29.4 (25)0 to 14.7 (48)

School Suicide Prevention, Intervention, & Postvention Bret Harte High SchoolFebruary 26, 2010
Stephen E. Brock. Ph.D., NCSP, LEP 5
Female Suicide Rates by Country
13
Female Suicide Rates14.4 to 17.9 (4)10.8 to 14.4 (10)7.2 to 10.8 (15)3.6 to 7.2 (19)0 to 3.6 (40)
40
50
60
World Suicide Rates by Age & Gender (2000 data)
(per
100,
000)
14
0
10
20
30
5-14 yrs 15-24 yrs 25-34 yrs 35-44 yrs 45-54 yrs 55-64 yrs 65-74 yrs 75+ yrs
Males Females
\
Suic
ide
Rat
e
Source: WHO (2002)
30
35
40
45
50
US Suicide Rates by Age & Gender(2006 data)
(per
100,
000)
15
0
5
10
15
20
25
5-9 yrs 10-14 yrs
15-19 yrs
20-24 yrs
25-29 yrs
30-34 yrs
35-39 yrs
40-44 yrs
45-49 yrs
50-54 yrs
55-59 yrs
60-64 yrs
65-69 yrs
70-74 yrs
75-79 yrs
80-84 yrs
85+
Males Females Both Genders
Suic
ide
Rat
e
Source: NCIPC (2009)

School Suicide Prevention, Intervention, & Postvention Bret Harte High SchoolFebruary 26, 2010
Stephen E. Brock. Ph.D., NCSP, LEP 6
Suicide Methods:10-14 Year Olds (2004 data)
hod
16
0 50 100 150 200 250
Suffication Firearm Poisoning Other
Source: NCIPC (2007)
Met
Suicide Methods:15-24 Year Olds (2004 data)
hod
17
0 500 1000 1500 2000 2500
Firearm Suffocation Poisoning FallOther Cut/pierce Transportation DrowningFire/burn Unspecified
Source: NCIPC (2007)
Met
h
Male Suicide Rates by Age & Ethnicity (2006 data)
30
35
40
45
50
e (p
er 1
00,0
00)
18
Source: NCIPC (2009)
0
5
10
15
20
25
05-09 yrs
10-14 yrs
15-19 yrs
20-24 yrs
25-29 yrs
30-34 yrs
35-39 yrs
40-44 yrs
45-49 yrs
50-54 yrs
55-59 yrs
60-64 yrs
65-69 yrs
70-74 yrs
75-79 yrs
80-84 yrs
85+ yrs
White Black AmI nd/AK Native Asian/Pac Islander All Groups
Suic
ide
Rat
e
School Suicide Prevention, Intervention, & Postvention Bret Harte High SchoolFebruary 26, 2010
Stephen E. Brock. Ph.D., NCSP, LEP 7
Female Suicide Rates by Age & Ethnicity (2006 data)
6
8
10
12
(per
100,0
00)
19
Source: NCIPC (2009)
0
2
4
05-09 yrs
10-14 yrs
15-19 yrs
20-24 yrs
25-29 yrs
30-34 yrs
35-39 yrs
40-44 yrs
45-49 yrs
50-54 yrs
55-59 yrs
60-64 yrs
65-69 yrs
70-74 yrs
75-79 yrs
80-84 yrs
85+
White Black AmI nd/AK Native Asian/Pac Islander All Groups
Suic
ide
Rat
e
15-19 Year Old USA Suicide Rates Over Time
101214161820
e(p
er 1
00,0
00)
20
02468
1950 1960 1970 1980 1990 1995 2000 2005 2006
Male Female Overall
Source: NCIPC (2009))
Suic
ide
Rat
e
16-20 Year Old California Suicide Rates Over Time
101214161820
e(p
er 1
00,0
00)
21
02468
10
1991
1992
1993
1994
1995
1996
1997
1998
1999
2000
2001
2002
2003
2004
2005
2006
2007
Source: CDPH (2010)
Suic
ide
Rat
e

School Suicide Prevention, Intervention, & Postvention Bret Harte High SchoolFebruary 26, 2010
Stephen E. Brock. Ph.D., NCSP, LEP 8
Percent1 of 9-12 Grade Students with an Injurious Suicide2 Attempt (YRBS)
2
2.5
3
3.5
4
22
0
0.5
1
1.5
1991 1993 1995 1997 1999 2001 2003 2005 2007
Male Female Total
1Response is for the 12 months preceding the survey2A suicide attempt that required medical attention
Youth Risk Behavior Survey (2008)
Calaveras County: 1991-2006
Nonfatal Self-Inflicted Hospitalized Injuries
4
5
6
0
1
2
3
13 to 15 16 to 20 All Youth
Percent1 of 9-12 Grade Students with a Suicide Attempt2 (YRBS)
6
8
10
12
14
rcen
t
24
0
2
4
6
1991 1993 1995 1997 1999 2001 2003 2005 2007
Male Female Total
Per
1Response is for the 12 months preceding the survey2A suicide attempt that did not necessarily require medical attention
Youth Risk Behavior Survey (2008)

School Suicide Prevention, Intervention, & Postvention Bret Harte High SchoolFebruary 26, 2010
Stephen E. Brock. Ph.D., NCSP, LEP 9
Percent1 of 9-12 Grade Students with a Suicide Plan2 (YRBS)
15
20
25
30
25
0
5
10
1991 1993 1995 1997 1999 2001 2003 2005 2007
Male Female Total1Response is for the 12 months preceding the survey2Thought about how they would attempt suicide
Youth Risk Behavior Survey (2008)
Percent1 of 9-12 Grade Students who Seriously Considered Suicide (YRBS)
2025303540
26
05
101520
1991 1993 1995 1997 1999 2001 2003 2005 2007
Male Female Total1Response is for the 12 months preceding the survey
Youth Risk Behavior Survey (2008)
Percent1 of 9-12 Grade Students who felt “sad or hopless”2 (YRBS)
20
25
30
35
40
27
0
5
10
15
1999 2001 2003 2005 2007
Male Female Total1Response is for the 12 months preceding the survey2Almost every day for two weeks or more in a row and as a result stopped doing some usual activities
Youth Risk Behavior Survey (2008)

School Suicide Prevention, Intervention, & Postvention Bret Harte High SchoolFebruary 26, 2010
Stephen E. Brock. Ph.D., NCSP, LEP 10
Percent1 of 9-12 Grade Students who display suicide related behaviors2 (YRBS)
15
20
25
30
35
ent
28
0
5
10
1991 1993 1995 1997 1999 2001 2003 2005 2007
Attempt w/ injury Attempt w/o injury Suicide PlanSuicide Thoughts Sad/Hopeless
Perc
e
1Response is for the 12 months preceding the survey2Both genders Youth Risk Behavior Survey (2008)
Workshop Outline
1. Introduction
2. Levels of Suicide Preventiona) Primaryb) Secondaryc) Tertiary
29
c) Tertiary
3. Primary Prevention
4. Secondary Prevention
5. Tertiary Prevention
Levels of Prevention
Primary (Suicide Prevention)– District and/or School Policy– School Suicide Awareness Curricula– School-Wide Screening– Gatekeeper Training
30
Gatekeeper Training– Crisis Centers and Hotlines– Risk Factor Reduction
• Restriction of Lethal Means• Media Education• Postvention• Skills Training

School Suicide Prevention, Intervention, & Postvention Bret Harte High SchoolFebruary 26, 2010
Stephen E. Brock. Ph.D., NCSP, LEP 11
Levels of Prevention
Secondary (Suicide Intervention)– Risk Factor Identification– General Staff Procedures– Risk Assessment and Referral Procedures
31
Levels of Prevention
Tertiary (Suicide Postvention)– Definitions– Special Suicide Postvention Issues – Suicide Postvention Protocol
32
Workshop Outline
1. Introduction
2. Levels of Suicide Prevention
3. Primary Preventiona) Prevention Policy
33
a) e e o o cyb) Curriculumc) Screeningd) Gatekeeper traininge) Hotlinesf) Risk Factor Reduction
4. Secondary Prevention
5. Tertiary Prevention

School Suicide Prevention, Intervention, & Postvention Bret Harte High SchoolFebruary 26, 2010
Stephen E. Brock. Ph.D., NCSP, LEP 12
Primary Prevention: Suicide Prevention PolicyIt is the policy of the Governing Board that all staff members learn how to recognize students at risk, to identify warning signs of suicide, to take preventive precautions, and to report
i id th t t th i t t l d
34
suicide threats to the appropriate parental and professional authorities.
Administration shall ensure that all staff members have been issued a copy of the District's suicide prevention policy and procedures. All staff members are responsible for knowing and acting upon them.
Primary Prevention:Suicide Prevention Curricula
Nationally, 15.9% of schools offer a classroom curriculum-based program.
An almost universal component of these
35
An almost universal component of these programs is the targeting of all adolescents regardless of their suicide risk.
Programs on the average lasted almost 4 hours.
Primary Prevention:1
Suicide Prevention Curricula Goals
Increased awareness of the problem of youth suicide.
Facilitating both peer and self identification
36
and referral.
Improve coping skills.NOTE:
Most curricula employ a stress model of suicide vs. a mental illness model
1Acknowledgement/Reference: Gould, M. S., & Kramer, R. A. (2001). Youth suicide prevention. Suicide and Life-Threatening Behavior, 31 (sup.), 6-31.

School Suicide Prevention, Intervention, & Postvention Bret Harte High SchoolFebruary 26, 2010
Stephen E. Brock. Ph.D., NCSP, LEP 13
Primary Prevention:1
Suicide Prevention Curricula Criticisms
Few Suicidal Students Are Reached. Uncertain Effects on the Suicidal Student. – Some research indicates slight positive effects
(attitudes & knowledge).Some research indicates no effect
37
– Some research indicates no effect.– Some research indicates negative effects.
• Reduced likelihood of referral• Negative reactions among at-risk students
– Not recommending the program– Feeling more suicidal/anxious
Tendency to Normalize Suicidal Behavior. 1Acknowledgement/Reference: Gould, M. S., & Kramer, R. A. (2001). Youth suicide prevention. Suicide and Life-Threatening Behavior, 31 (sup.), 6-31.
Primary Prevention:1
Suicide Prevention Screening
School-wide Screening – Very few false negatives– Many false positives
• Requires second-stage evaluation
Limitations
38
Limitations– Risk waxes and wanes– Principals’ view of acceptability – Requires effective referral procedures
Possible Tool– Suicidal Ideation Questionnaire– Author: William Reynolds– Publisher: Psychological Assessment Resources
1Acknowledgement/Reference: Gould, M. S., & Kramer, R. A. (2001). Youth suicide prevention. Suicide and Life-Threatening Behavior, 31 (sup.), 6-31.
Primary Prevention:Suicide Prevention Curriculum
SOS: Depression Screening and Suicide Prevention– http://www.mentalhealthscreening.org/highschool/– “The main teaching tool of the SOS program is a video that
teaches students how to identify symptoms of depression and suicidality in themselves or their friends and encourages help-seeking The program's primary objectives are to educate teensseeking. The program s primary objectives are to educate teens that depression is a treatable illness and to equip them to respond to a potential suicide in a friend or family member using the SOS technique. SOS is an action-oriented approach instructing students how to ACT (Acknowledge, Care and Tell) in the face of this mental health emergency.”
– Evidenced based!– SOS PowerPoint

School Suicide Prevention, Intervention, & Postvention Bret Harte High SchoolFebruary 26, 2010
Stephen E. Brock. Ph.D., NCSP, LEP 14
Primary Prevention:Suicide Prevention Screening
SOS: Depression Screening and Suicide Prevention – The Brief Screen for Adolescent Depression (BSAD) is a 7-
question screening tool that reinforces the information students receive regarding depression through the video and educational materials. Screenings can be administered anonymously. Forms are available in English and Spanish.Following the video and/or screening schools should provide– Following the video and/or screening, schools should provide an opportunity for students to talk further with a school professional.
Primary Prevention:1
Suicide Prevention: Gatekeeper Training
Training natural community caregivers– (e.g., Suicide Intervention Training)
Advantages– Reduced risk of imitation
41
– Expands community support systemsResearch is limited but promising– Durable changes in attitudes, knowledge,
intervention skills
1Acknowledgement/Reference: Gould, M. S., & Kramer, R. A. (2001). Youth suicide prevention. Suicide and Life-Threatening Behavior, 31 (sup.), 6-31.
Primary Prevention:Suicide Prevention: Gatekeeper TrainingA Specific Training Program:
Applied Suicide Intervention Skills Training– Author: Ramsay, Tanney, Tierney, & Lang– Publisher: LivingWorks Education, Inc– 1-403-209-0242– http://www.livingworks.net/
42
The ASIST workshop (formerly the Suicide Intervention Workshop) is for caregivers who want to feel more comfortable, confident and competent in helping to prevent the immediate risk of suicide. Over 200,000 caregivers have participated in this two-day, highly interactive, practical, practice-oriented workshop.Training for Trainers is a (minimum) five-day course that prepares local resource persons to be trainers of the ASIST workshop. Around the world, there is a network of 1000 active, registered trainers.

School Suicide Prevention, Intervention, & Postvention Bret Harte High SchoolFebruary 26, 2010
Stephen E. Brock. Ph.D., NCSP, LEP 15
Primary Prevention:1
Suicide Prevention & Crisis HotlinesRationale– Suicidal ideation is associated with crisis– Suicidal ideation is associated with ambivalence– Special training is requires to respond to “cries for
help”
43
Likely benefit those who use themLimitations– Limited research regarding effectiveness– Few youth use hotlines– Youth are less likely to be aware of hotlines– Highest risk youth are least likely to use
1Acknowledgement/Reference: Gould, M. S., & Kramer, R. A. (2001). Youth suicide prevention. Suicide and Life-Threatening Behavior, 31 (sup.), 6-31.
Primary Prevention:Suicide Prevention & Crisis Hotlines
Washington Unified School District
Suicide Help Card
• Stay with the person – you are their lifeline! • Listen, really listen. Take them seriously! • Get, or call help immediately!
24 Hour Crisis Hopeline (530) 666-7778 (Woodland)
44
(530) 666 7778 (Woodland) (530) 756-5000 (Davis)
Suicide Help Card
If some one you know threatens suicide; talks about wanting to die, shows changes in behavior, appearance, or mood; abuses drugs or alcohol; deliberately injures themselves; appears depressed, sad, or withdrawn… You can help by staying calm and listening, being accepting and not judging, asking if they have suicidal thoughts, taking threats seriously, and not swearing secrecy – tell someone!
Get help: You can’t do it alone: Yolo County Mental Health Mobile Crisis Unite/Suicide Prevention Counseling
(916) 357-6350
Primary Prevention:1
Risk Factor Reduction
Restriction of Lethal Means
Media Education
Postvention
45
Postvention
Skills Training
1Acknowledgement/Reference: Gould, M. S., & Kramer, R. A. (2001). Youth suicide prevention. Suicide and Life-Threatening Behavior, 31 (sup.), 6-31.

School Suicide Prevention, Intervention, & Postvention Bret Harte High SchoolFebruary 26, 2010
Stephen E. Brock. Ph.D., NCSP, LEP 16
Primary Prevention:1
Risk Factor ReductionRestriction of Lethal Means– http://www.cdc.gov/mmwr/preview/mmwrhtml/mm5209a1.htm
Primary Prevention
Based on the available empirical data, ruling out any prevention strategy is probably premature; however, there is sufficient evidence to suggest that we should proceed
47
cautiously with school-based suicide awareness curriculum programs (Gould & Kramer, 2001, p. 21).
Workshop Outline
1. Introduction
2. Levels of Suicide Prevention
3. Primary Prevention
48
4. Secondary Prevention a) Risk Factor Identificationb) General Staff Proceduresc) Risk Assessment and Referral Procedures
5. Tertiary Prevention

School Suicide Prevention, Intervention, & Postvention Bret Harte High SchoolFebruary 26, 2010
Stephen E. Brock. Ph.D., NCSP, LEP 17
Suicide Intervention Risk Factors
Psychopathology– Associated with 90% of suicides– Prior suicidal behavior the best predictor– Substance abuse increases vulnerability and can
49
yalso act as a trigger
Familial– History– Stressor– Functioning
Biological– Reduced serotongenic activity
Situational
Suicide Intervention Risk Factors
50
– 40% have identifiable precipitants– A firearm in the home– By themselves are insufficient– Disciplinary crisis most common
Suicide Intervention Warning SignsSuicide notesDirect & indirect suicide threatsMaking final arrangementsGiving away prized possessionsTalking about death
51
Talking about deathReading, writing, and/or art about deathHopelessness or helplessnessSocial Withdrawal and isolationLost involvement in interests & activitiesIncreased risk-takingHeavy use of alcohol or drugs

School Suicide Prevention, Intervention, & Postvention Bret Harte High SchoolFebruary 26, 2010
Stephen E. Brock. Ph.D., NCSP, LEP 18
Abrupt changes in appearanceSudden weight or appetite changeSudden changes in personality or attitudeInability to concentrate/think rationally
Suicide Intervention Warning Signs
52
Sudden unexpected happinessSleeplessness or sleepinessIncreased irritability or crying easilyLow self esteem
Dwindling academic performanceAbrupt changes in attendanceFailure to complete assignmentsLack of interest and withdrawal
Suicide Intervention Warning Signs
53
Changed relationshipsDespairing attitude
Responding to a Suicide Threat.
– A student who has threatened suicide must becarefully observed at all times until a qualified t ff b d t i k t
Suicide Intervention General Staff Procedures
54
staff member can conduct a risk assessment.– The following procedures are recommended
whenever a student threatens to commit suicide.

School Suicide Prevention, Intervention, & Postvention Bret Harte High SchoolFebruary 26, 2010
Stephen E. Brock. Ph.D., NCSP, LEP 19
1. Stay with the student or designate another staff member to supervise the youth constantly and without exception until help arrives.
2. Under no circumstances should you allow the student to leave the school.
Suicide Intervention General Staff Procedures
55
3. Do not agree to keep a student's suicidal intentions a secret.
4. If the student has the means to carry out the threatened suicide on his or her person, determine if he or she will voluntarily relinquish it. Do not force the student to do so. Do not place yourself in danger.
5. Take the suicidal student to the prearranged room.6. Notify the Student Care Coordinator immediately. 7. Notify the Incident Commander immediately. 8. Inform the suicidal youth that outside help has been
Suicide Intervention General Staff Procedures
56
y pcalled and describe what the next steps will be.
Risk Assessment and Referral
Identify Suicidal Thinking
C d t Ri k A t
57
Conduct a Risk Assessment
Make Appropriate Referrals

School Suicide Prevention, Intervention, & Postvention Bret Harte High SchoolFebruary 26, 2010
Stephen E. Brock. Ph.D., NCSP, LEP 20
Risk Assessment and ReferralIdentification of suicidal intent– Be direct when asking the “S” question.
• BAD– You’re not thinking of hurting yourself, are
you?
58
• Better– Are you thinking of harming yourself?
• BEST– Sometimes when people have had your
experiences and feelings they have thoughts of suicide. Is this something that you’re thinking about?
Risk Assessment and Referral
Ramsay, Tanney, Lang, & Kinzel, 2004 (CPR++)
Current plan (greater planning = greater risk).• How (method of attempt)?
59
• How soon (timing of attempt)?• How prepared (access to means of attempt)?
Pain (unbearable pain = greater risk)• How desperate to ease the pain?
– Person-at-risk’s perceptions are key
Resources (more alone = greater risk)• Reasons for living/dying?
– Can be very idiosyncratic– Person-at-risk’s perceptions are key
Risk Assessment and Referral
Ramsay, Tanney, Lang, & Kinzel, 2004 (CPR++)
(+) Prior Suicidal Behavior?• of self
60
– 40 X greater risk• of significant others
– breaks down protective taboos(+) Mental Health Status?
• history mental illness– especially mood disorders & particularly bipolar
disorder increases risk• linkage to mental health care provider
– may decrease risk

School Suicide Prevention, Intervention, & Postvention Bret Harte High SchoolFebruary 26, 2010
Stephen E. Brock. Ph.D., NCSP, LEP 21
Risk Assessment and Referral
Suicide Screening – Very few false negatives– Many false positives
• Requires second-stage evaluation
61
q g
Limitations– Risk waxes and wanes– Principals’ view of acceptability – Requires effective referral procedures
Possible Tool– Suicidal Ideation Questionnaire– Author: William Reynolds– Publisher: Psychological Assessment Resources
Risk Assessment and Referral
Suicide Risk Assessment Summary
62
Risk Assessment and ReferralReferral– Contracting to reduce risk.
• Facilitative (when risk is low)• Directive (when risk is high)
– Help the person to identify reasons for living
63
– Help the person to identify reasons for living (resources)
» Objective knowledge of resources becomes important
– Surface ambivalence
– Implementing the contract.

School Suicide Prevention, Intervention, & Postvention Bret Harte High SchoolFebruary 26, 2010
Stephen E. Brock. Ph.D., NCSP, LEP 22
Risk Assessment and Referral
Suicide intervention script
64
Risk Assessment and Referral
Risk Assessment Protocol1. Conduct a Risk Assessment.2. Consult with fellow school staff members
regarding the Risk Assessment.
65
3. Consult with County Mental Health.
4. Use risk assessment information and consultation guidance to develop an action plan. Action plan options are as follows:
A. Extreme Risk– If the student has the means of his or her threatened suicide
at hand, and refuses to relinquish such then follow the
Risk Assessment and Referral
66
qExtreme Risk Procedures.
B. Crisis Intervention Referral– If the student's risk of harming him or herself is judged to be
moderate to high then follow the Crisis Intervention Referral Procedures.
C. Contracting– If the student's risk of harming him or herself is judged to be
low then follow the Contracting Procedures.

School Suicide Prevention, Intervention, & Postvention Bret Harte High SchoolFebruary 26, 2010
Stephen E. Brock. Ph.D., NCSP, LEP 23
A. Extreme Riski. Call the police.
ii. Calm the student by talking and reassuring until the police arrive.
Risk Assessment and Referral
67
iii. Continue to request that the student relinquish the means of the threatened suicide and try to prevent the student from harming him-or herself.
iv. Call the parents and inform them of the actions taken.
B.Crisis Intervention Referrali. Determine if the student's distress is the result of
parent or caretaker abuse, neglect, or exploitation.
Risk Assessment and Referral
68
ii. Meet with the student's parents.
iii. Determine what to do if the parents are unable or unwilling to assist with the suicidal crisis.
iv. Make appropriate referrals.
C. Contractingi. Determine if the student's distress is the result of
parent or caretaker abuse, neglect, or exploitation.
ii Meet with the student's parents
Risk Assessment and Referral
69
ii. Meet with the student s parents.iii. Make appropriate referrals.iv. Write a no-suicide contract.
5. Protect the privacy of the student and family.
6. Follow up with the hospital or clinic.

School Suicide Prevention, Intervention, & Postvention Bret Harte High SchoolFebruary 26, 2010
Stephen E. Brock. Ph.D., NCSP, LEP 24
Workshop Outline
1. Introduction
2. Levels of Suicide Prevention
3. Primary Prevention
70
4. Secondary Prevention
5. Tertiary Preventiona) Definitionsb) Special Suicide Postvention Issues c) Suicide Postvention Protocol
Suicide Postvention Case StudyJames was a well-liked high school junior. Active in after school sports, he was considered by many to be a “popular” student. However, over the course of the past year, James had developed a serious alcohol problem. In fact, his drinking at weekend parties had p , g pbecome something of a local legend. Friday after school, James’ girlfriend broke up with him claiming that she could no longer tolerate his drinking. Distraught, James went home, got drunk, found his father’s rifle and shot himself. Quickly discovered by a classmate, who had stopped by for a visit, James was rushed to the hospital.
71
Suicide Postvention Case StudyTragically, however, he was declared dead upon arrival. In a suicide note, James declared that if he could not be with his girlfriend he did not want to live. By the start of school on the following Monday, this death had been classified a suicide by the coroner’s office. Reacting to y gthe social stigma surrounding suicide and fearing other such deaths, the school principal suggested that staff not talk “to much” about this tragedy. The stunned staff, anxious talking about suicide in the first place, took this as cue to try to deny the magnitude of this tragedy. Very little classroom discussion occurred.
72

School Suicide Prevention, Intervention, & Postvention Bret Harte High SchoolFebruary 26, 2010
Stephen E. Brock. Ph.D., NCSP, LEP 25
Suicide Postvention Case StudySmall Group Discussion:
1. What suicide postvention issues are illustrated within this case study?Wh t i i i t ti t t i ld2. What crisis intervention strategies would you recommend?
Be prepared to share the results of your small group discussion with the larger group.
73
DefinitionsSuicide “Postvention”...
– Postvention is the provision of crisis intervention, support and assistance for those affected by a completed suicide.
“Affected” individuals...– “Affected” individuals may include
classmates, friends, teachers, coworkers, and family members.
“Survivors” of Suicide...– Affected individuals are often referred to as
“survivors” of suicide. 74
Special Issues
Suicide postvention is a unique crisis situation that must be prepared to operate in an environment that is not only suffering from a sudden and unexpected loss butfrom a sudden and unexpected loss, but one that is also anxious talking openly about the death.
75

School Suicide Prevention, Intervention, & Postvention Bret Harte High SchoolFebruary 26, 2010
Stephen E. Brock. Ph.D., NCSP, LEP 26
Special Issues
Suicide Contagion– “…a process by which exposure to the suicide or
suicidal behavior of one or more persons influences others to commit or attempt suicide.”
– “The effect of clusters appears to be strongest among adolescents.”
76
O’Carroll & Potter (1994, p. 9)
Special Issues
Suicide Contagion– “…between 1984 and 1987, journalists in Vienna
covered the deaths of individuals who jumped in front of trains in the subway system. The coverage was extensive and dramatic. In 1987, a campaign alerted reporters to the possible negative effects of such reporting, and suggested alternate strategies for coverage. In the first six months after the campaign began, subway suicides and non-fatal attempts dropped by more than 80 percent. The total number of suicides in Vienna declined as well.”
77
American Foundation for Suicide Prevention (2001, p. 1)
Special Issues
Suicide Contagion– Suicide rates increase when
• The number of stories about individual suicides increases• A particular death is reported at length or in many stories• The story of an individual death by suicide is placed on
the front page or at the beginning of a broadcast• The headlines about specific suicide deaths are dramatic
78
American Foundation for Suicide Prevention (2001, p. 1)

School Suicide Prevention, Intervention, & Postvention Bret Harte High SchoolFebruary 26, 2010
Stephen E. Brock. Ph.D., NCSP, LEP 27
Suicide Contagion– How do we determine if there is a suicide
cluster?
Special Issues
www.applications.dhs.ca.gov/epicdata/content/ST_suicide.htm
Suicide Contagion– How do we determine if there is a suicide
cluster in Calaveras County?
Special Issues
2.5
s
5 to 12 13 to 15 16 to 20 All Youth
0
0.5
1
1.5
2
Num
ber o
f Sui
cide
s
Special Issues
Emotional Reactions– Traumatic stress.– Grief.– GuiltGuilt.– Anger.– Rejection/Abandonment.– Shame/Isolation.
81

School Suicide Prevention, Intervention, & Postvention Bret Harte High SchoolFebruary 26, 2010
Stephen E. Brock. Ph.D., NCSP, LEP 28
Special Issues
Social Stigma– Both students and staff members may be
uncomfortable talking about the death.g– Survivors may receive (and/or perceive)
much less social support for their loss.• Viewed more negatively by others as well as
themselves.– There may exist a reluctance to provide
postvention services.82
Special IssuesDevelopmental Considerations
– Understanding of suicide and suicidal behaviors increases with age.• Primary grade children appear to understand the
concept of “killing oneself,” they typically do not p g y yp yrecognize the term “suicide” and generally do not understand the dynamics that lead to this behavior.
• Around fifth grade that students have a clear understanding of what the term “suicide” means and are aware that it is a psychosocial dynamic that leads to suicidal behavior.
– The risk of suicidal ideation and behaviors increases as youth progress through the school years.
83
Special Issues
Cultural Considerations– Attitudes toward suicidal behavior vary
considerably from culture to culture. – While some cultures may view suicide as
appropriate under certain circumstances, other have strong sanctions against all such behavior.
– These cultural attitudes have important implications for both the bereavement process and suicide contagion. 84

School Suicide Prevention, Intervention, & Postvention Bret Harte High SchoolFebruary 26, 2010
Stephen E. Brock. Ph.D., NCSP, LEP 29
Special Issues
Given these special issues the goals of suicide postvention are to:
1. prevent other suicides.1. prevent other suicides.2. reduce the onset and degree of
debilitation by psychiatric disorders (e.g., PTSD).
3. reduce feelings of isolation among suicide survivors.
85
Suicide PostventionProtocol
Preparedness is an essential component of effective postvention.
Make sure that a postvention is needed before initiating this intervention.
86
Suicide Postvention Checklist
1. Verify that a death has occurred.2. Mobilize the Crisis Response Team.3. Assess the suicide’s impact on the school and estimate the
level of postvention response.4. Notify other involved school personnel.5. Contact the family of the suicide victim.6. Determine what information to share about the death.7. Determine how to share information about the death.8. Identify students significantly affected by the suicide and
initiate a referral mechanism.9. Conduct a faculty planning session.10. Initiate crisis intervention services.11. Conduct daily planning sessions.12. Memorials.13. Debrief the postvention response. 87

School Suicide Prevention, Intervention, & Postvention Bret Harte High SchoolFebruary 26, 2010
Stephen E. Brock. Ph.D., NCSP, LEP 30
Item 2:Mobilize the Crisis Response Team (ICS)
Emergency Operations Center Director/ School Incident Commander
(Thinkers)
Intelligence Section
(Doers) Operations
Section
(Getters) Logistics Section
(Payers) Finance Section
Security and Safety (e.g., SRO)
Facilities (e.g., Building Engineer)
Student Care (e.g., Psychologist)
Supplies & Equip. (e.g., Secretary)
Emergency Medical (e.g., Nurse)
Staff & Community Volunteer Assignment (e.g., Community Liaison)
Translation (e.g., Community Liaison)
Communications (e.g., Public Information
Officer) 88
Item 2:Mobilize the Crisis Response Team
Incident Commander– Verifies that at death has occurred.– Mobilizes the crisis response team.– Oversees all postvention interventions.
Student Care Coordinator andCrisis Intervention Specialist
– Identifies individuals in need of postvention assistance.– Plans and implements interventions.– Coordinates crisis intervention workers.
89
Item 2:Mobilize the Crisis Response Team
Public Information Officer– Provides access to information.– Controls rumors.– Deals with the media.
Emergency Medical Coordinator– Keeps the crisis response team informed of victim’s medical status.
Security and Safety Coordinator– Responsible for crowd control.– Monitors common areas.– Communicates with law enforcement.
90

School Suicide Prevention, Intervention, & Postvention Bret Harte High SchoolFebruary 26, 2010
Stephen E. Brock. Ph.D., NCSP, LEP 31
Item 3:Assess the Suicide’s Impact on the School and Estimate the Level of Postvention Response
The importance of accurate estimates.
Temporal proximity to other traumatic events (especially suicides).
Timing of the suicide.
Physical and/or emotional proximity to the suicide.
91
Item 5:Contact the Family of the Suicide Victim
Contact should be made in person within 24 hours of the death.Purposes include...– Express sympathy. – Offer support.
Identify the victim’s friends/siblings who may need assistance– Identify the victim s friends/siblings who may need assistance.– Discuss the school’s postvention response.– Identify details about the death could be shared with outsiders.
Family members can be told that school staff will not discuss or speculate on family problems or other reasons why the individual committed suicide. However, even if a family requests it, it is typically not possible to keep the basic fact that the death was a suicide a secret and in most jurisdictions “cause of death” is a matter of public record.
92
Item 6:Determine What Information to Share About the Death
The longer the delay in sharing facts, the greater the likelihood of harmful rumors.
Several different communications will likely need to be offered.– Before a death is certified as a suicide.– After a death is certified as a suicide.– Provide facts and dispel rumors.– Do not provide suicide method details.
93

School Suicide Prevention, Intervention, & Postvention Bret Harte High SchoolFebruary 26, 2010
Stephen E. Brock. Ph.D., NCSP, LEP 32
Item 7:Determine How to Share Information About the Death
Reporting the death to students...– Avoid detailed descriptions of the suicide including specific
method and location.• Detailed descriptions increase the risk of a vulnerable individual
imitating the act.A id ti i i h h di d b i id (– Avoid romanticizing someone who has died by suicide (e.g., tributes by friends, school wide assemblies, sharing information over PA systems).
• Positive attention given to someone who has died (or attempted to die) by suicide can lead vulnerable individuals who desire such attention to take their own lives. Provide information in small groups (e.g., classrooms).
94Suicide Prevention Research Center (2005)
Item 7:Determine How to Share Information About the Death
Reporting the death to students...– Avoid over simplifying the causes of suicide and presenting
them as inexplicable or unavoidable.• Doing so may cause vulnerable individuals to think of it as a
common response. Research shows that more that 90% of suicide victims have a mental illness Present it as a poorsuicide victims have a mental illness. Present it as a poor choice that was preventable.
– Avoid using the words “committed suicide” or “failed suicide.”• The verb “committed” is usually associated with sins or crimes.
Suicide is better understood in a behavioral health context. Consider the phrase “died by suicide” or “non-fatal suicide attempt.”
95Suicide Prevention Research Center (2005)
Item 7:Determine How to Share Information About the Death
Reporting the death to students...– Always include a referral phone number and information
about local crisis intervention services• The National Suicide Prevention Lifeline toll-free number, 1-
8000-273-TALK, is available 24/7. It connects the caller to a certified crisis center near where the call is placedcertified crisis center near where the call is placed.
– Emphasize recent treatment advances for depression and other mental illness.
• This is likely associated with decreasing trends in suicide since 1990.
96Suicide Prevention Research Center (2005)

School Suicide Prevention, Intervention, & Postvention Bret Harte High SchoolFebruary 26, 2010
Stephen E. Brock. Ph.D., NCSP, LEP 33
Item 7:Determine How to Share Information About the Death
Reporting the death to parents...– Written memos.– Personal or phone contacts.
97
Item 7:Determine How to Share Information About the Death
Working with the media...– The Media Liaison should work with the press to down play
the incident.– It is essential that the media not romanticize the death.– The media should be encouraged to acknowledge the
pathological aspects of suicide.– Photos of the suicide victim should not be used.– “Suicide" should not be placed in the caption .– Include information about the community resources.
98Suicide Prevention Research Center (2005)
Working with the media...(continued)– Guidelines from the World Health Organization
1. Suicide is never the result of a single incident2. Avoid providing details of the method or the location a
suicide victim uses that can be copied
Item 7:Determine How to Share Information About the Death
p3. Provide the appropriate vital statistics (i.e., as indicated
provide information about the mental health challenges typically associated with suicide).
4. Provide information about resources that can help to address suicidal ideation.– http://cebmh.warne.ox.ac.uk/csr/images/WHO%20media%
20guidelines.pdf
99

School Suicide Prevention, Intervention, & Postvention Bret Harte High SchoolFebruary 26, 2010
Stephen E. Brock. Ph.D., NCSP, LEP 34
Item 8:Identify Students Significantly Affected by the Suicide and Initiate Referral Procedures
Risk Factors for Imitative Behavior– Facilitated the suicide.– Failed to recognize the suicidal intent.– Believe they may have caused the suicide.– Had a relationship with the suicide victim.– Identify with the suicide victim.– Have a history of prior suicidal behavior.– Have a history of psychopathology.– Shows symptoms of helplessness and/or hopelessness.– Have suffered significant life stressors or losses.– Lack internal and external resources.
Note. Adapted from information provided by American Association of Suicidology (1998); Brent et al. (1989); Davidson (1989); Davidson, Rosenberg, Mercy, Franklin, & Simmons (1989); Gould (1992); O'Carroll et al. (1988); Ruof and Harris (1988); and Sandoval & Brock (1996).
100
Item 9:Conduct a Staff Planning Session
1. Staff should be provided...– current information regarding the death.– an opportunity to ask questions and express
feelingsif available news articles about the death– if available, news articles about the death.
– information about suicide contagion.– suicide risk factors.– an updated list of referral resources– direction regarding how to interact with the media
• typically involves referral to the media liaison– plans for the provision of crisis intervention
services.101
Item 9:Conduct a Staff Planning Session
2. Specific activities/responsibilities for teachers include...– replacing rumors with facts.– encouraging the ventilation of feelings.– stressing the normality of grief and stress reactions.– discouraging attempts to romanticize the suicide.– identifying students at risk for an imitative response.– knowing how to make the appropriate referrals.
3. Address staff reactions.
4. Staff members should be given permission to feel uncomfortable. 102
School Suicide Prevention, Intervention, & Postvention Bret Harte High SchoolFebruary 26, 2010
Stephen E. Brock. Ph.D., NCSP, LEP 35
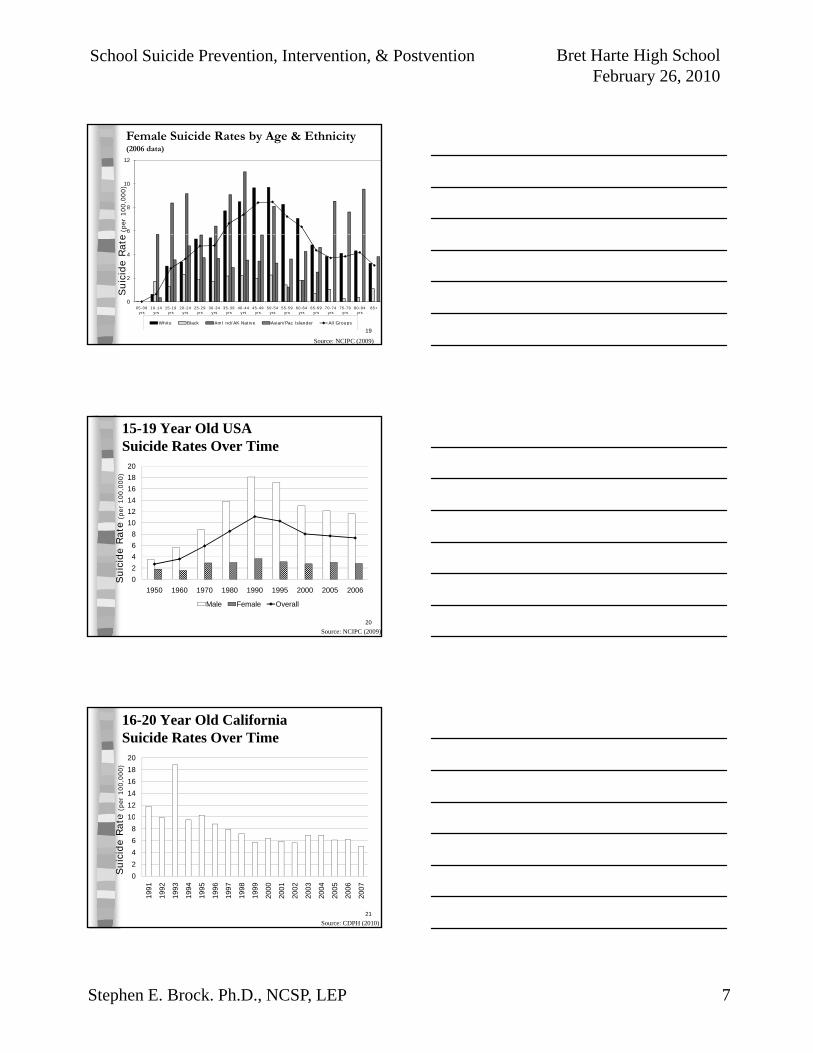
Item 10:Initiate Crisis Intervention Services
1. Initial intervention options...– Individual psychological first aid.– Group psychological first aid.– Classroom activities and/or presentations– Classroom activities and/or presentations.– Parent meetings.– Staff meetings.
2. Walk through the suicide victim’s class schedule.
3. Meet separately with individuals who were proximal to the suicide. 103
Item 10:Initiate Crisis Intervention Services
4. Identify severely traumatized and make appropriate referrals.
5. Facilitate dis-identification with the suicide victim...
– Do not romanticize or glorify the victim's behavior or circumstances.
– Point out how students are different from the victim.
6. Parental contact.
7. Psychotherapy Referrals.104
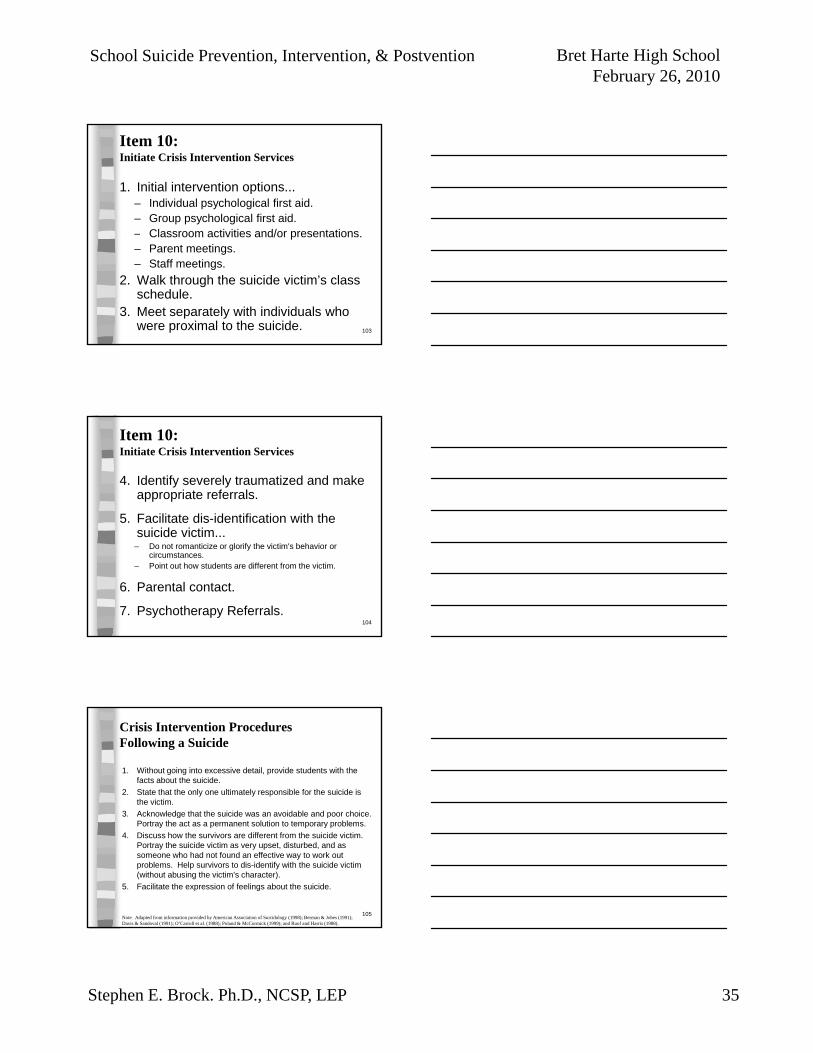
Crisis Intervention Procedures Following a Suicide
1. Without going into excessive detail, provide students with the facts about the suicide.
2. State that the only one ultimately responsible for the suicide is the victim.
3. Acknowledge that the suicide was an avoidable and poor choice. g pPortray the act as a permanent solution to temporary problems.
4. Discuss how the survivors are different from the suicide victim. Portray the suicide victim as very upset, disturbed, and as someone who had not found an effective way to work out problems. Help survivors to dis-identify with the suicide victim (without abusing the victim's character).
5. Facilitate the expression of feelings about the suicide.
Note. Adapted from information provided by American Association of Suicidology (1998); Berman & Jobes (1991); Davis & Sandoval (1991); O’Carroll et al. (1988); Poland & McCormick (1999); and Ruof and Harris (1988).
105

School Suicide Prevention, Intervention, & Postvention Bret Harte High SchoolFebruary 26, 2010
Stephen E. Brock. Ph.D., NCSP, LEP 36
Crisis Intervention Procedures Following a Suicide
6. State that there is no “right way” to feel after a suicide.7. Point out that painful reactions to the suicide will be alleviated
with time and talk.8. Acknowledge that people may have suicidal thoughts following
the suicide of a significant other.9. Provide information about the warning signs of suicidal behavior
and available mental health resources.10. If appropriate, prepare students for the funeral.
Note. Adapted from information provided by American Association of Suicidology (1998); Berman & Jobes (1991); Davis & Sandoval (1991); O’Carroll et al. (1988); Poland & McCormick (1999); and Ruof and Harris (1988).
106
Item 11:Conduct Daily Planning Sessions
Goals of the planning sessions:
1. Plans should be made for the day.
2. Ongoing evaluation of the progress of the postvention.
3. Evaluate and address staff reactions/needs.
107
Item 12:Memorials
“A delicate balance must be struck that creates opportunities for students to grieve but that does not increase suicide risk for other school students by glorifying,other school students by glorifying, romanticizing or sensationalizing suicide.”
(Center for Suicide Prevention, 2004)
Note. From “School Memorials After Suicide: Helpful or Harmful” by the Centre for Suicide Prevention (2004, May). Retrieved January 2006 from www.suicideinfo.ca
108

School Suicide Prevention, Intervention, & Postvention Bret Harte High SchoolFebruary 26, 2010
Stephen E. Brock. Ph.D., NCSP, LEP 37
Item 12:Memorials
Do NOT . . .– send all students from school to funerals, or stop classes for
a funeral.– have memorial or funeral services at school.– establish permanent memorials such as plaques or
dedicating yearbooks to the memory of suicide victims.– dedicate songs or sporting events to the suicide victims.– fly the flag at half staff.– have assemblies focusing on the suicide victim, or have a
moment of silence in all-school assemblies.
Note. From “Suicidal Ideation and Behaviors,” by S. E. Brock & J. Sandoval. In C. G. Bear, K. M. Minke, & A. Thomas, Children’s Needs II: Development, Problems, and Alternatives, 2006, Bethesda, MD: National Association of School Psychologists. Copyright 2006 by the National Association of School Psychologists.
109
Item 12:Memorials
DO . . .– something to prevent other suicides (e.g., encourage crisis
hotline volunteerism).– develop living memorials, such as student assistance
programs, that will help others cope with feelings and problems.problems.
– allow students, with parental permission, to attend the funeral.
– Donate/Collect funds to help suicide prevention programs and/or to help families with funeral expenses
– encourage affected students, with parental permission, to attend the funeral.
– mention to families and ministers the need to distance the person who committed suicide from survivors and to avoid glorifying the suicidal act.
Note. From “Suicidal Ideation and Behaviors,” by S. E. Brock & J. Sandoval. In C. G. Bear, K. M. Minke, & A. Thomas, Children’s Needs II: Development, Problems, and Alternatives, 2006, Bethesda, MD: National Association of School Psychologists. Copyright 2006 by the National Association of School Psychologists.
110
Item 13:Debrief the Postvention Response
Goals for debriefing will include...
– Review and evaluation of all crisis intervention activitiesintervention activities.
– Making of plans for follow-up actions.
– Providing an opportunity to help intervenorscope.
111

School Suicide Prevention, Intervention, & Postvention Bret Harte High SchoolFebruary 26, 2010
Stephen E. Brock. Ph.D., NCSP, LEP 38
Responding to the Aftermath of a Death by Suicide
Situation #1: You are the school principal and one of your teachers reports to you that a 15-year-old p y yfreshman has committed suicide by shooting himself in the head. This youth was part of a small peer group that was not considered to be especially popular at your school.
112
Responding to the Aftermath of a Death by Suicide
Situation #2: Your are the school counselor. It is summer vacation and a parent calls asking for you to intervene with a group of di t t ft th i f i d hit ddistress teens after their friend was hit and killed by a car on a local highway. You are told that the deceased was out drinking with her boy friend, came home and got into a fight with her mother, and then ran out of the house onto the highway. The deceased was bright, attractive, and very popular. The start of school is three weeks away. 113
Responding to the Aftermath of a Death by Suicide
Situation #3: The death of a 17-year-old senior has just been ruled a suicide by the coroner’s office. The suicide victim was distraught after having had to leave his old high school in another state.
114

School Suicide Prevention, Intervention, & Postvention Bret Harte High SchoolFebruary 26, 2010
Stephen E. Brock. Ph.D., NCSP, LEP 39
Responding to the Aftermath of a Death by Suicide
Situation #4: A 12-year-old, seventh grade male, has just shot himself during his fourth period English class. Earlier p ghe had been accused of sealing money from the purse of one of his teachers. He had just been told by the vice principal that he was in trouble with the law.
115
Responding to the Aftermath of a Death by SuicideFor the specified situation, discuss in a small group the following questions. Be prepared to share your responses to the large group at the conclusion of your discussion.
1 What do you estimate will be the suicide’s impact on the school?1. What do you estimate will be the suicide s impact on the school? What level of crisis intervention response do you think might be required (no response, school response, district response, regional response) (Explain your reasoning.)
2. Which student survivors do you think will be most affected by the suicide? (Justify your selections.)
3. What crisis intervention interventions would you consider? (Be as specific as time permits.)
4. Are there any special crisis intervention issues presented by the postvention situation? 116
ResourcesAmerican Foundation for Suicide Prevention et al. (2001) Reporting
on Suicide: Recommendations for the Media. Retrived January 17,2010, from www.afsp.org/index.cfm?page_id=0523D365-A314-431E-A925C03E13E762B1
Berman, A. L., Jobes, D. A., & Silverman, M. M. (2006). Adolescent suicide: Assessment and intervention (2nd ed.). Washington, DC: American Psychological Association.
Brock, S. E. (2002). School suicide postvention. In S. E. Brock, P. J.Brock, S. E. (2002). School suicide postvention. In S. E. Brock, P. J. Lazarus, & S. R. Jimerson (Eds.), Best practices in school crisis prevention and intervention (pp. 553-575). Bethesda, MD: National Association of School Psychologists.
Brock, S. E. (2003, May). Suicide postvention. Paper presented at the DODEA Safe Schools Seminar. Retrieved March 10, 2006, from www.dodea.edu/dodsafeschools/members/seminar/SuicidePrevention/generalreading.html#2
Brock, S. E., Sandoval, J., & Hart, S. R. (2006). Suicidal ideation and behaviors. In G Bear & K Minke (Eds.), Children’s needs III: Understanding and addressing the developmental needs of children (pp. 187-197). Bethesda, MD: National Association of School Psychologists
117

School Suicide Prevention, Intervention, & Postvention Bret Harte High SchoolFebruary 26, 2010
Stephen E. Brock. Ph.D., NCSP, LEP 40
ResourcesCenter for Suicide Prevention. (2004, May). School memorials after
suicide: Helpful or harmful? Retrieved January 15, 2006 from www.suicideinfo.ca
Davis, J. M., & Brock, S. E. (2002). Suicide. In J. Sandoval (Ed.), Handbook of crisis counseling, intervention and prevention in the schools (2nd ed., pp. 273-299). Hillsdale, NJ: Lawrence Erlbaum Associates.
Doan, J., Roggenbaum, S., & Lazear, K. (2003). Youth suicideDoan, J., Roggenbaum, S., & Lazear, K. (2003). Youth suicide prevention school-based guide – Issue brief 7a: Preparing for and responding to a death by suicide: Steps for responding to a suicide crisis. Tampa, FL: University of South Florida.
O’Carroll, P. W., & Potter, L. B. (1994). Suicide contagion and the reporting of suicide: Recommendations from a national workshop. MMWR, 43(RR-6) 9-18.
Suicide Prevention Resource Center. (2005) At-a-glance: Safe reporting on suicide. Retrieved January 17, 2010, from http://www.sprc.org/library/at_a_glance.pdf
U.S. Department of Homeland Security. (2004, March). National incident management system. Retrieved on September 9, 2005, from www.fema.gov/pdf/nims/nims_doc_full.pdf 118
School Suicide Prevention, Intervention, & Postvention
119
Stephen E. Brock, Ph.D., NCSPCalifornia State University, [email protected]://www.csus.edu/indiv/b/brocks/916-278-5919
Bret Harte High SchoolFebruary 26, 2010 (8:00am -3:00pm)Angels Camp, CA