School Milk Initiatives in the U.S.
16
School Milk Initiatives in the U.S. Tami J. Cline, R.D. Cline Consulting Washington, D.C.
Transcript of School Milk Initiatives in the U.S.

School Milk Initiatives in the
U.S.
Tami J. Cline, R.D.
Cline Consulting
Washington, D.C.
Major Initiatives
� New Look of School Milk
� St. Louis School Milk Test
� 3-A-Day
� EatSmart-GetMoving

New Look of School Milk

Why Change School Milk?
LongLong--Term Term
Negative Health Negative Health
TrendsTrends
DecliningDeclining
School Milk School Milk
ConsumptionConsumption
Increased Increased
Competitive Competitive
Activity (CSD)Activity (CSD)
in Schoolsin Schools
NonNon--Competitive Competitive
Image ofImage of
School MilkSchool Milk

Declining Milk
Consumption
Source: Beverage Marketing Corp.; DMI; SIP
1.9 gallons or 7.5%
Estimated per capita consumption -- 6 to 17 year olds
24.2
25.2
26.4
27.1
25.0
23.8
26.0 26.0
27.3
22
23
24
25
26
27
28
1991 1992 1993 1994 1995 1996 1997 1998 1999 2000 2001
Actual
w/o School Decline
Each student who stops drinking milk cost us 1,000 gallons –
schools are the Key to future consumption
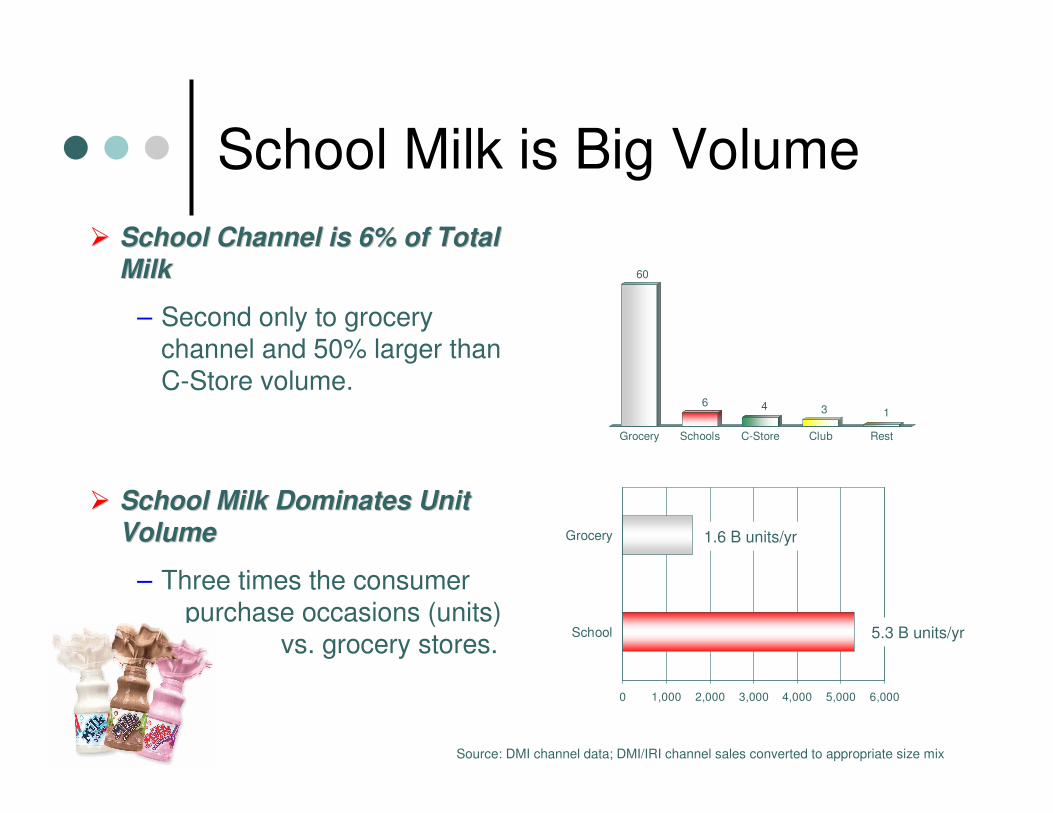
School Milk is Big Volume
60
6 4 3 1
Grocery Schools C-Store Club Rest
Source: DMI channel data; DMI/IRI channel sales converted to appropriate size mix
�� School Channel is 6% of Total School Channel is 6% of Total
MilkMilk
– Second only to grocery channel and 50% larger than C-Store volume.
�� School Milk Dominates Unit School Milk Dominates Unit
VolumeVolume
– Three times the consumer purchase occasions (units)
vs. grocery stores.
0 1,000 2,000 3,000 4,000 5,000 6,000
School
Grocery 1.6 B units/yr
5.3 B units/yr

Study Design
� 100,000 students
� 146 schools
� Conducted in 2001-2002
In addition to attractive plastic bottles, implemented improvements in:
� Merchandizing
� Additional and Enhanced Flavors
� Handling and Temperature
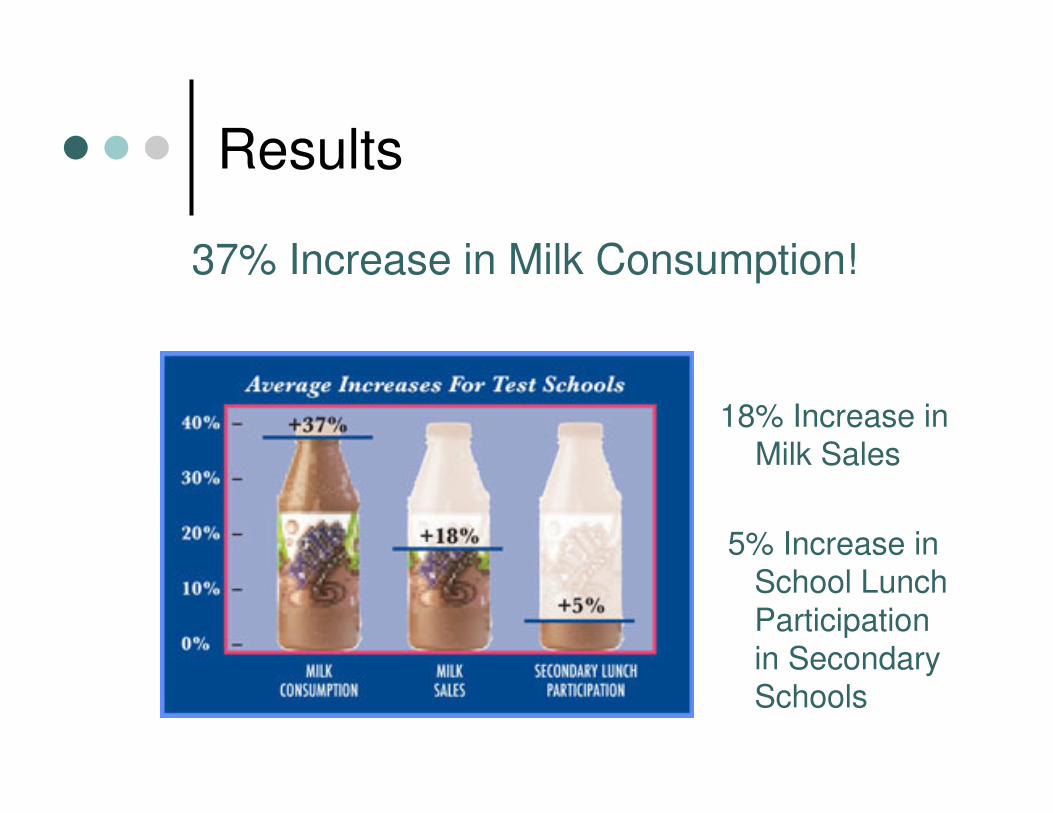
Results
37% Increase in Milk Consumption!
18% Increase inMilk Sales
5% Increase inSchool Lunch
Participation
in SecondarySchools

Sustained Results
� Ashdown, Arkansas:
� Milk Sales Increase 18%
� Breakfast Participation Increase 12%
� Lunch Participation Increase 11%
� South Windsor, Connecticut:
� Milk Volume Increase 25%
� Caribou, Maine:
� Milk Sales Increase 20%
� Milk Volume Increase 43%
� Lunch Participation Increase 8%
More information:
www.nutritionexplorations.org

St. Louis School Milk Test
Design:
� Conducted in 2004
� 165,000 students
� 300 schools
� Paperboard cartons
� Improved graphics
� Improved flavors
� New flavors
� Point of sale materials
� Sampling events
� Promotions

Results
� 12.2% increase in units/student sold
� Slight increase in meal participation
� Improved chocolate milk and contemporary
graphics accounted for 1/3 of growth
� Followed by new flavors, promotions, and
sampling
More information:www.milkdelivers.org

3-A-Day Campaign
� Focuses on 3
servings of milk, cheese or yogurt each day
� Logo appears on packages in
grocery stores
� Supported by U.S.
Dietary Guidelines

Consumer Campaign now
being extended to schools
� Backpack brochures
� Messages in nutrition education
lessons
� Promotion materials for school
cafeterias
More information:
www.3aday.org

Wellness Initiatives
� Schools in U.S. required to implement a wellness policy in 2006
� National Dairy Council partnered with School Nutrition Association in U.S. to create EatSmart-GetMoving campaign
focusing on health and wellness of school foodservice professionals
More information:www.eatsmart-getmoving.org

Eat Smart, Get Moving! Program Calendar — This full program outlines specific
dates for reporting.
Individual Tracking Form:
Phase 1 (Aug 1, 2006 — Oct 2, 2006)
Phase 2 (Oct 3, 2006 — Jan 1, 2007)
Phase 3 (Jan 2, 2007 — Apr 30, 2007)
All team members use these forms to track daily nutrition and physical activity
progress toward personal wellness. Print a clean copy every week for individual
team members. This form will change with each phase to reflect current goals.
Group Tracking Form — Team leaders use this tracking form for reporting total
team progress every two-weeks. Remember to enter the actual dates onto the
group tracking form for each two-week period to help you stay organized.
Criteria for "Healthy Meetings" — Teams can earn additional bonus points for
hosting a Healthy Meeting.
Program Overview — Read this document for a general overview of how the Eat
Smart, Get Moving! program works.
Getting Started — Simple steps to lead teams and team leaders
on their journey.
Turnkey Tools on the Webwww.eatsmart-getmoving.org

Thank you!