
School Indicators for New York City Charter Schools 2013 ...
28
IBO New York City Independent Budget Office New York City Independent Budget Office Ronnie Lowenstein, Director 110 William St., 14th floor New York, NY 10038 Tel. (212) 442-0632 Fax (212) 442-0350 [email protected] www.ibo.nyc.ny.us School Indicators for New York City Charter Schools 2013-2014 School Year July 2015
Transcript of School Indicators for New York City Charter Schools 2013 ...
IBO
Fiscal Brief New York City Independent Budget Office
New York CityIndependent Budget OfficeRonnie Lowenstein, Director
110 William St., 14th floorNew York, NY 10038Tel. (212) 442-0632
Fax (212) [email protected] www.ibo.nyc.ny.us
School Indicators for New York City Charter Schools2013-2014 School YearJuly 2015

NYC Independent Budget Office July 2015b
This report has been prepared by:Raymond Domanico, Director of Education Research
Share onReceive notiffication of IBO’s free reports by
E-mail Text Facebook Twitter RSS
NYC Independent Budget Office July 2015 c
Contents
Background 1Charter School Growth, Location, and Network Affiliation 3
Enrollment and School Growth 4Geographic Location and Network Affiliation 5Co-location and Building Utilization 8Student Attrition and Backfill 9Mobility 11
Demographic Characteristics of Charter School Students 13Gender, Race, and Poverty 14Birthplace, Home Language, and English Language Learner Status 15Special Needs Status and Specific Disability Classification 16Student Age Compared With Their Grade 16Demographic Characteristics of Students in
Network-Affiliated and Independent Charter Schools 17Achievement Results 19
Performance Levels, Citywide English Language Arts and Math 20Proficiency by Student Group 21English Language Arts and Math Achievement by Network Affiliation 22

NYC Independent Budget Office July 2015 1
In 2009, the state law granting the Mayor control of the New York City public school system was renewed. That renewal included a requirement that the New York City Independent Budget Office “enhance official and public understanding” of educational matters of the school system.
To date, IBO has published three Education Indicators Reports, covering four school years for the traditional public schools that are part of the Department of Education (DOE). This report is the first indicators report to focus on charter schools in the city.
While the data that we have on charter schools is not as extensive as what we have on traditional DOE schools, we are able to present significant amounts of important information on the group of students who attend charter schools and their performance.
• We have information that allows us to describe and categorize students by their demographic characteristics, including their English language learner (ELL) and Individualized Education Plan (IEP) status, as well as their home language, place of birth, age, ethnicity, and gender.
• We also present information on the performance of charter school students on the grades 3-8 New York State tests in English Language Arts and mathematics.
• We do not have access to any information on the teachers and other staff in charter schools, so we are unable to report on them.
• We also do not have information on student attendance, nor do we have data on students in temporary housing for charter schools.
It is important to note that this is a simple descriptive report and not designed to answer the question “Are charter schools more (or less) successful than traditional public schools?”
• Charter schools are still in their growing years in New York City. The nature of new school development means that some recently established charters may only be educating a small number of grades. Their results cannot be reasonably compared with schools offering a full complement of grades.
• Charter schools, which began in largely lower-income neighborhoods, are not evenly distributed across the city’s neighborhoods. As a result, the citywide statistics of charter schools can be expected to differ from that of those of the traditional public schools. Our demographic tables present these differences.
• Readers who are interested in the relative performance of charter and traditional public schools should consult the body of research that has been specifically designed to consider that question while controlling for differences in student population. The tables in this presentation should not be used to make broad statements about the relative performance of schools in the two sectors.
Background1
The independent budget office of the city of New York shall be authorized to provide analysis and issue public reports regarding financial and educational matters of the city district, to enhance official and public understanding of such matters…
New York State Education Law § 2590-u.

NYC Independent Budget Office July 20152
Data Sources
• Information on the opening date for individual charter schools as well as their geographic location and network affiliations was extracted from data made available to us by the Department of Education.
• All data on students is drawn from the Department of Education’s Student Information System. IBO receives this information for every student who has attended either a charter or traditional DOE school at any point in the school year. With a few exceptions, the data in this report refers to the 2013-2014 school year.
• This system allows us to see the movement of students into and out of the school system as well as their movement from one public school to another for both charters and traditional public schools.
• Information on the Individualized Education Plan and disability status of students is obtained from the DOE’s Child Assistance Program system, first made available to IBO in the last year. (These data are presented for the 2012-2013 school year.)
• Data on student achievement comes from the results of the annual state examinations in grades 3 through 8 in English Language Arts and mathematics.

NYC Independent Budget Office July 2015 3
2Charter School Growth, Location, and Network Affiliation
NYC Independent Budget Office July 20154
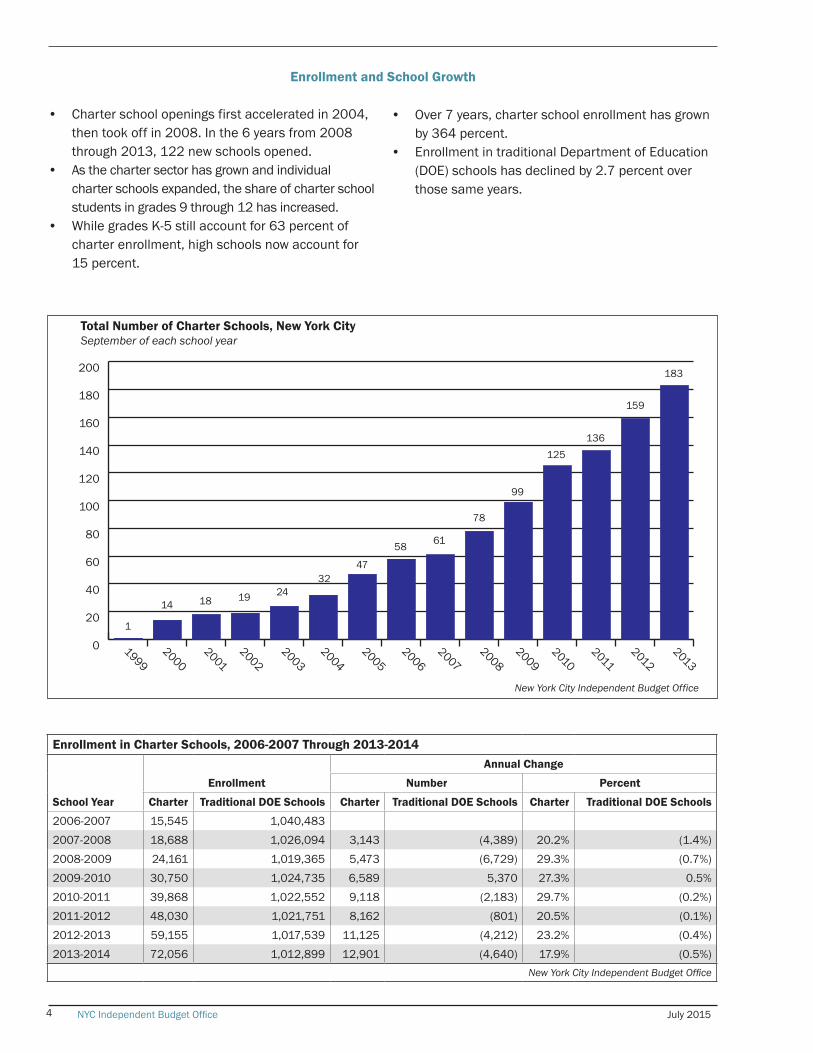
0
20
40
60
80
100
120
140
160
180
200
19992000
20012002
20032004
20052006
20072008
20092010
20112012
2013
Total Number of Charter Schools, New York CitySeptember of each school year
New York City Independent Budget Office
1
14 18 19 2432
47
58 61
78
99
125136
159
183
Enrollment in Charter Schools, 2006-2007 Through 2013-2014
School Year
Enrollment
Annual Change
Number Percent
Charter Traditional DOE Schools Charter Traditional DOE Schools Charter Traditional DOE Schools
2006-2007 15,545 1,040,4832007-2008 18,688 1,026,094 3,143 (4,389) 20.2% (1.4%)2008-2009 24,161 1,019,365 5,473 (6,729) 29.3% (0.7%)2009-2010 30,750 1,024,735 6,589 5,370 27.3% 0.5%2010-2011 39,868 1,022,552 9,118 (2,183) 29.7% (0.2%)2011-2012 48,030 1,021,751 8,162 (801) 20.5% (0.1%)2012-2013 59,155 1,017,539 11,125 (4,212) 23.2% (0.4%)2013-2014 72,056 1,012,899 12,901 (4,640) 17.9% (0.5%)
New York City Independent Budget Office
Enrollment and School Growth
• Charter school openings first accelerated in 2004, then took off in 2008. In the 6 years from 2008 through 2013, 122 new schools opened.
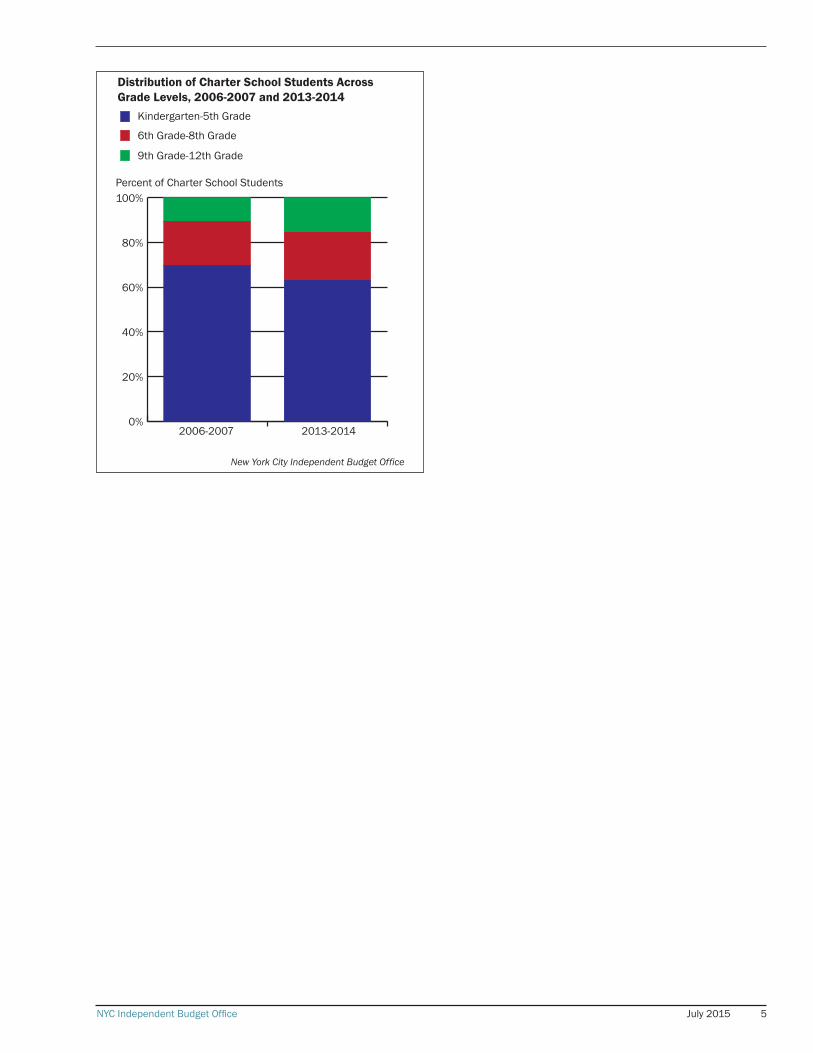
• As the charter sector has grown and individual charter schools expanded, the share of charter school students in grades 9 through 12 has increased.
• While grades K-5 still account for 63 percent of charter enrollment, high schools now account for 15 percent.
• Over 7 years, charter school enrollment has grown by 364 percent.
• Enrollment in traditional Department of Education (DOE) schools has declined by 2.7 percent over those same years.
NYC Independent Budget Office July 2015 5
0%
20%
40%
60%
80%
100%
2006-2007 2013-2014
Distribution of Charter School Students Across Grade Levels, 2006-2007 and 2013-2014
Percent of Charter School Students
Kindergarten-5th Grade
6th Grade-8th Grade
9th Grade-12th Grade
New York City Independent Budget Office

NYC Independent Budget Office July 20156
Distribution of Schools and Students by Geographic District, 2013-2014
Geographic District
Charter Schools
Geographic District
Charter Schools
Number of Schools
Number of Students
Charter Students as % of Charter +
DOE StudentsNumber of
SchoolsNumber of
Students
Charter Students as % of Charter +
DOE Students
5 12 7,304 36.8% 30 5 2,568 6.1%16 8 3,500 29.2% 11 7 2,277 5.5%23 7 3,078 22.9% 29 2 1,121 4.0%4 10 3,834 22.0% 22 4 1,256 3.50%7 15 5,092 20.5% 10 5 1,538 2.6%14 11 3,850 16.2% 2 5 1,239 1.9%17 10 3,979 13.9% 31 3 993 1.6%18 8 2,801 13.8% 27 2 729 1.6%3 9 3,604 13.7% 21 1 460 1.3%19 8 3,754 13.6% 24 2 337 0.6%13 8 3,019 12.1% 28 1 190 0.5%32 3 1,603 10.5% 20 - 9 10 4,113 10.2% 25 - 1 4 1,161 8.9% 26 - 6 5 2,122 8.0% Total 183 72,056 6.9%
15 7 2,410 7.6% Non-Geographic: District 75 & 79 - - -8 6 2,276 7.2%
12 5 1,848 7.1% Grand Total 183 72,056 6.6%NOTE: The geographic district corresponds to community school districts. In 2013-2014, 16 of the 18 charter schools served students in more than one geographic district. In a majority of cases, elementary and/or middle school grades were served in a different district than the school’s high school grades.
New York City Independent Budget Office
• Charter schools are more heavily concentrated in some areas of the city than others.
• In Harlem, district 5, almost 37 percent of students attended charter schools in the 2013-2014 school year.
• In two districts in central and eastern Brooklyn, (16 and 23), as well as East Harlem (4) and the South Bronx (7), over 20 percent of the student population attended charter schools.
• At the same time, three districts had no charters, and five others had fewer than five charters each.
• Staten Island (31) had 3 charter schools and Queens (24-30) had 12.
• More than half of all charter school students are in schools affiliated with a network or management organization.
• The nature of the relationship between school and network varies greatly across the 17 networks.
• The Success Charter Network is the largest and fastest growing charter network.
• The 94 schools characterized as independent have no seperate entities providing supervisory, educational, or other assistance or oversight besides their own boards of directors and charter authorizer.
Geographic Location and Network Affiliation

NYC Independent Budget Office July 2015 7
Network or Other Affiliation of Charter Schools,2013-2014
NetworkNumber of
SchoolsNumber of
Students
Success Charter Network 18 6,585Uncommon Schools 12 5,051Achievement First 7 4,703Icahn Network 7 1,636New Visions for Public Schools 6 1,441Victory Education Partners 6 2,276Democracy Prep Public Schools 5 2,734KIPP 5 3,611Ascend Learning 4 2,325Explore Schools Inc. 4 1,626National Heritage Academies 4 2,468Beginning with Children Foundation 2 568Harlem Village Academy 2 1,376Lighthouse Academies, Inc. 2 952Public Preparatory Network 2 1,017ROADS Schools, Inc. 2 444Kunskapsskolan Education AB 1 170
Total in Networks 89 38,983
Independent 94 33,073Total Number of Charter Schools 183 72,056NOTES: Victory Education Partners is considered a “service provider.”National Heritage is an educational management organization.
New York City Independent Budget Office

NYC Independent Budget Office July 20158
• Sixty-one percent of charter schools were co-located in DOE buildings in school year 2013-2014.
• On average, charter schools co-located in DOE buildings had higher utilization rates than the traditional DOE schools in the same building.
• The impact on DOE schools in these buildings varies. Thirteen percent of the schools had utilization rates above 100 percent but the average utilization rate was 72 percent and 60 percent of these schools had utilization rates below 80 percent.
Co-location of Charter Schools in DOE Buildings, 2013-2014
Co-located Not Co-located
Percent in Co-located
Space
Charter Schools 112 71 61.2%Students 38,327 33,729 53.2%
New York City Independent Budget Office
Average Utilization Rates of Schools in Buildings With Co-located Charters, 2013-2014
School Enrollment
School Target
Capacity School
Utilization
Traditional DOE Schools 68,080 93,997 72.4%Charter Schools 38,327 41,067 93.3%
New York City Independent Budget Office
Co-location and School Utilization
0%
5%
10%
15%
20%
25%
30%
35%
40%
45%
Less Than 70%
70%-79%
80%-89%
90%-100%
Over100%
Utilization Rates of Traditional DOE & Charter Schools in Buildings With Co-located Charter Schools, 2013-2014
Charter Schools
Traditional Department of Education Schools
Percent of Schools
School Utilization Rate
New York City Independent Budget Office
NYC Independent Budget Office July 2015 9
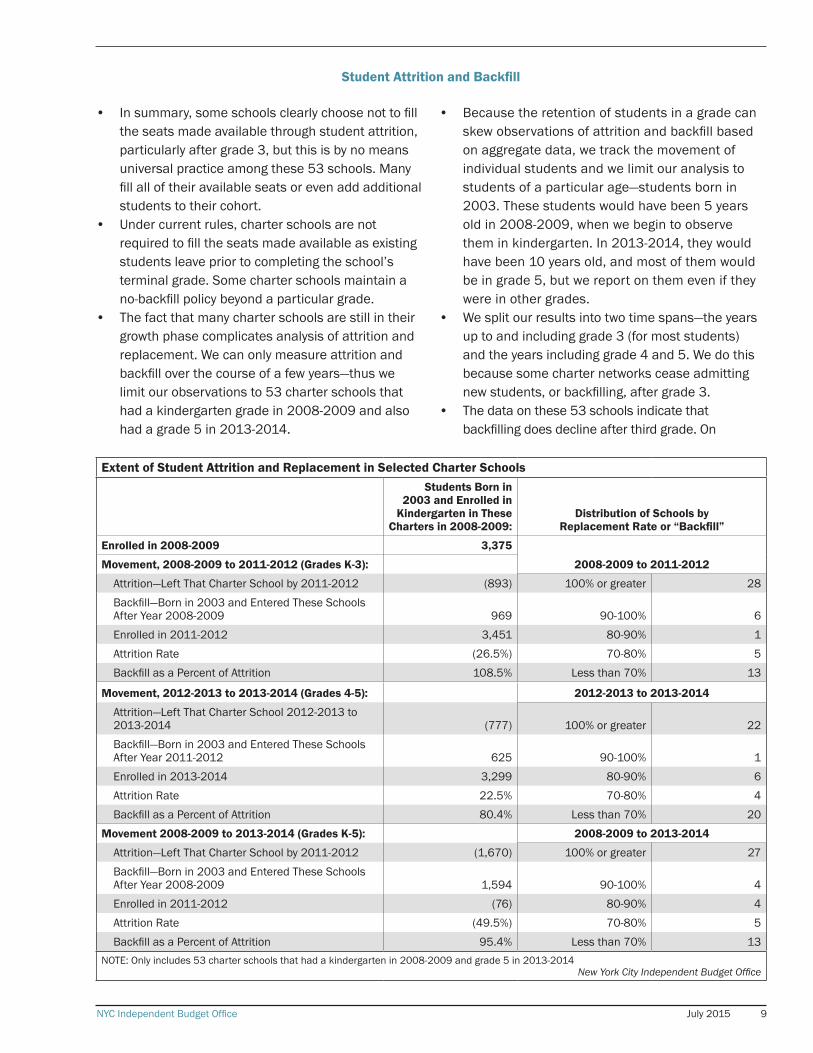
Extent of Student Attrition and Replacement in Selected Charter SchoolsStudents Born in
2003 and Enrolled in Kindergarten in These
Charters in 2008-2009:Distribution of Schools by
Replacement Rate or “Backfill”
Enrolled in 2008-2009 3,375
2008-2009 to 2011-2012Movement, 2008-2009 to 2011-2012 (Grades K-3):
Attrition—Left That Charter School by 2011-2012 (893) 100% or greater 28Backfill—Born in 2003 and Entered These Schools After Year 2008-2009 969 90-100% 6Enrolled in 2011-2012 3,451 80-90% 1Attrition Rate (26.5%) 70-80% 5Backfill as a Percent of Attrition 108.5% Less than 70% 13
Movement, 2012-2013 to 2013-2014 (Grades 4-5): 2012-2013 to 2013-2014
Attrition—Left That Charter School 2012-2013 to 2013-2014 (777) 100% or greater 22Backfill—Born in 2003 and Entered These Schools After Year 2011-2012 625 90-100% 1Enrolled in 2013-2014 3,299 80-90% 6Attrition Rate 22.5% 70-80% 4Backfill as a Percent of Attrition 80.4% Less than 70% 20
Movement 2008-2009 to 2013-2014 (Grades K-5): 2008-2009 to 2013-2014
Attrition—Left That Charter School by 2011-2012 (1,670) 100% or greater 27Backfill—Born in 2003 and Entered These Schools After Year 2008-2009 1,594 90-100% 4Enrolled in 2011-2012 (76) 80-90% 4Attrition Rate (49.5%) 70-80% 5Backfill as a Percent of Attrition 95.4% Less than 70% 13
NOTE: Only includes 53 charter schools that had a kindergarten in 2008-2009 and grade 5 in 2013-2014New York City Independent Budget Office
• In summary, some schools clearly choose not to fill the seats made available through student attrition, particularly after grade 3, but this is by no means universal practice among these 53 schools. Many fill all of their available seats or even add additional students to their cohort.
• Under current rules, charter schools are not required to fill the seats made available as existing students leave prior to completing the school’s terminal grade. Some charter schools maintain a no-backfill policy beyond a particular grade.
• The fact that many charter schools are still in their growth phase complicates analysis of attrition and replacement. We can only measure attrition and backfill over the course of a few years—thus we limit our observations to 53 charter schools that had a kindergarten grade in 2008-2009 and also had a grade 5 in 2013-2014.
• Because the retention of students in a grade can skew observations of attrition and backfill based on aggregate data, we track the movement of individual students and we limit our analysis to students of a particular age—students born in 2003. These students would have been 5 years old in 2008-2009, when we begin to observe them in kindergarten. In 2013-2014, they would have been 10 years old, and most of them would be in grade 5, but we report on them even if they were in other grades.
• We split our results into two time spans—the years up to and including grade 3 (for most students) and the years including grade 4 and 5. We do this because some charter networks cease admitting new students, or backfilling, after grade 3.
• The data on these 53 schools indicate that backfilling does decline after third grade. On
Student Attrition and Backfill

NYC Independent Budget Office July 201510
average, charters backfill all of their available seats, and then add some more enrollment, up to and including third grade. In the two subsequent years, they fill 80 percent of available seats, on average.
• The data also indicate wide variation across schools. After third grade, 23 out of the 53 charter schools backfilled 90 percent or more of their open
seats, while 20 schools filled less than 70 percent of their available seats. These 20 schools include 5 with backfill rates below 5 percent (meaning they admitted 1 or zero students into that cohort in those 2 years). An additional six schools backfilled one-third or less of their available seats.

NYC Independent Budget Office July 2015 11
Movement Into Charter Schools:For Students in Charter Schools in 2013-2014, Where Were They in 2011-2012?
Movement Out of Charter Schools:For Students in Charter Schools in 2011-2012, Where Were They in 2013-2014?
Grade in 2013-2014
Location in 2011-2012 Grade in 2011-2012
Location in 2013-2014
Traditional DOE Charter Neither Traditional DOE Charter Neither
2 22.4% 70.1% 7.5% K 10.7% 83.0% 6.4%3 14.9% 81.8% 3.3% 1 10.5% 82.8% 6.7%4 12.6% 84.5% 2.8% 2 9.6% 83.7% 6.7%5 38.3% 56.3% 5.3% 3 8.9% 84.8% 6.2%6 55.2% 39.0% 5.7% 4 22.6% 70.8% 6.6%7 32.6% 63.9% 3.5% 5 19.7% 73.0% 7.3%8 9.6% 87.8% 2.7% 6 11.6% 82.4% 6.0%9 54.5% 38.4% 7.1% 7 39.4% 51.2% 9.3%10 47.0% 46.5% 6.5% 8 36.3% 54.9% 8.8%11 16.5% 80.5% 3.0% 9 15.2% 74.7% 10.1%12 9.4% 88.5% 2.1% 10 12.0% 74.1% 13.9%
New York City Independent Budget Office
• We look across two years because our data gives us the location of students at the end of the school year. By looking back/forward two years, we capture school changes that occur within a school year.
• In school-level transition grades (5, 6, 7, 9, and 10) significant numbers of students move into charter schools from DOE schools.
• In grades K-3, about 15 percent to 17 percent of charter students leave the charter sector after 2 years. Of those K-3 students who leave charters, a somewhat larger share wind up in traditional DOE schools than leave the city’s public sector entirely,
meaning that they either move out of the city or they enroll in private school.
• After grade 3, a larger share of charter school students leave the charter sector. For every grade except 10, many more of those who leave charters wind up in traditional DOE schools than move out or enroll in private schools.
• Overall, considerable numbers of students attend both charter and DOE schools over the course of their schooling.
Mobility
NYC Independent Budget Office July 2015 13
Demographic Characteristics of Charter School Students

NYC Independent Budget Office July 201514
Student Enrollment by Grade and Gender, 2013-2014DOE Schools Charter Schools Charter Students as
Percent of TotalGrades Number Female Male Number Female Male
K-5 466,213 48.3% 51.7% 45,357 51.2% 48.8% 8.9%6-8 217,747 48.4% 51.6% 15,428 51.0% 49.0% 6.6%9-12 328,937 48.0% 52.0% 11,271 51.2% 48.7% 3.3%Total All Grades 1,012,897 48.2% 51.8% 59,167 51.1% 48.8% 6.6%
New York City Independent Budget Office
• Charter schools enroll a smaller percentage of males and a larger percentage of females than do traditional public schools.
• Charter school students account for 8.9 percent of students in public sector schools in grades K- 5, compared with 6.6 percent and 3.3 percent in grades 6-8 and 9-12, respectively.
• Almost 93 percent of students in charter schools are either black or Hispanic, with black students accounting for more than 57 percent of charter students.
• DOE schools are 67 percent black or Hispanic, with Hispanic students forming the plurality at 41 percent.
• There are few charter high schools, and the distribution of students in charter high schools— with almost equal numbers of black and Hispanic students—is very different from the other grade levels.
• Student eligibility for free or reduced-price meals is determined by reported family income. Eligible students are in families with incomes at or below 185 percent of the poverty level.
• Charter schools had a greater concentration of these lower-income students than traditional DOE schools.
Gender, Race, and Poverty
New York City Independent Budget Office
Hispanic
Black
White
Asian
All Other
Charter 9-12
DOE 9-12
DOE 6-8
Charter 6-8
DOE K-5
Charter K-5
Race/Ethnicity of Students in Charter and Traditional Department of Education Schools, 2013-2014
0% 20% 40% 60% 80% 100%
NYC Independent Budget Office July 2015 15
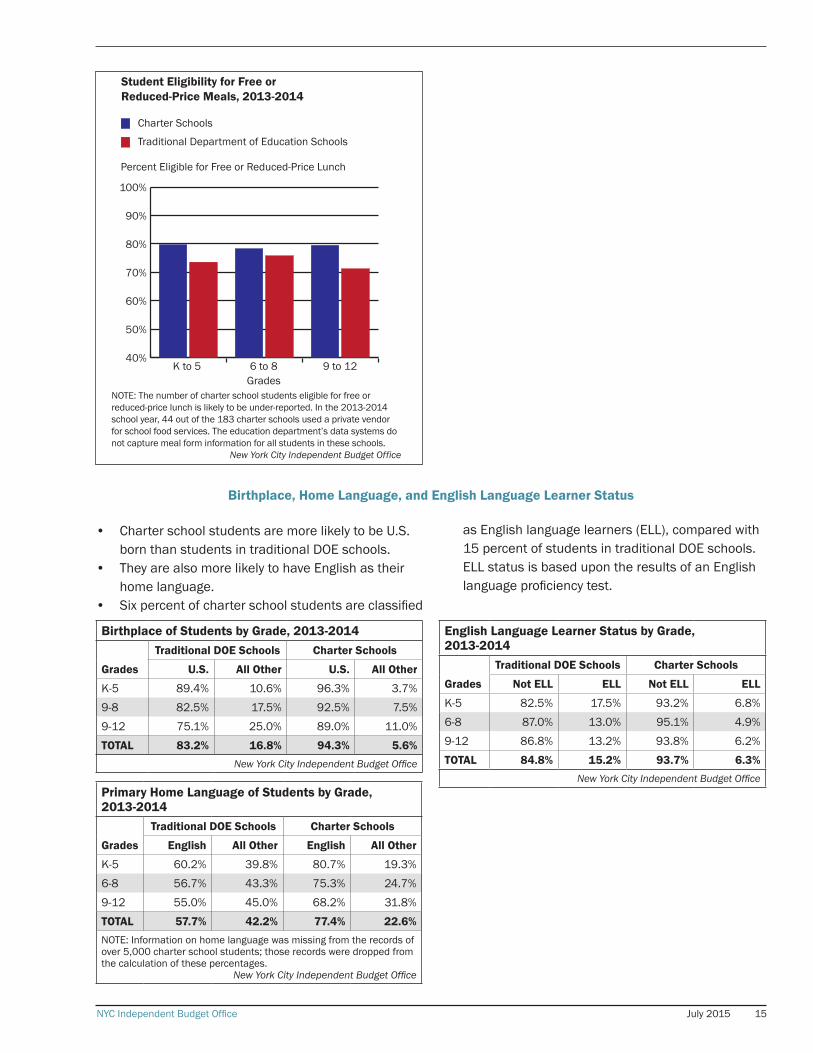
Student Eligibility for Free or Reduced-Price Meals, 2013-2014
Traditional Department of Education Schools
Charter Schools
40%
50%
60%
70%
80%
90%
100%
Percent Eligible for Free or Reduced-Price Lunch
K to 5 6 to 8 9 to 12Grades
NOTE: The number of charter school students eligible for free or reduced-price lunch is likely to be under-reported. In the 2013-2014 school year, 44 out of the 183 charter schools used a private vendor for school food services. The education department’s data systems do not capture meal form information for all students in these schools.
New York City Independent Budget Office
Birthplace, Home Language, and English Language Learner Status
Birthplace of Students by Grade, 2013-2014
Grades
Traditional DOE Schools Charter Schools
U.S. All Other U.S. All Other
K-5 89.4% 10.6% 96.3% 3.7%9-8 82.5% 17.5% 92.5% 7.5%9-12 75.1% 25.0% 89.0% 11.0%TOTAL 83.2% 16.8% 94.3% 5.6%
New York City Independent Budget Office
• Charter school students are more likely to be U.S. born than students in traditional DOE schools.
• They are also more likely to have English as their home language.
• Six percent of charter school students are classified
English Language Learner Status by Grade, 2013-2014
Grades
Traditional DOE Schools Charter Schools
Not ELL ELL Not ELL ELL
K-5 82.5% 17.5% 93.2% 6.8%6-8 87.0% 13.0% 95.1% 4.9%9-12 86.8% 13.2% 93.8% 6.2%TOTAL 84.8% 15.2% 93.7% 6.3%
New York City Independent Budget OfficePrimary Home Language of Students by Grade, 2013-2014
Grades
Traditional DOE Schools Charter Schools
English All Other English All Other
K-5 60.2% 39.8% 80.7% 19.3%6-8 56.7% 43.3% 75.3% 24.7%9-12 55.0% 45.0% 68.2% 31.8%TOTAL 57.7% 42.2% 77.4% 22.6%NOTE: Information on home language was missing from the records of over 5,000 charter school students; those records were dropped from the calculation of these percentages.
New York City Independent Budget Office
as English language learners (ELL), compared with 15 percent of students in traditional DOE schools. ELL status is based upon the results of an English language proficiency test.

NYC Independent Budget Office July 201516
Special Needs Status and Specific Disability Classification, 2012-2013
Incidence of Disability Classification, 2012-2013
Disability Classification
Percent of All Students
Traditional DOE Schools Charter Schools
Learning Disabled 6.8% 3.8%Speech Impaired 5.2% 5.3%Emotionally Disturbed 1.2% 0.4%Other Health Impaired 1.2% 1.0%Other 1.2% 0.2%Autistic 1.0% 0.2%Orthopedically Impaired 0.1% 0.1%Pre-School Disability 0.1% 0.1%None 83.2% 89.1%NOTE: “Other” includes deaf, hard of hearing, multiply handicapped, intellectual disability, visually impaired, and traumatic brain injury.
New York City Independent Budget Office
• Charter elementary and middle schools tended to have a smaller share of students with Individualized Education Plans (IEPs) than traditional DOE elementary schools (based on 2012-2013 data).
• The small number of charter high schools included some specifically designed to serve a high concentration of students with IEPs. Overall, charter high schools had a slightly greater share of students with IEPs than traditional DOE high schools.
• Charters and traditional DOE schools had about the same percentage of students with speech impairments, but students were more likely at traditional DOE schools to be classified as learning disabled, emotionally disturbed, or autistic than at charter schools.
• Almost half of the students classified as autistic were found in two schools, one of which exclusively served these students and another which reserves a portion of its seats for students on the autism spectrum.
Students With Individualized Education Plans by Grade, 2012-2013
GradesTraditional DOE
Schools Charter Schools
K-5 18.1% 12.5%6-8 19.8% 16.3%9-12 16.9% 17.9%TOTAL 18.1% 14.1%NOTE: We do not yet have access to detailed information on students with special needs for the 2013-2014 school year.
New York City Independent Budget Office
Student Age Compared With Their Grade
Student Age Relative to Grade, 2013-2014Traditional DOE Schools Charter Schools
GradeStandard Age
or Below Over AgeStandard Age
or Below Over Age
K-5 87.1% 12.9% 87.3% 12.7%6-8 78.3% 21.8% 78.3% 21.7%9-12 60.1% 39.9% 61.8% 38.2%
New York City Independent Budget Office
• At each level of schooling, the two sectors had similar percentages of students who were over standard age for their grade.

NYC Independent Budget Office July 2015 17
Demographic Characteristics of Students in Network-Affiliated and Independent Charter Schools
Comparison of Students in Charters Affiliated With Networks to Those in Independent Charters,2013-2014Type of Student Independent Network Type of Student Independent Network
Male 49.9% 48.0% Over Age for Grade 19.0% 18.3%Student With IEP 16.9% 14.0% Asian 3.2% 1.3%English Language Learner 8.1% 4.8% Black 47.5% 66.4%Home Language English 71.9% 82.1% Hispanic 42.0% 29.6%Born in U.S. 93.1% 94.8% White 6.2% 1.6%Eligible for Meal Subsidy 79.8% 79.0% Other 1.1% 1.1%
New York City Independent Budget Office
• Schools associated with networks, service providers, or educational management organizations have smaller percentages of males, students with individualized education plans,
and English language learners. They also have a much greater share of black students and fewer Hispanics than independent charter schools.
NYC Independent Budget Office July 201520
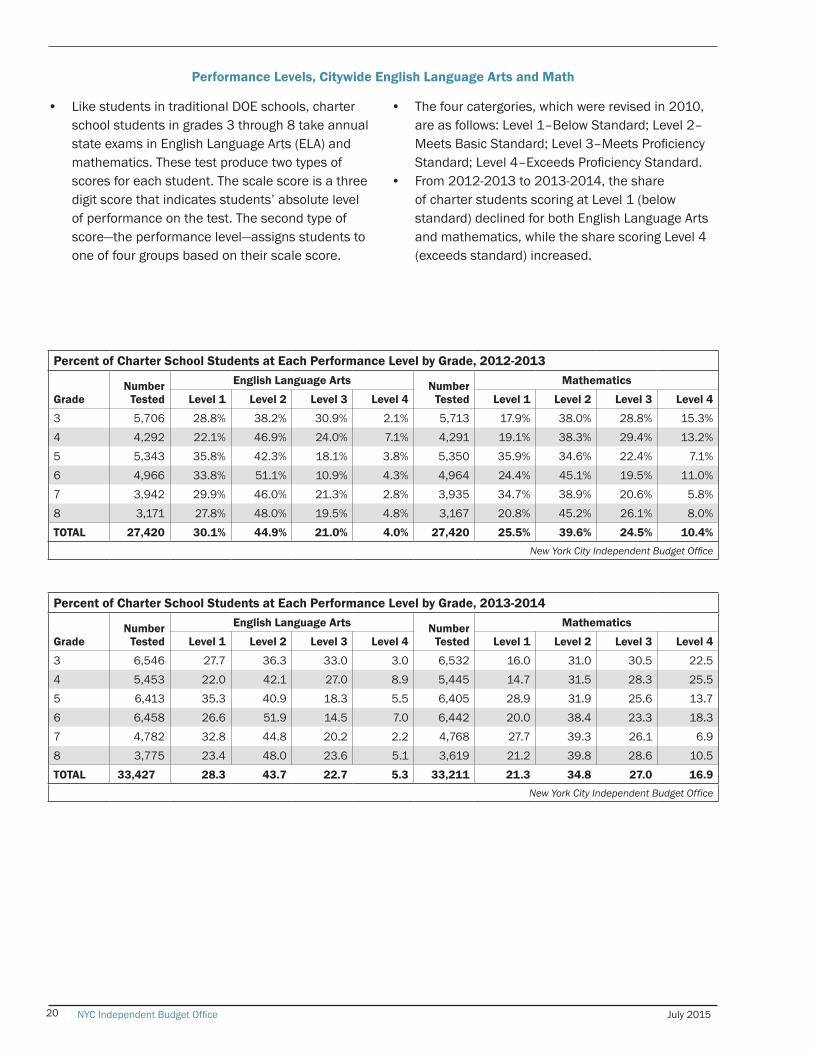
Percent of Charter School Students at Each Performance Level by Grade, 2012-2013
Number Tested
English Language Arts Number Tested
Mathematics
Grade Level 1 Level 2 Level 3 Level 4 Level 1 Level 2 Level 3 Level 4
3 5,706 28.8% 38.2% 30.9% 2.1% 5,713 17.9% 38.0% 28.8% 15.3%4 4,292 22.1% 46.9% 24.0% 7.1% 4,291 19.1% 38.3% 29.4% 13.2%5 5,343 35.8% 42.3% 18.1% 3.8% 5,350 35.9% 34.6% 22.4% 7.1%6 4,966 33.8% 51.1% 10.9% 4.3% 4,964 24.4% 45.1% 19.5% 11.0%7 3,942 29.9% 46.0% 21.3% 2.8% 3,935 34.7% 38.9% 20.6% 5.8%8 3,171 27.8% 48.0% 19.5% 4.8% 3,167 20.8% 45.2% 26.1% 8.0%TOTAL 27,420 30.1% 44.9% 21.0% 4.0% 27,420 25.5% 39.6% 24.5% 10.4%
New York City Independent Budget Office
Performance Levels, Citywide English Language Arts and Math
• Like students in traditional DOE schools, charter school students in grades 3 through 8 take annual state exams in English Language Arts (ELA) and mathematics. These test produce two types of scores for each student. The scale score is a three digit score that indicates students’ absolute level of performance on the test. The second type of score—the performance level—assigns students to one of four groups based on their scale score.
• The four catergories, which were revised in 2010, are as follows: Level 1–Below Standard; Level 2–Meets Basic Standard; Level 3–Meets Proficiency Standard; Level 4–Exceeds Proficiency Standard.
• From 2012-2013 to 2013-2014, the share of charter students scoring at Level 1 (below standard) declined for both English Language Arts and mathematics, while the share scoring Level 4 (exceeds standard) increased.
Percent of Charter School Students at Each Performance Level by Grade, 2013-2014
GradeNumber
Tested
English Language Arts Number Tested
Mathematics
Level 1 Level 2 Level 3 Level 4 Level 1 Level 2 Level 3 Level 4
3 6,546 27.7 36.3 33.0 3.0 6,532 16.0 31.0 30.5 22.54 5,453 22.0 42.1 27.0 8.9 5,445 14.7 31.5 28.3 25.55 6,413 35.3 40.9 18.3 5.5 6,405 28.9 31.9 25.6 13.76 6,458 26.6 51.9 14.5 7.0 6,442 20.0 38.4 23.3 18.37 4,782 32.8 44.8 20.2 2.2 4,768 27.7 39.3 26.1 6.98 3,775 23.4 48.0 23.6 5.1 3,619 21.2 39.8 28.6 10.5TOTAL 33,427 28.3 43.7 22.7 5.3 33,211 21.3 34.8 27.0 16.9
New York City Independent Budget Office

NYC Independent Budget Office July 2015 21
Proficiency by Student Group
Share of Students At or Above Proficiency, by Student GroupAll New York City Charter Schools, 2013-2014
Student GroupEnglish
Language Arts Mathematics
Meal StatusFree or Reduced Price 25.7% 42.3%Full Price 32.9% 47.1%
English Language Learner Status
ELL 3.5% 13.1%Non-ELL 29.0% 45.1%
IEP StatusIEP 9.2% 20.8%Non-IEP 31.6% 48.3%
Race/EthnicityHispanic 25.6% 42.3%Black 27.6% 42.7%White 46.5% 61.4%Asian 44.2% 70.4%Native American 28.8% 48.0%Multiracial 46.5% 57.6%
NOTE: At or above proficiency is defined as Levels 3 and 4.New York City Independent Budget Office
• As is true in traditional public schools, various subgroups of students perform differently. In particular, English language learners and students with IEPs were significantly less likely than other
charter school students to meet or exceed standards for proficiency in English Language Arts and mathematics.

NYC Independent Budget Office July 201522
• The grade configuration of charter schools varies across individual schools and networks. Some of the variation is by design and some is a function of the year-by-year growth of newer schools. For these reasons, we present data on achievement for individual grades. Of the two grades that have students from all networks in 2013-2014, sixth grade had the largest number of students and so we chose
to present results for each network in rank order of sixth grade scores.
• Achievement is presented in terms of median scale scores. The median score is the point which divides all students in that grade and network into equal halves. Half the students have scored above that point and half below. Note that while the scale score can be used to compare results within a grade across various
English Language Arts and Math Achievement by Network Affiliation
English Language Arts Resutls by Network Affiliation, Grades 3-8, 2013-2014
Network
Grade 3 Grade 4 Grade 5
N Median N Median N Median
Success Charter Network 852 324 680 325 381 325Icahn Network 211 311 169 315 140 314Public Preparatory Network 143 307 124 302 125 307Achievement First Network 502 307 354 308 446 302Uncommon Schools 410 320 332 321 942 297Beginning with Children Foundation 47 304 51 302 44 306Victory Education Partners 301 300 242 302 215 299Harlem Village Academy 145 284KIPP Network 181 297 73 299 447 294National Heritage Academies 322 297 318 302 264 297Independent 2,830 300 2,421 302 2,683 297Ascend Learning (SABIS) 346 299 294 305 170 299Democracy Prep Network 60 320 60 311 136 302Explore Schools 240 293 241 292 176 297Kunskapsskolan Education ABLighthouse Academies 101 291 94 292 99 292
Network
Grade 6 Grade 7 Grade 8
N Median N Median N Median
Success Charter Network 259 325 49 325 32 336Icahn Network 127 315 100 309 65 308Public Preparatory Network 53 310 46 310 65 308Achievement First Network 431 306 330 305 305 308Uncommon Schools 578 304 472 305 416 312Beginning with Children Foundation 52 303 36 304 36 302Victory Education Partners 68 299Harlem Village Academy 120 297 148 295 137 299KIPP Network 434 297 317 300 299 303National Heritage Academies 232 297 105 287 112 293Independent 3,281 295 2,453 291 1822 296Ascend Learning (SABIS) 86 293 59 305Democracy Prep Network 518 293 484 298 300 299Explore Schools 118 288 57 291 54 302Kunskapsskolan Education AB 36 287 60 288 70 285Lighthouse Academies 65 283 66 293 62 289
New York City Independent Budget Office

NYC Independent Budget Office July 2015 23
groups—in this case, network affiliations—scale scores cannot be compared across grade levels. For some networks, the median scale score for one grade is lower than that for the previous grade. This does not mean that achievement went down from one grade to the next in that network. The scores only have meaning within their particular grade.
• On both tests, there is a considerable gap between Success Charter Network and the rest of the charter sector. A number of other networks appear near the
top of the charts, particularly Ichan, Achievement First, Public Prep, and Uncommon Schools. The results for the independent charters should be interpreted with caution. Taken as a whole, the independent charters do demonstrate lower test scores than most networks. At the same time, the number of schools and students in independent charters is much greater than any individual network and the overall scores mask variation across individual schools.
Mathematics Results by Network Affiliation, Grades 3-8, 2013-2014
Network
Grade 3 Grade 4 Grade 5
N Median N Median N Median
Success Charter Network 851 344 680 353 381 353Icahn Network 211 320 170 327 140 327Achievement First Network 502 311 354 318 444 316Uncommon Schools 410 333 332 337 939 308KIPP Network 181 314 73 316 446 308Public Preparatory Network 143 314 124 307 126 302Beginning with Children Foundation 46 321 51 313 44 299Explore Schools 240 309 240 310 176 315National Heritage Academies 322 305 317 304 266 306Harlem Village Academies Network 146 294Democracy Prep Network 60 315 60 317 135 310Independent 2,831 307 2,427 311 2,687 308Victory Education Partners 302 304 242 306 219 299Lighthouse Academies 100 295 94 289 99 299Ascend Learning (SABIS) 346 303 294 304 170 295Kunskapsskolan Education AB
Network
Grade 6 Grade 7 Grade 8
N Median N Median N Median
Success Charter Network 258 355 49 349 32 346Icahn Network 127 340 100 321 64 312Achievement First Network 431 322 331 323 304 330Uncommon Schools 578 320 472 323 415 332KIPP Network 431 318 316 314 299 318Public Preparatory Network 53 316 46 334 63 304Beginning with Children Foundation 51 312 36 301 36 304Explore Schools 116 311 57 311 54 312National Heritage Academies 230 310 105 291 80 280Harlem Village Academies Network 120 308 147 317 137 311Democracy Prep Network 514 305 481 312 300 318Independent 3,284 303 2,446 301 1,738 301Victory Education Partners 68 300Lighthouse Academies 64 297 66 296 30 289Ascend Learning (SABIS) 86 294 59 300Kunskapsskolan Education AB 35 286 59 287 70 281
New York City Independent Budget Office

IBONew York City
Independent Budget Office
Ronnie Lowenstein, Director110 William St., 14th Floor • New York, NY 10038Tel. (212) 442-0632 • Fax (212) [email protected] • www.ibo.nyc.ny.usTwitter RSS Facebook [email protected]