Protective processes and resources that promote resilience and wellbeing

Loyola University Chicago Loyola University Chicago
Loyola eCommons Loyola eCommons
Dissertations Theses and Dissertations
2010
School Factors That Promote Academic Resilience in Urban School Factors That Promote Academic Resilience in Urban
Latino High School Students Latino High School Students
Christine Michelle Fallon Loyola University Chicago
Follow this and additional works at: https://ecommons.luc.edu/luc_diss
Part of the Bilingual, Multilingual, and Multicultural Education Commons
Recommended Citation Recommended Citation Fallon, Christine Michelle, "School Factors That Promote Academic Resilience in Urban Latino High School Students" (2010). Dissertations. 122. https://ecommons.luc.edu/luc_diss/122
This Dissertation is brought to you for free and open access by the Theses and Dissertations at Loyola eCommons. It has been accepted for inclusion in Dissertations by an authorized administrator of Loyola eCommons. For more information, please contact [email protected].
This work is licensed under a Creative Commons Attribution-Noncommercial-No Derivative Works 3.0 License. Copyright © 2010 Christine Michelle Fallon

LOYOLA UNIVERSITY CHICAGO
SCHOOL FACTORS THAT PROMOTE ACADEMIC RESILIENCE IN URBAN
LATINO HIGH SCHOOL STUDENTS
A DISSERTATION SUBMITTED TO
THE FACULTY OF THE GRADUATE SCHOOL
IN CANDIDACY FOR THE DEGREE OF
DOCTOR OF PHILOSOPHY
PROGRAM IN SCHOOL PSYCHOLOGY
BY
CHRISTINE M. FALLON
CHICAGO, ILLINOIS
AUGUST 2010

Copyright by Christine M. Fallon, 2010 All rights reserved.

iii
ACKNOWLEDGEMENTS
Many individuals were instrumental in the completion of this dissertation study.
First, I owe a special thanks to my dissertation chair, Dr. David Shriberg, for his
unwavering support and encouragement throughout the entire process, and for providing
me with a structure and making me abide by it. I am also indebted to Dr. Pigott, for her
exceptional advice regarding methodology and statistics, and Dr. Vera, for her support
and constructive feedback.
I would also like to acknowledge how grateful I am for the consistent support and
encouragement of my friends and family. My daughters, Mia and Micki, have inspired
me to endure the challenges associated with balancing work, school, and family, and I
hope they come to believe that they, too, can achieve even their loftiest goals. I would
like to thank my husband James for his support and technical assistance. I have truly
tested his patience throughout this process. I am also forever indebted to the fabulous
women who shared this journey with me: to Anna, I extend my heartfelt thanks for her
warmth and generosity; to Anne, for her wonderful sense of humor; and to Amy, for her
guidance and for always being willing to be my partner in classes. I honestly could not
have endured this demanding process without their ongoing support.
Lastly, I am eternally grateful for the support and cooperation of the
administration, faculty, students, and families of the Noble Network of Schools, without
which this study would not have been possible.

For my husband and my children

v
TABLE OF CONTENTS
ACKNOWLEDGEMENTS iii LIST OF TABLES vii LIST OF FIGURES viii ABSTRACT ix CHAPTER ONE: INTRODUCTION 1 Definition of Terms 8 Purpose of the Study 9 Research Hypotheses 13 Summary 14 CHAPTER TWO: REVIEW OF LITERATURE 16 The Educational Achievement of Latinos in the U.S. 18 Causes of Educational Underachievement in Latinos 28 Resilience 32 Individual Response/Adaptation 33 Risk Factors 34 Protective Factors 35 Academic Resilience 39 School Engagement 45 Fostering Resilience 47 Academic Optimism of Schools 49 Academic Optimism and Academic Resilience 53 CHAPTER THREE: METHODOLOGY 56 Setting 57 Design of the Study 60 Participants 62 Descriptive Analyses 64 Variable Constructs and Measures 66 Description of the Instruments 67 Procedures 75 Data Analysis 80 CHAPTER FOUR: RESULTS 83 Preliminary Analyses 83 Reliability Analysis of the Scales 84 Means and Standard Deviations of the Variables 90 Correlations of the Dependent and Independent Variables 91 Tests of the Research Hypotheses 94
vi
Summary 101 CHAPTER FIVE: DISCUSSION 102 Summary of Research Findings 102 Implications for Schools 106 Limitations of the Study 112 Recommendations for Further Research 114 APPENDIX A: LETTER TO PARENTS IN ENGLISH AND SPANISH 116 APPENDIX B: PARENT CONSENT FORM IN ENGLISH AND SPANISH 121 APPENDIX C: STUDENT ASSENT FORM 128 APPENDIX D: REMINDER NOTICE TO APPEAR IN STUDENT NEWSLETTER 132 APPENDIX E: QUESTIONNAIRE FOR FACULTY 134 APPENDIX F: SCRIPT TO BE READ TO FACULTY 138 APPENDIX G: QUESTIONNAIRE FOR STUDENTS 141 REFERENCES 151 VITA 163

vii
LIST OF TABLES
Table 1: Percentage of 25-29 Year-Olds Having Completed a Bachelor’s Degree or Higher, by Ethnicity 26 Table 2: Student Populations of the Three Charter School Campuses in the Study, Compared to Other CPS Schools and the State 59 Table 3: Student Gender by Campus 65 Table 4: Student Grade Level by Campus 66 Table 5: Variable Constructs and Measures 66 Table 6: Means and Standard Deviations for All Variables 91 Table 7: Correlations between Independent and Dependent Variables 94 Table 8: Mean Academic Optimism Scores by Campus 95 Table 9: Standardized Collective Efficacy, Faculty Trust, and Academic Emphasis Scores by Campus 96 Table 10: Summary of Linear Regression Results 100

viii
LIST OF FIGURES Figure 1: Status Dropout Rates of 16- Through 24-Year-Olds, by Race/Ethnicity: October, 1972 through October, 2005 23 Figure 2: Educational Attainment of the Population 25 Years and Over, by Country of Origin, 2002 27 Figure 3: Level of Risk and Potential Outcome 33 Figure 4: Behavioral School Engagement Items 87
ix
ABSTRACT The purpose of this ex post facto quantitative study was to examine the
relationship between the academic optimism of schools and academic resilience in urban
Latino high school students attending those schools. This study sought to address three
research ideas. First, it was hypothesized that, consistent with previous research, student
achievement is related to the level of academic optimism of schools. A second purpose of
the study was to examine the relationship between academic achievement with academic
resilience for students with multiple risk factors, specifically, Latino students from low
SES backgrounds attending an urban high school. Thirdly, it was hypothesized that
academic optimism works by increasing student engagement, which in turn increases
academic achievement of students. The subjects were 150 low SES Latino high school
students and 47 teachers at three campuses of a charter high school in Chicago. A
measure of academic optimism of the school was obtained from teachers. Measures of
parental involvement, school engagement, overall resiliency, and academic achievement
were obtained from the students. GPA, achievement test scores, attendance, and
discipline records were obtained from school records.
Quantitative data analyses were utilized to examine the relationships between
academic optimism, school engagement, and academic resilience, while controlling for
the influence of family-related and personal protective factors. Significant relationships
were found between academic optimism of schools and academic resilience of students,

x
even when family-related and personal protective factors were controlled for. This study
adds to the growing body of research that suggests that schools can serve as protective
factors for low SES Latino students.
1
CHAPTER ONE
INTRODUCTION
The educational underachievement of Latino students (defined by the U. S.
Census bureau as individuals originating from Mexico, Puerto Rico, Cuba, or South
America), has been a topic of concern within the field of education for decades, and is
currently considered by many to be a national crisis. This phenomenon is often referred
to as the racial “achievement gap” in education (Jencks & Phillips, 1998; Noguera &
Wing, 2006; and others). The term “achievement gap” is typically used to describe the
disparity in academic performance between Latino and African American students at the
lower end of the spectrum, and their White peers at the other end of the spectrum. The
disparities in achievement are often attributed to socioeconomic factors. According to a
report by the National Governors’ Association (2005), the achievement gap is “a matter
of race and class.” The report further states, “this is one of the most pressing education-
policy challenges that states currently face.”
The achievement gap can be observed by comparing student performance using a
variety of measures, including standardized test scores, dropout rates, and grade point
averages. Researchers at Columbia University (2005) report that “by the end of 4th grade,
Latino, African American, and low-income students are already two years behind other
students; by 8th grade, three years behind; and by 12th grade, four years behind” (as
measured by the National Assessment of Educational Progress, NAEP). According to the

2
most recent NAEP data, the average scale score obtained by White 17-year old students
on the reading assessment was 293. The average scale score for Latino 17-year old
students on the same assessment was 272 (U. S. Department of Education, 2005a). Not
only does this represent a 21-point gap, 272 is the average reading scale score for White
students in 8th grade.
Furthermore, this is not a recent phenomenon; studies have documented the
existence of this gap for decades. For example, the U. S. Department of Education has
tracked NAEP reading and mathematics scores, by race, since the mid-1970’s. Although
the reading score gap between Latino students and White students decreased slightly
during the 1970’s and 1980’s, a gap of approximately twenty points has existed since
1990. The trend is similar for mathematics scores (U.S. Department of Education, 2008).
Some authors further assert that the gap is widening: “the gap in academic
achievement that we see today is actually worse than it was fifteen years ago”
(Thernstrom & Thernstrom, 2003, p. 1). This has occurred despite the passage of the No
Child Left Behind Act of 2001, which was designed to improve the academic
performance of America’s schools and ensure that all students attain academic success. A
report by the U.S. Department of Education (2007) documents that, on the NAEP,
“achievement gaps between Hispanic and white 17-year olds actually grew wider” in
reading and math between 1999 and 2004 (p. 3). The growing achievement gap means
that many Latino families may face continued underachievement and poverty. Gandara
and Contreras (2009) argue that “the current data …show that the demands of

3
contemporary American society are outpacing the ability of post-immigrant generations
of Latinos to overcome the educational and socioeconomic barriers they confront” (p. 2).
The Latino population is the nation’s second largest ethnic minority group, and is
growing faster than the African-American population. The U.S. Census Bureau (2004)
has projected that by the year 2050, the Latino population will have grown to an
estimated 103 million people and account for 25 percent of the national total,
significantly exceeding the proportions of other ethnic or racial minorities. Therefore,
there is good reason to assume that the Latino population will have an impact on the
United States across several domains; these include the economy, the labor market, social
welfare, healthcare, education, the criminal justice system, and political participation
(Sullivan, 2000).
The educational attainment of Latinos, however, lags far behind other groups of
students. In 1986, one researcher concluded that “by almost any measure, the Latinos are
the most undereducated of any group of Americans” (Arias, 1986, p. 26). Nearly a
quarter of a century later, this statement still rings true. Latinos continue to lag behind
whites, Asians, and African Americans in educational attainment and they have the
highest dropout rate of any ethnic or racial group (U.S. Department of Education, 1999).
The price for dropping out of high school is steep. In addition to lower lifetime
earnings than high school and college graduates, those who drop out of high school are
more likely to be unemployed, receive public assistance, become incarcerated, or to
become single parents (Bridgeland, DiIulio, & Morrison, 2006). On the other hand,
4
success in high school opens the door to future individual achievement and economic
security. Literacy and advanced mathematical skills (i.e., algebra) are necessary
prerequisites for academic success in college. An analysis of White and African-
American adolescents who graduated from high school in the 1970s and 1980s clearly
demonstrates that, regardless of race, those who did well on standardized tests of reading
and math were more likely to graduate from college (U.S. Department of Education,
2001).
There have been a number of theories offered to explain underachievement in
Latino students. One reason that Latino students do not perform as well as other groups in
school may be that they do not receive the necessary academic support (Arias, 1986). The
majority of Latino students attend poor-quality, inner-city urban schools. Schools with a
high population of Latino students are often located in the inner-city, where facilities are
outdated, teacher turnover is high, dropping out is prevalent, and the school has large
numbers of minority students (Arias, 1986). This is true in Chicago, where only 8.8
percent of the total population of students attending Chicago public schools is White,
according to the Illinois State Report Card (2010). Within the Chicago public school
system, 16 high schools were identified as “Latino majority schools” (Valdez & Espino,
2003). Within these schools, 88 percent of the students were low SES (as measured by
eligibility for free or reduced lunch), compared to the district average of 85 percent and
the state average of 37 percent. On the Prairie State Achievement Examination, only 25
percent of the 11th grade students in these schools met or exceeded the state standards in
5
reading and 16 percent met or exceeded the state standards in mathematics. These figures
are 12 and 10 percentage points lower than the district average, respectively.
Two of the schools in the Valdez and Espino (2003) study were the closest
neighborhood high schools to the charter high school campuses that will be the focus of
this study. Therefore, they represent the alternative school choices for many of the
student participants in this study. The only additional admission requirements at the
charter schools in this study are attendance at an open house and completion of a 200-
word essay explaining why the student wishes to attend the school. Students are selected
for enrollment via simple lottery; the names of all students who complete the application
process are included. Therefore, it is assumed that students who attend Noble schools are
not substantially different from those that attend CPS neighborhood schools.
The network of charter schools began with one campus, known as “the original
campus” by the students and faculty. That campus, the only one that was open in 2003,
has a student population that is approximately 85 percent Latino and 85 percent low-
income. In 2003, 40 percent of the students met or exceeded the state standards on the
Prairie State Achievement Examination; this was higher than the district average of 30
percent (Lake & Rainey, 2005; overall scores only, separate reading and math scores not
provided). It appears that these charter schools, using a “rigorous college-prep
curriculum” (p. 17), are able to achieve better academic outcomes for their Latino
students. It was hypothesized that this is because these schools foster academic resilience
within their students.

6
Some Latino students from low SES, urban environments manage to overcome
numerous obstacles and achieve academic success. These students are considered to be
academically resilient; they typically exhibit a sense of self-determination or self-
efficacy, and engage in self-regulated goal-directed behavior. Resilience is generally
conceptualized as an interactive process between individuals and their environments.
Risk factors are those environmental factors that place Latino students at-risk for poor
educational attainment and school failure, and ultimately, dropping out of high school;
some examples include minority status, low SES, coming from a single-parent home,
language difficulties, and a greater probability of being placed in special education and/or
remedial tracks (Ruiz, 2002; Velez & Saenz, 2001).
Protective factors are elements within the individual and the environment that
foster resilience. Studies (e.g., Garmezy, 1991; Rutter, 1987; Werner & Smith, 1982)
indicate that there are three sets of protective factors that seem to enhance resilience:
personal characteristics (e.g., internal locus of control, personal motivation, high self-
esteem), family-related factors (e.g., support from at least one family member), and
external support systems or aspects of the wider social context (e.g., an encouraging
teacher or mentor). Because children and adolescents spend a large percentage of their
day in school, schools can provide numerous protective factors. In fact, some would
argue that schools “may represent one of the most potentially protective environments”
(Doll & Lyon, 1998, p. 356) for students who face multiple risk factors.

7
When students demonstrate academic achievement despite facing numerous
obstacles or risk factors, these students can be viewed as “academically resilient.”
Presumably, Latino students with low SES backgrounds, attending urban high schools
face multiple risk factors that could potentially prevent them from achieving academic
success and ultimately, from graduating from high school. Prior studies have shown that
although students enter high school with varying degrees of resilience related to
individual and family characteristics, schools can and do play a role in fostering the
academic achievement of these students (e.g., Benard, 2004; Rivera & Waxman, 2007;
Wang & Gordon, 1994). In addition, it is possible for educators to have some degree of
control over school-related protective factors, whereas personal and family-related factors
are less malleable (Wang & Gordon, 1994).
Three school-level protective factors that appear to promote academic
achievement have been identified and linked to the construct of academic optimism.
These factors include: teacher efficacy; trust between teachers, families, and students;
and academic emphasis of the school (Hoy, Tarter, & Woolfolk Hoy, 2006). These
authors have found that the academic optimism of a school is positively correlated with
the academic achievement of its students, even when controlling for SES and prior
achievement. In other words, the more academically optimistic a school is, the better the
students perform.
An optimistic classroom has been found to be linked to resilience in students
(Ryff & Singer, 2003). Hoy, Hoy, and Kurz (2008) conclude that “optimism begets

8
optimism, and that teacher academic optimism begets student academic optimism” (p.
831). Given that optimism and a sense of self-efficacy are predictors of academic
resilience, it seems logical that a school climate that demonstrates high levels of
academic optimism would foster academic resilience in students. This seems particularly
likely if the school has a large proportion of students who face multiple risk factors for
academic achievement, as do the charter school campuses in this study. However, this
hypothesis has yet to be studied empirically.
Definition of Terms
Academic emphasis “is the extent to which a school is driven by a quest for
academic excellence—a press for academic achievement. High but achievable academic
goals are set for students; the learning environment is orderly and serious; students are
motivated to work hard; and students respect academic achievement” (Hoy, Tarter, &
Woolfolk Hoy, 2006, p. 427).
Academic optimism is “a general latent concept related to student achievement
after controlling for SES, previous performance, and other demographic variables” (Hoy,
Tarter, & Woolfolk Hoy, 2006, p. 427).
Collective efficacy is “the judgment of teachers that the faculty as a whole can
organize and execute the actions required to have positive effects on students” (Hoy,
Tarter, & Woolfolk Hoy, 2006, p. 434).

9
Faculty trust is “a willingness to be vulnerable to another party based on the
confidence that the party is benevolent, reliable, competent, honest, and open” (Hoy,
Tarter, & Woolfolk Hoy, 2006, p. 428).
School engagement is typically defined as a multidimensional construct, with
three components: behavioral engagement (participation in class and positive school
conduct), emotional or affective engagement (positive and negative reactions to school
and school-related factors), and cognitive engagement (exerting effort to comprehend
challenging material; Fredricks, Blumenfeld, & Paris, 2004).
Purpose of the Study
This quantitative cross-sectional study reflects an attempt to link the research on
Latino underachievement in the U.S., narrowing the racial achievement gap, dropout
prevention, and improving academic resilience. A common denominator among these
threads of research is that one of the proposed methods for reversing the negative trends
is modifying the climate of the school. Proponents call for developing positive school
climates with high expectations for students; building supportive relationships between
teachers, students, and families; and fostering self-efficacy in students. All of these
elements are present in the construct of academic optimism of schools. The purpose of
this study was to examine the relationships between academic optimism of a school,
school engagement, and academic resilience in its students. This study sought to answer
the question, are there school-based protective factors that improve the academic
10
resilience of urban Latino high school students, particularly when those students lack
personal and family-related protective factors?
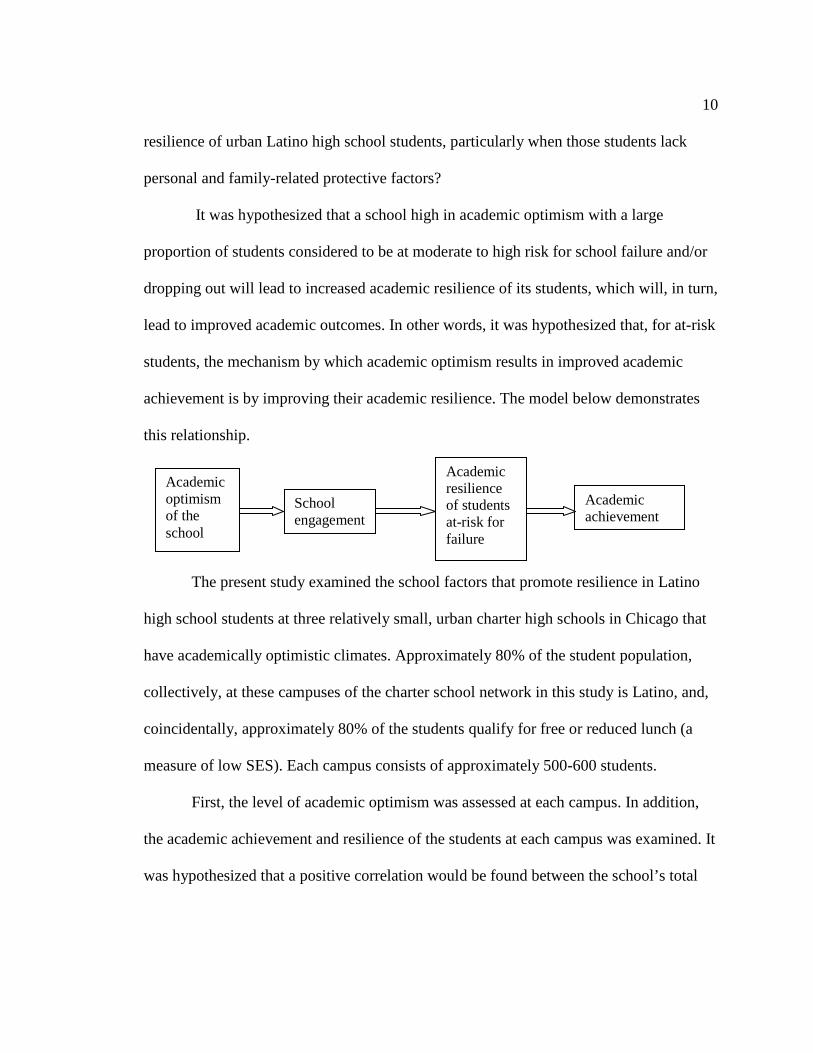
It was hypothesized that a school high in academic optimism with a large
proportion of students considered to be at moderate to high risk for school failure and/or
dropping out will lead to increased academic resilience of its students, which will, in turn,
lead to improved academic outcomes. In other words, it was hypothesized that, for at-risk
students, the mechanism by which academic optimism results in improved academic
achievement is by improving their academic resilience. The model below demonstrates
this relationship.
The present study examined the school factors that promote resilience in Latino
high school students at three relatively small, urban charter high schools in Chicago that
have academically optimistic climates. Approximately 80% of the student population,
collectively, at these campuses of the charter school network in this study is Latino, and,
coincidentally, approximately 80% of the students qualify for free or reduced lunch (a
measure of low SES). Each campus consists of approximately 500-600 students.
First, the level of academic optimism was assessed at each campus. In addition,
the academic achievement and resilience of the students at each campus was examined. It
was hypothesized that a positive correlation would be found between the school’s total
Academic optimism of the school
Academic resilience of students at-risk for failure
Academic achievement
School engagement

11
academic optimism score and mean student scores on measures of academic
achievement. It was further hypothesized that since many Latino, low SES students face
numerous risk factors to academic achievement; the mean student scores for this group
on measures of academic resilience would also be correlated with the school’s total
academic optimism score.
According to Wang and Gordon (1994), students with high personal attributes
such as self-determination, internal motivation, and goal-setting, demonstrate academic
resilience even when they lack family and school supports. Students low in these personal
attributes can be academically successful if their families and/or schools are supportive.
These authors also concluded that students with similar personal attributes and family and
school support perform better academically if they live in suburban or rural communities
than in urban communities. One possible explanation for this last point may have to do
with the added risks associated with urban living, such as higher crime rates and greater
mobility.
These findings were central to the construction of this study. Academic resilience
is conceptualized in this study as academic achievement despite risk factors associated
with poverty, minority status, and living in an urban environment. Academic resilience
was measured using GPA and standardized test scores in reading and mathematics.
Students were also asked questions regarding their level of affective and behavioral
school engagement and archival data was accessed regarding attendance and disciplinary
problems (two measures of behavioral school engagement).

12
It was hypothesized that some students would demonstrate academic resilience
due to internal factors, such as high self-esteem, optimism, and internal locus of control.
To assess these personal protective factors, students were asked to complete the
Resiliency Scales for Children and Adolescents (RSCA, Price-Embury, 2005), a norm-
referenced questionnaire that assesses self-efficacy, general optimism, adaptability of
problem-solving style, trust of others, access to support, social comfort, assertiveness,
and emotional reactivity. Students who are academically resilient due to internal
protective factors were expected to obtain high scores on the Resource index of the
RSCA and low scores on the Vulnerability index of the RSCA. This study controls for
the influence of personal protective factors in order to determine the extent to which
school factors play a role in improving their academic performance.
In order to control for the influence of family-related protective factors, students
were also asked questions regarding the extent to which their parents are involved in their
education. This was measured using the Parent Involvement Scale (Voelkl, 1996). Data
were also collected regarding family income; students who receive free or reduced lunch
will be considered to be low SES for the purposes of this study. Five main risk factors
will be examined; these include living in a low SES household, being of Latino descent,
living in an urban environment, and lacking individual and family-related protective
factors. All participants in the final data analysis live in an urban environment, are low
SES, and are Latino/a. As described above, each student’s level of personal and family-
related protective factors was also assessed.

13
In this study, GPA was used as one measure of academic resilience because, by
definition, academically resilient students must demonstrate academic success. In
addition, several studies have found that more resilient students report receiving higher
grades than less resilient students (e.g., Tiet & Huzinga, 2002; Waxman, Huang, &
Padron, 1997). However, since resilience is conceptualized as a process that occurs over
time, it is important to compare students across grade levels, in order to determine
whether the school climate has influenced students’ academic achievement over time.
Reading and math Educational Planning and Assessment System (EPAS; EXPLORE,
PLAN, ACT) test scores were also used to determine students’ level of academic
achievement. It was assumed that, controlling for individual and family protective
factors, if individual Latino students’ grades and test scores improve, it is likely due to
protective factors within the school.
Research Hypotheses
This study sought to address three research ideas. First, it was hypothesized that,
consistent with previous research, student achievement at the charter school campuses in
this study is related to the level of academic optimism of the schools. A second purpose
of the study was to examine the possible relationship between academic optimism of
schools and academic resilience of students, with a particular emphasis on a possible
relationship between these two variables for students with multiple risk factors;
specifically, Latino students from low SES backgrounds attending an urban high school.
14
Thirdly, it was hypothesized that academic optimism operates by increasing student
engagement, which, in turn, fosters the academic resilience of students.
Hypothesis 1: Higher levels of academic optimism will be correlated with higher
overall student achievement (as measured by mean test scores and student grade point
averages for the three campuses, compared to the mean test scores and student GPAs of
comparable Chicago Public Schools).
Hypothesis 2: The schools’ academic optimism scores will be related to increased
academic resilience of students over time. That is, students in higher grades (11th and
12th) grades will report higher levels of academic resilience and school engagement than
students in lower (9th and 10th) grades when individual and family protective factors are
controlled for.
Hypothesis 3: Research has shown that students who are more actively engaged in
school achieve better academic outcomes—they earn higher grades and better test scores.
For students with multiple risk factors, academic achievement is a sign of academic
resilience. It is hypothesized that school engagement is a mediating factor; that the
academic optimism of a school works to draw students in, to engage them in a warm and
supportive school climate, and that this, in turn, fosters academic resilience.
Summary
Based on the literature, it is clear that the educational status of Latino youth is a
pressing issue that needs to be addressed. Research suggests that academic resilience is
fostered by particular school practices or climates. This research study is designed to
15
contribute to the research literature on Latino students, education, and academic
resilience by examining the role that academic optimism plays in fostering academic
resilience in low SES, urban Latino high school students.
This dissertation is divided into 5 chapters. Chapter One introduced the statement
of the problem and purpose of the study. Additionally, the conceptual basis of the study
was established. The three research hypotheses were presented. Chapter Two contains
literature and research related to the broad topics related to academic resilience, including
risk and protective factors; factors that contribute to dropping out or failure to remain in
school; an overview of the construct of resilience; and the construct of academic
optimism of schools. Methodology for this study is presented in Chapter Three and
includes the research design, selection of the sample, data collections tasks, and data
analysis procedures. Results of the data analysis are presented in Chapter Four. Chapter
Five provides an in-depth analysis of the relationships between academic optimism,
academic resilience, and school engagement.

16
CHAPTER TWO
REVIEW OF LITERATURE
Academic success in high school opens the door to future individual achievement
and economic security. Advanced reading, writing, and mathematical skills (i.e., algebra)
are necessary prerequisites for academic success in college. One study found that,
regardless of race, high school students who performed well on standardized tests of
reading and math were more likely to graduate from college (U.S. Department of
Education, 2001). Today, a college degree is required in order to obtain a middle-class
income; “the gaps in earning and opportunity between those with college degrees and
those without have widened dramatically” (Gandara & Contreras, 2009, p. 1).
Repeatedly, low SES has been found to be significantly correlated with
educational failure or underachievement (Schoon, et al., 2002). In fact, some studies have
found that most of the variation in student achievement is due to SES (e.g., Alspaugh,
1996; Jencks, 1972), not to characteristics of the school. Living in poverty is a risk factor
that is correlated with a number of other risk factors, which further compounds the
problem; those living in low SES environments are exposed to more family turmoil, less
stimulating home environments, and lower quality schools than children in higher SES
groups (Evans, 2004; Velez & Saenz, 2001). Individuals in higher SES groups have more
educational opportunities, better material circumstances, greater access to financial
17
resources when needed, more positive role models, and more informal networks than do
individuals in lower SES groups (Schoon & Parsons, 2002).
Minority status is another factor related to educational underachievement (Gordon
& Yowell, 1994; Velez & Saenz, 2001), and is highly correlated with low SES,
particularly for Latinos. Latino children and adolescents remain more likely to live in
poverty, with parents who have a lower education level, and in single-parent families
than Whites (Lee, 2004; Therrien & Ramirez, 2000). Compared with other groups, Latino
students disproportionately attend schools with the highest levels of poverty, as measured
by the proportion of students who qualify for a free or reduced price lunch, and are
enrolled in the most highly segregated schools (Orfield & Yun, 1999).
In Chicago, 16 Latino majority schools were identified and analyzed (Valdez &
Espino, 2003). These schools have student populations that are, on average,
approximately 75 percent Latino, 14 percent African American, and 9 percent White.
Eighty-eight percent of the students qualify for free or reduced lunch. The schools are
“overcrowded and consist of mostly low-income and academically at-risk children and
youth with high mobility rates and poor academic achievement” (p. 17). Furthermore,
these authors conclude that student achievement worsens over time; by the time these
students reach high school, 76 to 84 percent of students do not meet the Illinois state
standards in reading and mathematics.
In addition to poverty and minority status, other potential obstacles to academic
success for Latino students include: a mismatch between cultural values and values and
18
practices commonly found in schools in the United States (LaRoche & Shriberg, 2004),
being raised in a single-parent household (U.S. Census Bureau, 2001; Velez & Saenz,
2001), discrimination, and poor English proficiency (Gonzalez & Padilla, 1997). Velez
and Saenz (2001) argue that “Latino students from working-class backgrounds and those
whose parents do not speak English are at a particular disadvantage because they may
lack a parental advocate” at school (p. 455). Schools that serve children of poverty may
also contribute to educational underachievement by failing to provide supportive school
climates, by institutionalizing low academic expectations, or by delivering inadequate
educational resources (Borman & Overman, 2004). Thus, individual characteristics,
school characteristics, and the interaction between the two may contribute to a specific
student’s risk of academic failure.
The Educational Achievement of Latinos in the U. S.
It is no simple matter to describe the educational experiences of Latinos in the
United States. Latinos are not comprised of one nationality, race, or culture. Suarez-
Orosco (1991) explains that “Mexican Americans, Puerto Rican Americans, Americans
of Cuban descent and Americans of South American origin, as well as the recent
immigrants and refugees from troubled Central American nations, are distinct
populations, face different issues and should be understood as such” (p. 37). However,
individuals of Mexican origin make up 66 percent of all Latinos in the United States,
followed by Puerto Ricans, the next largest subgroup, who account for 9 percent of the
Latino population (Therrien & Ramirez, 2000). Hence, together these two groups alone

19
make up 3/4 of all Latinos living in the U. S. In spite of subgroup differences, Gandara
(2008) argues, the great majority of Latinos in the United States encounter surprisingly
similar educational challenges, as well as many of the same limitations on their
aspirations for a better future. Furthermore, several features distinguish Latinos in the
U.S. from other minority groups; these include a relative lack of English language
proficiency and large numbers of immigrants, a percentage of whom are undocumented
(Espinoza-Herold, 2003).
For Latinos in the U.S., the educational experience is one of “accumulated
disadvantage” (Schneider, Martinez, & Owens, 2006). Many Latino students begin
attending school without the economic and social resources that many other students
receive, and schools are often ill-equipped to compensate for these initial disparities. For
example, attending early childhood programs has been found to have a positive effect on
the school careers of children. Early schooling can reinforce the importance of education
for future job success (Currie & Thomas, 1995). Despite evidence showing the benefits
of preschool attendance, Latino children are the least likely of any racial/ethnic group to
be enrolled in preschool. In 1999, 60 percent of White children who were three years old
attended preschool, whereas only 26 percent of Latino three year-olds attended preschool
(U.S. Department of Education, 2003, p. 23).
Among kindergarteners, a greater percentage of Latino children lack basic reading
skills, compared to White kindergarten students (Gandara, 2008). This may be related to
the finding from the National Household and Education Questionnaire (NHES) from

20
1993 to 1999 that Latino children ages 3 to 5 are less likely to be read to or to visit the
library compared to children from other ethnic groups (U.S. Department of Education,
1999). From this data, it appears that Latino parents engage in fewer literacy activities
than parents from other racial/ethnic backgrounds. However, Latino parents were also
more likely to speak a primary language other than English, have less than a high school
education, and have incomes below the poverty level. Schneider, Martinez, and Owens
(2006) conclude that Latino families who speak English at home “may be more
assimilated into American culture, and specifically into practices that increase school
performance” (p. 182).
For Latinos, initial disadvantages may stem from parents’ immigrant and
socioeconomic status, their lack of knowledge about the U.S. education system, and the
trust they place in the authority and knowledge of teachers. Mexican American
immigrant parents are particularly vulnerable and more likely to defer to teachers and
administrators, rarely questioning their decisions (Bryk & Schneider, 2002). As Latino
students proceed through the schooling system, inadequate school resources and weak
relationships with their teachers continue to undermine their academic success (Gandara,
2008). Initial disadvantages continue to accumulate, resulting in Latinos having the
lowest rates of high school and college degree attainment, which hinders their chances for
stable employment.
Today, most parents and their children agree that a college degree is necessary for
obtaining stable and meaningful work (Schneider & Stevenson, 1999). This attitude is
21
reflected in the educational expectations parents hold for their children and in the
expectations that young people have for themselves (U.S. Department of Education,
1995, p. 88). High educational expectations can be found among all racial and ethnic
groups regardless of their economic and social resources (p. 73). Despite having high
educational expectations, Latinos continue to be among the least educated group in the
United States, as measured by high school dropout rates and highest degree obtained.
Measure 1: Dropout Rates
There are several ways dropout rates are calculated, according to the U.S.
Department of Education (2004b): event dropout rates, status dropout rates, and status
completion rates. The event dropout rate estimates the percentage of both private and
public high school students who left high school between the beginning of one school
year and the beginning of the next without earning a high school diploma or its
equivalent (e.g., a GED). The status dropout rate reports the percentage of individuals in
a given age range who are not in school and have not earned a high school diploma or
equivalency credential, irrespective of when they dropped out. The status completion
rate indicates the percentage of individuals in a given age range who are not in high
school and who have earned a high school diploma or equivalency credential,
irrespective of when the credential was earned. The status dropout and completion rates
focus on an overall age group as opposed to individuals in the U. S. school system, so
they can be used to study general population issues, whereas the event dropout rate is

22
used to track annual changes in the experiences of students (U.S. Department of
Education, 2004b).
In 2001, the national high school status completion rate for Latinos was 64
percent, compared with 92 percent for Whites (U.S. Department of Education, 2004b).
Such low completion rates are typical of urban schools that serve large numbers of
minority students, many of whom come from low-income families. Latino students
remain concentrated in large urban school systems, such as Los Angeles, Chicago, and
New York, where overall graduation rates are less than 60 percent (Schneider, Martinez,
& Owens, 2006). Nearly 40 percent of Latino students in the U.S. attend high schools in
which the graduation rate is less than 60 percent (Balfanz & Letgers, 2004).
While the percentage of 16- to 24-year-old Latinos without a high school diploma
has decreased over the past 30 years, the status dropout rate of Latinos is still more than
double the rate of both Whites and African Americans (see Figure 1). However, Fry
(2003) argues that this status dropout rate is inflated by recent increases in teenage Latino
immigrants who never enroll in U.S. schools. Hirschman (2001) estimated that almost
half of 15- to 17-year-olds of Mexican descent who arrived in the U. S. between 1987 and
1990 did not enroll in school. These numbers are considerable, especially when compared
with the dropout rates of Mexican-Americans born in the United States. In 2001, 43.1
percent of foreign-born Latinos did not complete high school compared with only 15
percent of U.S.-born Latino students (U.S. Department of Education, 2004a). It should be

23
noted, however, that 15 percent is still higher than the dropout rates for Whites and
African Americans.
(U.S. Department of Education, National Center for Education Statistics, 2007) Figure 1. Status Dropout Rates of 16- Through 24-Year-Olds, by Race/Ethnicity:
October, 1972 through October, 2005
Why do so many Latino students drop out? In a longitudinal study of 475
students, Cairns, Cairns, and Neckerman (1989) found that SES was a significant factor
in dropping out. Students from families with incomes in the lowest quintile are 6 times
more likely to drop out of school than students whose family incomes place them in the
top quintile (U. S. Department of Education, 2004b). This may partly explain the high
dropout rates of Latino students, who are more likely to live in poverty. As Velez and
Saenz (2001) point out, poverty is associated with a number of other risk factors,
24
including living in a single-parent household, higher mobility rates (which make it more
difficult for students to develop strong ties to a school community), and the size and
quality of the neighborhood public schools.
An individual’s school experiences have also been found to have a major impact
on the likelihood that he or she will graduate. Poor academic performance is one of the
most consistent predictors of dropout, whether measured through grades, test scores, or
class failures (Battin-Pearson, Newcomb, Abbott, Hill, Catalano, & Hawkins, 2000). In
addition, students who drop out of school are more likely than other students to have
evidenced disruptive behaviors, poor attendance, negative attitudes toward school, and
early school failure, particularly repeating a grade (Velez & Saenz, 2001; Wehlage &
Rutter, 1986). Beginning in first grade, retention at any grade level has been found to
impact the chances that a student will drop out. In addition, retention has a cumulative
effect; multiple retentions dramatically increase the odds that a student will drop out
(Gleason & Dynarski, 2002). In fact, one study found that students who had not failed a
grade had a 7 percent chance of dropping out, whereas students who had failed 3 grades
prior to 7th grade were 100 percent likely to drop out of school (Cairns, Cairns, &
Neckerman, 1989).
It appears that dropping out is the result of a complex and gradual process of
behavioral and affective disengagement from school. Christenson and Thurlow (2004)
note that dropping out is preceded by a series of indicators of withdrawal from school
(i.e., absenteeism) or unsuccessful school experiences (i.e., poor grades, behavioral

25
difficulties, etc.) that often begin in elementary school. Velez and Saenz (2001), in their
analysis of individual, family, and structural factors that influence dropping out of high
school for Latino students, concluded that school factors are crucial to understanding the
dropout process. Not surprisingly, the research on dropout prevention points to
strengthening students’ school engagement (e.g., Finn & Rock, 1997; Voelkl, 1997).
Further, school engagement has been linked to academic achievement and resilience
(Finn & Rock, 1997; Wehlage & Rutter, 1986).
Measure 2: Highest Degree Obtained
The figures regarding highest degree obtained are striking. Latino students are the
least likely group to take college entrance examinations and to apply to college (Fry,
2004). Only 11 percent of Latinos over age 25 have earned a bachelor’s degree or higher
compared with 17 percent of African-Americans, 34 percent of Whites, and 49 percent of
Asian Americans in the same age group (see Table 1, U.S. Census Bureau, 2003). Stated
another way, approximately 1 in 10 Latinos has a college degree, compared to more than
1/3 of White Americans and nearly ½ of all Asians. “Perhaps most distressing, however,”
notes Gandara (2008) “is the fact that no progress has been made in the percentage of
Latinos gaining college degrees over a 20-year period, while other groups have seen
significant increases in degree completion.”
26
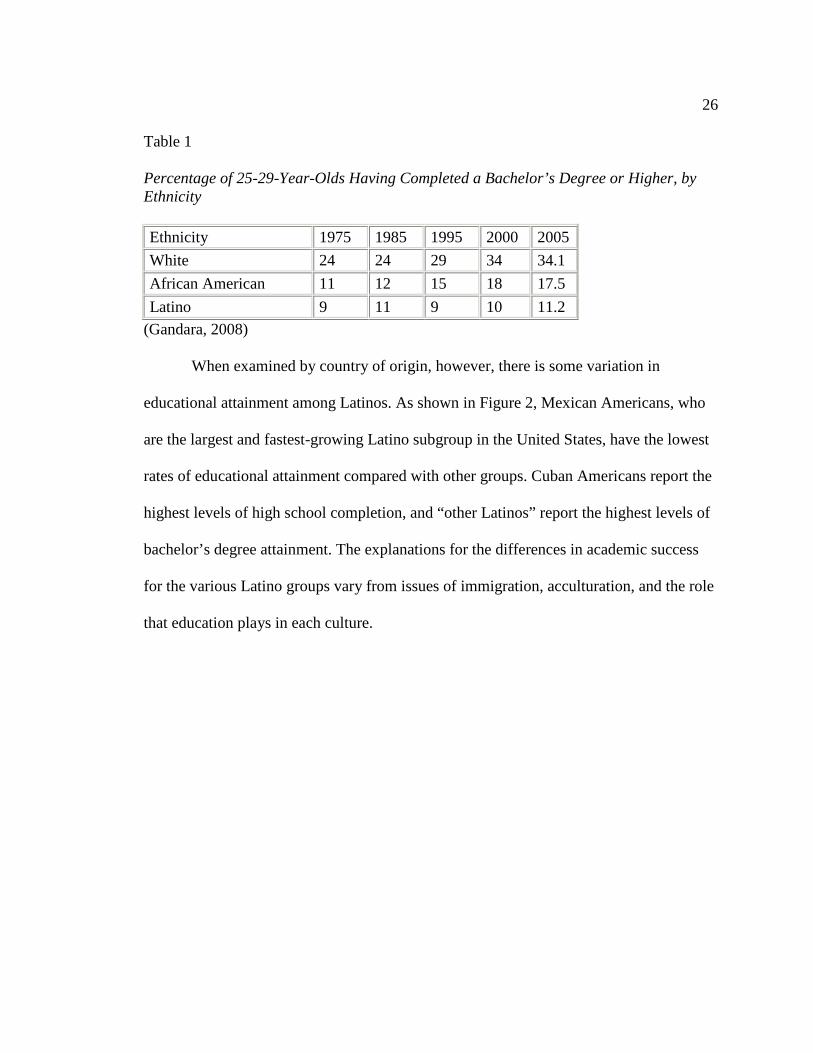
Table 1
Percentage of 25-29-Year-Olds Having Completed a Bachelor’s Degree or Higher, by Ethnicity
Ethnicity 1975 1985 1995 2000 2005
White 24 24 29 34 34.1
African American 11 12 15 18 17.5
Latino 9 11 9 10 11.2
(Gandara, 2008)
When examined by country of origin, however, there is some variation in
educational attainment among Latinos. As shown in Figure 2, Mexican Americans, who
are the largest and fastest-growing Latino subgroup in the United States, have the lowest
rates of educational attainment compared with other groups. Cuban Americans report the
highest levels of high school completion, and “other Latinos” report the highest levels of
bachelor’s degree attainment. The explanations for the differences in academic success
for the various Latino groups vary from issues of immigration, acculturation, and the role
that education plays in each culture.

27
(U.S. Census Bureau, 2002) Figure 2. Educational Attainment of the Population 25 Years and Over by Country of
Origin, 2002
Almost one in five students across the country is Latino; by 2050, one in three
will be (Passel & Cohn, 2008). These students will form the workforce in the immediate
future. Thus, the educational underachievement of Latino students is a crisis not limited
to Latino students and their families. For example, the Center for Public Policy and
Higher Education has projected that if the state of California (with a student population
that is 48 percent Latino) does not immediately begin preparing more underrepresented
students for higher education, by 2020 the state will experience an 11 percent drop in per
capita income, resulting in serious economic hardship for the people of that state. Given
that 41.2 percent of students in Chicago Public Schools are Latino (Chicago Public
Schools, 2009), a similar economic decline could occur in Chicago. As there is no
evidence of an increase in the rate at which Latino students are either graduating from
high school or obtaining college degrees, some authors argue that there is both a regional
and national crisis developing (Gandara, 2008; Thernstrom & Thernstrom, 2003).
28
Causes of Educational Underachievement in Latinos
It is important to examine why the pattern of educational underachievement has
continued for so long. One cause that is often cited is the high numbers of recent
immigrants among Latinos (e.g., Fry, 2003; Thernstrom & Thernstrom, 2003). However,
others disagree. Gandara (2008) argues that the educational crisis for Latinos is not
entirely caused by immigration. She contends that
educational progress for Latinos has for the most part stalled at high school, with virtually no progress made beyond that point. The overwhelming majority of Latino students are native-born. Therefore, the low educational attainment of Latino students is not just the result of large numbers of undereducated immigrants entering the public school system. Rather, it is the result of circumstances encountered by Latino students who were born in this country (p. 3). Language difference is another factor for some Latino students, but may not be as
critical an issue as the quality of education being provided to Latino students in schools
in low SES neighborhoods. One study (Gandara, Rumberger, Maxwell-Jolly, & Callahan,
2003) found that English Language Learners (primarily Latinos) received an inferior
education along seven different dimensions, even when compared to other poor and low-
income students. These included an inferior curriculum, less time to cover academic
material, inferior facilities, being segregated from their peers, and invalid assessment
instruments used to determine their progress. Chief among the educational inequities
suffered are teachers unprepared to address their needs.
Latino students are concentrated in poor-quality, inner-city urban schools.
Schools with a high population of Latino students are often located in the inner-city,
29
where facilities are outdated, teacher turnover is high, dropping out is prevalent, and the
school has large numbers of minority students (Arias, 1986). As a result, Latino students
are more likely to be in schools with inexperienced or noncertified teachers (Lee, 2004;
U.S. Department of Education, 2003). Public and private schools with the highest
percentages of minority and limited-English proficient students are more likely to employ
beginning teachers than schools with lower percentages of minority limited-English
proficient students, thus virtually ensuring that a high proportion of Latino youth, who
arguably most need experienced teachers, are taught by less-qualified instructors. Studies
have found that math teachers in predominantly African American or Latino high schools
are less likely to teach in their field of study and certification than math teachers in
predominantly White schools (Lee, 2004). In addition, African American and Latino
students are less likely than White students to have teachers who emphasize high quality
mathematics instruction and appropriate use of resources (Flores, 2007). Flores further
contends that since the majority (approximately 88 percent) of teachers are White
(Ladson-Billings, 2005), minority students are more likely to have teachers with low
expectations (Delpit, 1992).
These factors contribute to the perpetuation of the achievement gap. Lee (2004)
points out that the racial achievement gap in math scores was narrowing in the 70’s and
80’s, but leveled off or widened in the 1990’s. The achievement gap has traditionally
been measured by comparing test scores (Lee, 2004). One score that is often used is the
National Assessment of Educational Progress (NAEP), often called “the nation’s report

30
card”. Researchers at Columbia University (2005) report that “by the end of 4th grade,
Latino, African American, and low-income students are already two years behind other
students; by 8th grade, three years behind; and by 12th grade, four years behind” (as
measured by the NAEP). According to the most recent NAEP data, the average scale
score obtained by White 17-year old students on the reading assessment was 293. The
average scale score for Latino 17-year old students on the same assessment was 272 (U. S
Department of Education, 2005a). Not only does this represent a 21-point gap, 272 is the
average reading scale score for White students in 8th grade.
The achievement gap can also be measured in terms of adequacy, which refers to
a minimally adequate achievement level. Murnane and Levy (1996) contend that 17-year
olds should score 300 or more on the NAEP reading and mathematics tests in order to
meet the New Basics Skills, the minimum skills needed to get a middle-class job. Using
300 as a minimally adequate level of achievement for high school graduates, African
American and Latino students did make significant progress towards that goal in the
1980’s, but the rate of progress leveled off in the 1990’s. As of 1999, 38 percent of
Latino 17-year olds met that standard, compared to 70 percent of White 17-year olds.
Lee (2004) contends that Latino students are simply not afforded the same
educational opportunities as White students and lack opportunities to take more rigorous
high school courses. For example, Latino students are less likely than White students to
complete advanced mathematics. One study found that 49 percent of Latino students had
taken pre-algebra or algebra in their 8th grade year, compared to 68 percent of White

31
students (Strutchens, Lubienski, McGraw, & Westbrook, 2004). The percentage of Latino
students who have taken Algebra 2 or a higher level course is 64 percent, compared to 72
percent of Whites. The highest level of mathematics course taken correlates with higher
scores on the NAEP math test. Students who had taken Algebra 2 scored an average of
310 points, whereas students who had taken Algebra 1 scored an average of 282 points
(Perie, Moran, & Lutkus, 2005).
It seems clear that the educational underachievement of Latinos cannot be
attributed to a single factor. It is likely due to a complex interplay between social,
economic, and educational conditions—“inadequate social services, families that lack
resources, a polarizing economy with few entry-level jobs that provide a living wage
without a college degree, and schools that lack the resources to meet the educational
needs of Latino students” (Gandara, 2008, p. 2). These findings, taken together, draw a
vivid picture of the Latino experience of education in the U.S. They may also partially
account for the White-Latino achievement gap in reading and mathematics. Flores (2007)
contends that the racial achievement gap needs to be reframed as the “opportunity gap.”
Darling-Hammond (2007) concurs: “outcomes for students of color are much more a
function of their unequal access to key educational resources, including skilled teachers
and a quality curriculum” (p. 320).
The situation of Latino educational attainment is cause for national concern.
Gandara (2008) goes one step further and calls the situation a “crisis.” These findings
have important implications for the long-term success of Latino individuals; without a
32
high school diploma, it is impossible to enroll in college, and it is more difficult to
develop a stable career path. Yet, some Latino high school students manage to graduate
and achieve academic success, demonstrating academic resilience in the face of these
obstacles.
Resilience
Why do some students achieve despite these obstacles? One answer may be that
they are simply more resilient; they are better able to cope with adversity. Developmental
psychologists have long recognized that among groups believed to be at high risk for
developing particular difficulties, many individuals emerge unscathed by adverse
conditions. These individuals are considered to be resilient. However, it is a common
misconception that resilience is a trait that some individuals possess and others do not. In
fact, some early researchers studying resilience in children labeled resilient children
“invulnerable” (e.g., Anthony, 1974), suggesting that certain children could achieve
success and stability regardless of the severity or number of adverse events they faced.
Since then, studies have shown that truly invincible children do not exist. If the level of
adversity experienced is severe enough, even resilient children succumb to negative
outcomes. Furthermore, resilience has come to be understood as a normative process
“that results in most cases from the operation of basic human adaptational systems”
(Masten, 2001, p. 227). Benard (1991) concurs: “the development of human resiliency is
n1 other than the process of healthy human development” (p. 18).

33
Definitions of resilience vary, but resilience can be considered to include a sense
of self-efficacy or self-determination which enables an individual to engage in goal-
directed, self-regulated behavior. It can also be thought of as competence in the face of
significant challenges to achievement or development (Masten & Coatsworth, 1995).
Thus, the construct of resilience consists of two conditions that must be met: the first is
exposure to adversity or risk; the second is positive adaptation to this exposure.
Individuals who achieve positive outcomes but did not need to overcome barriers or
challenges to do so are competent but cannot be considered resilient. The figure below
illustrates the outcomes that can result from the interaction of these two conditions.
Low risk/unfavorable outcome
Competent or protected
High risk/unfavorable outcome
Resilient
NEGATIVE POSITIVE Outcome Figure 3. Level of Risk and Potential Outcome (Tiet & Huizinga, 2002)
Individual Response/Adaptation
Operationally, positive adaptation has been defined in terms of success at meeting
age-appropriate developmental tasks (Luthar, Cicchetti, & Becker, 2000; Masten, 2001;
Masten & Coatsworth, 1998). For example, among school-aged children, competence
might be defined in terms of academic performance and positive peer relationships
(Masten & Coatsworth, 1998). It is equally important that positive adaptation be defined
conceptually in relation to the salient risk factors or domains being examined. For
Level of risk: LOW
HIGH
34
example, when studying resilience in children with depressed parents, it makes sense to
define resiliency in terms of the absence of diagnoses of depressive symptoms.
Competence, on the other hand, “must necessarily be defined across multiple spheres, for
overly narrow definitions can convey a misleading picture of success in the face of
adversity” (Luthar, 2006, p. 743). For example, a child may be well-liked by peers but
perform poorly in school and/or engage in delinquent behaviors.
Risk Factors
Risk factors are negative elements in the individual’s temperament or
environment that increase the likelihood of a negative outcome. Risk is typically defined
in terms of statistical probabilities: a high-risk situation is one that carries with it high
odds for measurable maladjustment in critical domains of functioning (Masten, 2001).
Risk factors that have consistently been found to be significant predictors of later
maladjustment include: childhood poverty, ineffective or uncaring parenting, physical
and/or emotional abuse, and marital conflict or other forms of family dysfunction (Doll &
Lyon, 1998). It is important to note that these factors tend to be chronic, lasting
conditions. In addition to discrete risk factors, researchers have examined the combined
effects of multiple risk factors. Seminal work by Rutter, Maughan, Mortimore, Ouston,
and Smith (1979) demonstrated that risks often coexist, and that the effects tend to be
cumulative, with the resulting outcomes much poorer than when any of the risks exists in
isolation. Multiple risk factors require an accumulation of protective factors or supports
to overcome them.

35
Protective Factors
Protective factors or processes decrease the likelihood of a negative outcome.
Benard (1991) argues that protective factors can also change a negative outcome.
Examples of protective factors include having an internal locus of control or a positive
relationship with at least one adult. Children and adolescents with such attributes
frequently fare better than those without them (Masten, 2001; Rutter, 1987; Werner &
Smith, 1982). Similar to risk factors, it appears that protective factors accumulate to
increase the level or intensity of their protective value for the individual.
According to Masten (2001), the central objective of resilience research is to
identify protective factors that might modify the negative effects of adverse life
circumstances and then to identify the underlying processes or mechanisms within these
interactions. Studies (i.e., Garmezy, 1991; Masten & Coatsworth, 1998; Rutter, 1987;
Werner & Smith, 1982) indicate that there are three sets of protective factors that seem to
enhance resilience: personal characteristics or attributes (e.g., internal locus of control,
personal motivation, high self-esteem), family-related factors or qualities (e.g., support
from at least one family member), and external support systems or aspects of the wider
social context (e.g., an encouraging teacher or mentor). Children who develop
competence in the face of adversity are consistently described as having some
combination of these.

36
Individual Protective Factors
The importance of dispositional attributes of the child has been suggested by
several studies. For example, some investigations have indicated that intellectual ability
offers protective effects (Garmezy, Masten, & Tellegen, 1984; Masten,et al., 1988;
Werner & Smith, 1982). Garmezy et al. (1984) found that, when faced with increasing
levels of stress, children with higher levels of intelligence did not exhibit the level of
deterioration in social competence that was manifested by less intelligent children.
Internal locus of control has also been found to serve a protective function in
children who are resilient (Werner & Smith, 1982). In their seminal longitudinal study of
stress resistance, Werner and Smith found that resilient youngsters reported a high level
of control over their environment, as opposed to believing that their fate is determined
primarily by external factors. The authors identified positive self-concept and internal
locus of control as two protective factors important in counterbalancing the risk
associated with stress. However, in a group of youths that had experienced lower levels
of stress in their lives, these factors did not discriminate between favorable and
unfavorable outcomes.
Rak and Patterson (1996) present a comprehensive profile of the resilient child:
this child demonstrates an active, flexible problem-solving approach, the ability to gain
positive attention from others, an optimistic view of his/her experiences and of life in
general, the ability to be autonomous, a tendency to seek novel experiences, and a
proactive perspective. Similarly, Benard (1991) characterizes resilient children as socially
37
competent, goal-oriented, having a sense of purpose, and being able to foresee a positive
future for themselves. Even as infants, resilient children have been found to be active,
happy, responsive, and easy to interact with (Werner & Smith, 1982).
Family-Related Protective Factors
The family, a key psychosocial environment, has emerged as an influential
variable in many studies of resilience (e.g., Rutter, Maughan, Mortimore, Ouston, &
Smith, 1979; Werner & Smith, 1982). Strong family relationships have consistently been
found to correlate with positive adjustment in the face of adversity. The presence of a
close relationship with at least one competent adult relative appears to be a strong
protective factor.
A key study in the area of resilience is the seminal Kauai Longitudinal Study by
Werner and Smith (1982, 1992). This study was initially designed to isolate the factors
that would predict developmental disabilities among the 698 children born on the island
of Kauai in 1955. The study was subsequently extended to study the impact of factors
such as chronic poverty, low maternal education, parental psychopathology, and perinatal
health complications on the development of mental illness, delinquent behaviors, and
learning disabilities. The cohort was followed for 24 years, with some follow-up
analyses. One-third of those children (201) were considered to be “high risk”, and of the
high risk children, one-third (72) were considered to be resilient. While the accumulation
of risk factors tended to predict later problems for a majority of the sample, by the time
the study participants reached their mid-thirties, almost all had become constructively

38
motivated and responsible adults. A distinguishing factor shared by each resilient child
was a long-term, close relationship with a caring, responsible parent or other adult.
Another seminal longitudinal study of resilience, the Newcastle Thousand Family
Questionnaire (Kolvin, Miller, Fleeting, & Kolvin, 1988), examined the influence of
family risk factors on the emergence of criminal behavior among the entire birth cohort
of Newcastle, England between May 1 and June 30, 1947. The risk factors examined
included marital instability, parental illness, poor care of the children and home, social
dependency, overcrowding, and poor mothering ability. This study found that the
individuals who avoided negative outcomes were more likely to have received effective
and kind parenting.
Rutter, Maughan, Mortimore, Ouston, and Smith (1979) also concluded that a
positive relationship with at least one parental figure, defined in terms of presence of
warmth and absence of criticism, can protect against the risks associated with family
conflict. Only ¼ of the children in troubled families showed signs of conduct disorder if
they had a single good relationship with parents, compared to three quarters of the
children who lacked such a relationship.
Discipline is another aspect of family life that can serve as a protective factor.
Rutter and colleagues (1979) reported that good supervision and well-balanced discipline
might protect a child from a high-risk environment. Similarly, Werner and Smith (1982)
reported that adolescents who were resilient often came from homes where the rules were
consistently enforced.
39
External Protective Factors
The community can be an important source of alternative support and care when
the child’s parents are unable to provide these. Particularly important are aspects of social
organization in the neighborhood (Wilson, 1987), which include high levels of cohesion,
a sense of belonging to the community, and communal supervision of children by the
adults within the community. One study (Gorman-Smith & Tolan, 2003) found that a
sense of belonging and support in the neighborhood can compensate for a lack of warmth
and closeness in the family. Positive relationships with peers can also serve as a
protective factor for at-risk children (Benard, 2004). A positive relationship with a
mentor or teacher can also compensate for a lack of family support (Werner, 1990).
Academic Resilience
Resilience is a multidimensional construct; this is evidenced by the finding that in
many studies, at-risk children demonstrate competence in one or more domains but
exhibit problems in others. For example, a study by Kaufman, Cook, Arny, Jones, &
Pittinsky (1994) found that 2/3 of children with histories of maltreatment were
academically resilient but only 21 percent demonstrated resilience in the domain of social
competence.
The present study will focus on academic resilience, which can be defined as “the
heightened likelihood of success in school and in other life accomplishments, despite
environmental adversities brought about by early traits, conditions, and experiences”

40
(Wang, Haertel, & Walberg, 1994, p. 46). It refers to students’ ability to deal effectively
with setbacks, challenges, and pressure in the school setting over time.
There are several risk factors that may place Latino adolescents at risk for
academic failure; these include: minority status, discrimination, alienating schools,
economic hardship, difficulty understanding the English language, or having parents who
are unfamiliar with the education system in the United States (Gonzalez & Padilla, 1997;
Velez & Saenz, 2001). Borman and Overman (2004) found that among a sample of
students from relatively homogenous low-SES backgrounds, Latino and African-
American students had lower academic self-efficacy than White students and were
exposed to school environments that were less conducive to academic resilience.
It should be noted that academic resilience “can be fostered through interventions
that enhance children’s learning, develop their talents and competencies, and
protect…them against environmental adversities” (Wang, Haertel, & Wahlberg, 1994, p.
4). Researchers have identified protective factors present within the individual students as
well as in the families, schools, and communities of youth who are successful in school
that are often missing in the lives of youth who experience school failure.
Individual Protective Factors Linked to Academic Resilience
Studies indicate that a number of personal characteristics are typically evident
among academically successful students; these are similar to those demonstrated by
children who are resilient in other domains of life. An internal locus of control, optimism,
and a strong sense of self-efficacy are key characteristics exhibited by academically

41
resilient children. Several studies have linked high self-esteem or a strong self-concept
with resilience (e.g., Peng, Lee, Wang, & Wahlberg, 1992). In one study (Gordon, 1996),
the principal difference between resilient and non-resilient students was a strong sense of
self-efficacy. The resilient students excelled academically because they believed that they
could understand the material and information presented in class and that they could do
well on homework and tests. This finding is supported by Martin and Marsh’s (2006)
study of 402 high school students in which they found self-efficacy to be “a significant
predictor of academic resilience” (p. 277). Planning (effective goal-setting) and
persistence in working towards goals were also found to be positively correlated with
academic resilience. Anxiety and fear of failure were found to be negatively linked to
academic resilience.
McMillan and Reed (1994) characterize intrapersonal support as those
“personality characteristics, dispositions, and beliefs that promote academic success
regardless of their background or current circumstances” (p.139). They include six
intrapersonal factors in their resilience model: self-efficacy, goals orientation, personal
responsibility, optimism, internal expectations, and coping ability. Benard (1993)
identified social competence, problem-solving, autonomy, and sense of purpose as the
critical intrapersonal factors in resilience. Greater engagement in academic activities has
also been identified as a characteristic of academically resilient students (Borman &
Overman, 2004). While personal attributes have their place in the overall schema of
academic success, educational resilience should not be considered a product of innate
42
characteristics or a life event, but rather the result of continual interactions between
individuals and their environment (Wang, Haertel, & Walberg, 1994).
Family-Related Protective Factors Linked to Academic Resilience
Wahlberg’s (1984) synthesis of 2,575 empirical studies of academic learning
found that parental influence on their child’s ability to learn was stronger than social and
economic factors such as SES and class size. According to Wahlberg, “the curriculum of
the home predicts academic learning twice as well as the socioeconomic status of
families.” (p. 400) He described the ways in which families promote children’s learning:
informed parent child conversations about daily events; encouragement and discussion of
leisure reading, monitoring and analysis of television viewing; expressions of affection;
interest in children’s academic and personal growth; and delay of immediate gratification
to accomplish long-term goals. High parental expectations (Clark, 1983; Mills, 1990),
and clear rules and behavioral expectations (Benard, 1991) have also been found to
contribute to academic resilience.
Without a secure, supportive relationship with family members, adolescents may
not have the confidence to meet challenges, cope with adversity, and therefore, easily
overwhelmed by scholastic demands (Crosnoe & Elder, 2004). Similarly, Werner (1984)
maintains that strong family ties, parental support, and help in achieving success help at-
risk students to believe that life makes sense and that they have some control over their
own lives. Thus, it appears that a supportive relationship with an adult may help foster a
43
strong sense of self-efficacy; this, in turn, may provide children and adolescents with the
strength and determination to overcome adverse events.
There have been few studies that have examined the effect of race or ethnicity on
the family factors that promote resilience. Gandara (1982) studied 17 Mexican-American
women who had obtained advanced degrees despite coming from low SES backgrounds.
The background factors held in common by these women were strong maternal role
models and supportive families. This planning must occur during adolescence. It is clear
that Latino students are more likely to demonstrate academic resilience when they have
access to strong maternal guidance and supportive relationships with one or more adults.
While schools may have little control over family relationships, protective factors within
schools can compensate for a lack of familial support.
External Protective Factors Linked to Academic Resilience
Researchers have begun to pay attention to how schools may affect students’
academic achievement and resiliency. School environments may provide protective
factors that safeguard students from school failure. A few researchers, such as Benard
(1991), and Wang, Haertel, and Walberg (1995) have devoted considerable attention to
the issue and have formulated models of how schools may foster resiliency in students.
Wang and Gordon (1994) found that, although individuals with strong personal protective
factors are most likely to be academically resilient, supportive families and/or schools
can foster academic resilience, even in students lacking personal protective factors.

44
As a result of this line of research, a set of school characteristics that function as
protective factors has been identified. Consistently, resilience researchers cite the need
for caring and supportive teachers (e.g., Benard, 1991; Wang, Haertel, & Wahlberg,
1994; Werner & Smith, 1982). Pianta and Walsh (1998) argue that schools should work
to foster close relationships between teachers and children and to maintain them as long
as possible: “Every child in every elementary school (and middle and high school) should
have the opportunity to develop a supportive relationship with an adult” (p. 418).
However, many teachers, particularly those working in urban schools, do not
know their students well and lack an empathetic understanding of their situations or the
interpersonal skills to engage them—conditions that are necessary for a trusting
relationship to evolve and be sustained (Bryk & Schneider, 2002). The ability to form
these types of bonds with minority students is particularly difficult for white middle-class
teachers working in urban schools (Buriel, 1983). Teachers may hold negative attitudes
or stereotypes of minority students, which weakens their ability to form bonds with these
students, resulting in decreased school engagement (Valenzuela, 1999). When these
teachers avoid or reject negative attitudes and stereotypes, they are able to offer minority
students the respect and high expectations that facilitate academic success (Payne, 1994).
These findings indicate that success in the classroom depends on students’ ability to
accept their teacher as a credible source of information. Students must believe that the
teacher respects them and cares about their well-being in order to develop a strong,
trusting relationship with him/her. When this bond is not established or fully developed,
45
students resist teachers both personally and academically, become detached from school,
and consequently are less likely to succeed in school.
School Engagement
School engagement may also be a critical factor in students’ academic success.
Finn (1989) argues that students’ sense of a close connection with their schools is a
critical factor in school achievement. Students who identify with their schools have an
internalized sense of belonging; that is, they feel they are a part of the school community
and that school constitutes an important aspect of their own experience. Students who
feel this way are more likely to value and pursue academic or school-relevant goals and
thus are more likely to participate in the classroom. Voelkl (1997) found that school
identification was significantly correlated with achievement test scores. Finn and Rock
(1997) documented significant differences in school engagement among resilient
students, nonresilient students, and students who dropped out. Building strong teacher-
student relationships, using students’ interests to develop curricula and structured
activities, fostering a sense of purpose, and providing alternative programs to meet
individual differences are among factors that help students remain engaged (Finn &
Rock, 1997).
School climate is thus a critical factor in reducing academic failure. Benard
(1991) concludes that a climate of high expectations fosters the internalization of high
expectations by students. Rutter and colleagues (1979) found that schools that were more
successful (those with higher attendance rates and student achievement and lower rates of

46
behavioral problems) shared certain characteristics. These included an academic
emphasis, clear expectations and rules, a high level of student participation, and a variety
of alternative resources (e.g. library facilities, extracurricular activities). A major finding
in his study was that the relationship between the schools’ characteristics and student
behavior increased over time. He concluded that schools that “foster high self-esteem and
promote social and scholastic success reduce the likelihood of emotional and behavioral
disturbance” (p. 83). Providing equal opportunity to learn advanced subject matter
content, maximizing learning time, setting high expectations for all students, and tailoring
instruction to meet the needs of individual students are among school wide practices that
can promote academic resilience (Wang, Haertel, & Wahlberg, 1994).
Caring peers or friends can also serve as protective factors. Clark (1991) found
that academically resilient adolescents developed strong support networks that provided
assistance for success in and out of school by developing friendships and getting support
from school personnel and family. Developing friendships, particularly in racially mixed
schools, is complex. For many Latino students, it is necessary to resolve the negative
perception that academic success is associated with "acting White," (Fordham & Ogbu,
1986). Thus, what schools do to counteract the negative peer culture among minority
students and to foster more positive attitudes in spite of the sub-cultural influences is
extremely important. Interracial friendships are more prevalent when social class and
achievements are equal and when there are "mutual benefits to be gained by both groups"
such as "getting good grades" and "winning sports." Although adolescents prefer to be

47
with peers of the same racial/ethnic groups, teachers and principals can provide specific
tasks in and out of classrooms that require skills and diversity of both racial/ethnic
groups. Winfield (1994) argues that
In most integrated and desegregated schools, where African-American, Latino, Asian, and Native American students are in the minority, these minority students tend not to be involved in the ongoing school culture…ongoing programs that promote interracial/cultural friendships also strengthen prosocial school involvement, reduce alienation on the part of minority students, and reduce negative peer pressure (p. 47). Students who are more actively engaged in school earn higher grades, score
higher on standardized tests of achievement, and show better personal adjustment to
school (Skinner & Belmont, 1993). They are also more resilient (Finn & Rock, 1997). If
schools can strengthen school engagement for Latino students, the increased sense of
school belonging should, in turn, result in increased academic achievement.
Fostering Resilience
It is important to understand the ways in which schools can foster resilience in
students. Beginning in the 1970’s, researchers sought to find answers to this question.
Several studies looked at school factors to explain student achievement. In 1979,
Edmonds developed the effective schools model. This study identified characteristics of
effective schools; these include strong leadership, high expectations for student
achievement, an emphasis on basic skills, an orderly environment, and frequent and
systematic evaluations of students. Purkey and Smith (1983) conducted a review of the
research on effective schools and developed a list of nine factors present in effective
schools. These included: school-site management, instructional leadership, stability of

48
staff, curriculum articulation and organization, school-wide staff development, parental
involvement, school-wide recognition of academic achievement, maximized learning
time, and district support. Attending an effective school is even more important for
students from low SES backgrounds, or with significant challenges; students from high
SES backgrounds are more likely to have access to enrichment experiences at home or in
their communities (Mortimore, Sammons, Stoll, Lewis, & Ecob, 1988). Although several
lists of the characteristics of effective schools have been developed, it is less clear how
schools without these characteristics go about acquiring them.
Rutter (1987) identified four main protective processes or methods that foster
resilience:
1. Reduce negative outcomes by altering the risk or child’s exposure to the risk
2. Reduce negative chain reactions following risk exposure
3. Establish and maintain self-esteem and self-efficacy
4. Open up opportunities to acquire skills and invest in prosocial activities.
Schools can foster resilience through any combination of these four processes (Benard,
1991). For example, schools can reduce negative outcomes by providing free/reduced
meal programs, providing access to school-based health clinics, providing clothing and
other basic needs, and providing links to community resources. Schools can reduce
negative chain reactions following risk exposure by having smaller classes, implementing
programs that encourage teen mothers to come to school, developing mentoring
programs, and offering additional tutoring or counseling. Schools can foster self-esteem

49
and self-efficacy in students by setting up classroom environments so that students can
experience success and feel a sense of control over aspects of their environment. Finally,
schools can provide opportunities for students to acquire skills and engage in prosocial
activities by offering a range of extracurricular activities, mentoring programs, and
tutoring options.
While all of these suggestions make intuitive sense, schools face challenges in
trying to implement these various programs to foster resilience in students. Schools that
lack sufficient resources, such as those located in low SES, inner-city neighborhoods,
may not be able to implement programs like a school-based health center. Schools that
are overcrowded may have difficulty making class sizes smaller. Again, schools that do
not already possess these programs or characteristics may not be able to acquire them.
School climate is a potentially protective factor over which schools can exercise some
control.
Academic Optimism of Schools
Hoy, Tarter, and Woolfolk Hoy (2006) argue that there are three characteristics of
school climate that can influence student achievement when SES and prior academic
achievement are controlled for. These include: academic emphasis, collective efficacy,
and faculty trust. The authors argue that these three factors interrelate to form the
construct of academic optimism. The academic optimism of the school has been found to
correlate with the academic achievement of students (Hoy, Tarter, & Woolfolk Hoy,
2006; Smith & Hoy, 2007).

50
Academic emphasis, collective efficacy, and faculty trust have each separately
been found to be related to student achievement even when controlling for SES. Hoy,
Tarter, and Woolfolk Hoy (2006) define academic optimism as a general construct of
schools, composed of these three variables, with cognitive, affective, and behavioral
dimensions. Collective efficacy is the perception of teachers in a school that the efforts of
the faculty as a whole will have a positive effect on students. It is a belief or expectation,
and is therefore, cognitive. Faculty trust in students and parents is based on the feeling
that the students and their parents are benevolent, reliable, competent, honest, and open
(Hoy & Tschannen-Moran, 2003). It is an affective response. Academic emphasis is a
focus on learning and a press for particular behaviors in schools; it is a behavioral
response. Academic optimism is conceptualized as a triadic set of interactions in which
each of these factors is dependent on the others. The three factors interact to produce a
positive learning environment, and exert a positive influence on student achievement.
There have been few studies exploring this relatively new construct. One study (Hoy,
Tarter & Woolfolk Hoy, 2006) surveyed teachers at 96 high schools and found that
academic optimism had a positive and direct effect on student achievement in math and
science controlling for numerous demographic factors, including SES. Each of the factors
related to the construct of academic optimism will be considered separately.
Academic Emphasis
Academic emphasis is defined as “the extent to which the school is driven by a
quest for academic excellence” (Goddard, Sweetland, & Hoy, 2000; Hoy, Tarter, &

51
Woolfolk Hoy, 2006). In a school with a strong academic emphasis, high but achievable
goals are set for students, the learning environment is orderly and serious, and students
are motivated to work hard and they respect academic achievement (Hoy, Tarter, &
Woolfolk Hoy, 2006). Academic emphasis is one of seven elements of a healthy high
school, according to Hoy and Feldman (1987). A healthy organization or school is
defined as one that “not only survives in its environment, but continues to cope
adequately over the long haul, and continuously develops and extends its surviving and
coping abilities” (Miles, 1969, p. 378). Academic emphasis has examined in isolation and
found to be positively and directly related to student achievement in high schools after
controlling for SES (Hoy, Tarter, & Kottkamp, 1991; Goddard, Sweetland, & Hoy,
2000). Academic emphasis has been reliably measured using a subtest of the
Organizational Health Inventory (Hoy, Tarter, & Woolfolk Hoy, 2006).
Collective Efficacy
Studies have demonstrated the power of positive efficacy judgments in human
learning and achievement (e.g., Bandura, 1997). Teacher efficacy has a demonstrable
effect on student achievement (Ashton & Webb, 1986; Cousins & Walker, 1995; Ross,
1998; Woolfolk & Hoy, 1990). Teachers with high self-efficacy beliefs are more likely
than teachers with low self-efficacy to use adequate teaching methods and classroom
management techniques that encourage students’ autonomy (Cousins & Walker, 1995).
Teacher self-efficacy has been found to be associated with enhanced student motivation
(Ashton & Webb, 1986) and increased student self-efficacy (Ross, 1998).

52
While the concept of efficacy initially focused on the individual, more recent
work has defined this as a collective attribute. Within schools, perceived collective
efficacy is the judgment of the teachers that the faculty as a whole can organize and
execute actions required to have a positive effect on students (Goddard, 2000; Goddard,
Hoy, & Woolfolk, 2000). Bandura (1997) found that schools in which the faculty had a
strong sense of collective efficacy flourished academically whereas schools in which the
faculty had serious doubts about their collective efficacy achieved little progress or
declined over time, even after controlling for SES. He described four factors that
influence self-efficacy: mastery experiences, psychological and emotional states (i.e.,
level of arousal), vicarious experiences (i.e., seeing others succeed at a particular task),
and social persuasion. The findings of a more recent study by Goddard (2000) were
consistent with Bandura’s (1997) findings that collective efficacy is a key factor in
student achievement; he found that collective teacher efficacy is a stronger predictor of
student achievement than students’ SES.
Faculty Trust in Parents and Students
The third component of academic optimism is faculty trust of students and
parents. Faculty trust is defined as “the group’s willingness to be vulnerable to another
party based on the confidence that the latter party is benevolent, reliable, competent,
honest, and open” (Smith & Hoy, 2007). In organizations with high levels of trust,
individuals are comfortable seeking help from each other and learning from their
colleagues (Mascall, Leithwood, Straus, & Sacks, 2008). Effective teachers must be able
53
to form trusting relationships with their students and parents (Hoy, Hoy, & Kurtz, 2008).
Teachers must trust that their students are honest, open to learning, and able to
understand concepts being presented. When they trust their students and parents, teachers
can set higher expectations for learning and can be confident that the parents will support
their efforts. Faculty trust has been found to be an important school component able to
overcome some of the disadvantages of low SES (Hoy & Tschannen-Moran, 2003).
Academic Optimism and Academic Resilience
These three variables (academic emphasis, collective efficacy, and faculty trust)
together form the construct of academic optimism. Academic optimism has been found to
be a valid and reliable construct that correlates positively with academic achievement,
even when SES and prior academic achievement are controlled for. Thus, it does appear
that school factors influence student achievement. However, it less clear how.
In this study, it is hypothesized that increased student achievement results from
school factors that work to make the students more resilient to negative influences in their
environments. Rutter (1987) presented four protective processes that foster resilience:
reducing negative outcomes by altering exposure to the risk; limiting chain reaction
following exposure to risk, establishing and maintaining self-esteem and self-efficacy,
and opening up opportunities. It is hypothesized that academic optimism fosters all of
these processes by increasing school engagement, which in turn, fosters resilience in
students. The process by which this operates may be easier to understand if academic

54
optimism is broken down into its component parts: faculty trust, academic emphasis, and
collective efficacy.
For example, resilience research has shown that having at least one caring and
supportive teacher is a strong protective factor, particularly for minority students in urban
schools (e.g., Bryk & Schneider, 2002; Buriel, 2003). When students trust their teachers,
they feel a sense of belonging and connection to the school, which is necessary for school
success (Finn, 1989). Thus, it makes sense that a school that is high in faculty trust of
students and parents will have students who want to attend school and learn. It is
hypothesized that faculty trust in students and parents helps to create a welcoming school
climate, which fosters school engagement. Increased school engagement, in turn, fosters
academic resilience.
The academic emphasis of a school also fosters academic resilience in its
students. It has been found that holding high expectations for students fosters resilience
(Benard, 1991; Rutter, 1987). In addition, students who have friends who value academic
success are more likely to be academically successful. A school that fosters an
atmosphere of academic emphasis, therefore, is likely to foster the academic resilience of
its students.
Teacher efficacy has been linked repeatedly with student achievement (Ashton &
Webb, 1986; Bandura, 1997; Cousins & Walker, 1995; Ross, 1998; Woolfolk & Hoy,
1990). Teachers with high self-efficacy beliefs are more likely than teachers with low
self-efficacy to use adequate teaching methods and classroom management techniques

55
that encourage students’ autonomy (Cousins & Walker, 1995). Teacher self-efficacy also
correlates positively with students’ motivation and self-efficacy, two factors that increase
school engagement and foster academic resilience.
In the present study, it is hypothesized that, for students with multiple risk factors,
academic optimism operates by increasing school engagement, an important factor in
academic resilience and achievement. This study will analyze three charter schools in
Chicago whose Latino students demonstrate higher academic achievement than the
district average. These schools appear to be academically optimistic schools, given their
mission statements. First, the academic optimism of the schools will be assessed, to
determine whether they truly have academically optimistic climates. Second, the
students’ level of school engagement and academic resilience will be assessed, in order to
determine if, and to what degree, the school climate influences those factors.

56
CHAPTER THREE
METHODOLOGY
This chapter will examine the setting, design, participants, constructs and
measures, procedures, and data analysis of the present study. This study was designed to
investigate the school factors that contribute to academic resilience in urban Latino high
school students. Finn and Rock (1997), in their study of over 1,800 low SES minority
students, found that, for these students, academic resilience is correlated with school
engagement. In this study, it is hypothesized that the school climate, measured by the
level of academic optimism of the school, is related to the academic resilience of the
students. The independent variable in this study is the level of academic optimism of the
school. The dependent variable is academic resilience. It is hypothesized that school
engagement is a mediating factor.
Numerous studies have demonstrated that school success among Latino high
school students cannot be attributed to a single factor (e.g., Gonzalez & Padilla, 1997;
Velez & Saenz, 2001). Rather, academic outcomes are determined by complex processes
involving interactions between factors in the individual, family, and external
environment. The preceding literature review suggests that academic resilience is
fostered by particular home and school practices. School engagement appears to be one
crucial element of academic success for Latino students. Some students enter high school
with personal and family-level protective factors that enable them to be academically

57
resilient. However, schools are only able to exert limited control over the personal and
family characteristics of students; school climate is one arena in which schools exercise
considerable control. Therefore, the focus of this study is on faculty perceptions of the
school climate, in an effort to determine whether the schools are high in academic
optimism. This study examines academic resilience in urban Latino high school students
who lack personal and family protective factors, in order to determine whether there is a
relationship between academic optimism of a school and the academic resilience of its
students. It is hypothesized that academic optimism is associated with increased school
engagement, which, in turn, fosters the development of academic resilience.
Setting
The sample for this study was taken from three charter high schools in Chicago,
Illinois. These schools are all part of a network of charter schools, all employ the same
mission and vision statements, and all serve similar student populations. The
predominantly Latino, low SES students at the charter school campuses in this study have
demonstrated higher academic achievement than their peers in comparable Chicago
Public Schools (CPS) high schools.
Because of the large size and heterogeneity of the Chicago Public Schools, six
CPS schools were chosen for comparison with the charter school campuses in this study.
Three of the schools (CPS 4, 5, and 6) were chosen because they have predominantly
Latino, low SES student populations and were included in the 2003 Valdez and Espino
study of “Latino majority schools.” In the total sample of 16 schools, 88 percent of the
58
students in these schools were found to be low SES (eligible for free or reduced lunch);
within the charter school network that is the focus of this study, 86 percent of the overall
student population is low SES . These schools are also situated in the neighborhoods in
which many of the charter school student participants in this study reside, and thus
represent the alternative school options for these students. The other three schools (CPS
1, 2, and 3) were chosen by entering demographic variables into the interactive Illinois
School Report Card website; they represent all of the schools within CPS that matched
the charter school campuses in this study in terms of the following factors: school type
(high school), number of students (400-1,000), percent Hispanic (greater than 60
percent), and low income (greater than 70 percent). These schools were chosen to control
for the potential effect of school size on student achievement.
According to the school website, greater than 50 percent of students at the charter
school network from which the sample for this study was drawn enter high school with
achievement scores below grade-level. The mission of this network of charter schools is
“to prepare Chicago’s youth to function successfully in society through commitment to
educational excellence, civic responsibility and respect for the community, environment
and people from all walks of life” (Noble Network of Charter Schools, 2009). These
charter schools employ a “rigorous college-prep curriculum that includes a daily
‘advisory class’ that covers study skills, career exploration and college preparation,
conflict resolution and ethical behavior, and physical fitness and nutrition” (Lake &
Rainey, 2005). Additional information regarding these campuses is provided through the
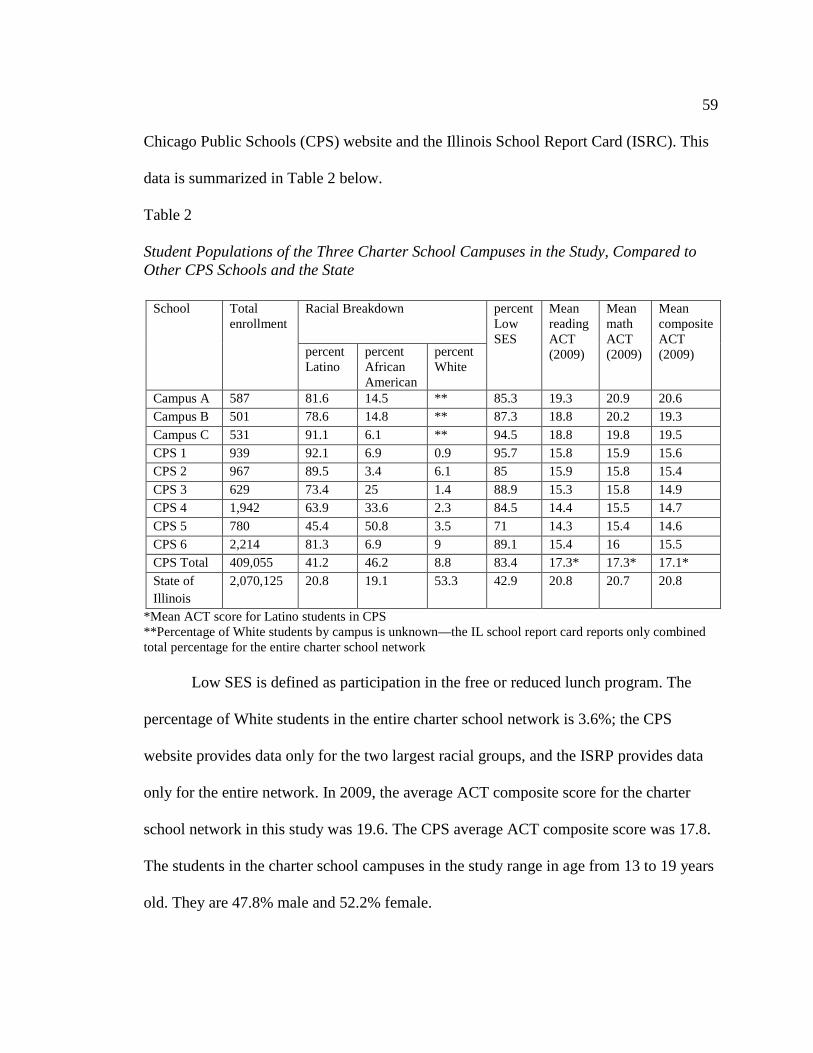
59
Chicago Public Schools (CPS) website and the Illinois School Report Card (ISRC). This
data is summarized in Table 2 below.
Table 2
Student Populations of the Three Charter School Campuses in the Study, Compared to Other CPS Schools and the State
School Total enrollment
Racial Breakdown percent Low SES
Mean reading ACT (2009)
Mean math ACT (2009)
Mean composite ACT (2009) percent
Latino percent African American
percent White
Campus A 587 81.6 14.5 ** 85.3 19.3 20.9 20.6 Campus B 501 78.6 14.8 ** 87.3 18.8 20.2 19.3 Campus C 531 91.1 6.1 ** 94.5 18.8 19.8 19.5 CPS 1 939 92.1 6.9 0.9 95.7 15.8 15.9 15.6 CPS 2 967 89.5 3.4 6.1 85 15.9 15.8 15.4 CPS 3 629 73.4 25 1.4 88.9 15.3 15.8 14.9 CPS 4 1,942 63.9 33.6 2.3 84.5 14.4 15.5 14.7 CPS 5 780 45.4 50.8 3.5 71 14.3 15.4 14.6 CPS 6 2,214 81.3 6.9 9 89.1 15.4 16 15.5 CPS Total 409,055 41.2 46.2 8.8 83.4 17.3* 17.3* 17.1* State of Illinois
2,070,125 20.8 19.1 53.3 42.9 20.8 20.7 20.8
*Mean ACT score for Latino students in CPS **Percentage of White students by campus is unknown—the IL school report card reports only combined total percentage for the entire charter school network
Low SES is defined as participation in the free or reduced lunch program. The
percentage of White students in the entire charter school network is 3.6%; the CPS
website provides data only for the two largest racial groups, and the ISRP provides data
only for the entire network. In 2009, the average ACT composite score for the charter
school network in this study was 19.6. The CPS average ACT composite score was 17.8.
The students in the charter school campuses in the study range in age from 13 to 19 years
old. They are 47.8% male and 52.2% female.
60
It is clear from the data that student achievement, as measured on the ACT, is
higher at the charter school campuses in this study than at comparable CPS schools. It is
hypothesized that this is related to higher levels of academic optimism at these schools.
Design of the Study
This study is a quantitative study utilizing a cross-sectional, between-subjects
design. The central hypothesis is that after controlling for individual and family
protective factors, a significant proportion of the variance in Latino urban high school
students’ academic resilience will be accounted for by the level of academic optimism of
the school. Academic resilience has been described as evidence of successful school
performance and academic motivation despite conditions that place the student at risk of
performing poorly in school (Wang, Haertel, & Wahlberg, 1994). According to these
authors, some students enter school with strong personal protective factors, such as
intelligence or strong social skills; these students demonstrate academic resilience even
when they lack family and school supports. Students low in these personal attributes can
be academically successful if their families and/or schools are supportive. This study
focuses on those students without strong personal and family-related protective factors, in
order to examine the relationship between school-related protective factors and academic
resilience.
This study was designed to test three hypotheses:
Hypothesis 1: Hoy, Tarter, and Woolfolk Hoy (2006) found that academic
optimism of schools is a significant predictor of academic achievement of the students,

61
even when SES and prior achievement are controlled for. It was hypothesized that higher
levels of academic optimism will be correlated with higher overall student achievement
(as measured by mean test scores and student grade point averages for the three
campuses, compared to the mean test scores and student GPAs in the Chicago Public
Schools). This hypothesis can be broken down into two parts:
a. The charter school campuses that are the focus of this study are high in
academic optimism compared to the normative sample of 97 high schools
utilized in the development of the construct of academic optimism (Hoy,
Tarter, & Woolfolk Hoy, 2006).
b. Academic optimism is correlated with student achievement.
Hypothesis 2: The schools’ overall academic optimism score will be related to
increased academic resilience of students over time. That is, students in 11th and 12th
grades will report higher levels of academic resilience and school engagement than
students in 9th and 10th grades when individual and family protective factors are
controlled for. Academic resilience is defined as academic achievement despite numerous
risk factors (Wang, Haertel, & Wahlberg, 1994); therefore, it follows that if students who
face numerous risk factors are academically successful, they can be considered to be
academically resilient.
Hypothesis 3: Research has shown that students who are more actively engaged in
school achieve better academic outcomes—they earn higher grades and better test scores
(e.g., Finn & Rock, 1995; Voelkl, 1997). In addition, school engagement has been found
62
to be a critical factor in preventing dropout (Cairns, Cairns, & Neckerman, 1989;
Wehlage & Rutter, 1986). School engagement has also been linked with academic
resilience (Finn & Rock, 1995). For students with multiple risk factors, academic
achievement is a sign of academic resilience. It is hypothesized that school engagement is
a mediating factor; that the academic optimism of a school works to draw students in, to
engage them in a warm and supportive school climate, and that this, in turn, fosters
academic resilience.
Paper and pencil questionnaires were administered to teachers in order to access
their perceptions of the degree to which the school promotes academic success. This data
was used to determine the level of academic optimism at each school. Student
questionnaires assessed academic achievement, parental involvement, overall resiliency,
and school engagement. Archival data, including the school report card and student grade
point averages, were also used as measures of academic success and school climate.
Participants
Teachers
There are approximately 30 full-time teachers at each of the three campuses of the
charter school network in this study. According to the school report card, the teachers in
the charter school network are approximately 48% White, 15% Latino, 33% African
American, and 5% multicultural or other races. They range in age from 21 to 60 years
old, and approximately 75% are female, 25% are male. The teacher questionnaire was
63
completed and returned by 15 teachers from campus A, 18 teachers from campus B, and
14 teachers from campus C, for a total of 47 teacher participants.
Students
The sample for this dissertation research study was drawn from three campuses of
a charter school network in Chicago. All student participants were enrolled in 9th, 10th,
11th, or 12th grade at one of the three campuses. The student questionnaire was
administered to a total of 172 students at the three campuses (A, B, and C). However, a
small percentage of African American and/or White students chose to complete the
survey (n = 10, 5.8%). Because this study sought to examine the academic resiliency of
Latino students, the responses of other students were not analyzed, resulting in a sample
of 162 Latino students (72 from campus A, 36 from campus B, and 54 from campus C).
A majority of the sample is low SES as measured by whether the student receives
free or reduced lunch. The majority of the sample, 94%, responded “yes” to receiving
free or reduced lunch (n = 150). The eligibility criteria for the school free or reduced
lunch program is based on household size and income, and includes the following sources
of income: wages, earnings, pension, support payments, welfare, unemployment
compensation, social security, and other income. Given that the student sample was
overwhelmingly low SES, the decision was made to exclude students who were not low
SES (did not qualify for free or reduced lunch) from the final data analysis, resulting in a
final student sample of 150 students, all of whom were low SES Latino/a high school
students attending urban high schools.

64
The necessary sample size was determined to be a minimum of 91 participants. A
power analysis was conducted to determine that this number is a sufficient sample size to
provide a test of the study hypotheses for moderate effects and alpha levels of ≤.05 to
judge significance (Green, 1991).
Descriptive Analyses
The student questionnaire included a demographic section in order to capture as
much demographic data as possible, as it relates to the academic resilience of Latino high
school students.
Student Gender by Campus
With respect to gender, the final sample can be considered to be representative of
the overall student population of the three campuses combined. In the final student
sample (N = 150), 47% of participants were male (n = 70) and 53% were female (n = 80).
This is very close to the gender breakdown of the three campuses combined (47.8% male
and 52.2% female). A one-sample t-test was conducted to determine whether the gender
breakdown of the student sample differed from that of the student population of the entire
charter school network; it was not statistically significant. However, chi-square analysis
found significant differences in the student population when analyzed by gender and
campus (χ2 = 22.3, df = 2, p = .000). The distribution of students by gender and campus is
presented in Table 3 on the following page.
At Campus B, the principal had believed that asking parents to sign consent for
the study at report card pick-up would result in greater student participation in the study.

65
However, approximately 6 weeks passed between report card pick-up and the date of the
administration of the student questionnaire. In that time, students, particularly male
students, seemed to lose interest in participating in the study. A number of students
(approximately 20) requested to return to class rather than complete the questionnaire,
resulting in fewer student participants at campus B.
Table 3
Student Gender by Campus
Gender Campus Male (n = 70) Female (n = 80) Total (N = 150)
A 30 39 69
B 6 27 33
C 34 14 48
Student Grade Level by Campus
Ninth graders comprised 39% (n = 59) of the total student sample, 10th graders
comprised 15% (n = 23), 11th graders comprised 26% (n = 40), and 12th graders
comprised 19% (n = 28). The distribution of students by grade level and campus is
presented in Table 4 below.

66
Table 4
Student Grade Level by Campus
Campus
Grade Level
9th grade
(n = 59)
10th grade
(n = 23)
11th grade
(n =40 )
12th grade
(n = 28)
Total
(N = 150)
A 27 14 14 14 69
B 8 3 19 3 33
C 24 6 7 11 48
% 39.3 15.3 26.6 18.7 100%
Variable Constructs and Measures
The variables that constitute this dissertation research study have been
conceptualized from the review of the literature. The theoretical constructs that guide this
study and the instruments used to measure the variables are summarized in Table 5
below.
Table 5
Variable Constructs and Measures
Variable Construct Instrument Demographic data Gender, Noble campus,
SES, grade, race/ethnicity. Student questionnaire
Academic Optimism of Schools
Teachers’ perceptions of the school climate; specifically, academic emphasis of the school, faculty trust of parents and students, and teacher efficacy.
School Academic Optimism Questionnaire (Hoy, Tarter, & Woolfolk Hoy, 2006); Collective Efficacy, Faculty Trust, and Academic Emphasis subscale scores were also calculated.

67
Table 5 (continued) Students’ Personal Protective Factors
Students’ sense of mastery (optimism, self-efficacy, and adaptability), sense of relatedness (trust, access to support, comfort with others, and tolerance of differences), and emotional reactivity (sensitivity, recovery skills, and level of impairment).
Resiliency Scales for Children and Adolescents (Price-Embury, 2006); the Resource t-score assesses the individual’s factors like optimism, self-efficacy, and trust in others; the Vulnerability t-score assesses emotional reactivity and vulnerability to stress.
Students’ Family-Related Protective Factors
Student perceptions of frequency of his/her parents’ interest and participation in homework and school-related activities.
Parent Involvement Questionnaire (Steinberg, Lamborn, Dombusch, & Darling, 1992)
School Engagement Student attitudes towards school and school-related behaviors.
Affective engagement: Identification with School Questionnaire (Voelkl, 1996) Behavioral engagement: attendance and tardiness; items assessing preparation for class, behavioral problems, extracurricular participation, and homework completion
Academic Resilience (independent variable)
Evidence of successful school performance despite the presence of numerous risk factors
GPA, standardized reading and math scores, obtained from school records; presence of risk factors
Description of the Instruments
School Academic Optimism Scale
Teachers were administered the School Academic Optimism Questionnaire
(SAOS; Hoy, Tarter, & Woolfolk Hoy, 2006), a questionnaire that measures academic

68
emphasis of the school, faculty trust of parents and students, and teacher efficacy. The
SAOS was developed by combining the Academic Emphasis Subscale of the
Organizational Health Inventory (Hoy & Miskel, 2005; Hoy & Tarter, 1997), the Short
Form of the Collective Efficacy Scale (Goddard, Hoy, & Woolfolk Hoy, 2000), and the
Faculty Trust in Students and Parents Subscale of the Omnibus Trust Scale (Hoy &
Tschannen-Moran, 2003). This instrument was utilized in previously published research
studies and is included as Appendix E.
Academic Emphasis
The SAOS contains eight items that make up the Academic Emphasis subscale;
these items are scored on a four-point Likert scale ranging from “rarely occurs” to “very
frequently occurs.” Sample items include “Students respect others who get good grades”
and “The school sets high standards for academic performance.” The authors report that
use of this subscale resulted in excellent internal consistency, with an alpha coefficient of
.83. School Academic Emphasis scores were computed and standardized using the
following formula: [100(AE – 21.33)/2.76] + 500. A score of 500 is average, a score of
700 (two standard deviations above the mean) indicates that the school has a higher level
of academic emphasis than 97% of the schools in the sample.
Collective Efficacy
The SAOS also contains the 12-item Short Form of the Collective Efficacy
Subscale (Goddard, Hoy, & Woolfolk Hoy, 2000). Items on this subscale are scored on a
six-point Likert scale ranging from “strongly disagree” (1) to “strongly agree” (6).

69
Sample items include “Teachers here are confident they will be able to motivate their
students” and “These students come to school ready to learn”. The alpha coefficient for
this subscale is .91. A standardized Collective Efficacy score was computed for each
campus using the following formula: [100(mean CE – 4.1201)/.6392] + 500. A score of
500 is average; a score of 700 is two standard deviations above the mean and higher than
97% of schools in the normative sample.
Faculty Trust of Students and Parents
Lastly, the SAOS contains ten items from the Omnibus Trust Scale (Hoy &
Tscahnnen-Moran, 2003) that measure faculty trust of students and parents. These items
are scored on a six-point Likert scale ranging from “strongly disagree” (1) to “strongly
agree” (6). Sample items include “Students in this school can be counted on to do their
work” and “Teachers can count on parental support.” This subscale is also reported to
have excellent internal consistency, with an alpha coefficient of .94. A standard score was
computed for each school using the following formula: [100(mean FT – 3.53)/.621] +
500. A score of 500 is average; a score of 700 is two standard deviations above the mean
and higher than 97% of schools in the normative sample.
Finally, individual teacher scores on each subscale were averaged together,
standardized scores are calculated for each subscale, and a total Academic Optimism
score was calculated for each school using the formula derived by the researchers who
developed the measure (Hoy, Tarter, & Woolfolk Hoy, 2006). Higher scores indicate
greater levels of academic optimism.

70
Resiliency Scales for Children and Adolescents
All three subscales of the Resiliency Scale for Children and Adolescents (RSCA;
Price-Embury, 2006) were administered to the student participants in order to assess their
personal protective factors. The RSCA is a self-report questionnaire with three subscales:
Sense of Mastery, Sense of Relatedness, and Emotional Reactivity. All three subscales
utilize a five-point Likert scale (never, rarely, sometimes, often, almost always). The
Sense of Mastery subscale contains 20 items that are designed to measure optimism, self-
efficacy, and adaptability and includes items such as “I can make good things happen”
and “If I have a problem, I can solve it.” The Sense of Relatedness subscale contains 24
items that are designed to measure trust, access to support, social comfort, and tolerance
of differences. Sample items include “I can make friends easily” and “I can trust others.”
The Emotional Reactivity subscale includes 20 items that measure sensitivity to emotion,
recovery from a strong emotional reaction, and impairment of functioning due to
emotional arousal. Sample items include “When I get upset, I stay upset for about 1 hour”
and “People say that I am easy to upset.” Test-retest reliability coefficients for this
measure range between .87 and .89.
Scores for each subscale were totaled and converted to t-scores using norm tables
according to gender and age. This resulted in the following scores: a Total Mastery Score,
a Total Relatedness Score, and a Total Reactivity score. Resource and Vulnerability
Index scores were also calculated. The Resource Index score is derived from the mean of
the Mastery and Relatedness T scores; higher Resource Index T scores indicate greater

71
levels of mastery and relatedness. The Vulnerability Index is calculated by subtracting
the Resource Index T score from the Reactivity T score. Higher Vulnerability Index T
scores indicate greater vulnerability to stressors. This measure is included in the student
questionnaire in Appendix G.
Parent Involvement in Schooling Scale
Family-related protective factors were assessed as well, using the Parent
Involvement in Schooling scale (PI; Steinberg, Lamborn, Dombusch, & Darling, 1992).
This measure is designed to assess adolescents’ perceptions of the frequency with which
parents are involved in their education along five dimensions: helping with homework,
attending school programs, attending sports or other extracurricular activities, helping the
student select courses, and knowing how the student is doing in school. Participants
indicate the involvement of their mother (or stepmother) and their father (or stepfather)
on a three-point scale (1 = never, 2 = sometimes, 3 = usually). Items were averaged to
calculate a composite involvement score. Cronbach’s alpha for this scale is .74. It is
important to note that one item that pertains to helping the student select courses was
dropped from the scale because, at the charter schools in this study, students follow a pre-
set course outline; there is little opportunity for students and parents to choose courses.
Cronbach’s alpha with that item removed was .72. Higher scores indicate greater levels
of parent involvement, a family-related protective factor. This measure can be found in
the student questionnaire in Appendix G.

72
Academic Resilience
In this study, academic resilience is conceptualized as academic achievement
despite numerous risk factors. These risk factors include living in an urban, low SES
household, being of Latino descent, and lacking individual and/or family-related
protective factors. Risk associated with living in an urban, low SES environment and
being of Latino descent were controlled for by eliminating students without those risk
factors from the final analysis. Academic achievement was measured using GPA and
standardized test scores in reading and mathematics, converted to z-scores. This data was
accessed from archival data at the school. The original proposal specified that reading
and math scores for two years would be gathered; however, this information was not
accessible for all students participants; therefore, only the most recent reading and math
EPAS (EXPLORE, PLAN, or ACT) scores were used in this study. Students with a
combination of low Resource t-scores and high Vulnerability t-scores on the RSCA, low
scores on the PI scale, and high academic achievement scores are considered to be
academically resilient.
School Engagement
Lastly, the student questionnaires include questions designed to assess the extent
to which students are engaged in school. The engagement variables measured in this
study will be taken from Reschly and Christenson’s (2006) study of school engagement.
Several studies (e.g., Archambault, Janosz, Fallu, & Pagani, 2009; Finn & Rock, 1997;
Reschly & Christenson, 2006) have found that school engagement consists of behavioral,

73
affective, and psychological components; however, each of these authors has concluded
that behavioral components account for a significant majority of the variance in the
prediction of dropout and academic resilience.
Behavioral School Engagement
Behavioral engagement has been most commonly defined in three ways: positive
school conduct and the absence of disruptive classroom behaviors; involvement in
learning tasks; and participation in school-related activities (Fredricks, Blumenfeld, &
Paris, 2004). The instruments used to measure behavioral school engagement depend on
the definition used. In this study, behavioral engagement was assessed using the same
variables used in Reschly and Christenson’s (2006) study, with the exception of one.
These include items to assess attendance and tardiness, preparation for class, behavioral
problems, extracurricular participation, and homework completion. Their study included
an item asking students how often they had cut or skipped class; at the charter schools in
this study, cutting or skipping a class rarely occurs because there are a number of school
practices that prevent it, so this item was not included. These items are included in the
student questionnaire in Appendix G.
In this study, archival data from the school’s computerized database
(PowerSchool) was used to determine attendance and tardiness; the information
contained in PowerSchool is likely to be more accurate than students’ self-reporting. In
addition, a second measure of behavioral problems (number of detentions and
suspensions received) was accessed from PowerSchool.

74
Affective School Engagement
For Latino students, however, affective and cognitive engagement, or school
identification, may be a variable worth studying. According to Voelkl (1997), school
identification represents the ties or attachment that may be formed between the student
and the school, including a sense of belonging to the school and valuing school-related
outcomes. Goodenow (1994) suggests that the sense of school belonging and support is a
critical factor in the academic success of many minority students. A study by Ruiz (2002)
found that for Latino middle school students, school identification was the most
significant predictor of academic resilience. School identification was measured by the
Identification with School Questionnaire (ISQ; Voelkl, 1996). This scale is composed of
16 items scored on a four-point Likert scale; responses range from 1 (“strongly disagree”)
to 4 (“strongly agree”). Items include “I feel proud of being part of my school,” “I have
teachers that I can talk to at my school”, and “School is more important than most people
think.” Responses were summed to create a total affective school engagement score. The
coefficient-alpha reliability for the scale is .84. A higher score indicates a higher level of
affective school engagement.
The complete student questionnaire is included in Appendix G. Student data was
collected from Latino/a 9th through 12th graders at each campus, in order to determine
whether mean student resiliency levels increase over time.

75
Procedures
Once IRB approval was granted, the principals of the three charter school
campuses were contacted to schedule the administration dates for the student surveys. A
network administrator was contacted to schedule administration of the teacher
questionnaire.
Teacher Questionnaire
The teacher questionnaire consisted solely of the School Academic Optimism
Survey (SAOS) and one demographic item (What grade do you teach this year?). The
questionnaire was administered at the end of a session during a network-wide employee
meeting in December 2009; teachers were asked to complete the questionnaires prior to
taking their lunch break. A brief explanation of the study was given, and it was
emphasized that participation was voluntary and confidential. No administrators were
present during data collection. All teachers completed the questionnaire in less than ten
minutes.
Since no personal information was requested, consent forms were not required.
The script that was read to the faculty can be found in Appendix F. Teachers were not
asked to write their names or any demographic information on these questionnaires. The
original proposal for this dissertation study specified that only teachers from campuses A,
B, and C would be asked to participate. However, the network administrator who
scheduled the session felt that more teachers from those three campuses would participate
if teachers from all campuses were asked to participate. A box for each of the eleven
76
campuses in the network was placed near the exits for teachers to deposit the
questionnaires inside, in order to keep the questionnaires for each school separate. Only
the questionnaires completed by teachers from campuses A, B, and C were analyzed.
Student Questionnaire
The student questionnaires were administered separately at each campus in
December 2009 and January 2010. The original proposal for this dissertation research
study was to administer the questionnaire to students during their Advisory classes in
order to maintain consistency across the campuses; however, this was not possible due to
individual school schedules. Each school principal scheduled the date and time for the
collection of student data based upon the most convenient time for the school in
consideration of the academic schedule and any planned events; the principals of
campuses A and B scheduled the administration of the student questionnaire during
Advisory, the principal of campus C scheduled it during electives. The class periods
ranged in length of time from 45 minutes to 1 hour.
Each principal also determined the manner in which the informed consent forms
were distributed. The principal at campus B asked the Advisory teachers to obtain
consent from parents during report card pick-up; he thought this would maximize
participation. The other two principals sent the consent forms home with students
attached to their weekly newsletter, as was originally proposed. These consent forms
were sent home approximately 3 to 4 weeks prior to the date of the student data
collection, with due dates scheduled approximately 3 days before the student data

77
collection. A reminder notice appeared in Spanish and English in the school newsletter at
each campus, approximately 1 week prior to the due date. Parents were instructed in the
accompanying letter to return the consent form to their student’s Advisory teacher in the
attached envelope. Advisors were asked to simply turn the envelopes in to the main office
at their campus; an administrative assistant at each campus collected the envelopes. After
the due date, the researcher arranged to pick the consent forms up from the main office of
each campus.
A list of students with parental consent to participate was compiled for each
campus. The list of students was brought to the student data collection session and was
used to take attendance. Any students whose names were not on the list were asked to
return to their scheduled class period, with the exception of 18-year old students who
requested to take the questionnaire and signed their own consent forms. A copy of the list
of student participants was made in the main office so that the principal could check
attendance.
Each student data collection session began with a brief explanation of the research
study and a request to the students for their participation. It was emphasized that their
participation was completely voluntary and anonymous. Any students who did not wish
to participate were escorted back to class by a campus security officer. Students who
chose to take the questionnaire were given an assent form; this was read aloud by the
researcher and students were asked to provide their signature indicating their assent to
participate. On the student assent form, a series of questions were included to protect the

78
confidentiality of participants. Participants were asked to respond to a series of questions
that was used to code their questionnaires in order to maintain confidentiality. The
responses to these questions were also used to tie students’ GPAs to their questionnaire
protocols so that the relationship between attitudes and experiences can be linked to
GPA.
The questions were: What is the last digit of your home (or primary) telephone
number? What is the last letter of your middle name? What is the third letter of the street
on which you live? What is the third letter of your mother’s (or primary guardian’s) first
name? Students were instructed to use the letter “x” for any of the four identity questions
that did not apply to them. For example, students without a middle name were instructed
to write the letter “x” on that line. The responses to these questions were used to create a
four-digit code for each student.
After answering any questions the students had, this researcher read the directions
aloud to ensure that all participants clearly understood what was being asked of them.
Students who turned in a questionnaire, completed or not, were allowed to choose a
Loyola University Chicago lanyard or keychain. On average, students completed the
questionnaire in 15 minutes.
All of the questionnaires were collected by this researcher and kept in a secure
location to ensure confidentiality. Questionnaires and assent forms were kept separately.
School personnel did not have access to any of the completed questionnaires. No names

79
of students, campuses, or any individuals at the campuses will be connected to this
dissertation research study.
Archival Data Collection
After the student and teacher questionnaires had been administered, this
researcher contacted the principal at each campus in order to gain access to PowerSchool,
the computer database in which student information is stored. An appointment was made
with each principal to gather data regarding students’ GPAs, test scores, attendance, and
discipline information. This information is easily accessible using this database but a
password is required for access. At each campus, the principal provided this researcher
with a laptop computer and a desk. Each principal entered his password and completed
work in his office while this researcher accessed the student information on the database.
Prior to each appointment, this researcher created a spreadsheet containing the names of
the students who had completed the survey and whose parent or guardian had provided
consent for the collection of this data. The data was written directly onto the printed
spreadsheet. The spreadsheet was kept in a secure location to ensure confidentiality.
Prior to data analysis, the student assent forms were used to match student names with
their four-digit codes provided on their questionnaires; this was necessary so that
information regarding students’ GPAs, test scores, attendance, and discipline records
could be matched to their questionnaire responses.
80
Data Analysis
This study was a quantitative study examining the relationships among academic
optimism, school engagement, and academic resilience. The questionnaire data was
entered into the Statistical Package for the Social Sciences (SPSS 17.0) by the researcher
to be analyzed. Each student was coded using the four-letter code entered on the first
page of the questionnaire; GPA, test score data, attendance (number of absences and
tardies) and discipline information (number of detentions and suspensions served) was
linked to students using those codes. Data regarding gender, grade in school, was
analyzed to ensure that there are no significant differences among the students from the
three campuses. Race/ethnicity and SES were not analyzed because the final student
sample consisted only of low SES Latino/a students.
A total Academic Optimism score was calculated for each campus. The total
Academic Optimism score was calculated according to the formula derived by the
researchers who developed the questionnaire ([.99 x (Std CE)] + [.92 x (Std FT)] + [.75 x
(Std AE)]; Hoy, Tarter, & Woolfolk Hoy, 2006).
Academic Optimism scores were also calculated by linking teacher data to the
student data. The charter school campuses in this study are relatively small; there is
typically only 1 teacher per subject per grade level; for example, there is 1 ninth grade
teacher who teaches English to all of the ninth graders at each campus. Thus, the teacher
responses to the SAOS were averaged by grade level and campus (using the formula
created by Hoy, Tarter, & Woolfolk Hoy, 2006) and the mean teacher scores for each

81
grade level at each campus were matched to each of the individual students at that grade
level and campus.
Data regarding academic achievement of the student participants at each campus
was accessed from archival data sources and included GPA and standardized test scores.
This data was used to determine whether a relationship exists between the construct of
academic optimism and students’ academic achievement at each campus.
In addition, the student data was analyzed to determine whether a relationship
exists between academic optimism of teachers and students’ academic resilience.
Students can only be considered academically resilient if they achieve academic success
despite an accumulation of risk factors; for the purpose of this study, these include low
SES, being Latino, living in an urban environment, and lacking individual and family-
related protective factors (for a total of five possible risk factors). Individual student
responses on the RSCA and the PI were used to calculate overall scores for individual
and family-related protective factors.
Data was compared across grades, controlling for the presence of risk factors, in
order to determine whether the students’ mean resiliency scores may be increasing over
time. It was hypothesized that if student resiliency scores increase over time, it is due to
the protective factors of the school. Linear regression analyses were conducted in order to
examine the relationships between the academic resilience of the students and academic
optimism of the school, as expressed by the teachers.
82
It was further hypothesized that academic optimism works by increasing school
engagement, and that school engagement may be a mediating factor in increasing
academic resilience. The school engagement measures were analyzed, to determine
whether a correlation exists between academic optimism and school engagement and
between school engagement and academic resilience.
83
CHAPTER FOUR
RESULTS
The research questions were answered by analyzing the data using SPSS 17.0.
Preliminary data analysis procedures were conducted in order to adjust the data for errors,
missing scores, and outliers, and to construct composite scores for school engagement
and academic achievement. Once the demographic data were reviewed, a complete
description of the sample was compiled. After these initial analyses, the scale data were
reviewed and reliability analyses were conducted on these scales. Correlations between
the scales were also conducted. Following the preliminary analyses, regression
techniques were applied to test the null hypotheses and judge the statistical significance
of the statistics.
Preliminary Analyses
Data Verification
The first step of the preliminary analysis was to compute frequency statistics of
all variables in order to check for errors in data entry and to verify missing data.
Distributions were reviewed to check for outliers. The initial student sample size was N =
172; however, it was decided to exclude from the final data analysis students who were
not Latino and/or not from low SES backgrounds because there were not enough of these
students to justify making comparisons across racial and SES groups. This resulted in a
final student sample of N = 150.
84
After reviewing the descriptive data, a composite variable for academic
achievement was computed by converting GPA, reading EPAS score, and math EPAS
score to z-scores and adding them.
Descriptive statistics, found in Table 6, were computed for each of the three
factors of academic optimism (collective teacher efficacy, faculty trust in students, and
academic emphasis), school engagement, and student achievement (GPA, reading, and
math EPAS test scores). This study also controlled for parent involvement and personal
resiliency in an effort to more accurately depict the relationships between academic
optimism, school engagement, and academic resilience. Data was analyzed both at the
school level and the participant level. The mean score for academic optimism for each
campus was calculated using the formula derived by Hoy, Tarter, & Woolfolk Hoy
(2006). Archival school-level data was obtained from the Illinois School Report Card as
well as from school and district websites. Academic achievement for individual students
was calculated by combining their cumulative GPA, and their reading and math score on
the most recent EPAS assessment (Explore, Plan, ACT); this data was accessed from
PowerSchool, the database used at the charter school campuses in this study.
Reliability Analysis of the Scales
Reliability analysis provides information regarding the degree to which items
used to measure a construct are, in fact, measuring the same concept. The internal
reliability of each scale used in this study was calculated. Cronbach’s alpha reliability
coefficients are reported below for each scale.

85
Academic Optimism
Academic optimism was measured using the School Academic Optimism
Questionnaire (SAOS; Hoy, Tarter, & Woolfolk Hoy, 2006), a questionnaire that
measures academic emphasis of the school (AE), faculty trust of parents and students
(FT), and collective teacher efficacy (CE). This instrument was utilized in previously
published research studies and the authors reported alpha coefficients between .83 and
.94 for the three subscales of this measure. For each campus, individual teacher scores on
each subscale were averaged together, standardized scores were calculated for each
subscale, and a total Academic Optimism score was calculated using the formula derived
by the researchers who developed the measure (Hoy, Tarter, & Woolfolk Hoy, 2006).
The formula is as follows: Academic Optimism = [.99 x (Std CE)] + [.92 x (Std FT)] +
[.75 x (Std AE)]. Higher scores indicate greater levels of academic optimism.
School Engagement
School engagement was measured by two separate scales, as recommended in the
literature (Fredricks, Blumenfeld, & Paris, 2004), because engagement is a
multidimensional construct that is not adequately captured in a single scale. Affective
school engagement was measured using the Identification with School Questionnaire
(Voelkl, 1996). This questionnaire assesses the degree to which students experience a
sense of belonging to the school and value school-related outcomes. All items on this
scale were answered using a four-point Likert-scale format (1 = strongly disagree, 2 =
disagree, 3 = agree, 4 = strongly agree). Specific items were reverse-scored and a total

86
score was calculated. The scores ranged from a minimum of 35 to a maximum of 60 (M =
50, SD = 5.36). Cronbach’s alpha for this subscale was .713, indicating a moderate
degree of reliability.
The behavioral school engagement variable was computed using the data from
items that asked student participants about frequency of disruptive behaviors, frequency
of unpreparedness for class, discipline data, and attendance data. Discipline data and
attendance data were accessed from archival data on the school database. All items were
reverse-scored to reflect positive school engagement (characterized by a lack of
disruptive behaviors and discipline/attendance problems). The original instrument
included 13 items; however, the reliability coefficient (Cronbach’s alpha) was only .52.
After removal of five of the items, Cronbach’s alpha for the final Behavioral Engagement
variable was .74. The final items included in the Behavioral Engagement variable, as well
as the items that were removed from the scale, are described in Figure 4 on the following
page. The behavioral school engagement score is the sum total of the variables. Scores
ranged from 19 to 60, with a mean of 51.1 and standard deviation of 6.6.

87
________________________________________________________________________
1. How often do you come to class and find yourself without these things: (never, seldom, often, usually; measures lack of preparation for class)
a. Pencil/pen or paper b. Books c. Your homework done
2. Last school year, how often did the following events occur? (never,
once or twice, more than twice; measures discipline problems) a. I was sent to the office because I was misbehaving. b. My parents were contacted about my behavior. c. I got into a fight with another student.
3. Number of detentions this school year (accessed from student
database) 4. Number of absences this school year (accessed from student database)
Removed Items:
5. Have you ever been required to repeat a grade in school?
6. In the following subjects, how much time do you spend on homework each week (Math, Science, English, Social Studies, All Other Subjects)?
7. How many sports or extracurricular (after-school) activities do you
participate in at school?
8. Number of days suspended this school year (accessed from student database
9. Number of tardies this school year (accessed from student database)
_______________________________________________________________________ Figure 4. Behavioral School Engagement Items
A correlation was conducted to determine whether a positive relationship between
affective school engagement and behavioral school engagement exists. There is a

88
medium-sized, positive correlation between the two constructs (Pearson’s r = .343, p =
.000). Affective and behavioral school engagement were measured separately; when
combined into a single scale, internal reliability (Cronbach’s alpha) was .51, which was
not considered to be adequate. This suggests that the two variables measure slightly
different aspects of school engagement. In the final model, only affective school
engagement is used because behavioral engagement, while correlated with affective
engagement, was not strongly correlated with other variables in the study.
Family-Related Protective Factors
Parent involvement in school was conceptualized as a family-related protective
factor. Parent involvement was measured using the Parent Involvement in Schooling
Questionnaire (Steinberg, Lamborn, Dombusch, & Darling, 1992), a student self-report
measure that assesses adolescents’ perceptions of the frequency with which their parents
assist with homework, are aware of how the student is doing in school, help the student
select courses, and are involved in school-related activities. For the purpose of this study,
the item related to course selection was dropped because students at the charter school
campuses in this study do not have much opportunity to choose courses. The response
categories were “never” (1), “sometimes” (2), and “usually” (3). Student participants
were instructed to respond separately for their mother, father, stepmother, and stepfather
as appropriate. A mean parent involvement score was calculated for each student
participant so that participants from single-parent homes would not be penalized. The
scores ranged from 1.0 to 2.83, with a mean of 1.96 and a standard deviation of .40. The

89
reliability coefficient (Cronbach’s alpha) was .72. This indicates a moderate level of
reliability.
Personal Protective Factors
Some individuals are innately more resilient; they possess personal characteristics
that serve as protective factors. The Resiliency Scales for Children and Adolescents
(RSCA) is a self-report questionnaire designed to assess “the types of personal attributes
that generally allow some youth to do better than others in the face of adversity” (p. 3).
The RSCA consists of three subscales: Sense of Mastery, Sense of Relatedness, and
Emotional Reactivity. All three subscales utilize a five-point Likert scale (never, rarely,
sometimes, often, almost always). The Sense of Mastery subscale contains 20 items that
are designed to measure optimism, self-efficacy, and adaptability and includes items such
as “I can make good things happen” and “If I have a problem, I can solve it.” The Sense
of Relatedness subscale contains 24 items that are designed to measure trust, access to
support, social comfort, and tolerance of differences. Sample items include “I can make
friends easily” and “I can trust others.” Finally, the Emotional Reactivity subscale
includes 20 items that measure sensitivity to emotion, recovery from a strong emotional
reaction, and impairment of functioning due to emotional arousal. Sample items include
“When I get upset, I stay upset for about 1 hour” and “People say that I am easy to
upset.”
Subscale raw scores were converted to t-scores using norm tables for age and
gender. T-scores have a mean of 50 and a standard deviation of 10. In addition, a
90
Resource Index score and a Vulnerability Index score were calculated for each student
participant. These scores complement each other; a student with strong personal
protective factors will have a high Resource t-score and a low Vulnerability t-score.
Resource t-scores ranged from 16 to 85 with a mean of 46.42 and standard deviation of
9.57. Vulnerability t-scores ranged from 28 to 87 with a mean of 53.31 and standard
deviation of 10.16. Cronbach’s alpha was .68; this indicates a moderate degree of internal
reliability.
Means and Standard Deviations of Variables
In this study, the independent variable was academic resilience, as measured by
academic achievement; academic resilience was conceptualized as academic achievement
despite the presence of several risk factors. Academic optimism is the independent
variable, and school engagement is a mediating variable in the relationship between
academic optimism and academic resilience. Personal and family-related protective
factors were controlled for in order to determine whether school factors influence
academic resilience. The means and standard deviations for all of the variables in this
study are summarized in Table 6.

91
Table 6
Means and Standard Deviations for All Variables Variable Mean SD Range
Academic Optimism 4.67 .65 2.21-8.46
Affective School Engagement 50 5.36 35 - 60
Parent Involvement 1.96 .40 1 - 2.83
Resource t-score 46.42 9.57 16 - 85
Vulnerability t-score 53.31 10.16 28 - 87
Academic success (GPA + test
scores)
.0024 .82 -1. 83 – 2.47
Correlations between Dependent and Independent Variables
Correlational analyses were applied in order to examine relationships among the
variables of academic optimism, affective and behavioral school engagement, academic
achievement, parental involvement in school (as a family-related protective factor), and
resource and vulnerability t-scores (as indications of personal protective factors).
The first set of analyses examined the relationship between school engagement
and academic achievement. Affective school engagement (as measured by scores on the
School Identification scale) and behavioral school engagement were analyzed separately.
The correlation between affective school engagement and academic achievement was
positive and significant (Pearson’s r = .346, p = .000). These findings suggest that being
engaged in school (valuing school and academic outcomes, following school rules, etc.)
fosters academic achievement. The results also suggest that as a student’s affective
school engagement increases, the student’s grades and test scores increase.

92
Behavioral school engagement and academic achievement were also significantly
positively correlated (Pearson’s r = .19, p = .032), but the relationship was not as strong.
This measure included an item that required students to report the number of times they
had come to class without necessary materials, such as pen/pencil, paper, books, and
completed homework. One possible explanation for the weaker relationship between
behavioral school engagement and academic achievement may be that, at the charter
schools in the study, students lose points in their classes for not bringing their materials
and not being ready to work at the start of class.
The next set of analyses examined the relationships between protective factors
and academic achievement. Family-related and personal protective factors were
examined. In this study, parental involvement in schooling was considered to represent a
family-related protective factor because prior research has shown that parent involvement
in education positively impacts student achievement. A small but statistically significant
positive correlation was found between parental involvement in schooling and academic
achievement (Pearson’s r = .162, p = .043). This finding lends support to studies that
show that, for Latino students, parental involvement in their education enhances their
academic achievement. For example, Hess & D’Amato (1996) found that Mexican-
American students whose parents spent time discussing school issues had higher levels of
academic aspirations than those Mexican-American children whose parents did not.
The relationship between personal protective factors and academic achievement
was stronger. A positive correlation as also found between resource t-scores, a measure

93
of personal protective factors, and academic achievement (Pearson’s r = .182, p = .025).
The relationship between vulnerability t-scores and academic achievement was not
significant. Consistent with prior research (e.g. Gordon, 1996; Martin & Marsh, 2006;
Peng, Lee, Wang, & Wahlberg, 1992), these results suggest that students who enter high
school with personal and/or family-related protective factors are more likely to achieve
academic success than students who lack these protective factors.
Lastly, the relationship between academic optimism and academic achievement
was examined. A statistically significant positive correlation was found between
academic optimism and academic achievement (Pearson’s r = .247, p = .002). This
finding is consistent with previous studies (e.g. Hoy, Tarter, & Woolfolk Hoy, 2006) and
suggests that when academic optimism is high, academic achievement is likely to
increase as well. The correlational findings are summarized in Table 7.

94
Table 7
Correlations between Dependent and Independent Variables
1 2 3 4 5 6 7 1. Affective school
engagement 1.00 .343** .346** .137 .151 .316** −.238**
2. Behavioral school engagement
1.00 .19* .056 .146 .123* −.202*
3. Academic achievement 1.00 .247** .162* .182* −.109
4. Academic optimism 1.00 .256** .011 .032
5. Parent involvement 1.00 .155 −.175
6. Resource T-score 1.00 −.756
7. Vulnerability T-score 1.00
**Correlation is significant at the 0.01 level (2-tailed). *Correlation is significant at the 0.05 level (2-tailed).
Tests of the Research Hypotheses
Hypothesis 1: Higher levels of academic optimism will be correlated with higher
overall student achievement (as measured by mean test scores and student grade point
averages for the three campuses, compared to the mean test scores and student GPAs of
comparable Chicago Public Schools).
Hypothesis 1a: An underlying assumption in this study was that the three Noble
campuses were high in academic optimism. The charter school campuses in this study
scored above the mean on measures of collective efficacy, academic emphasis, faculty
trust of students and parents, and academic optimism.

95
Academic Optimism was measured using the School Academic Optimism Scales
(SAOS; Hoy, Tarter, & Woolfolk Hoy, 2006). The SAOS consists of three subscales:
Collective Efficacy (CE), Faculty Trust in Students and Parents (FT), and Academic
Emphasis (AE). This instrument was administered to a subset of the teachers at each
campus.
First, an overall Academic Optimism score was computed for each school, using
the formula developed by the researchers who developed the measure (Hoy, Tarter, &
Woolfolk Hoy, 2006). The school Academic Optimism scores were calculated by
combining the standardized mean teacher scores on the Collective Efficacy (CE),
Academic Emphasis (AE), and Faculty Trust (FT) subscales, utilizing the formula
provided by the researchers. The Academic Optimism scores for each campus were
compared to the mean score (3.64) found in the normative sample of 96 high schools in
the original study. All three charter school campuses scored above the mean. This data is
presented in Table 8 below.
Table 8
Mean Academic Optimism Scores by Campus
Campus Total Academic Optimism (AO) Score A 5.66 B 4.18 C 4.24
The mean of the three campuses’ Academic Optimism scores was 4.67. A one-sample t-
test was conducted to determine whether the difference between the mean of the three

96
campuses’ scores on the Academic Optimism measure and the mean of the normative
sample is statistically significant. The results indicate that the difference is statistically
significant (t (47) = 10.3, p = 0.000).
Next, standardized scores for each of the three subscales were computed for each
campus and compared to the mean from the normative sample of 96 high schools, in
order to determine whether the charter school campuses in this study are high in these
school characteristics. The standardized scores with a mean of 500 and a standard
deviation of 100 are calculated using the following formulas:
Standard CE = [100(mean CE – 4.1201)/.6392] + 500
Standard FT = [100(mean FT – 3.53)/.621] + 500
Standard AE = [100(total AE – 21.33)/2.76] + 500
Based on these measures, all three campuses are high in Academic Emphasis (at least two
standard deviations above the mean) and relatively high in Faculty Trust, but campuses B
and C are within the average range for Collective Efficacy. This data is presented in
Table 9 below.
Table 9
Standardized Collective Efficacy, Faculty Trust, and Academic Emphasis Scores by Campus Campus Standardized CE score Standardized FT score Standardized AE score A 578.2 664.3 727 B 512.2 573.3 796.7 C 496.9 591.8 802

97
The range of the scores on these measures is as follows:
If the score is 200, it is lower than 99% of the schools.
If the score is 300, it is lower than 97% of the schools.
If the score is 400, it is lower than 84% of the schools.
If the score is 500, it is average.
If the score is 600, it is higher than 84% of the schools.
If the score is 700, it is higher than 97% of the schools.
If the score is 800, it is higher than 99% of the schools.
Hypothesis 1b: Academic optimism is correlated with higher overall student
achievement. The null hypothesis states that there is no effect of academic optimism on
student achievement.
Student academic achievement was calculated by converting each student’s grade
point average (GPA, measured on a 4-point scale), and most recent standardized reading
and math EPAS scores into z-scores and adding them. Academic optimism scores for
teachers by grade level were calculated by averaging individual teachers’ scores on the
faculty trust, academic emphasis, and collective efficacy subscales of the SAOS. Thus,
FT, AE, and CE scores were calculated for each grade level (9th through 12th). An
academic optimism score was calculated for each grade level at each campus, resulting in
twelve AO scores. These scores ranged from 1.46 to 14.77, with a mean of 5.54 and a
standard deviation of 2.22. These scores were matched to students; the schools are small
enough so that every 9th grade teacher teaches all 9th grade students. A small but

98
statistically significant positive correlation was found between academic optimism and
student academic achievement (Pearson’s r = .346, p = .000).
Hypothesis 2: Academic optimism will be related to increased academic resilience
of the students, when personal and family-related protective factors are controlled for.
Academic resilience was defined as academic achievement despite numerous risk
factors. In this study, risk factors included being Latino, living in an urban area, and
being from a low SES household (receiving free and reduced lunch). The first two factors
were controlled for by eliminating subjects who did not meet these criteria from the final
sample. The third factor, living in an urban environment, applies to all student
participants in the sample. In addition, it was hypothesized that some students have
higher levels of family-related and individual protective factors. These factors were
controlled for in order to determine whether school climate has a measurable effect on
academic resilience.
A linear regression was conducted to examine the relationship between academic
optimism and academic achievement, controlling for personal and family-related
protective factors. The results of this analysis indicated that academic optimism
accounted for a statistically significant amount of variability in academic achievement,
Adjusted R2 = .129, F(4,135) = 6.169, p =.000. Thus, academic optimism accounts for
12.9% of the variance in academic resilience of urban, low SES Latino high school
students, after controlling for personal and family-related protective factors. The B

99
coefficient of .217 suggests that for every one unit change of academic optimism, there
was a .217 unit of change in academic achievement of students.
Hypothesis 3: Research has shown that students who are more actively engaged in
school achieve better academic outcomes—they earn higher grades and better test scores.
For students with multiple risk factors, academic achievement is a sign of academic
resilience. It is hypothesized that school engagement is a mediating factor; that the
academic optimism of a school works to draw students in, to engage them in a warm and
supportive school climate, and that this, in turn, fosters academic resilience.
Two additional linear regressions were conducted in order to determine whether
school engagement is a mediating factor between academic optimism and academic
resilience. First, a regression was conducted to examine the relationship between
academic optimism and school engagement, when personal and family-related protective
factors are controlled for. The results of this analysis indicated that academic optimism
accounted for a statistically significant amount of the variability in school engagement,
Adjusted R2 = .08, F(4,135) = 3.855, p =.005). This suggests that academic optimism fosters
school engagement, perhaps by creating a warm and supportive environment that helps
students feel connected and supported.
A second regression was conducted to analyze the relationship between school
engagement and academic success. The results of this analysis were statistically
significant as well. The results were as follows: Adjusted R2 = .19, F(4, 135) = 9.24 (p =
.000). This suggests that students who are more engaged in school are more likely to

100
achieve academic success. The β coefficient decreases from .242 when the independent
variable is Academic Optimism to .184 when the independent variable is School
Engagement; this suggests that school engagement is a weaker predictor for school
achievement than academic optimism. Given that academic optimism is a predictor for
school engagement and school engagement is a predictor for academic achievement, it
appears that school engagement is a mediating variable in the relationship between
academic optimism and academic resilience. The results of these regressions are
summarized in Table 10 below.
Table 10
Summary of Linear Regression Results
Independent Variable
Dependent Variable
Adj. R2 B Beta t Sig.
Academic Optimism
Academic Achievement
.129 .217 .242 2.958 .004
Academic Optimism
School Engagement
.08 1.065 .182 2.162 .032
School Engagement
Academic Achievement
.192 .165 .184 2.332 .021
*Significant at the .05 level.
It was further hypothesized that academic resilience builds over time. In order to
test this hypothesis, the series of regressions was calculated a second time, controlling for
grade level in addition to personal and family-related protective factors. The results of
this analysis indicated that school engagement accounted for an even greater amount of
the variability in academic achievement when grade in school was controlled for
(Adjusted R2 = .246, F(5,134) = 10.1, p =.000).

101
Summary
The purpose of this study was to examine the relationships between academic
optimism, school engagement, and academic resilience in urban, low SES, Latino high
school students. It was hypothesized that schools higher in academic optimism foster
greater school engagement, and that increased school engagement leads to academically
resilient outcomes for these students. The results of these statistical tests indicate that
school academic optimism is positively related to academic resilience, and the school
engagement is a mediating factor in the relationship.

102
CHAPTER FIVE
DISCUSSION
The purpose of this study was to examine the relationships between academic
optimism of schools, school engagement, and academic resilience in urban, low SES,
Latino high school students. Academically resilient Latino high school students are
conceptualized as students who demonstrated academic achievement despite the presence
of several risk factors: being Latino, low SES, living in an urban environment, and
lacking personal and family-related protective factors. The results of this study
demonstrate that academic optimism is a significant predictor of academic resiliency in
urban, low SES Latino high school students, and that school engagement mediates the
relationship. Thus, it appears that schools can influence the academic resilience of
students, even when the students lack personal and/or family-related protective factors.
This section presents the findings from this research study in relation to prior research
and theoretical perspectives, implications for schools, the limitations of the study, and
directions for future research.
Summary of Research Findings
Some urban Latino students from low SES backgrounds evidence academic
resiliency despite the adversities historically associated with the educational experience
of Latinos in the U.S. Academic resiliency in this study was defined as academic success
(as measured by cumulative GPA, and reading and math EPAS test scores) despite the

103
presence of numerous risk factors (being Latino, low SES, and living in an urban
environment) and the absence of personal and family-related protective factors. Thus,
for these students, anything schools can do to foster school engagement and academic
achievement also fosters academic resilience. It appears that the charter school campuses
in this study are able to foster academic resilience in their students by developing
academically optimistic school climates, which foster school engagement and academic
achievement.
Academic Optimism
Academic optimism was measured using a norm-referenced instrument
developed by Hoy, Tarter, and Woolfolk Hoy (2006), the School Academic Optimism
Scale (SAOS). Academic optimism is a way to conceptualize school climate that
represents the interaction between three factors: collective efficacy, faculty trust in
students and parents, and academic emphasis. Previous studies (e.g. Hoy, Tarter, &
Woolfolk Hoy, 2006) have found a strong relationship between academic optimism and
academic achievement at the school level, suggesting that schools that are high in
academic optimism foster academic achievement in students. This study found that
academic optimism is a significant predictor of academic resilience in low SES, urban
Latino high school students, even when personal and family-related protective factors are
controlled for.
Academic optimism can be conceptualized as a positive and supportive school
climate, which may serve as a protective factor for some students. Wang, Haertel, &
104
Wahlberg (1994) found that, although students with strong personal protective factors are
more likely to be academically resilient than their peers who lack personal protective
factors, supportive schools and families can foster academic resilience. They concluded
that students who lack personal protective factors could be academically successful in
school if their family and/or school were supportive. This study lends support to that
finding.
Academic Resilience
Academic resilience was measured utilizing a composite measure of academic
achievement (GPA and standardized reading and math test scores). In order to be
considered academically resilient, student participants had to evidence strong academic
achievement despite the presence of numerous risk factors. A positive relationship was
found between academic achievement and t-scores on the Resource Index of the RSCA.
This finding supports Wang and Gordon’s (1994) finding that students with personal
characteristics, such as optimism, internal locus of control, and self-efficacy, that serve as
protective factors are more likely to be academically resilient. A positive relationship was
also found between parent involvement, a family-related protective factor for academic
resilience, and academic achievement. Students whose families are supportive of
education are more likely to achieve academic success as well. However, schools can
provide protective factors as well. Previous studies (e.g., Benard, 1991; Wang & Gordon,
1994; Wang, Haertel, & Wahlberg, 1995) have found that a positive school climate
fosters academic resilience. The present study found that students lacking in personal and
105
family-related protective factors are more likely to achieve academic success if they
attend schools high in academic optimism.
School Engagement
There is evidence from a number of prior studies to suggest that school
engagement is positively correlated with academic achievement and may prevent
dropping out of school (e.g., Cairns, Cairns, & Neckerman, 1989; Christenson &
Thurlow, 2004; Gonzalez & Padilla, 1997; Wehlage & Rutter, 1986). School engagement
is a multidimensional construct that includes behavioral engagement (indicated by
attendance, suspensions, and classroom participation), affective engagement (school
identification and belongingness), and cognitive engagement (processing academic
information). In this study, only behavioral and affective engagement were measured.
However, behavioral engagement was removed from the final model because it did not
correlate strongly with academic achievement in this sample.
Students with positive attitudes towards school are less likely to drop out
(Wehlage & Rutter, 1989). In this study, school engagement was found to be a mediating
factor in the relationship between academic optimism and student academic resilience.
This means that schools that foster student engagement are more likely to have
academically resilient students. Academically resilient students believe their teachers care
about them, find value in finishing high school, and enjoy school.
An important aspect of school engagement is belongingness, which is defined as
the extent to which one feels personally respected, included, and supported by others in

106
the school environment (Finn, 1989). For Latino students, a sense of belonging to school
may be particularly important to their academic success (Gonzalez & Padilla, 1997;
Pollard, 1989). Perhaps the most critical element in the development of a sense of
belongingness is a close, supportive relationship with at least one adult in the school;
having an adult who believes in the student can foster the development of optimism and
an internal locus of control (Brooks, 1994); these personal characteristics are often cited
as protective factors for academic resilience.
Implications for Schools
Rutter (1987) identified four main protective processes or methods that foster
resilience:
1. Reduce negative outcomes by altering the risk or child’s exposure to the risk
2. Reduce negative chain reactions following risk exposure
3. Establish and maintain self-esteem and self-efficacy
4. Open up opportunities to acquire skills and invest in prosocial activities.
Schools can foster resilience through any combination of these four processes (Benard,
1991). The present findings suggest that inventions designed to increase academic
resilience in urban Latino high school students would be most likely to be successful if
they combine more than one of the above protective processes. The following sections
explore some practices that can be implemented in schools to promote academic
resilience in urban Latino high school students.

107
Improve School Climate
Consistently, research has demonstrated that school characteristics promote
academic resilience; these include: caring and supportive teachers (e.g., Alva, 1991;
Benard, 1991; Borman & Overman, 2004; Henderson & Milstein, 1996; Werner &
Smith, 1989), a safe and orderly school environment (e.g., Borman & Overman, 2004;
Wang, Haertel, & Wahlberg, 1995), and positive expectations for all students (e.g.,
Benard, 1991; Henderson & Milstein, 1996; Rutter, 1987). These characteristics align
with the constructs of faculty trust, academic emphasis, and collective efficacy. Faculty
trust is a construct that is defined as a willingness to be vulnerable to another party based
on the confidence that that party is benevolent, reliable, competent, honest, and open”
(Hoy, Tarter, & Woolfolk Hoy, 2006, p. 429). It makes intuitive sense that teachers who
trust their students are more likely to care about them and to be supportive.
Academic emphasis is defined as “the extent to which a school is driven by a
quest for academic excellence…high but achievable academic goals are set for students;
the learning environment is orderly and serious; students are motivated to work hard; and
students respect academic achievement” (p. 427). The schools in this study were found to
be high in academic emphasis.
Collective efficacy is “the judgment of teachers that the faculty as a whole can
organize and execute the actions required to have positive effects on students” (p. 434).
Collective efficacy is a construct derived from social cognitive theory (Bandura, 1997).
Hoy, Sweetland, and Smith (2002) concluded that academic emphasis works through the

108
construct of collective efficacy. They further concluded that “the consequences of high
collective efficacy will be the acceptance of challenging goals, strong effort by teachers,
and persistence in effort to overcome difficulties and succeed” (p. 91).
Schools can develop strategies to increase faculty trust, collective teacher
efficacy, and academic emphasis, resulting in higher levels of academic optimism, which
may then foster academic achievement in students. Lee and Smith (1999), in a study of
nearly 30,000 students from 304 Chicago public schools, found that what was related to
substantial increases in learning was the combination of academic emphasis and social
support for learning. Alva (1991) found that resilient Mexican-American students were
more likely to feel encouraged and prepared to attend college. She recommends early and
positive contact with school counselors, teachers, and administrators, in order to motivate
them to attend college and to guide their decision-making process when applying to
colleges.
Collaborate with Parents and Families
Schools can also work to develop collaborative partnerships with families.
Previous research has demonstrated that Latino students are more likely to succeed
academically when their parents are involved in school activities and encourage academic
success (Alva, 1991; Bryk & Schneider, 2002; Diaz, 1996; Gandara, 1992; Raffaele &
Knoff, 1999). The family processes that contribute to academic resiliency in Latino
students include living in a home where parental expectations of academic achievement
are openly expressed (Diaz, 1996) and where support for academic achievement is

109
demonstrated by checking homework, discussing school work, and attending school
activities (Catterall, 1998; Driscoll, 2006). Schools can help to support parent
involvement and valuing of education by developing collaborative partnerships with
them.
There is a large body of research that suggests that schools that embrace and
encourage the development of collaborative family-school partnerships foster academic
achievement. For Latino students facing numerous risk factors for academic failure and
dropout, these relationships can be particularly important. However, studies have shown
that these relationships can be difficult to develop with some Latino families who may
feel intimidated by the school system, who do not speak English, or who may experience
cultural discontinuities between family beliefs and the expectations of the school (e.g.,
Cox, 2005). Inger (1992) argues that, in order to overcome these barriers, schools must
actively engage in outreach activities and clearly demonstrate respect for parents’ ideas
and experiences. Cox (2005) conducted a review of empirical studies of home-school
collaboration interventions, and found that successful interventions are those that treat
families as equals.
Christenson (1995) further argues that requiring parental involvement is not
enough; a shift in attitude is necessary. Educators must believe that, even at the high
school level, parents can contribute positively to their child’s academic resiliency. Home-
school collaboration is a two-way process that involves an exchange of information and
“results in a shared responsibility among parents and educators for educational outcomes
110
(p. 119), and is a means to an end (i.e., greater educational success for students) rather
than an end in and of itself. According to the author, home-school collaboration is
facilitated when educators and parents hold similar expectations for student performance,
feel comfortable contacting each other, cooperate to enhance student performance,
monitor student progress, and hold the student accountable for schoolwork and behavior.
Increase School Engagement
Previous research has found that affective school engagement is a process that can
serve as “a protective factor in that it provides a sense of confidence, competency, and
security that enables positive relationships with teachers and other adults in the school
environment” (Ruiz, 2002, p. 161). Students who experience these positive feelings
associate satisfaction with school-based learning and activities, which can serve to
promote academic success. Students with low levels of affective school engagement have
been described in prior research as not feeling as though they belong in school, of not
valuing school or school-related outcomes, not feeling comfortable or competent in the
classroom, and being distrustful of schools and teachers (Finn, 1989; Voelkl, 1996).
These students are more likely to fall into a pattern of negative school behaviors that may
ultimately result in dropping out. Christenson and Thurlow (2004) note that dropping out
is preceded by a series of indicators of withdrawal from school (i.e., absenteeism) or
unsuccessful school experiences (i.e., poor grades, behavioral difficulties, etc.) that often
begins in elementary school. If dropping out involves a gradual process of disengagement

111
from school, school completion is presumably facilitated by continued, if not increasing,
engagement over a student’s time in school.
Martin (2002) presents a model of academic resilience in which interventions are
designed to enhance students’ affective school engagement and motivation to succeed
academically. He argues that educators need to restructure the learning environment in
three ways: 1) restructure instructional practices so that students experience frequent
small successes and have positive beliefs about school; 2) make school relevant to
students’ lives and interests in order to increase the value of schooling in their perception;
and 3) promote a focus on mastery as opposed to performance so that students learn goal-
setting and persistence.
One model that bridges the research on developing family-school partnerships and
improving school engagement is the Check and Connect Model (Christensen, 2002), in
which an adult staff member at the school monitors a student. The monitor uses
individualized intervention strategies and helps the student develop habits of successful
school engagement. Trust and familiarity are developed over time through persistent
outreach to the student and family. Efforts include regularly checking on student
attendance and academic performance, providing ongoing feedback about student
progress, modeling the use of problem-solving skills, frequently communicating with
families about both good and bad news, and being available to the youth to listen about
personal concerns.

112
Limitations of the Study
There are several limitations to this dissertation study. The first limitation has to
do with the definition of academic resilience. In the literature, academic resilience has
been defined and measured in a variety of ways; for example, some studies utilize course
grades as a measure of academic resilience (e.g., Padilla & Alva, 1987; Ruiz, 2002),
others utilize standardized test scores (e.g., Borman & Overman, 2004), others utilize
GPA, and still others utilize a combination of grades and test scores (e.g., Alva, 1991). In
this study, academic resilience was defined as academic achievement despite the
adversities associated with numerous risk factors. Variations in how academic resilience
is defined make it difficult to generalize results and compare outcomes across studies.
Given that educational resilience is a process that occurs over time, a cross-
sectional design may miss important indicators of resilience. In addition, for Latino high
school students at risk for dropping out, it may be important to include high school
completion as an indicator of academic success. For example, a five- or six-year study
that followed students from the beginning of 9th grade through their freshman or
sophomore year of college would provide a more accurate analysis of the school factors
that promote academic resilience. This is a significant limitation of the study. Since this
study was a dissertation study, a six-year longitudinal study design would have been
impractical; a cross-sectional study design is more feasible. In order to take into account
as much as possible the idea that resilience occurs over time in response to protective
113
factors within the school, only those charter school campuses with 9th-12th grade students
were used in this study.
Given the large Latino population at the schools, a third potential limitation of the
study is that it was limited to students who read and understand English well enough to
understand and respond to the written questions. It was assumed that nearly all of the
students will meet this criterion, given that they were required to write an essay in order
to apply to the schools. The consent forms for students were translated into Spanish so
that students with parents whose primary language is Spanish can also participate.
A further limitation of the study may be related to experimenter bias. Although
not currently employed by the charter school network, the researcher was previously
employed for 8 years at one of the charter school campuses in the study. It is possible that
some participants who know the researcher felt pressured to complete the questionnaire
instruments in order to help the researcher with her dissertation. In addition, in order to
minimize the amount of work that administrators, teachers, and staff were required to do
in order to collect the questionnaires, the researcher was present at all of the campuses
when questionnaires were being collected. Finally, there was some expectation on the
part of the researcher, based on prior work experiences, that these schools would obtain
high academic optimism scores. A quantitative research design was selected in order to
minimize the impact of these biases. Nearly all of the items on the questionnaire
instruments were worded as multiple choice questions, limiting the amount of
interpretation required by the researcher. Potential participants were repeatedly informed

114
that they should not feel any pressure to complete the questionnaires if they did not wish
to. Although the researcher was present during some of the data collection, contact with
individual participants was minimized. For example, student and teacher participants
placed the questionnaires in drop boxes rather than handing them to the researcher.
Recommendations for Further Research
This study was limited in scope and size. Larger scale studies examining the
relationships between academic optimism, school engagement, and academic resilience
in high school students will allow researchers to draw more definitive conclusions
regarding the degree to which academic optimism predicts academic resilience for
different groups of students. Studies should also be conducted in a variety of school
settings, comparing schools low in academic optimism and those higher in academic
optimism, in order to help researchers build a more comprehensive theory of academic
optimism at the school level.
This study utilized academic optimism of the school as one of the independent
variables. The decision to focus on academic optimism of the school rather than on
academic optimism of the teachers was made because it was hypothesized that the overall
school climate of the charter schools in this study is different from the other schools the
students may have attended. Researchers (Beard, Hoy, & Woolfolk Hoy, 2009) recently
developed a new construct: teacher academic optimism. Further research on the
individual teacher academic optimism measure is needed to determine whether it more
accurately captures school climate and whether it correlates with student resilience; to

115
determine how administrators can promote academic optimism in teachers; and to
provide guidelines for teacher practices that enhance academic achievement for students.
Because academic resilience is not static (Luthar, 2006; Rutter, 1987), students
who are academically resilient at one point in their lives may begin to struggle
academically if the influence of risk factors in their lives outweighs that of the protective
factors. This may be particularly true for those students lacking in personal protective
factors, as they depend on external protective factors within their families and/or schools
to buffer them from stressors. If, for example, one of these students experiences the loss
of a close, supportive relationship with a family member and/or transfers schools, the
student may increase his or her risk for academic failure. Longitudinal studies that track
groups of students through high school into college could be beneficial in elucidating the
extent to which school protective factors influence academic achievement over time.

116
APPENDIX A
LETTER TO PARENTS IN ENGLISH AND SPANISH

117
Dear Parent/Guardian:
This letter is to inform you that a research project is being conducted at some of
the Noble campuses as part of a doctoral dissertation. If your family is of Latino
descent, your child is invited to participate in this research project. Students at some of
the Noble campuses are being asked to complete questionnaires. The student
questionnaire will take approximately 25-30 minutes to complete and will be
administered during Advisory on (date). To thank students for their participation, they
will receive a Loyola University Chicago lanyard or key chain when they turn in their
surveys.
The questionnaire asks students about their school experiences, how they feel
about school, and how they generally handle situations. The student questionnaire also
includes questions about the type of academic support they receive at home. The results
from this research will help educators learn more about the ways school climate can
affect the academic performance and resilience of students. It is hoped that this
information will help administrators enhance the school climate so that students feel a
greater sense of belonging to school and experience academic success.
Students will not be asked to write their names on the questionnaires; only their
four-letter codes (these are explained on the student assent form). These codes will be
used to link their responses to data from PowerSchool regarding their grades, test scores,
attendance, and behavior. There is a small possibility that some students may experience
discomfort or frustration as they think about their school experiences and their feelings
about school; however, students are free to choose to stop filling out the questionnaire at
any time. The questionnaires will be kept in a safe place and will in no way be used to
evaluate your child’s performance at school.
If you have read this letter and feel that you need more information or if you have
any questions regarding this project, please contact Christine Fallon, the research
investigator, at (312) 479-0859 or [email protected] or her research advisor, Dr. David
Shriberg at [email protected].

118
Students who are 18 years of age may sign their own consent form. If you agree
to allow your child to participate in the study, please sign the consent form, place it in the
envelope provided, and return it to your child’s advisor. If you do not consent to allow
your child to participate, you do not need to return the form. There is no penalty for not
participating in the study; your child’s grades will not be negatively impacted.
Thank you!
Christine Fallon

119
Estimados Padres/Guardianes,
Esta carta es para informarles que estoy conduciendo un proyecto de
investigación académica, que es parte de una disertación doctorada, en la escuela Noble.
Si su familia es de descendencia de lengua España, su niño(a) está invitado para
participar en este proyecto de investigación académica. Los alumnos de algunas escuelas
de Noble completaran una encuesta. Se necesita aproximativamente 25-30 minutos para
completarla durante Consejería (Advisory) (date). Para expresar mi gratitud a los
alumnos que participan, ellos recibirán un acollador con la insignia o un llavero de la
Universidad Loyola de Chicago cuando me entregan las encuestas.
La encuesta incluye preguntas sobre las experiencias escolares de los alumnos,
sus sentimientos, y como reaccionan en situaciones particulares. También hay preguntas
sobre el apoyo académico que reciben en casa. Los resultados de esta investigación
académica ayudaran a los profesores aprenden las maneras que el ambiente de la escuela
afectan el aprovechamiento académico y la resiliencia de los alumnos. Espero que los
resultados ayuden a los administradores mejorar el ambiente de la escuela para que los
alumnos tengan un sentimiento de la pertenecía y experimenten éxito académico.
No es necesario que los estudiantes escriban sus nombres en la encuesta; solo
escribirán sus códigos de cuatro letras. Uso los códigos para conectar sus respuestas de la
información de PowerSchool acerca sus grados, resultados de exámenes, asistencia y
conducta. Hay la posibilidad que algunos alumnos sentirán frustrados cuando piensan en
sus experiencias escolares; sin embargo, los alumnos están libres para terminar la
encuesta cuando quieran. Pondré las encuestas en un lugar seguro y de ninguna manera
usare los resultados para evaluar el aprovechamiento de su niño(a).
Si usted necesita más información o si hay preguntas acerca este proyecto
académico, comuníquese conmigo a 312-479-0859 o [email protected]. También usted
puede comunicarse con el consejero de investigación académica, Dr. David Shriberg, a
Los alumnos que tienen 18 años de edad pueden firmar su propia solicitud de

120
permiso. Si usted permite que su niño(a) participe en esta investigación académica, por
favor firme la solicitud de consentimiento, métala en el sobre incluido, y regrésela al
consejero de su niño(a). No hay que regresar la solicitud si usted no permite que su
niño(a) participe. No hay ninguna consecuencia negativa si su niño(a) no participa en la
investigación académica.
¡Gracias!
Christine Fallon

121
APPENDIX B
PARENT CONSENT FORM IN ENGLISH AND SPANISH

122
CONSENT TO PARTICIPATE IN RESEARCH
Project Title: School factors that promote academic resilience in urban Latino high school students. Researcher: Christine Fallon Faculty Sponsor: Dr. David Shriberg Introduction: Your child is being asked to take part in a research study being conducted by Christine Fallon for a doctoral dissertation under the supervision of Dr. David Shriberg in the Department of Education at Loyola University of Chicago. Your child is being asked to participate in this study because he/she is of Latino descent and is currently attending one of the campuses of the Noble Network of Charter Schools in this study. All teachers and Latina/o students at three of the Noble Campuses are being asked to participate. Please read this form carefully before deciding whether to permit your child to participate in the study. Purpose: The purpose of this study is to examine the relationship between academic optimism of a school and academic resilience in its students. Academic optimism is a measure of school climate that includes three factors: faculty trust of students and parents, collective efficacy, and academic emphasis. Academic resilience is academic achievement despite numerous challenges or risk factors. This study will examine the level of academic optimism of the Noble campuses being studied, and will attempt to link it with the level of academic resilience demonstrated by the students at those campuses. Procedures: If you permit your child to participate in the study, your child will be asked to complete a written questionnaire that includes questions on several topics: his/her perceptions regarding the school climate; the number and intensity of stressors and supports in his/her life, and his/her level of resilience. The student questionnaire should only take 25-30 minutes and will be administered during Advisory. Additionally, I am requesting your permission to obtain your child’s grade point average and standardized test scores from PowerSchool. This information is only needed to link students’ academic performance with their questionnaire responses.

123
The researcher is the only person who will have access to the information. This information will be kept in a password-protected computer file and destroyed after it has been linked to the questionnaire responses. Your child’s principal will, however, have a list of names of the students participating in the study. This information will be provided to the principals for attendance purposes only and each principal has signed a confidentiality agreement stating that he/she will not disclose this information or use it for any other purpose. Risks/Benefits: There is a small possibility that some students may experience discomfort or frustration as they think about their school experiences and their attitudes about school, however all students are free to stop filling out the questionnaire at any time. There are no direct benefits to your child from participation, but the results from this research will help educators learn more about the things schools can do to foster academic success. It is hoped that this information will help administrators programs that are designed to help students feel a greater sense of belonging to school and increase the academic resilience of students. Compensation: Students who agree to participate in the study will receive a Loyola University Chicago lanyard or keychain, whether they complete the survey or not. Confidentiality: Information gathered on the questionnaires will be kept confidential. The consent forms will be kept in a sealed envelope inside a locked file drawer, and will not be tied to your child’s questionnaire responses. On the questionnaire, your child will not be asked to provide his or her name. On the front page of the questionnaire and assent form, students will be asked to respond to four brief questions. The 4-letter answers to these questions will be combined to form a code for each student. This code will be used to identify your child instead of using his/her name. No one at the school will know your child’s code. Voluntary Participation: Participation in this study is completely voluntary. If you would like your child to participate, please check the box on the next page that says, “I give consent for my child to participate”. Even if you give consent for your child to participate, you are free to withdraw your consent at any time without penalty. Additionally, I am asking for your consent to access your child’s records in PowerSchool. The information that will be accessed includes my child’s grade point average, reading and math standardized test scores, attendance, and number of detentions and suspensions. No other information will be accessed. If you give consent for me to do this, please check the box that says, “I allow the researcher to access my child’s information in PowerSchool”. Choosing not to

124
give your consent or to withdraw consent will not impact your child’s grade in Advisory or in any other class. Contacts and Questions: If you have questions about this research study, please feel free to contact Christine Fallon at [email protected] or the faculty sponsor, Dr. Shriberg, at [email protected]. If you have questions about your rights as a research participant, you may contact the Compliance Manager in Loyola’s Office of Research Services at (773) 508-2689. Statement of Consent: Please check BOTH boxes if you consent for your child to participate: I give consent for my child to participate. I allow the researcher to access my child’s information in PowerSchool.
Your signature below indicates that you have read and understood the information provided above, have had an opportunity to ask questions, and agree to allow your child to participate in this research study. You will be given a copy of this form to keep for your records. If you would like your child to participate in the study and have signed this form, please place it in the envelope provided, seal it, and return the envelope to your child’s advisor. ____________________________________________ Your child’s name ____________________________________________ __________________ Parent’s Signature Date ____________________________________________ ___________________ Researcher’s Signature Date

125
CONSENTIMIENTO PARA PARTICIPAR EN LA INVESTIGACION ACADEMICA
Titulo del proyecto: Factores escolares que promuevan resiliencia académica en alumnos de la secundaria de descendencia de lengua España Investigadora académica: Christine Fallon Consejero académico: Dr. David Shriberg Introducción: Quisiera que su niño(a) participe en una investigación académica que esta conducida por Christine Fallon. La investigación académica es parte de una disertación del doctorado bajo la supervisión de Dr. David Shriberg del Departamento de Educación de la Universidad de Loyola de Chicago. Les pido que su niño(a) participe en la investigación académica porque él/ella es de descendencia de lengua España y asiste a una escuela de Noble Network of Charter Schools. Quisiera que todos los profesores y alumnos hispanos de las tres escuelas de Noble participen. Por favor lean la información cuidadosamente antes de decidir si su niño(a) participa en la investigación académica. Motivo: El motivo de esta investigación académica es para examinar la relación entre la optimisma académica de una escuela y la resiliencia académica de los alumnos. La optimisma académica es una medida del ambiente de una escuela que incluye tres factores: la confianza entre la facultad y los padres y alumnos, eficacia colectiva, y énfasis. La resiliencia académica es el aprovechamiento académico que uno logra a pesar de hay varios desafíos o riesgos. Esta investigación académica examinara el nivel de optimismo académico de las escuelas Noble. Tratare de conectar este nivel con el de la resiliencia académica mostrada por los estudiantes. Procedimientos: Si usted permite que su niño(a) participe en la investigación académica, su niño(a) completara una encuesta que incluye preguntas acerca los temas siguientes: su percepción del ambiente de la escuela, el numero y intensidad de factores de tensión/apoyo en su vida, y su nivel de resiliencia. Se necesita 25-30 minutos para terminar la encuesta y los alumnos la tomaran durante Consejería (Advisory). También les pido su permiso para obtener información de los
126
grados y resultados de exámenes de su niño(a) de PowerSchool. Solo necesito la información para conectar el aprovechamiento académico con las respuestas de la encuesta. La investigadora es la única persona que tendrá acceso a la información. Guardare la información en un archivo de una computadora protegida con un password y será destruida después de obtener los resultados. Sin embargo, el director de la escuela de su niño(a) tendrá una lista de los nombres de alumnos que participan. Los directores tendrán la información solo por el motivo de asistencia. Cada director ha firmado un contrato de confidencialidad y no compartirán la información ni la usaran por otro motivo. Riesgos/Beneficios: Hay la posibilidad que algunos alumnos sentirán frustrados cuando piensan en sus experiencias escolares y sus actitudes. Todos los alumnos están libres para terminar la encuesta cuando quieran. No hay beneficios directos para los alumnos de su participación, pero los resultados de esta investigación académica ayudaran a los profesores aprender lo que pueden hacer para mejorar el éxito académico. Espero que la información ayudara a los que están en programas administradoras que están diseñados para ayudar los estudiantes tengan un sentimiento de la pertenecía y mejorar la resiliencia académica de los alumnos. Compensación: Los alumnos que participan en la investigación académica recibirán un acollador con la insignia o llavero de La Universidad de Loyola de Chicago (si ellos la completan o no). Confidencialidad: La información de los resultados de la encuesta es confidencial. Guardare las solicitudes de consentimiento en un sobre que estará en un cajón cerrado con llave. No usare las solicitudes para evaluar las respuestas de las encuestas. Los alumnos no escribirán sus nombres en las encuestas. En la primera pagina de la encuesta, los alumnos responderán a cuatro preguntas breves. Combinare las respuestas que consisten de una letra para formar un código para cada alumno. Este código estará usado para identificar a su niño(a) en vez de usar su nombre. Nadie en la escuela sabrá el código de su niño(a). Participación Voluntaria: La participación en la investigación académica es voluntaria. Si usted prefiere que su niño(a) participe, por favor marque el cuadrado en la página siguiente donde está escrito: “Doy mi consentimiento para que mi niño(a) participe.” Si usted da permiso para que si niño(a) participa, usted esta libre para cambiar su consentimiento sin tener consecuencias negativas. También, les pedimos su consentimiento para que tenga acceso a la información de los archivos de su niño(a) en PowerSchool. La información incluye los

127
grados de su niño(a), los resultados de exámenes de lectura y matemáticas, asistencia, y los números de detenciones y suspensiones. No hay acceso a otra información. Si tengo el consentimiento de usted por favor marque el cuadrado donde está escrito, “Permito que la investigadora académica tenga acceso a la información de mi niño(a) en PowerSchool.” No hay ninguna consecuencia negativa si usted no da su consentimiento. Comunicación y Preguntas: Si hay preguntas acerca la investigación académica, por favor comuníquese con Christine Fallon a [email protected] o con el consejero académico, Dr. Shriberg, a [email protected]. Si hay preguntas acerca sus derechos como participante en la investigación académica, comuníquese con el gerente en el Departamento de Servicios de Investigaciones Académicas de Loyola a 773-508-2689. Hace dos semanas que usted recibieron un sobre incluido con la carta de noticias de la escuela. Solicitud de Consentimiento: Por favor marque los dos cuadrados si usted da permiso para que su niño(a) participe:
Doy mi consentimiento para que mi niño(a) participe.
Doy mi consentimiento para que la investigadora tenga acceso a la información de mi niño(a) en PowerSchool. La firma de usted indica que usted ha leído y ha comprendido la información en la carta, tuvo la oportunidad de hacer preguntas, y está de acuerdo que su niño(a) participe en la investigación académica. Usted recibirá copias de esta solicitud de consentimiento. Si usted prefiere que su niño(a) participe en la investigación académica y ha firmado la solicitud, por favor hay que meterla en el sobre, cerrarlo, y regresarlo al consejero de su niño(a). Nombre del alumno Firma del padre fecha ________________________________________________________________________ Firma de la investigadora académica fecha

128
APPENDIX C
STUDENT ASSENT FORM

129
Assent Form for Students
Project Title: School factors that promote academic resilience in urban Latino high school students. Researcher: Christine Fallon Faculty Sponsor: Dr. David Shriberg Introduction: You are being asked to take part in a research study being conducted by Christine Fallon for a dissertation under the supervision of Dr. David Shriberg in the Department of Education at Loyola University of Chicago. You are being asked to participate in this study because you are of Latino descent and are currently attending one of the campuses of the Noble Network of Charter Schools in this study. Please read this form carefully and ask any questions you may have before deciding whether to participate in the study. Purpose: The purpose of this study is to examine the relationship between academic optimism of a school and academic resilience in its students. Academic optimism is a measure of school climate that includes three factors: faculty trust of students and parents, collective efficacy, and academic emphasis. Academic resilience is academic achievement despite numerous challenges or risk factors. This study will examine the level of academic optimism of the Noble campuses being studied, and will attempt to link it with the level of academic resilience demonstrated by the students at those campuses. Procedures: If you agree to participate in the study, you will be asked to complete a written questionnaire that includes questions on several topics: your perceptions regarding the school climate, the way you handle situations, and your school experiences. This questionnaire should only take 25-30 minutes of your time. If you need additional time, you may use the entire period. Additionally, I would like to access your grade point average, attendance, standardized reading and math test scores, and discipline information from PowerSchool. This information is only needed to link your academic performance with your questionnaire responses. The researcher is the only person who will have access to the information. This information will be kept in a password-protected computer file and destroyed after it has been linked to the questionnaire responses.
130
However, your principal will have a list of names of the students participating in the study. This information will be provided to the principals for attendance purposes only and each principal has signed a confidentiality agreement stating that he/she will not disclose this information or use it for any other purpose. Risks/Benefits: There is a small possibility that you may experience discomfort or frustration as you think about your school experiences and attitudes about school; however, you are free to stop filling out the questionnaire at any time. There are no direct benefits to you from participation, but the results from this research will help educators learn more about the things schools can do to foster academic success. It is hoped that this information will help administrators programs that are designed to help students feel a greater sense of belonging to school and increase the academic resilience of students. Compensation: Once you turn in the questionnaire, whether it is completed or not, you will be allowed to choose a Loyola University Chicago lanyard or keychain as a token of appreciation for your participation in this study. Confidentiality: Information gathered on the questionnaires will be kept confidential. The consent forms will be kept in a sealed envelope inside a locked file drawer, and will not be tied to your questionnaire responses. On the questionnaire, you will not be asked to provide your name. Below, you will be asked to respond to four brief questions. The answers to these questions will be combined to form a code for you, which you will be asked to write on the questionnaire. No one at the school will know your code. Voluntary Participation: Participation in this study is completely voluntary. If you would like to participate, please check the box below that says, “I agree to participate in this study”. Even if you agree to participate, you are free to stop at any time without penalty. Choosing not to participate or not completing the survey will not impact your grade in Advisory or in any other class. Contacts and Questions: If you have questions about this research study, please feel free to contact Christine Fallon at [email protected] or the faculty sponsor, Dr. Shriberg, at [email protected]. If you have questions about your rights as a research participant, you may contact the Compliance Manager in Loyola’s Office of Research Services at (773) 508-2689.

131
Please respond to the following questions. Your responses will become a four-digit code used to identify you and to link your responses with your data in PowerSchool. You will be asked to write this code on the front page of the student questionnaire.
If you agree to participate in this study, please check the box, print your name and sign below. If you prefer not to participate, please raise your hand and you will be escorted back to your Advisory class. There is no penalty for choosing not to participate in this stud. I agree to participate in this study. ____________________________________________ Print your name ____________________________________________ ___________________ Signature Date ____________________________________________ ___________________ Researcher’s Signature Date
What is the last digit of your home (or primary) telephone number? ________
What is the last letter of your middle name? ________
What is the third letter of the street on which you live? ________
What is the third letter of your mother’s (or primary guardian’s) first name? ________

132
APPENDIX D
REMINDER NOTICE TO APPEAR IN STUDENT NEWSLETTER
133
Reminder Notice to Appear in the School Newsletter
Approximately two weeks ago, you should have received an envelope attached to your child’s newsletter. The envelope contained information regarding a study being conducted here at the school by Christine Fallon, a doctoral student at Loyola University under the supervision of Dr. David Shriberg. If you are of Latino descent and would like your child to participate in the study but have not yet returned the signed consent form, please return it with this newsletter. If you did not receive the letter explaining the study or the consent form, additional copies are available in the main office. If you have questions about the study and what is required of your child to participate, please contact Christine Fallon at [email protected] or (312) 479-0859. The student survey will be administered on (date) during Advisory. Parental consent forms are due two days prior to that date. Again, participation is completely voluntary; choosing not to return the consent form will not affect your child’s grades.

134
APPENDIX E
QUESTIONNAIRE FOR FACULTY
135
Questionnaire for Faculty
Dear Participant:
Thank you very much for participating in this dissertation research study. Please
remember that your participation is voluntary, and your information will be kept
confidential. Enclosed in this packet are a variety of questions regarding your perceptions
of the climate at your campus. I am interested in the ways that school climate factors may
influence the academic resilience of students that attend Noble schools. I am simply
looking for your opinion, so please answer the questions as h1stly as possible. The
questionnaire will take approximately 5-10 minutes to complete.
Do not write your name anywhere on this packet. Filling out this questionnaire
implies that you consent to participate in the study.
Again, thank you very much for your participation.

136
School Academic Optimism Survey
Directions: Please indicate your degree of agreement with each of the statements about your school from strongly disagree (1) to strongly agree (6). Please circle your response. Your answers are confidential.
1. Teachers in this school are able to get through to the most
difficult students.
2. Teachers here are confident they will be able to motivate their
students.
3. If a child doesn’t want to learn teachers here give up.
4. Teachers here don’t have the skills needed to produce meaningful
results.
5. Teachers in this school believe that every child can learn.
6. These students come to school ready to learn.
7. Home life provides so many advantages that students are bound
to learn.
8. Students here just aren’t motivated to learn.
9. Teachers in this school do not have the skills to deal with student
disciplinary problems.
10. The opportunities in this community help ensure that these
students will learn.
11. Learning is more difficult at this school because students are
worried about their safety.
12. Drug and alcohol abuse in the community make learning
difficult for students here.
13. Teachers in this school trust their students.
14. Teachers in this school trust the parents.
15. Students in this school care about each other.
16. Parents in this school are reliable in their commitments.
17. Students in this school can be counted upon to do their work.
(1) (2) (3) (4) (5) (6)
(1) (2) (3) (4) (5) (6)
(1) (2) (3) (4) (5) (6)
(1) (2) (3) (4) (5) (6)
(1) (2) (3) (4) (5) (6)
(1) (2) (3) (4) (5) (6)
(1) (2) (3) (4) (5) (6)
(1) (2) (3) (4) (5) (6)
(1) (2) (3) (4) (5) (6)
(1) (2) (3) (4) (5) (6)
(1) (2) (3) (4) (5) (6)
(1) (2) (3) (4) (5) (6)
(1) (2) (3) (4) (5) (6)
(1) (2) (3) (4) (5) (6)
(1) (2) (3) (4) (5) (6)
(1) (2) (3) (4) (5) (6)
(1) (2) (3) (4) (5) (6)
Str
ongl
y D
isag
ree
Str
on
gly
A
gre
e
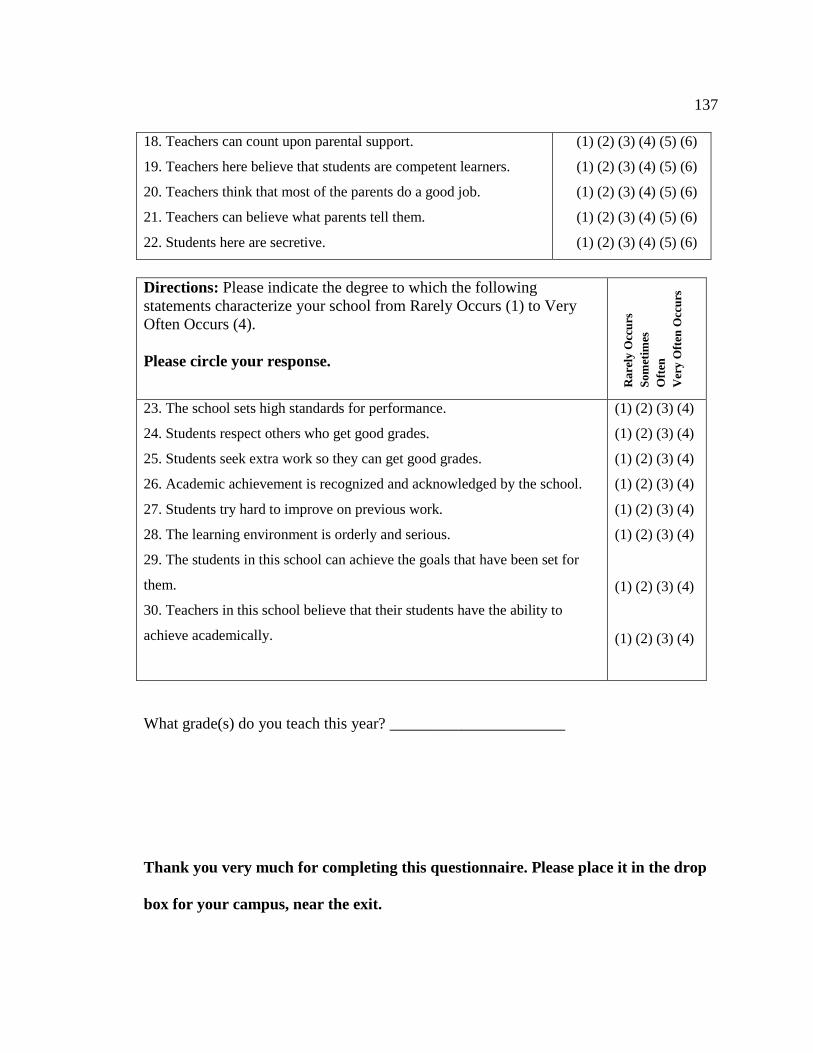
137
18. Teachers can count upon parental support.
19. Teachers here believe that students are competent learners.
20. Teachers think that most of the parents do a good job.
21. Teachers can believe what parents tell them.
22. Students here are secretive.
(1) (2) (3) (4) (5) (6)
(1) (2) (3) (4) (5) (6)
(1) (2) (3) (4) (5) (6)
(1) (2) (3) (4) (5) (6)
(1) (2) (3) (4) (5) (6)
Directions: Please indicate the degree to which the following statements characterize your school from Rarely Occurs (1) to Very Often Occurs (4). Please circle your response.
23. The school sets high standards for performance.
24. Students respect others who get good grades.
25. Students seek extra work so they can get good grades.
26. Academic achievement is recognized and acknowledged by the school.
27. Students try hard to improve on previous work.
28. The learning environment is orderly and serious.
29. The students in this school can achieve the goals that have been set for
them.
30. Teachers in this school believe that their students have the ability to
achieve academically.
(1) (2) (3) (4)
(1) (2) (3) (4)
(1) (2) (3) (4)
(1) (2) (3) (4)
(1) (2) (3) (4)
(1) (2) (3) (4)
(1) (2) (3) (4)
(1) (2) (3) (4)
What grade(s) do you teach this year? ______________________ Thank you very much for completing this questionnaire. Please place it in the drop
box for your campus, near the exit.
Rar
ely
Occ
urs
Som
etim
es
Ofte
n
Ver
y O
ften
Occ
urs

138
APPENDIX F
SCRIPT TO BE READ TO FACULTY
139
Introduction: You are being invited to take part in a research study being conducted by Christine Fallon for a doctoral dissertation under the supervision of Dr. David Shriberg in the Department of Education at Loyola University of Chicago. You are being asked to participate in this study because you are currently employed as a teacher at one of the campuses of the Noble Network of Charter Schools in this study. All teachers and Latino/a students at the Rauner, Pritzker, and Noble Street campuses are being asked to participate in the study. Purpose: The purpose of this study is to examine the relationship between academic optimism of a school and academic resilience in its students. Academic optimism is a measure of school climate that includes three factors: faculty trust of students and parents, collective efficacy, and academic emphasis. Academic resilience is academic achievement despite numerous challenges or risk factors. This study will examine the level of academic optimism of the Noble campuses being studied, and will attempt to link it with the level of academic resilience demonstrated by the students at those campuses. Procedures: If you agree to participate in the study, you will be asked to complete a paper and pencil questionnaire that includes questions regarding your perceptions of the school climate at your campus. The questionnaire will take approximately 5-10 minutes to complete. There are sealed drop boxes near the exit. Once you have finished, please place the questionnaire in the drop box for your campus. Risks/Benefits: The potential risks of participation are believed to be minimal. No personal information will be requested of you. There are no direct benefits to you from participation, but the results from this research will help educators learn more about the things schools can do to foster academic success. It is hoped that this information will help administrators programs that are designed to help students feel a greater sense of belonging to school and increase the academic resilience of students. Confidentiality: Information gathered on the questionnaires will be kept confidential. Your responses will not be linked with your name or any other personal information. Voluntary Participation: Participation in this study is completely voluntary. If you do not wish to participate, you are free to not take a questionnaire packet or to place a blank packet into the drop box. Choosing not to participate will not have a negative impact on your employment.
140
Contacts and Questions: If you have questions about this research study, please feel free to contact Christine Fallon at [email protected] or the faculty sponsor, Dr. Shriberg, at [email protected]. If you have questions about your rights as a research participant, you may contact the Compliance Manager in Loyola’s Office of Research Services at (773) 508-2689.

141
APPENDIX G
QUESTIONNAIRE FOR STUDENTS

142
Instructions for completing the questionnaire
DO NOT PUT YOUR NAME ON THIS PACKET!
Dear Student,
All students of Latino descent at three of the Noble campuses are being asked to
take this survey. The questions ask you about your ideas and experiences on a variety of
topics related to school. Your answers will help us understand about how students feel
about school and may be used to improve school practices.
The answers you give will be kept private, or confidential. Your name will never
be used. This is not a test. There are no right or wrong answers. Be as honest as possible
about what is true for you. Taking the survey is voluntary. If you do not want to answer
any of the questions, just leave it blank. If you finish before the period ends, please work
quietly.
Please respond to the following questions. Your responses will become a four-
digit code used to identify you.
Thank you very much for contributing to this research study!
What is the last digit of your home (or primary) telephone number? ________
What is the last letter of your middle name? ________
What is the third letter of the street on which you live? ________
What is the third letter of your mother’s (or primary guardian’s) first name? ________
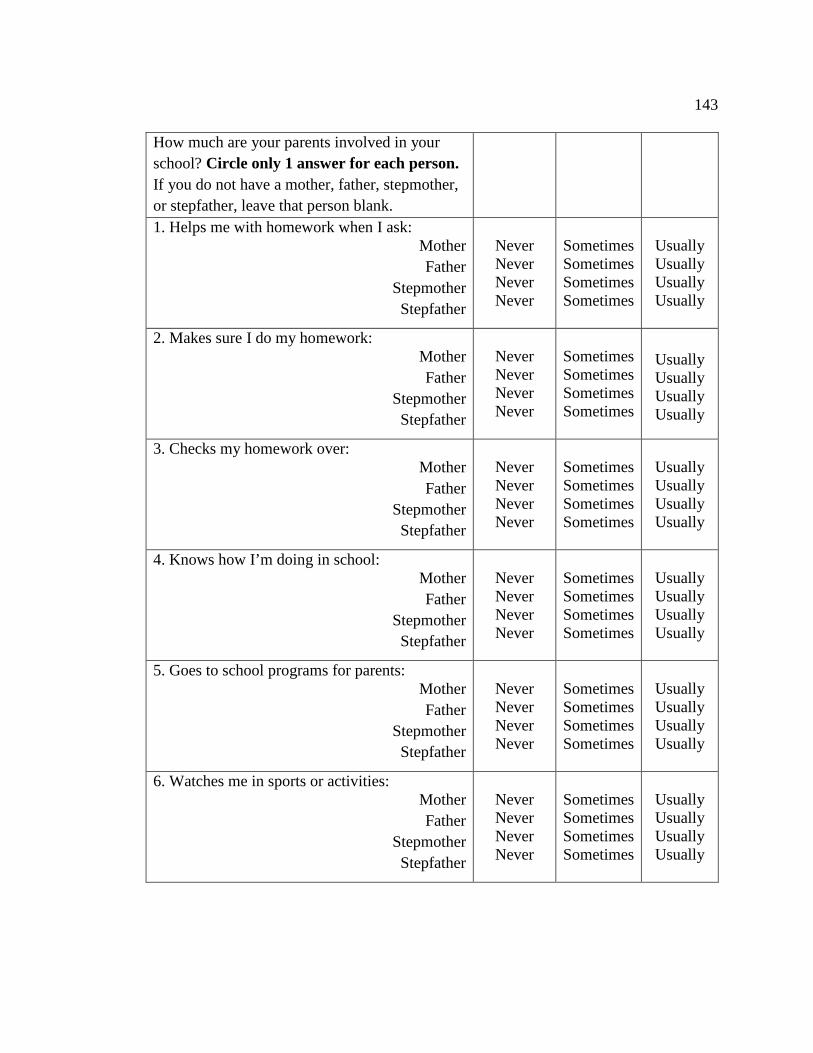
143
How much are your parents involved in your school? Circle only 1 answer for each person. If you do not have a mother, father, stepmother, or stepfather, leave that person blank.
1. Helps me with homework when I ask: Mother Father
Stepmother Stepfather
Never Never Never Never
Sometimes Sometimes Sometimes Sometimes
Usually Usually Usually Usually
2. Makes sure I do my homework:
Mother Father
Stepmother Stepfather
Never Never Never Never
Sometimes Sometimes Sometimes Sometimes
Usually Usually Usually Usually
3. Checks my homework over: Mother Father
Stepmother Stepfather
Never Never Never Never
Sometimes Sometimes Sometimes Sometimes
Usually Usually Usually Usually
4. Knows how I’m doing in school: Mother Father
Stepmother Stepfather
Never Never Never Never
Sometimes Sometimes Sometimes Sometimes
Usually Usually Usually Usually
5. Goes to school programs for parents: Mother Father
Stepmother Stepfather
Never Never Never Never
Sometimes Sometimes Sometimes Sometimes
Usually Usually Usually Usually
6. Watches me in sports or activities: Mother Father
Stepmother Stepfather
Never Never Never Never
Sometimes Sometimes Sometimes Sometimes
Usually Usually Usually Usually

144

145
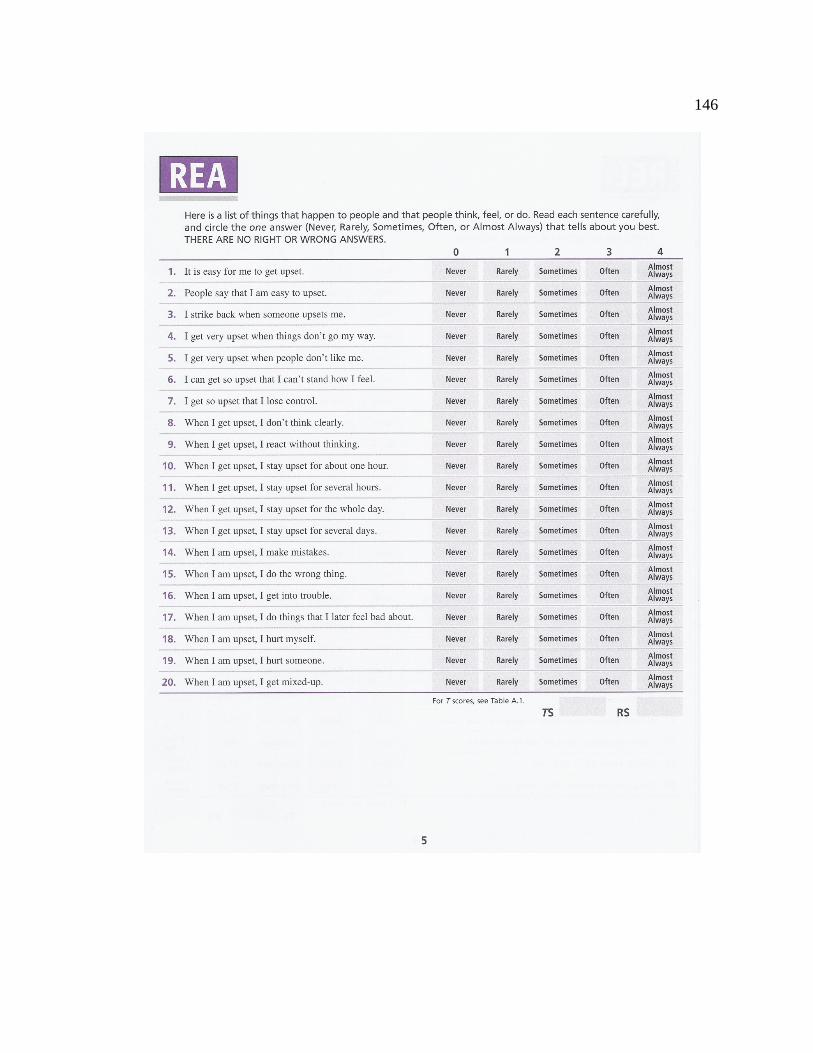
146

147
Directions: On a scale of 1 to 4 (1 = strongly disagree, 4 = strongly agree), how do you feel about school? Please circle your response.
1. I feel proud of being a part of my school.
2. I feel that I am treated with respect at my school.
3. I can get a good job even if my grades are bad.
4. The only time I get attention in school is when I cause
trouble.
5. I participate in activities at my school.
6. Doing well in school is important in life.
7. Most of the things we learn in class are useless.
8. I feel that teachers don’t care in this school.
9. I would rather be out of school.
10. I have teachers that I can talk to at my school.
11. Doing well in school is useful for getting a job.
12. School is one of my favorite places to be.
13. I feel that people are interested in me at my school.
14. I feel that school is a waste of time.
15. I feel that it is a mistake to drop out of school.
16. School is more important than most people think.
(1) (2) (3) (4)
(1) (2) (3) (4)
(1) (2) (3) (4)
(1) (2) (3) (4)
(1) (2) (3) (4) (1) (2) (3) (4)
(1) (2) (3) (4)
(1) (2) (3) (4)
(1) (2) (3) (4)
(1) (2) (3) (4) (1) (2) (3) (4)
(1) (2) (3) (4)
(1) (2) (3) (4) (1) (2) (3) (4)
(1) (2) (3) (4)
(1) (2) (3) (4)
Str
ongl
y
Dis
agre
e D
isag
ree
Agr
ee
Str
ongl
y
Agr
ee

148
The next questions are about your personal background. Remember that your answers will be kept private. 1. Are you _____ male or _____ female? (Check one answer.)
2. Which Noble campus do you go to? ________________________________________
3. Do you receive free or reduced lunch? _____ yes _____no (Check one answer.)
4. What grade are you in? ______9th ______ 10th _____11th _____12th
5. What is your race/ethnicity? ____________________________________________
6. Have you ever been required to repeat a grade in school? _____ yes _____ no
7. How far did your mother, stepmother, or female guardian go in school? (If you do
not live with your mother, stepmother, or a female guardian, please skip this question.)
_____ some grade school _____some high school _____ high school graduate/GED _____ associate’s degree _____ some college _____ bachelor’s degree _____ master’s degree _____ doctorate or professional degree _____ other (please describe) _________________________
8. How far did your father, stepfather, or male guardian go in school? (If you do not live
with your father, stepfather, ir a male guardian, please skip this question.)
_____ some grade school _____some high school _____ high school graduate/GED _____ associate’s degree _____ some college _____ bachelor’s degree _____ master’s degree _____ doctorate or professional degree _____ other (please describe) _________________________

149
9. What kind of job does your mother (or stepmother/female guardian) have?
__________________________
10. What kind of job does your father (or stepfather/male guardian) have? __________________
11. What was your family’s income last year? If you aren’t sure, please estimate.
_____ less than $15,000
_____ $15,000 - $25,000
_____ $25,000 - $40,000
_____ $40,000 - $60,000
_____ over $60,000
12. How often do you come to class and find yourself without these things: (Circle 1 on
each line)
Pencil/pen or paper Never Seldom Often Usually
Books Never Seldom Often Usually
Your homework done Never Seldom Often Usually
13. Last school year, how often did the following events occur? (Circle 1 on each line)
I was sent to the office because I was misbehaving.
Never Once or twice
More than twice
My parents were contacted about my behavior.
Never Once or twice
More than twice
I got into a fight with another student. Never Once or twice
More than twice

150
14. In the following subjects, how much time do you spend on homework each week?
Math None Less than 1 hour
2 hours 4-6 hours 7-9 hours 10 or more hours
Science None Less than 1 hour
2 hours 4-6 hours 7-9 hours 10 or more hours
English None Less than 1 hour
2 hours 4-6 hours 7-9 hours 10 or more hours
Social Studies
None Less than 1 hour
2 hours 4-6 hours 7-9 hours 10 or more hours
All Other Subjects
None Less than 1 hour
2 hours 4-6 hours 7-9 hours 10 or more hours
15. How many sports or extracurricular activities do you participate in at school?
_________________
Thank you very much for completing this questionnaire! Please place it in the drop box.
151
REFERENCES
Alspaugh, J. W. (1996). The longitudinal effects of socioeconomic status on elementary school achievement. Retrieved from ERIC database. (ERIC Document Reproduction Service No. ED397120).
Alva, S. A. (1991). Academic invulnerability among Mexican-American students: The
importance of protective resources and appraisals. Hispanic Journal of Behavioral Sciences, 13(1), 18-34.
Archambault, I., Janosz, M., Fallu, J., & Pagani, L.S. (2009). Student engagement and its
relationship with early high school dropout. Journal of Adolescence, 32, 651-670. Arias, M. B. (1986). The context of education for Hispanic students: An overview.
American Journal of Education, 95(1), 26-57. Ashton, P. T., & Webb, R. B. (1986). Making a difference: Teachers' sense of efficacy
and student achievement. New York: Longman. Balfanz, R., & Letgers, N. (2004). Locating the dropout crisis. Baltimore, MD: Johns
Hopkins University. Bandura, A. (1997). Self-efficacy: The exercise of control. New York: W. H. Freeman. Battin-Pearson, S., Newcomb, M. D., Abbott, R. D., Hill, K. G., Catalano, R. F., &
Hawkins, J. D. (2000). Predictors of early high school dropout: A test of five theories. Journal of Educational Psychology, 92, 568-582.
Benard, B. (1991). Fostering resiliency in kids: Protective factors in the school,
community, and family. (ERIC Document Reproduction Service No. ED 335781). Benard, B. (2004). Resiliency: What we have learned. San Francisco, CA: WestEd. Borman, G.D., & Overman, L. T. (2004). Academic resilience in mathematics among
poor and minority students. Elementary School Journal, 104, 177-195. Bridgeland, J. M., diIulio, J. J., Jr., & Morrison, K. B. (2006). The silent epidemic:
Perspectives of high school dropouts. Retrieved June 1, 2009 from http://www.civicenterprises.net/pdfs/thesilentepidemic3-06.pdf.

152
Bryk, A. S., & Schneider, B. (2002). Trust in schools: A core resource for improvement. New York: Russell Sage Foundation.
Buriel, R. (1983). Teacher student interactions and their relationship to student
achievement: A comparison of Mexican American and Anglo-American children. Journal of Educational Psychology, 75, 889-897.
Cairns, R.B., Cairns, B. D. & Neckerman, H.J. (1989). Early school dropout:
Configurations and determinants. Child Development, 60, 1437-1452. Chicago Public Schools. (2009). Stats and Facts. Retrieved June 15, 2009 from
http://www.cps.edu/About_CPS/At-a-glance/Pages/Statspercent20andpercent20facts.aspx.
Christenson, S. L. (1995). Best practices in supporting home-school collaboration. In A.
Thomas, & J. Grimes (Eds.), Best practices in school psychology-III (pp. 253-2670. Washington, DC: National Association of School Psychologists.
Christenson, S. L., & Thurlow, M. L. (2004). Keeping kids in school: Efficacy of check
and connect for dropout prevention. NASP Communiqué, 32(6), 37-40. Clark, M.L. (1991). Social identity, peer relations, and academic competence of African
American adolescents. Education and Urban Society, 24(1), 41-52. Columbia University. (2005). The academic achievement gap: Facts and figures.
Retrieved June 6, 2009 from: http://www.tc.edu/news/article.htm?id=5183. Crosnoe, R., & Elder, G.H., Jr.(2004). Family dynamics, supportive relationships, and
educational resilience during adolescence. Journal of Family Issues, 25, 571-602. Cousins, J., & Walker, C. (1995). Predictors of educators' valuing of systemic inquiry in
schools. Canadian Journal of Program Evaluation, Special Issue, 25-35. Cox, D. D. (2005). Evidence-based interventions using home-school collaboration.
School Psychology Quarterly, 20(4), 473-497. Currie, J., & Thomas, D. (1995). Does Head Start make a difference? American
Economic Review, 85(3), 341-364. Darling-Hammond, L. (2007). The flat earth and education: How America’s commitment
to equity will determine our future. Educational Researcher, 36(6), 318-334.
153
Delpit, L. (1992). Acquisition of literate discourse: Bowing before the master? Theory into Practice, 31(4), 296-302.
Doll, E., & Lyon, M. A. (1998). Risk and resilience: Implications for the delivery of
educational and mental health services in schools. School Psychology Review, 27, 348-363.
Edmonds, R. (1979). Effective schools for the urban poor. Educational Leadership,
37(1), 15-24. Espinoza-Herold, M. (2003). Issues in Latino Education. Boston, MA: Allyn & Bacon. Evans, G. W. (2004). The environment of childhood poverty. American Psychologist,
59(2), 77-92. Finn, D. J. (1989). Withdrawing from school. Review of Educational Research, 59(2),
117-142. Finn, J. D., & Rock, D. A. (1997). Academic success among students at risk for school
failure. Journal of Applied Psychology, 82, 221-234. Flores, A. (2007). Examining disparities in mathematics education: Achievement gap or
opportunity gap? The High School Journal, 91(1), 29-42. Fordham, S., & Ogbu, J. U. (1986). Black students' school success: Coping with the
"burden of acting White.” Urban Review, 18, 176-206. Fredricks, J. A., Blumenfeld, P. C., & Paris, A. H. (2004). School engagement: Potential
of the concept, state of the evidence. Review of Educational Research, 74(1), 59-109.
Fry, R. (2003). Hispanic youth dropping out of U.S. schools: Measuring the challenge.
Washington, DC: Pew Hispanic Center. Fry, R. (2004). Improving young Hispanic college graduation rates: Beyond preparation
and affirmative action. Washington, DC: Pew Hispanic Center. Gandara, P. (1982). Passing through the eye of the needle: High-achieving Chicanas.
Latino Journal of Behavioral Sciences, 4, 167-179. Gandara, P. (2008). The crisis in the education of Latino students. Retrieved May 17,
2009 from http://www.nea.org/home/17404.htm.

154
Gandara, P., & Contreras, F. (2009). The Latino education crisis: The consequences of
failed social policies. Cambridge, MA: Harvard University Press. Gándara, P., Rumberger, R., Maxwell-Jolly, J., & Callahan, R. (2003). English learners in
California schools: Unequal resources, unequal outcomes. Educational Policy Analysis Archives. Downloaded March 10, 2009, from http://epaa.asu.edu/epaa/v11n36/.
Garmezy, N. (1991). Resiliency and vulnerability to adverse developmental outcomes
associated with poverty. American Behavioral Scientist, 43(4), 416-460. Garmezy, N., Masten, A.S., & Tellegen, A. (1984).The study of stress and competence in
children. A building block for developmental psychopathology. Child Development, 55(1), 97-111.
Gleason, P., & Dynarski,M. (2002). Do we know whom to serve? Issues in using risk
factors to identify dropouts. Journal of Education for Students Placed at Risk, 7(1) 25-41.
Goddard, R. D. (2000). Collective efficacy: A neglected construct in the study of schools
and student achievement. Journal of Educational Psychology, 93(3), 467-476. Goddard, R. D., Hoy, W. K., & Woolfolk Hoy, A. (2000). Collective teacher efficacy: Its
meaning, measure, and impact on student achievement. American Educational Research Journal, 37, 479-508.
Goddard, R. D., Sweetland, S. R., & Hoy, W. K. (2000). Academic emphasis of urban
elementary schools and student achievement: A multi-level analysis. Educational Administration Quarterly, 36, 683-702.
Gonzalez, R., & Padilla, A. M. (1997). The academic resilience of Mexican American
high school students. Hispanic Journal of Behavioral Sciences, 19, 301-317. Gordon, E., & Yowell, C. (1994). Cultural dissonance as a risk factor in the development
of students. In R. J. Rossi (Ed.), Schools and students at-risk (pp. 51-69). New York: Teacher College Press.
Gordon, K. (1996). Resilient Latino youths' self-concept and motivational patterns.
Latino Journal of Behavioral Sciences, 18(1), 63-73.

155
Gorman-Smith, D., & Tolan, P. H. (2003). Positive adaptation among youth exposed to community violence. In S. Luthar (Ed.), Resilience and vulnerability in the context of childhood adversities (pp. 392-413). New York: Cambridge University Press.
Henderson, A. T., & Mapp, K. L. (Eds.). (2002). A new wave of evidence: The impact of
school, family, and community connections on student achievement [electronic version]. Austin, TX: National Center for Family and Community Connections with Schools, Southwest Educational Development Laboratory.
Hess, R., & D'Amato, R. (1996). High school completion among Mexican American
children: Individual and family background variables. School Psychology Quarterly, 11, 353-368.
Hirschman, C. (2001). The educational enrollment of immigrant youth: A test of the
segmented-assimilation hypothesis. Demography, 3, 317-336. Hoy, A. W., Hoy, W. K., & Kurtz, N. M. (2008). Teacher's academic optimism: the
development and test of a new construct. Teaching and Teacher Education, 24, 821-832.
Hoy, W. K., & Feldman, J. (1987). Organizational health: The concept and its measure.
Journal of Research and Development in Education, 20, 30-38. Hoy, W. K., Sweetland, S. R., & Smith, P. A. (2002). Toward an organizational model of
achievement in high schools: The significance of collective efficacy. Educational Administration Quarterly, 38(1), 77-93.
Hoy, W. K., & Tschannen-Moran, M. (2003). The conceptualization and measurement of
faculty trust in schools. In W. K. Hoy, & C. Miskel (Eds.). Studies in leading and organizing schools (pp. 181-207). Greenwich, CT: Information Age.
Hoy, W. K., Tarter, C. J., & Kottkamp, R. B. (1991). Open schools/healthy schools:
Measuring organizational climate. Beverly Hills, CA: Sage. Hoy, W. K, Tarter, C. J., & Woolfolk Hoy, A. (2006) Academic optimism of schools: A
force for student achievement. American Educational Research Journal, 43(3), 425-446.
Jencks, C., & Phillips, M. (1998). The black-white test score gap: An introduction. In C.
Jencks, and M. Phillips (Eds.), The black-white test score gap (pp. 1-51). Washington, DC: Brookings Institution.

156
Jimerson, S., Reschly, A.L., & Hess, R. (2008). Best practices in increasing the
likelihood of school completion. In A. Thomas, & J. Grimes (Eds.). Best practices in school psychology - 5th Ed (pp. 1085-1097). Bethesda, MD: National Association of School Psychologists.
Kaufman, J., Cook, A., Arny, L., Jones, B., & Pittinsky, T. (1994). Problems defining
resiliency: Illustrations from the study of maltreated children. Development and Psychopathology, 6, 215-229.
Kellaghan, T., Sloane, K., Alvarez, B., & Bloom, B. S. (1993). The home environment
and school learning: Promoting parental involvement in the education of children. San Francisco, CA: Jossey-Bass.
Kolvin, I., Miller, F. J., Fleeting, M., & Kolvin, P.A. (1988). Social and parenting factors
affecting criminal offence rates: Findings from the Newcastle Thousand Family Study. The British Journal of Psychiatry, 152, 80-90.
LaRoche, M., & Shriberg, D. (2004). High stakes exams and Latino students: Toward a
culturally sensitive education for Latino children in the United States. Journal of Educational and Psychological Consultation, 15(2), 205-223.
Lake, R. J. & Rainey, L. (2005). Chasing the blues away: Charter schools scale up in
Chicago. Progressive Policy Institute. Retrieved from ERIC database. Lee, J. (2004). Multiple facets of inequality in racial and ethnic achievement gaps.
Peabody Journal of Education, 79(2), 51-73. Luthar, S. S. (2006). Resilience in development: A synthesis of research across five
decades. In D. Cicchetti, & D. J. Cohen (Eds.), Developmental psychopathology: Risk, disorder, and adaptation (pp. 740-795). New York: Wiley.
Luthar, S. S., Cicchetti, D., & Becker, B. (2000). The construct of resilience: A critical
evaluation and guidelines for future work. Child Development, 71, 543-562. Martin, A. J. (2002). Motivation and academic resilience: Developing a model for student
enhancement. Australian Journal of Education, 46(1), 34-49. Martin, A. J., & Marsh, H. W. (2006). Academic resilience and its psychological and
educational correlates: A construct validity approach. Psychology in the Schools, 43(3), 267-281.

157
Mascall, B., Leithwood, K., Straus, T., & Sacks, R. (2008). The relationship between distributed leadership and teachers’ academic optimism. Journal of Educational Administration, 46(2), 214-228.
Masten, A. S. (2001). Ordinary magic: Resilience processes in development. American
Psychologist, 56, 227-238. Masten, A. S., & Coatsworth, J.D. (1995). Competence, resilience, and psychopathology.
In D. Cicchetti, & D. Cohen (Eds.), Developmental psychopathology, Vol. 2: Risk, disorder, and adaptation (pp.715-752), New York: Wiley.
Masten, A. S., & Coatsworth, J. D. (1998). The development of competence in favorable
and unfavorable environments: Lessons from research on successful children. American Psychologist, 53, 205-220.
Masten, A. S, Garmezy, N., Tellegen, A., Pellegrini, D. S., Larkin, K., & Larsen, A.
(1988). Competence and stress in school children: The moderating effects of individual and family qualities. Journal of Child Psychiatry and Psychology, 29, 745-64.
McMillan, J. H., & Reed, D. F. 1994. At-risk students and resiliency: Factors
contributing to academic success. Clearing House 67(3), 137-40. Miles, M. B. (1969). Planned change and organizational health: Figure and ground. In F.
D. Carver, & T. J. Sergiovanni (Eds.), Organizations and human behavior. New York: McGraw-Hill.
Mortimore, P., Sammons, D., Stoll, L., Lewis, P., & Ecob, R. (1988). School matters:
The junior years. London: Open Books. Murnane, R. J., & Levy, F. (1996). Teaching the new basic skills: Principles for
educating children to thrive in a changing economy. New York: Free Press. National Governors’ Association. (2005). Closing the achievement gap. Retrieved May
29, 2009 from http://www.subnet.nga.org/educlear/achievement/. Noble Network of Charter Schools. (2009). School website. Retrieved May 1, 2009 from
noblenetwork.org. Noguera, & Wing. (2006). Unfinished business: Closing the racial achievement gap in
our schools. San Francisco, CA: John Wiley and Sons.

158
Orfield, G., & Yun, J. (1999). Resegregation in American schools. Boston, MA: The Civil Rights Project, Harvard University. (ED 445 171). Retrieved May 2, 2009 from http://www. law.harvard.edu/civilrights/publications/resegregation99/ resegregation99.html.
Passel, J., & Cohn, D. (2008). U.S. Population projections: 2005-2050. Pew Hispanic
Center. Retrieved March 10, 2009 from http://pewhispanic.org/files/reports/85.pdf.
Payne, R. S. (1994). The relationship between teachers’ beliefs and sense of efficacy and
their significance to urban LSES minority students. Journal of Negro Education, 63, 181-196.
Perie, M., Moran, R., & Lutkus, A. D. (2005). NAEP 2004 Trends in Academic Progress:
Three Decades of Student Performance in Reading and Mathematics. NCES 2005-464. Washington, DC: U.S. Department of Education, National Center for Education Statistics.
Pianta, R. C., & Walsh, D. J. (1998). Applying the construct of resilience in schools:
Cautions from a developmental systems perspective. School Psychology Review, 27, 407-417.
Price-Embury, S. (2005). Resiliency scales for children and adolescents: A profile of
personal strengths. San Antonio, TX: Harcourt Assessment, Inc. Raffaele, L. M., & Knoff, H. M. (1999). Improving home-school collaboration with
disadvantaged families: Organizational principles, perspectives, and approaches. School Psychology Review, 28(3), 448-467.
Rak, C. F., & Patterson, L. E. (1996). Promoting resilience in at-risk children. Journal of
Counseling and Development, 74(4), 368-373. Reschly, A. L., & Christenson, S. L. (2006). Prediction of dropout among students with
mild disabilities: A case for the inclusion of student engagement variables. Remedial and Special Education, 27(5), 276-292.
Ross, J. A. (1998). The antecedents and consequences of teacher efficacy. In J. Brophy
(Ed.), Advances in research on teaching, Vol. 7 (pp. 49-74). Greenwich, CT: JAI Press.
Ruiz, Y. (2002). Predictors of academic resiliency for Latino middle school students.
Unpublished dissertation. Retrieved from ProQuest Dissertations and Theses.

159
Rutter, M. (1987). Psychosocial resilience and protective mechanisms. In J. Rolf, A.
Masten, D. Cichetti, K. Neuchterlein, & S. Weintraub (Eds.), Risk and protective factors in the development of psychopathology (pp. 181-214). New York: Cambridge University Press.
Rutter, M., Maughan, B., Mortimore, P, Ouston, J., & Smith, A. (1979). Fifteen thousand
hours: Secondary schools and their effects on children. Cambridge, MA: Harvard University Press.
Ryff, C. D., & Singer, B. (2003). Flourishing under fire: Resilience as a prototype of
challenged thriving. In C. L. M. Keyes, & J. Haidt (Eds.), Flourishing: Positive psychology and the life well-lived (pp. 15-36). Washington DC: American Psychological Association.
Schoon, I., Bynner, J., Joshi, H., Parsons, S., Wiggins, R. D., & Sacker, A. (2002). The
influence, of context, timing, and duration of risk experiences for the passage from childhood to early adulthood. Child Development, 73, 1486-1504.
Schoon, I., & Parsons, S. (2002). Competence in the face of adversity: the influence of
early family environment and long-term consequences. Children and Society, 16(4), 260-272.
Schneider, B., Martinez, S., & Owens, A. (2006). Barriers to educational opportunities
for Hispanics in the United States. In M. Tienda, & F. Mitchell (Eds.), Hispanics and the future of America (pp. 179-221). Washington, DC: The National Academies Press.
Schneider, B., & Stevenson, D. (1999). The ambitious generation: America’s teenagers,
motivated but directionless. New Haven, CT: Yale University Press. Skinner, E.A., & Belmont, M.J. (1993). Motivation in the classroom: Reciprocal effects
of teacher behavior and student engagement across the school year. Journal of Educational Psychology, 85(4), 571-581.
Smith, P. A., & Hoy, W. K. (2007). Academic optimism and student achievement in
urban elementary schools. Journal of Educational Administration, 45, 556-568. Steinberg, L., Lamborn, S. D., Dornbusch, S. M., & Darling, N. (1992). Impact of
parenting practices on adolescent achievement: Authoritative parenting, school involvement, and encouragement to succeed. Child Development, 63, 1266-1281.

160
Strutchens, M. E., Lubienski, S. McGraw, R., & Westbrook, S. K. (2004). NAEP findings regarding race/ethnicity: Students’ performance, school experiences, attitudes and beliefs, and family influences. In P. Kloosterman, & F.K. Lester (Eds.), Results and interpretations of the 1990 through 2000 mathematics assessments of the National Assessment of Educational Progress (pp. 269-304). Reston, VA: National Council of Teachers of Mathematics.
Suarez-Orozco, M. M. (1991). Immigrant adaptation to schooling: A Hispanic case. In M.
Gibson, & J. Ogbu (Eds.), Minority status and schooling: A comparative study of immigrant and involuntary minorities (pp. 37-61). New York: Garland Press.
Sullivan, T. A. (2000). A demographic portrait. In P. S. J. Cafferty and D. W. Engstrom
(Eds.), An agenda for the twenty-first century: Hispanics in the United States (pp. 1-29). New Brunswick, NJ: Transactions Publishers.
Therrien, M., & Ramirez, R. (2000). The Hispanic population in the United States. U.S.
Bureau of the Census, Current Population Reports, P20-535. Washington, DC: U.S. Government Printing Office.
Thernstrom, A., & Thernstrom, S. (2003). No excuses: Closing the racial gap in learning.
New York: Simon and Schuster. Tiet, Q. Q., & Huizinga, D. (2002). Dimensions of the construct of resilience and
adaptation among inner city youth. Journal of Adolescent Research, 17, 260-276. U.S. Census Bureau. (2001). School Enrollment in the United States—Social and
Economic Characteristics of Students. Washington, DC: U.S. Department of Commerce. Retrieved October 24, 2008, from http://fermat.nap.edu/ books/0309100518/html/179.html.
U.S. Census Bureau. (2002). Current population questionnaire. Washington, DC:
Author, Ethnic and Hispanic Statistics Branch, Population Division. Retrieved May 24, 2009 from http://www.census.gov/population/socdemo/hispanic/ppl-165/tab07-2.txt.
U.S. Census Bureau. (2003). Current population questionnaire. Annual Social and
Economic Supplement. Washington, DC: Author. U.S. Census Bureau. (2004). U.S. Census Press Release: Census Bureau Projects
Tripling of Hispanic and Asian Populations in 50 Years. Retrieved February 12, 2009 from http://www.census.gov/Press-Release/www/releases/archives/ population/001720.html.

161
U.S. Department of Education, National Center for Education Statistics. (1995).
Approaching kindergarten: A look at preschoolers in the United States (NCES 95-280). Washington, DC: Author.
U.S. Department of Education, National Center for Education Statistics. (1999). Home
literacy activities and signs of children’s emerging literacy (NCES 2000026). Washington, DC: Author.
U.S. Department of Education, National Center for Education Statistics. (1999). The
educational progress of Hispanic students. Washington, DC: U.S. Department of Education.
U.S. Department of Education, National Center for Education Statistics (2001).
Educational achievement and Black-White inequality. Washington, DC: U.S. Department of Education.
U.S. Department of Education, National Center for Education Statistics. (2003). Status
and trends in the education of Hispanics (NCES 2003-008). Washington, DC: Author.
U.S. Department of Education, National Center for Education Statistics. (2004a).
Dropout rates in the United States: 2001 (NCES 2005-045). Washington, DC: Author.
U.S. Department of Education, National Center for Education Statistics. (2004b). Public
high school dropouts and completers from the Common Core of Data: School year 2000–01 (NCES 2004-310). Washington, DC: Author.
U.S. Department of Education, National Center for Education Statistics. (2005). The
nation's report card: 12th-grade reading and mathematics 2005. Washington, DC: U.S. Department of Education.
U.S. Department of Education, National Center for Education Statistics. (2008). The
nation’s report card: Long-term trend. Washington, DC: U.S. Department of Education.
Valdez, V., & Espino, J. (2003). Statistics for the Latino majority schools in the Chicago
Public Schools: Part 2, a closer look. Washington DC: U.S. Department of Education.

162
Valenzuela, A. (1999). Subtractive schooling: U.S.-Mexican youth and the politics of caring. Albany, NY: SUNY Press.
Velez, W., & Saenz, R. (2001). Toward a comprehensive model of the school leaving
process of Latinos. School Psychology Quarterly, 16(4), 445-467. Voelkl, K.E. (1996). Measuring students’ identification with school. Educational and
Psychological Measurement, 56(5), 760-770. Voelkl, K.E. (1997). Identification with schools. American Journal of Education, 105,
294-318. Wahlberg, H. J. (1984). Families as partners in educational productivity. Phi Delta
Kappan, 65, 397-400. Wang, M., Haertel, G., & Wahlberg, H. (1994). Educational resilience in inner cities. In
M. C. Wang, & E. W. Gordon (Eds.), Educational resilience in inner-city America: Challenges and prospects (pp. 45-72). Hillsdale, NJ: Erlbaum.
Waxman, H. C., Huang, S. L., & Padron, Y. N. (1997). Motivation and learning
environment differences between resilient and non-resilient Latino middle school students. Hispanic Journal of Behavioral Sciences, 19(2), 137-155.
Wehlage, G. G., & Rutter, R. A. (1986). Dropping out: How much do schools contribute
to the problem? Teachers College Record, 87(3), 374-392. Werner, E. (1984). Research in review: Resilient children. Young Children, 40(1), 68-72. Werner, E. S., & Smith, R. S. (1982). Vulnerable but invincible: A longitudinal study of
resilient children and youth. New York: Adams, Bannister, & Cox. Werner, E. S., & Smith, R. S. (1992). Overcoming the odds: High-risk children from
birth to adulthood. New York: Cornell University Press. Wilson, W.J. (1987). The truly disadvantaged. Chicago, IL: University of Chicago Press. Winfield, L. F. (1994). Developing resilience in urban youth. [On-line]. Oak Brook, IL:
North Central Regional Educational Laboratory. Retrieved March 2, 2009 from http://ceep.crc.uiuc.edu/eecearchive/books/resguide/winfield.pdf.

163
VITA
Christine Fallon was born in Chicago, Illinois in 1968. After graduating from
Northwestern University in 1990 with a Bachelors of Arts degree in Psychology, she was
employed for three years in a residential facility for children with severe emotional and
behavioral issues. In 1994, Christine earned a Master of Arts degree in Counseling
Psychology from Northwestern University. For three years, she was employed as a
therapist in the Young Girls’ Program at the Mercy Home for Boys and Girls, where she
provided individual, group, and family therapy. In 2000, she earned a Master of
Education degree in Special Education from Northeastern Illinois University. She then
worked for eight years at a charter school in Chicago with a predominantly low SES,
Latino student population. In August 2006, Christine entered the Doctoral Program in
School Psychology at Loyola University Chicago. As part of her specialty practicum,
Christine implemented a community service component for first year graduate students in
the School Psychology program.
Christine's professional interests include empowering children, adolescents, and
families; enhancing therapeutic relationships; advocating for social justice; and working
to provide enhanced services to the Latino community. She completed her practicum at
Evanston Township High School in Evanston, Illinois and her pre-doctoral internship at
Deerfield High School in Deerfield, Illinois. Christine currently resides in Chicago,
Illinois.