SCHOOL DISTRICT OF THE BOROUGH OF ENGLEWOOD CLIFFS … · Jennifer Brower Sue Anne Mather...
149
SCHOOL DISTRICT OF THE BOROUGH OF ENGLEWOOD CLIFFS COUNTY OF BERGEN, NEW JERSEY COMPREHENSIVE ANNUAL FINANCIAL REPORT FOR THE FISCAL YEAR ENDED JUNE 30, 2018
Transcript of SCHOOL DISTRICT OF THE BOROUGH OF ENGLEWOOD CLIFFS … · Jennifer Brower Sue Anne Mather...
SCHOOL DISTRICT OF THE
BOROUGH OF ENGLEWOOD CLIFFS
COUNTY OF BERGEN, NEW JERSEY
COMPREHENSIVE ANNUAL FINANCIAL REPORT
FOR THE FISCAL YEAR ENDED
JUNE 30, 2018
School Districtof
Englewood Cliffs
ENGLEWOOD CLIFFS PUBLIC SCHOOLSEnglewood Cliffs, New Jersey
Comprehensive Annual Financial ReportYear Ended June 30, 2018
Comprehensive Annual Financial Report
of the
ENGLEWOOD CLIFFS PUBLIC SCHOOLSEnglewood Cliffs, New Jersey
Year Ended June 30, 2018
Prepared by
Sue Anne MatherBoard Secretary/Business Administrator
OUTLINE OF CAFR
INTRODUCTORY SECTION
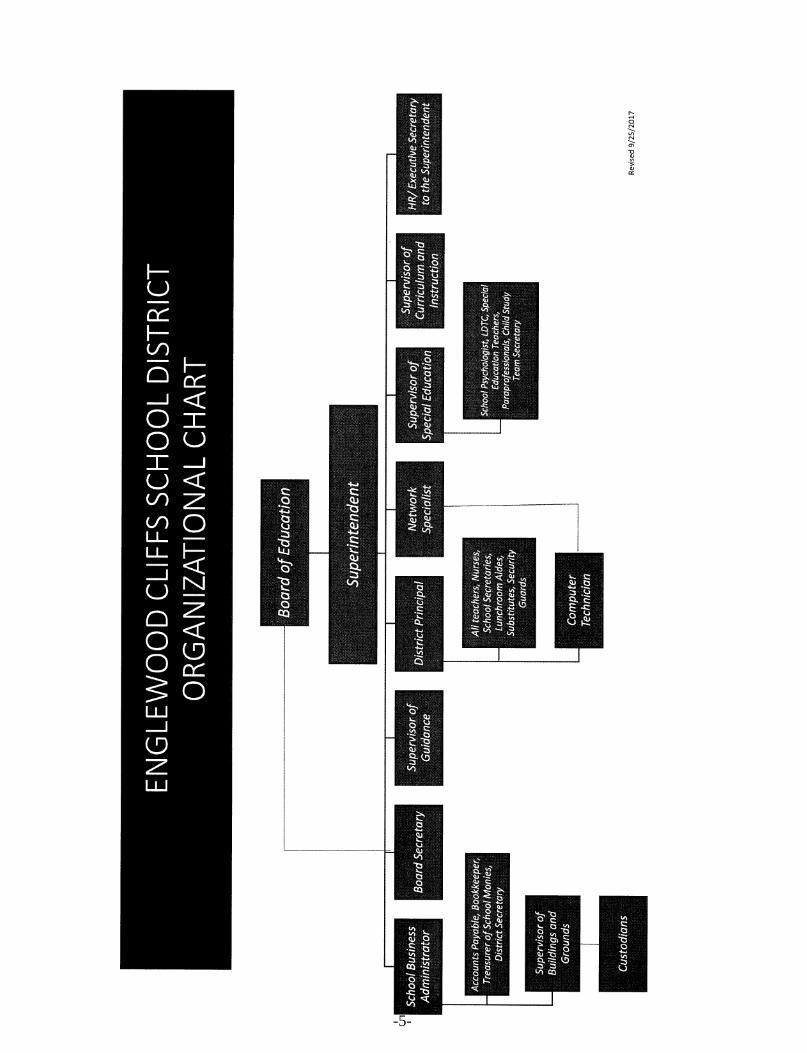
Letter of Transmittal. . . . . . . . . . . . . . . . . . . . . . . . . . . . . . . . . . . . . . . . . . . . . . . . . . . . . . . . . . . . . 1Organizational Chart. . . . . . . . . . . . . . . . . . . . . . . . . . . . . . . . . . . . . . . . . . . . . . . . . . . . . . . . . . . . . 5Roster of Officials.. . . . . . . . . . . . . . . . . . . . . . . . . . . . . . . . . . . . . . . . . . . . . . . . . . . . . . . . . . . . . . 6Consultants and Advisors. . . . . . . . . . . . . . . . . . . . . . . . . . . . . . . . . . . . . . . . . . . . . . . . . . . . . . . . . 7
FINANCIAL SECTION
Independent Auditor's Report. . . . . . . . . . . . . . . . . . . . . . . . . . . . . . . . . . . . . . . . . . . . . . . . . . . . . . 8
Required Supplementary Information - Part IManagement’s Discussion and Analysis.. . . . . . . . . . . . . . . . . . . . . . . . . . . . . . . . . . . . . . . . . . . . . 12
BASIC FINANCIAL STATEMENTS
A. District-wide Financial Statements:
A-1 Statement of Net Position. . . . . . . . . . . . . . . . . . . . . . . . . . . . . . . . . . . . . . . . . . . . . . . . 21A-2 Statement of Activities. . . . . . . . . . . . . . . . . . . . . . . . . . . . . . . . . . . . . . . . . . . . . . . . . . 22
B. Fund Financial Statements:
Governmental Funds:B-1 Balance Sheet. . . . . . . . . . . . . . . . . . . . . . . . . . . . . . . . . . . . . . . . . . . . . . . . . . . . . . . . . 23B-2 Statement of Revenues, Expenditures and Changes in Fund Balances. . . . . . . . . . . . . 24B-3 Reconciliation of the Statement of Revenues, Expenditures, and
Changes in Fund Balances of Governmental Funds to theStatement of Activities. . . . . . . . . . . . . . . . . . . . . . . . . . . . . . . . . . . . . . . . . . . . . . . . 25
Proprietary Funds:B-4 Statement of Net Position. . . . . . . . . . . . . . . . . . . . . . . . . . . . . . . . . . . . . . . . . . . . . . . . 26B-5 Statement of Revenues, Expenses and Changes in Fund Net Position.. . . . . . . . . . . . . 27B-6 Statement of Cash Flows. . . . . . . . . . . . . . . . . . . . . . . . . . . . . . . . . . . . . . . . . . . . . . . . 28
Fiduciary Funds:B-7 Statement of Fiduciary Net Position. . . . . . . . . . . . . . . . . . . . . . . . . . . . . . . . . . . . . . . . 29B-8 Statement of Changes in Fiduciary Net Position. . . . . . . . . . . . . . . . . . . . . . . . . . . . . . 30
Notes to the Financial Statements. . . . . . . . . . . . . . . . . . . . . . . . . . . . . . . . . . . . . . . . . . . . . . . . 31
OUTLINE OF CAFR
Required Supplementary Information - Part II
C. Budgetary Comparison Schedules:
C-1 Budgetary Comparison Schedule - General Fund.. . . . . . . . . . . . . . . . . . . . . . . . . . . . . 67C-1a Not ApplicableC-2 Budgetary Comparison Schedule - Special Revenue Fund.. . . . . . . . . . . . . . . . . . . . . . 72
Notes to the Required Supplementary InformationC-3 Budgetary Comparison Schedule. . . . . . . . . . . . . . . . . . . . . . . . . . . . . . . . . . . . . . . . . . 73
Required Supplementary Information - Part III
L. Schedules Related to Accounting and Reporting for Pensions (GASB 68)
L-1 Schedule of the District's Proportionate Share of the Net PensionLiability – PERS.. . . . . . . . . . . . . . . . . . . . . . . . . . . . . . . . . . . . . . . . . . . . . . . . . . . . 74
L-2 Schedule of District Contributions – PERS. . . . . . . . . . . . . . . . . . . . . . . . . . . . . . . . . . 75L-3 Schedule of the District's Proportionate Share of the Net Pension
Liability – TPAF.. . . . . . . . . . . . . . . . . . . . . . . . . . . . . . . . . . . . . . . . . . . . . . . . . . . . 76L-4 Notes to Requires Schedules of Supplementary Information - Part III.. . . . . . . . . . . . . 77
Other Supplementary Information
D. School Level Schedules: Not Applicable
E. Special Revenue Fund:
E-1 Combining Schedule of Program Revenues and Expenditures -Budgetary Basis. . . . . . . . . . . . . . . . . . . . . . . . . . . . . . . . . . . . . . . . . . . . . . . . . . . . . 78
E-2 Not ApplicableE-3 Not ApplicableE-4 Not ApplicableE-5 Not Applicable
F. Capital Projects Fund:
F-1 Summary Schedule of Revenues, Expenditures, and Changes inFund Balance - Budgetary Basis.. . . . . . . . . . . . . . . . . . . . . . . . . . . . . . . . . . . . . . . . 79
F-1a Schedule of Project Revenues, Expenditures, Project Balances and Project Status - Budgetary Basis - Renovations -North Cliff School. . . . . . . . . . . . . . . . . . . . . . . . . . . . . . . . . . . . . . . . . . . . . . . . . . . 80
F-1b Schedule of Project Revenues, Expenditures, Project Balances and Project Status - Budgetary Basis - Renovations -Upper School. . . . . . . . . . . . . . . . . . . . . . . . . . . . . . . . . . . . . . . . . . . . . . . . . . . . . . . 81
F-2 Summary Statement of Project Expenditures. . . . . . . . . . . . . . . . . . . . . . . . . . . . . . . . . 82
OUTLINE OF CAFR
G. Proprietary Funds:
Enterprise Fund:G-1 Combining Statement of Net Position. . . . . . . . . . . . . . . . . . . . . . . . . . . . . . . . . . . . . . 83G-2 Combining Statement of Revenues, Expenses and Changes in
Fund Net Position. . . . . . . . . . . . . . . . . . . . . . . . . . . . . . . . . . . . . . . . . . . . . . . . . . . . 84G-3 Combining Statement of Cash Flows. . . . . . . . . . . . . . . . . . . . . . . . . . . . . . . . . . . . . . . 85
Internal Service Fund:Not Applicable
H. Fiduciary Funds:
H-1 Combining Statement of Fiduciary Net Position. . . . . . . . . . . . . . . . . . . . . . . . . . . . . . 86H-2 Combining Statement of Changes in Fiduciary Net Position. . . . . . . . . . . . . . . . . . . . . 87H-3 Student Activity Agency Fund - Schedule of Receipts and Disbursements. . . . . . . . . . 88H-4 Payroll Agency Fund - Schedule of Receipts and Disbursements. . . . . . . . . . . . . . . . . 89
I. Long-Term Debt:
I-1 Statement of Serial Bonds.. . . . . . . . . . . . . . . . . . . . . . . . . . . . . . . . . . . . . . . . . . . . . . . 90I-2 Budgetary Comparison Schedule - Debt Service Fund.. . . . . . . . . . . . . . . . . . . . . . . . . 91
J. Statistical Section (Unaudited)
Financial Trends
Introduction to the Statistical Section. . . . . . . . . . . . . . . . . . . . . . . . . . . . . . . . . . . . . . . 92
J-1 Net Position by Component. . . . . . . . . . . . . . . . . . . . . . . . . . . . . . . . . . . . . . . . . . . . . . 94J-2 Changes in Net Position. . . . . . . . . . . . . . . . . . . . . . . . . . . . . . . . . . . . . . . . . . . . . . . . . 95J-3 Fund Balances - Governmental Funds. . . . . . . . . . . . . . . . . . . . . . . . . . . . . . . . . . . . . . 98J-4 Changes in Fund Balances - Governmental Funds. . . . . . . . . . . . . . . . . . . . . . . . . . . . . 99J-5 General Fund - Other Local Revenue by Source. . . . . . . . . . . . . . . . . . . . . . . . . . . . . . 100
Revenue Capacity
J-6 Assessed Value and Estimated Actual Value of Taxable Property.. . . . . . . . . . . . . . . . 102J-7 Direct and Overlapping Property Tax Rates. . . . . . . . . . . . . . . . . . . . . . . . . . . . . . . . . . 103J-8 Principal Property Taxpayers. . . . . . . . . . . . . . . . . . . . . . . . . . . . . . . . . . . . . . . . . . . . . 104J-9 Property Tax Levies and Collections. . . . . . . . . . . . . . . . . . . . . . . . . . . . . . . . . . . . . . . 105
Debt Capacity
J-10 Ratios of Outstanding Debt by Type.. . . . . . . . . . . . . . . . . . . . . . . . . . . . . . . . . . . . . . . 106J-11 Ratios of General Bonded Debt Outstanding. . . . . . . . . . . . . . . . . . . . . . . . . . . . . . . . . 107J-12 Direct and Overlapping Governmental Activities Debt. . . . . . . . . . . . . . . . . . . . . . . . . 108J-13 Legal Debt Margin Information. . . . . . . . . . . . . . . . . . . . . . . . . . . . . . . . . . . . . . . . . . . 109
Demographic and Economic Information
J-14 Demographic and Economic Statistics. . . . . . . . . . . . . . . . . . . . . . . . . . . . . . . . . . . . . . 110J-15 Principal Employers. . . . . . . . . . . . . . . . . . . . . . . . . . . . . . . . . . . . . . . . . . . . . . . . . . . . 111
Operating Information
J-16 Full-time Equivalent District Employees by Function/Program.. . . . . . . . . . . . . . . . . . 112J-17 Operating Statistics. . . . . . . . . . . . . . . . . . . . . . . . . . . . . . . . . . . . . . . . . . . . . . . . . . . . . 113J-18 School Building Information. . . . . . . . . . . . . . . . . . . . . . . . . . . . . . . . . . . . . . . . . . . . . 114J-19 Schedule of Required Maintenance Expenditures for School Facilities.. . . . . . . . . . . . 115J-20 Insurance Schedule. . . . . . . . . . . . . . . . . . . . . . . . . . . . . . . . . . . . . . . . . . . . . . . . . . . . . 116
K. SINGLE AUDIT SECTION
K-1 Independent Auditor’s Report on Internal Control Over Financial Reporting andon Compliance and Other Matters Based on an Audit of Financial StatementsPerformed in Accordance with Government Auditing Standards. . . . . . . . . . . . . . . 118
K-2 Independent Auditor’s Report on Compliance with Requirements Applicable toEach Major State Program and Internal Control Over Compliance inAccordance with the Uniform Guidance and N.J. OMB Circular Letter 15-08.. . . . 120
K-3 Schedule of Expenditures of Federal Awards - Schedule A. . . . . . . . . . . . . . . . . . . . . . 123K-4 Schedule of Expenditures of State Financial Assistance - Schedule B.. . . . . . . . . . . . . 124K-5 Notes to the Schedules of Expenditures of Federal Awards and
State Financial Assistance. . . . . . . . . . . . . . . . . . . . . . . . . . . . . . . . . . . . . . . . . . . . . 125K-6 Schedule of Findings and Questioned Costs.. . . . . . . . . . . . . . . . . . . . . . . . . . . . . . . . . 127K-7 Schedule of Financial, Federal and State Findings. . . . . . . . . . . . . . . . . . . . . . . . . . . . . 128K-8 Summary Schedule of Prior Audit Findings. . . . . . . . . . . . . . . . . . . . . . . . . . . . . . . . . . 129
INTRODUCTORY SECTION
ENGLEWOOD CLIFFS PUBLIC SCHOOLS
143 Charlotte Place
Englewood Cliffs, NJ 07632-2681
Telephone (201) 567-7292 FAX: (201) 567-2738
Jennifer Brower Sue Anne Mather
Superintendent of Schools School Business Administrator/
Board Secretary
January 22, 2019
Honorable President and
Members of the Board of Education
Englewood Cliffs School District
County of Bergen, New Jersey
Dear Board Members:
The comprehensive annual financial report of the Englewood Cliffs School District
(District) for the fiscal year ending June 30, 2018 is hereby submitted. Responsibility
for both the accuracy of the data and the completeness and fairness of the
presentations, including all disclosures, rests with the management of the Board of
Education. To the best of our knowledge and belief, the data presented in this report
is accurate in all material respects and is reported in a manner designed to present
fairly the financial position and results of operations of the various funds and account
groups of the District. All disclosures necessary to enable the reader to gain an
understanding of the District’s financial activities have been included.
The comprehensive annual financial report is presented in four sections: introductory,
financial, statistical and single audit. The introductory section includes this transmittal
letter, the district’s organizational chart and a list of principal officials. The financial
section includes the basic financial statements, management’s discussion and analysis
and the independent auditor’s report. The statistical section includes selected financial
and demographic information, generally presented on a multi-year basis. The District
is required to undergo an annual single audit in conformity with the provisions of the
Title 2 U.S. Code of Federal Regulations Part 200, Uniform Administrative
Requirements, Cost Principles, and Audit Requirements for Federal Awards (Uniform
Guidance) and the schedule of expenditures of state financial assistance as required
by NJ OMB 15-08
-1-
Information related to this single audit, including the auditor’s report on the internal
control structure and compliance with applicable laws and regulations and findings
recommendations are included in the single audit section of the report.
1) Reporting Entity and Its Services: The Englewood Cliffs School District is an
independent reporting entity with the criteria adopted by GASB as established by GASB
Statement No. 14. All funds and account groups of the District are included in this
report. The Englewood Cliffs Board of Education and all its schools constitute the
District’s reporting entity. The District provides a full range of services appropriate to
grade level Pre-K through 8. These programs include regular and inclusive special
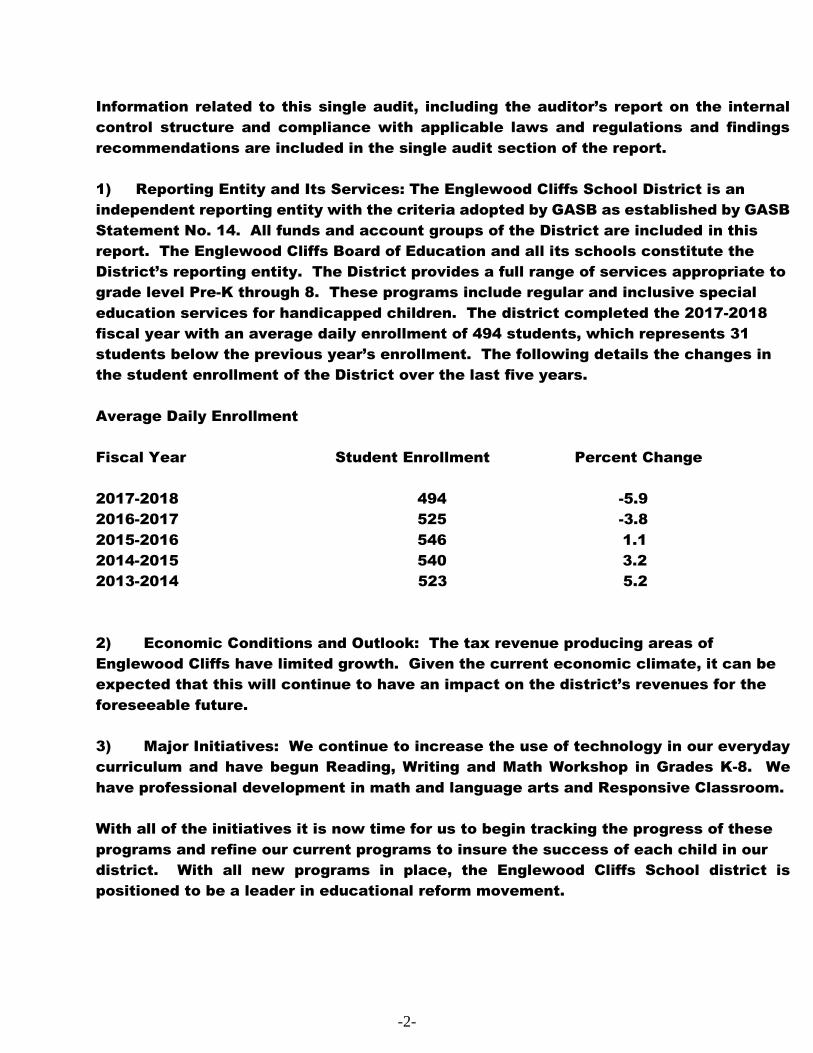
education services for handicapped children. The district completed the 2017-2018
fiscal year with an average daily enrollment of 494 students, which represents 31
students below the previous year’s enrollment. The following details the changes in
the student enrollment of the District over the last five years.
Average Daily Enrollment
Fiscal Year Student Enrollment Percent Change
2017-2018 494 -5.9
2016-2017 525 -3.8
2015-2016 546 1.1
2014-2015 540 3.2
2013-2014 523 5.2
2) Economic Conditions and Outlook: The tax revenue producing areas of
Englewood Cliffs have limited growth. Given the current economic climate, it can be
expected that this will continue to have an impact on the district’s revenues for the
foreseeable future.
3) Major Initiatives: We continue to increase the use of technology in our everyday
curriculum and have begun Reading, Writing and Math Workshop in Grades K-8. We
have professional development in math and language arts and Responsive Classroom.
With all of the initiatives it is now time for us to begin tracking the progress of these
programs and refine our current programs to insure the success of each child in our
district. With all new programs in place, the Englewood Cliffs School district is
positioned to be a leader in educational reform movement.
-2-
4) Internal Accounting Controls: Management of the District is responsible for
establishing and maintaining an internal control structure designed to ensure that the
assets of the District are protected from loss, theft and misuse and to ensure that
adequate accounting data are compiled to allow for the presentation of financial
statements in conformity with generally accepted accounting principles (GAAP). The
internal control structure is designed to provide reasonable, but not absolute,
assurance that these objectives are met. The concept of reasonable assurance
recognizes that (1) the cost of a control should not exceed the benefits likely to be
derived and (2) the valuation of costs and benefits require estimate and judgments by
management.
As a recipient of federal and state financial assistance, the District also is responsible
for ensuring that an adequate internal control structure is in place to ensure
compliance with applicable laws and regulations related to those programs. This
internal control structure is also subject to periodic evaluation by the District
management.
As part of the District’s single audit described earlier, tests are made to determine the
adequacy of the internal control structure, including that portion related to federal and
state financial assistance programs, as well as to determine that the District has
complied with applicable laws and regulations.
5) Budgetary Controls: In addition to internal accounting controls, the District
maintains budgetary controls. The objective of these budgetary controls is to ensure
compliance with legal provisions embodied in the annual appropriated budget. Annual
appropriated budgets are adopted for the general fund and the special revenue fund.
The final budget amount as amended for the fiscal year is reflected in the financial
section.
An encumbrance accounting system is used to record outstanding purchasing
commitments on a line item basis. Open encumbrances at year-end are either
canceled or are included as re-appropriations of fund balance in the subsequent year.
Those amounts to be appropriated are reported as reservations of fund balance at
June 30, 2018.
6) Cash Management: The investment policy of the District is guided in large part by
state statute as detailed in “Notes to the Financial Statements”, Note 2. The district
has adopted a cash management plan which requires it to deposit public funds
depositories protected from loss under the provisions of the Governmental Unit Deposit
Protection Act (“GUDPA”) GUDPA was enacted in 1970 to protect Governmental Units
from loss of funds on deposit with failing banking institutions in New Jersey. The law
-3-
requires governmental units to deposit public funds only in public depositories located
in New Jersey, where the funds are secured in accordance with the Act.
7) Risk Management: The Board carries various forms of insurance, including but
not limited to general liability, hazards and theft insurance on property and contents,
fidelity bonds, and student accident. The Board participates in a self-insurance pool
(43 school districts) for workers’ compensation as a member of the Northeast Bergen
County School Board Insurance Group.
8) Other Information - Independent Audit: State statutes require an annual audit by
independent certified public accountants or registered municipal accountants. The
accounting firm of Ferraioli, Wielkotz, Cerullo & Cuva, P.A. was selected by the Board.
In addition to meeting requirements set forth in state statues, the audit also was
designed to meet the requirements of the Title 2 U.S. Code of Federal Regulations, Part
2, Uniform Administrative Requirements, Cost Principles, and Audit Requirements for
Federal Awards (Uniform Guidance), and the schedule of expenditures of state financial
assistance as required by NJ OMB 15-08. The auditor’s report on the general-purpose
financial statements and combined and individual fund statement and schedules is
included in the financial section of this report. The auditor’s report relates specifically
to the single audits are included in the single audit section of this report.
9) Acknowledgements: We would like to express our appreciation to the members
of the Englewood Cliffs School Board for their concern in providing fiscal accountability
to the citizens and taxpayers of the school district and thereby contributing their full
support to the development and maintenance of our financial operations. The
preparation of this report could not have been accomplished without the efficient and
dedicated services of our financial and accounting staff.
Respectfully submitted,
Jennifer Brower Sue Anne Mather
Jennifer Brower Sue Anne Mather
Superintendent of Schools School Business Administrator/
Board Secretary
-4-
m z G)
' m 0~ :::0 0 G) 0 ~o -n N, P. - =--f "Tl -"Tl 0 l/')
z l/')
l> n ,I no IO )> ' :::0 0 ~ -l/')
~ :::0
n ~
-5-

BOROUGH OF ENGLEWOOD CLIFFS SCHOOL DISTRICT
ROSTER OF OFFICIALS
JUNE 30, 2018
TermMembers of the Board of Education Expires
Frank Patti, Jr., President 2019
Marisa R. Pichigian, Vice President 2017
Eugene Chang 2017
Audrey Yon Ho Choi 2017
George Drimones 2018
Edmond Duda 2018
Shanna S. Jafri 2018
Ankur Pandya 2019
Susan Pak 2019
Other Officials
Jennifer Brower, Superintendent of Schools
Siobhan Tauchert, Principal
Sue Anne Mather, Board Secretary/Business Administrator
Charles A. Hangley, Treasurer of School Monies
Stephen R. Fogarty, Esq., Solicitor
-6-
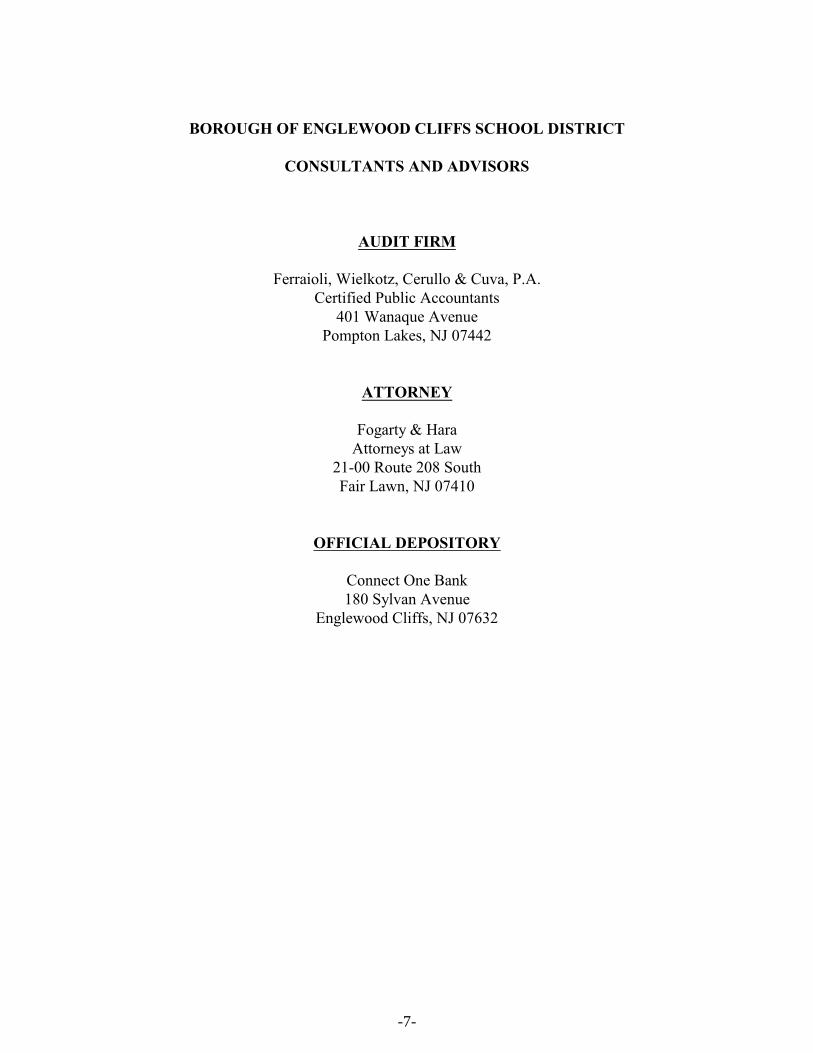
BOROUGH OF ENGLEWOOD CLIFFS SCHOOL DISTRICT
CONSULTANTS AND ADVISORS
AUDIT FIRM
Ferraioli, Wielkotz, Cerullo & Cuva, P.A.Certified Public Accountants
401 Wanaque AvenuePompton Lakes, NJ 07442
ATTORNEY
Fogarty & HaraAttorneys at Law
21-00 Route 208 SouthFair Lawn, NJ 07410
OFFICIAL DEPOSITORY
Connect One Bank180 Sylvan Avenue
Englewood Cliffs, NJ 07632
-7-

FINANCIAL SECTION
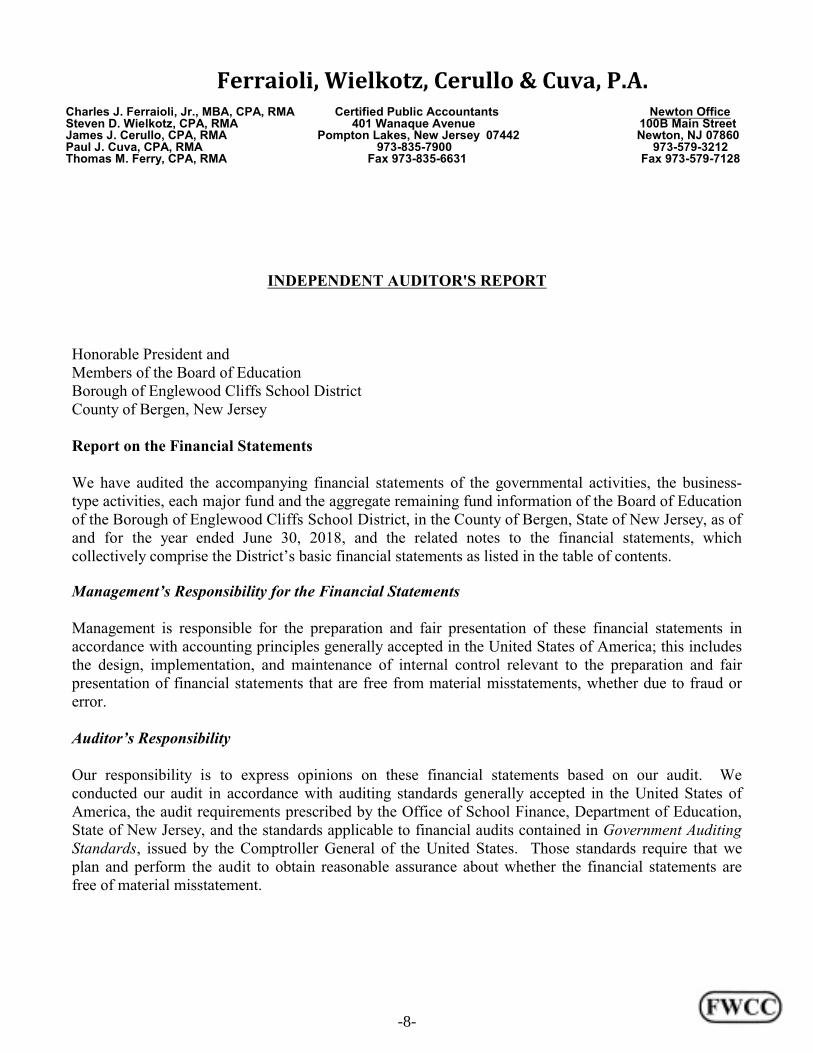
Ferraioli, Wielkotz, Cerullo & Cuva, P.A.Charles J. Ferraioli, Jr., MBA, CPA, RMA Certified Public Accountants Newton Office Steven D. Wielkotz, CPA, RMA 401 Wanaque Avenue 100B Main Street James J. Cerullo, CPA, RMA Pompton Lakes, New Jersey 07442 Newton, NJ 07860Paul J. Cuva, CPA, RMA 973-835-7900 973-579-3212Thomas M. Ferry, CPA, RMA Fax 973-835-6631 Fax 973-579-7128
INDEPENDENT AUDITOR'S REPORT
Honorable President andMembers of the Board of EducationBorough of Englewood Cliffs School DistrictCounty of Bergen, New Jersey
Report on the Financial Statements
We have audited the accompanying financial statements of the governmental activities, the business-type activities, each major fund and the aggregate remaining fund information of the Board of Educationof the Borough of Englewood Cliffs School District, in the County of Bergen, State of New Jersey, as ofand for the year ended June 30, 2018, and the related notes to the financial statements, whichcollectively comprise the District’s basic financial statements as listed in the table of contents.
Management’s Responsibility for the Financial Statements
Management is responsible for the preparation and fair presentation of these financial statements inaccordance with accounting principles generally accepted in the United States of America; this includesthe design, implementation, and maintenance of internal control relevant to the preparation and fairpresentation of financial statements that are free from material misstatements, whether due to fraud orerror.
Auditor’s Responsibility
Our responsibility is to express opinions on these financial statements based on our audit. Weconducted our audit in accordance with auditing standards generally accepted in the United States ofAmerica, the audit requirements prescribed by the Office of School Finance, Department of Education,State of New Jersey, and the standards applicable to financial audits contained in Government AuditingStandards, issued by the Comptroller General of the United States. Those standards require that weplan and perform the audit to obtain reasonable assurance about whether the financial statements arefree of material misstatement.
-8-
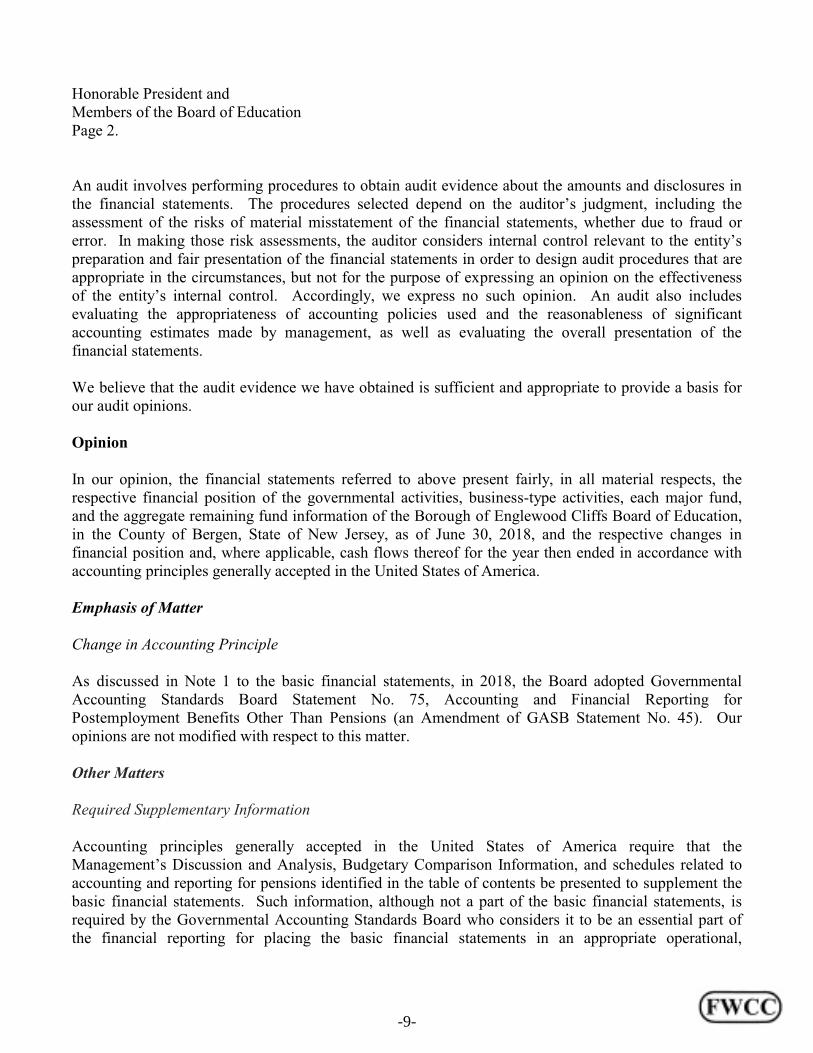
Honorable President andMembers of the Board of EducationPage 2.
An audit involves performing procedures to obtain audit evidence about the amounts and disclosures inthe financial statements. The procedures selected depend on the auditor’s judgment, including theassessment of the risks of material misstatement of the financial statements, whether due to fraud orerror. In making those risk assessments, the auditor considers internal control relevant to the entity’spreparation and fair presentation of the financial statements in order to design audit procedures that areappropriate in the circumstances, but not for the purpose of expressing an opinion on the effectivenessof the entity’s internal control. Accordingly, we express no such opinion. An audit also includesevaluating the appropriateness of accounting policies used and the reasonableness of significantaccounting estimates made by management, as well as evaluating the overall presentation of thefinancial statements.
We believe that the audit evidence we have obtained is sufficient and appropriate to provide a basis forour audit opinions.
Opinion
In our opinion, the financial statements referred to above present fairly, in all material respects, therespective financial position of the governmental activities, business-type activities, each major fund,and the aggregate remaining fund information of the Borough of Englewood Cliffs Board of Education,in the County of Bergen, State of New Jersey, as of June 30, 2018, and the respective changes infinancial position and, where applicable, cash flows thereof for the year then ended in accordance withaccounting principles generally accepted in the United States of America.
Emphasis of Matter
Change in Accounting Principle
As discussed in Note 1 to the basic financial statements, in 2018, the Board adopted GovernmentalAccounting Standards Board Statement No. 75, Accounting and Financial Reporting forPostemployment Benefits Other Than Pensions (an Amendment of GASB Statement No. 45). Ouropinions are not modified with respect to this matter.
Other Matters
Required Supplementary Information
Accounting principles generally accepted in the United States of America require that theManagement’s Discussion and Analysis, Budgetary Comparison Information, and schedules related toaccounting and reporting for pensions identified in the table of contents be presented to supplement thebasic financial statements. Such information, although not a part of the basic financial statements, isrequired by the Governmental Accounting Standards Board who considers it to be an essential part ofthe financial reporting for placing the basic financial statements in an appropriate operational,
-9-
Honorable President andMembers of the Board of EducationPage 3.
economic, or historical context. We have applied certain limited procedures to the requiredsupplementary information in accordance with auditing standards generally accepted in the UnitedStates of America, which consisted of inquiries of management about the methods of preparing theinformation and comparing the information for consistency with management’s responses to ourinquiries, the basic financial statements, and other knowledge we obtained during our audit of the basicfinancial statements. We do not express an opinion or provide any assurance on the informationbecause the limited procedures do not provide us with sufficient evidence to express an opinion orprovide any assurance.
Other Information
Our audit was conducted for the purpose of forming opinions on the financial statements thatcollectively comprise the Borough of Englewood Cliffs Board of Education’s basic financial statements. The introductory section, combining and individual nonmajor fund financial statements and schedule ofexpenditures of federal awards, as required by Title 2 U.S. Code of Federal Regulations Part 200,Uniform Administrative Requirements, Cost Principles, and Audit Requirements for Federal Awards(Uniform Guidance) and the schedule of expenditures of state financial assistance as required by NJOMB 15-08 and statistical section are presented for purposes of additional analysis and are not arequired part of the basic financial statements.
The combining and individual nonmajor fund financial statements and the schedule of expenditures offederal awards, as required by Title 2 U.S. Code of Federal Regulations Part 200, UniformAdministrative Requirements, Cost Principles, and Audit Requirements for Federal Awards (UniformGuidance) and the schedule of expenditures of state financial assistance as required by NJ OMB 15-08are the responsibility of management and were derived from and relates directly to the underlyingaccounting and other records used to prepare the basic financial statements. Such information has beensubjected to the auditing procedures applied in the audit of the basic financial statements and certainadditional procedures, including comparing and reconciling such information directly to the underlyingaccounting and other records used to prepare the basic financial statements or to the basic financialstatements themselves, and other additional procedures in accordance with auditing standards generallyaccepted in the United States of America. In our opinion, the combining and individual nonmajor fundfinancial statements, schedule of expenditures of federal awards, as required by Title 2 U.S. Code ofFederal Regulations Part 200, Uniform Administrative Requirements, Cost Principles, and AuditRequirements for Federal Awards (Uniform Guidance), and the schedule of expenditures of statefinancial assistance as required by NJ OMB 15-08 are fairly stated, in all material respects, in relation tothe basic financial statements as a whole.
The introductory section and statistical data section has not been subject to the auditing proceduresapplied in the audit of the basic financial statements, and accordingly, we do not express an opinion orprovide any assurance on it.
-10-
Honorable President andMembers of the Board of EducationPage 4.
Other Reporting Required by Government Auditing Standards
In accordance with Government Auditing Standards, we have also issued our report dated January 22,2019 on our consideration of the Borough of Englewood Cliffs Board of Education’s internal controlover financial reporting and on our tests of its compliance with certain provisions of laws, regulations,contracts, and grant agreements and other matters. The purpose of that report is to describe the scope ofour testing of internal control over financial reporting and compliance and the results of that testing, andnot to provide an opinion on internal control over financial reporting or on compliance. That report is an
integral part of an audit performed in accordance with Government Auditing Standards in consideringthe Borough of Englewood Cliffs Board of Education’s internal control over financial reporting andcompliance.
Steven D. Wielkotz, C.P.A.Licensed Public School AccountantNo. 816
FERRAIOLI, WIELKOTZ, CERULLO & CUVA, P.A.Certified Public AccountantsPompton Lakes, New Jersey
January 22, 2019
Steven D. Wielkotz
Ferraioli, Wielkotz, Cerullo & Cuva,P.A.
-11-
REQUIRED SUPPLEMENTARY
INFORMATION - PART I
BOROUGH OF ENGLEWOOD CLIFFS BOARD OF EDUCATIONENGLEWOOD CLIFFS, NJ
MANAGEMENT’S DISCUSSION AND ANALYSISFOR THE FISCAL YEAR ENDED JUNE 30, 2018
The discussion and analysis of the Borough of Englewood Cliffs Board of Education’s financial performanceprovides an overall review of the School District’s financial activities for the fiscal year ended June 30,2018. The intent of this discussion and analysis is to look at the District’s financial performance as a wholeand should not be interpreted as a replacement for the audit which consists of the financial statements andother supplemental information that presents all the District’s revenues and expenditures by program for theGeneral Fund, Special Revenue Fund, Capital Projects Fund, Enterprise Fund.
FINANCIAL HIGHLIGHTS
• In total, net position increased $197,588. Net position of governmental activities increased $192,073and net position of business-type activity increased by $5,515.
• General revenues accounted for $16,809,480 in revenue or 98 percent of all district revenues. Program specific revenues in the form of charges for services and sales, grants and contributionsaccounted for $364,936 or 2 percent of total revenues of $17,174,416.
• The School District had $16,932,471 in expenses related to governmental activities; only $315,064of these expenses were offset by program specific charges for services, grants or contributions. General revenues (primarily grants, entitlements and property taxes) of $16,617,407 were adequateto provide for these programs.
USING THIS ANNUAL REPORT
This annual report consists of a series of financial statements and notes to those statements. The statementsare organized so the reader can understand the District as a whole (district-wide statements), and thenproceed to provide an increasingly detailed look at specified financial activities.
District-Wide Financial Statements
The statement of net position and statement of activities reports information about the District as a wholeand about its activities in a manner that helps answer the question, “Is the District better or worse off as aresult of the year’s activities?” These statements include all assets and liabilities of the District using theaccrual basis of accounting, similar to the accounting used by private sector corporations. All of the currentyear’s revenues and expenses are taken into consideration regardless of when cash is received or paid.
-12-
BOROUGH OF ENGLEWOOD CLIFFS BOARD OF EDUCATIONENGLEWOOD CLIFFS, NJ
MANAGEMENT’S DISCUSSION AND ANALYSISFOR THE FISCAL YEAR ENDED JUNE 30, 2018
(CONTINUED)
USING THIS ANNUAL REPORT, (continued)
Both of the district-wide financial statements distinguish functions of the Borough of Englewood CliffsBoard of Education that are principally supported by taxes and intergovernmental revenues (governmentalactivities) from other functions that are intended to recover all or a significant portion of their costs throughuser fees and charges (business-type activities).
In the Statement of Net Position and the Statement of Activities, the District is divided into two distinct kindsof activities:
C Governmental Activities – All of the school district’s programs and services are reported hereincluding instruction, support services, operation and maintenance of plant facilities, pupiltransportation and extracurricular activities.
C Business-type Activity – This service is provided on a charge for goods and services basis to recoverall the expenses of the goods or services provided. The Special Milk Fund and Enrichment Programare reported as business activities.
The two statements report the District’s net position and changes in them. The change in net position canbe utilized by a reader to assist in determining whether the District’s financial health is improving ordeteriorating. However, the reader should also consider non-financial factors such as property tax base,current New Jersey laws restricting revenue growth, student enrollment growth, facility conditions, requirededucational programs and other factors in determining the District’s overall financial health.
Fund Financial Statements
A fund is a grouping of related accounts that is used to maintain control over resources that have beensegregated for specific activities or objectives. The Borough of Englewood Cliffs Board of Education, likeother state and local governments, uses fund accounting to ensure and demonstrate compliance with finance-related legal requirements. All of the district’s funds can be divided into three categories: GovernmentalFunds, Proprietary Funds and Fiduciary Funds.
Governmental Funds
Governmental funds are used to account for essentially the same functions reported as governmentalactivities in the district-wide financial statements. However, unlike the district-wide financial statements,governmental fund financial statements focus on near-term inflows and outflows of spendable resources,as well as on balances of spendable resources available at the end of the fiscal year. These funds arereported using an accounting method called modified accrual accounting, which measures cash and all otherfinancial assets that can be readily converted to cash.
Because the focus of governmental funds is narrower than that of the district-wide financial statements, itis useful to compare the information presented for governmental funds with similar information presentedfor governmental activities in the district-wide financial statements. By doing so, readers may betterunderstand the long-term impact of the District’s near-term financing decisions. Both the governmental fundbalance sheet and the governmental fund statement of revenues, expenditures, and changes in fund balancesprovide a reconciliation to facilitate this comparison between governmental funds and governmentalactivities (reported in the Statement of Net Position and the Statement of Activities).
-13-

BOROUGH OF ENGLEWOOD CLIFFS BOARD OF EDUCATIONENGLEWOOD CLIFFS, NJ
MANAGEMENT’S DISCUSSION AND ANALYSISFOR THE FISCAL YEAR ENDED JUNE 30, 2018
(CONTINUED)
USING THIS ANNUAL REPORT, (continued)
The Borough of Englewood Cliffs Board of Education maintains four individual governmental funds. Information is presented separately in the governmental fund balance sheet and in the governmentalstatement of revenues, expenditures and changes in fund balances for the general, special revenue, capitalprojects funds, and debt service funds, which are both considered to be major funds.
The Borough of Englewood Cliffs Board of Education adopts annual appropriated budgets for itsgovernmental funds. A budgetary comparison statement has been provided for the general, special revenue,and debt service funds to demonstrate compliance with their budgets.
Proprietary Funds
Proprietary funds use the accrual basis of accounting, the same as on the district-wide statements, thereforethe statements will essentially match the business-type activities portion of the district-wide statements. TheBorough of Englewood Cliffs Board of Education uses proprietary funds to account for its special milk andenrichment programs.
Fiduciary Funds
Fiduciary funds are used to account for resources held for the benefit of parties outside the District. Theseactivities are excluded from the District’s other financial statements because the assets cannot be utilizedby the District to finance its operations.
Notes to the Financial Statements
The notes provide additional information that is essential to a full understanding of the data provided in thedistrict-wide and fund financial statements.
Other Information
In addition to the basic financial statements and accompanying notes, this report also presents certainrequired supplementary information concerning budgetary information for the District’s major funds.
Our auditor has provided assurance in his independent auditor’s report, located immediately preceding thisManagement’s Discussion and Analysis, that the Basic Financial Statements are fairly stated. Varyingdegrees of assurance are being provided by the auditor regarding the Required Supplemental Informationand the Supplemental Information identified above. A user of this report should read the independentauditor’s report carefully to ascertain the level of assurance being provided for each of the other parts in theFinancial Section.
-14-
BOROUGH OF ENGLEWOOD CLIFFS BOARD OF EDUCATIONENGLEWOOD CLIFFS, NJ
MANAGEMENT’S DISCUSSION AND ANALYSISFOR THE FISCAL YEAR ENDED JUNE 30, 2018
(CONTINUED)
DISTRICT-WIDE FINANCIAL ANALYSIS
The Statement of Net Position provides the perspective of the District as a whole. Net position may, over time,serve as a useful indicator of a government’s financial position.
The District’s financial position is the product of several financial transactions including the net results of activities,the acquisition and payment of debt, the acquisition and disposal of capital assets and the depreciation of capitalassets.
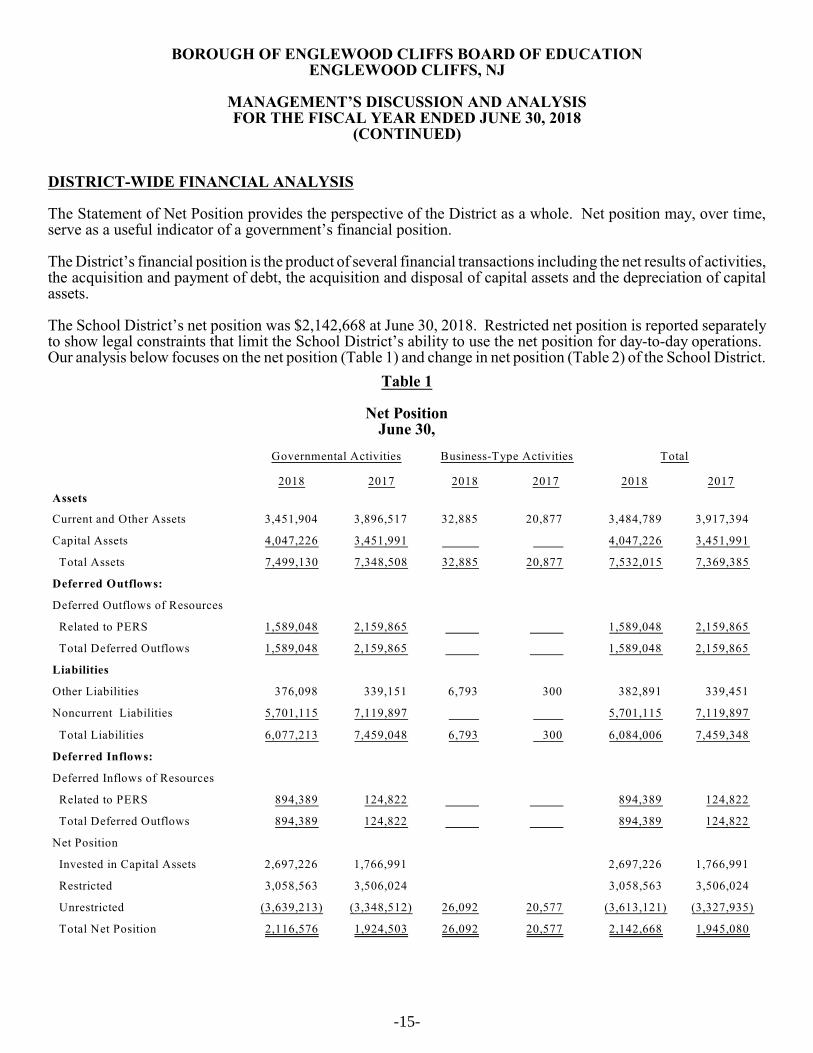
The School District’s net position was $2,142,668 at June 30, 2018. Restricted net position is reported separatelyto show legal constraints that limit the School District’s ability to use the net position for day-to-day operations. Our analysis below focuses on the net position (Table 1) and change in net position (Table 2) of the School District.
Table 1
Net PositionJune 30,
Governmental Activities Business-Type Activities Total
2018 2017 2018 2017 2018 2017
Assets
Current and Other Assets 3,451,904 3,896,517 32,885 20,877 3,484,789 3,917,394
Capital Assets 4,047,226 3,451,991 4,047,226 3,451,991
Total Assets 7,499,130 7,348,508 32,885 20,877 7,532,015 7,369,385
Deferred Outflows:
Deferred Outflows of Resources
Related to PERS 1,589,048 2,159,865 1,589,048 2,159,865
Total Deferred Outflows 1,589,048 2,159,865 1,589,048 2,159,865
Liabilities
Other Liabilities 376,098 339,151 6,793 300 382,891 339,451
Noncurrent Liabilities 5,701,115 7,119,897 5,701,115 7,119,897
Total Liabilities 6,077,213 7,459,048 6,793 300 6,084,006 7,459,348
Deferred Inflows:
Deferred Inflows of Resources
Related to PERS 894,389 124,822 894,389 124,822
Total Deferred Outflows 894,389 124,822 894,389 124,822
Net Position
Invested in Capital Assets 2,697,226 1,766,991 2,697,226 1,766,991
Restricted 3,058,563 3,506,024 3,058,563 3,506,024
Unrestricted (3,639,213) (3,348,512) 26,092 20,577 (3,613,121) (3,327,935)
Total Net Position 2,116,576 1,924,503 26,092 20,577 2,142,668 1,945,080
-15-
BOROUGH OF ENGLEWOOD CLIFFS BOARD OF EDUCATIONENGLEWOOD CLIFFS, NJ
MANAGEMENT’S DISCUSSION AND ANALYSISFOR THE FISCAL YEAR ENDED JUNE 30, 2018
(CONTINUED)
DISTRICT-WIDE FINANCIAL ANALYSIS, (continued)
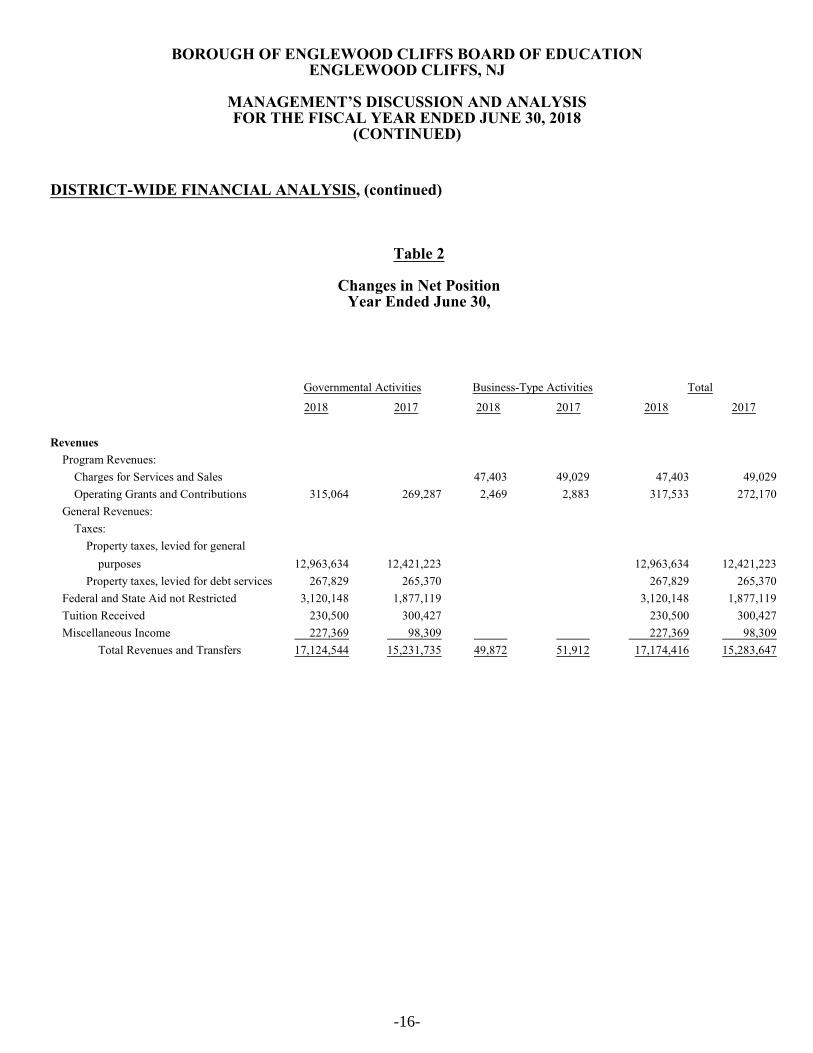
Table 2
Changes in Net PositionYear Ended June 30,
Governmental Activities Business-Type Activities Total
2018 2017 2018 2017 2018 2017
Revenues
Program Revenues:
Charges for Services and Sales 47,403 49,029 47,403 49,029
Operating Grants and Contributions 315,064 269,287 2,469 2,883 317,533 272,170
General Revenues:
Taxes:
Property taxes, levied for general
purposes 12,963,634 12,421,223 12,963,634 12,421,223
Property taxes, levied for debt services 267,829 265,370 267,829 265,370
Federal and State Aid not Restricted 3,120,148 1,877,119 3,120,148 1,877,119
Tuition Received 230,500 300,427 230,500 300,427
Miscellaneous Income 227,369 98,309 227,369 98,309
Total Revenues and Transfers 17,124,544 15,231,735 49,872 51,912 17,174,416 15,283,647
-16-
BOROUGH OF ENGLEWOOD CLIFFS BOARD OF EDUCATIONENGLEWOOD CLIFFS, NJ
MANAGEMENT’S DISCUSSION AND ANALYSISFOR THE FISCAL YEAR ENDED JUNE 30, 2018
(CONTINUED)
DISTRICT-WIDE FINANCIAL ANALYSIS, (continued)
Governmental Activities Business-Type Activities Total
2018 2017 2018 2017 2018 2017
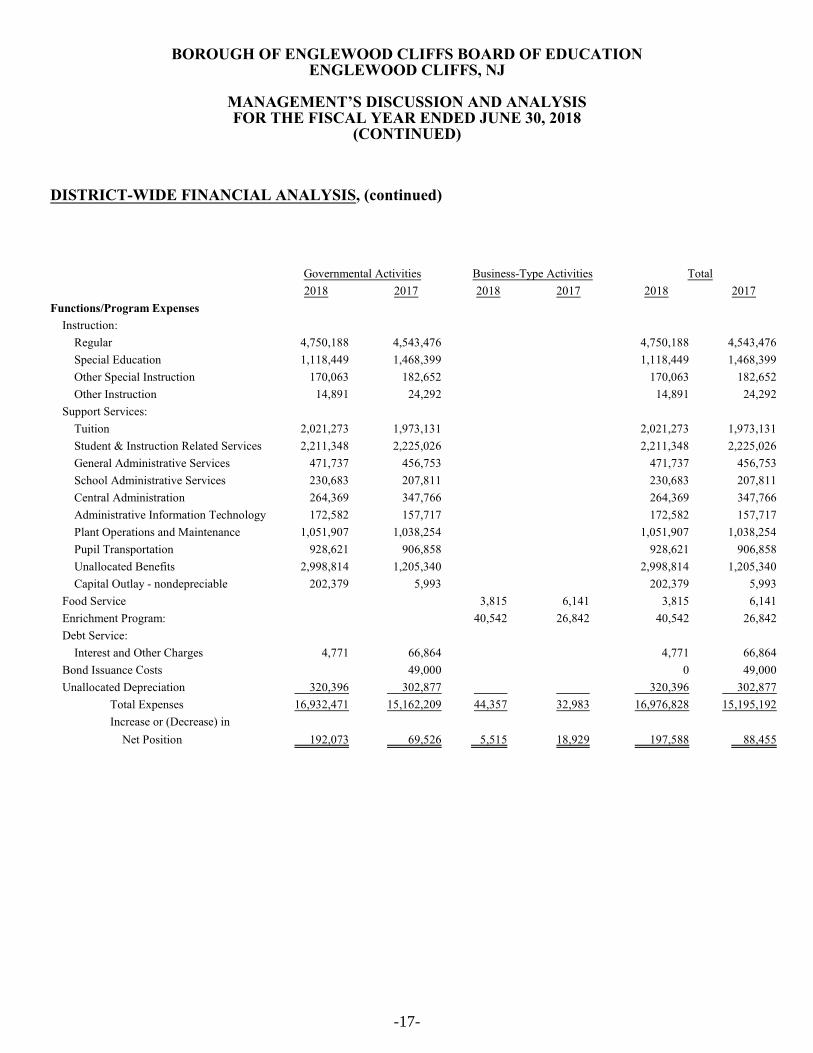
Functions/Program Expenses
Instruction:
Regular 4,750,188 4,543,476 4,750,188 4,543,476
Special Education 1,118,449 1,468,399 1,118,449 1,468,399
Other Special Instruction 170,063 182,652 170,063 182,652
Other Instruction 14,891 24,292 14,891 24,292
Support Services:
Tuition 2,021,273 1,973,131 2,021,273 1,973,131
Student & Instruction Related Services 2,211,348 2,225,026 2,211,348 2,225,026
General Administrative Services 471,737 456,753 471,737 456,753
School Administrative Services 230,683 207,811 230,683 207,811
Central Administration 264,369 347,766 264,369 347,766
Administrative Information Technology 172,582 157,717 172,582 157,717
Plant Operations and Maintenance 1,051,907 1,038,254 1,051,907 1,038,254
Pupil Transportation 928,621 906,858 928,621 906,858
Unallocated Benefits 2,998,814 1,205,340 2,998,814 1,205,340
Capital Outlay - nondepreciable 202,379 5,993 202,379 5,993
Food Service 3,815 6,141 3,815 6,141
Enrichment Program: 40,542 26,842 40,542 26,842
Debt Service:
Interest and Other Charges 4,771 66,864 4,771 66,864
Bond Issuance Costs 49,000 0 49,000
Unallocated Depreciation 320,396 302,877 320,396 302,877
Total Expenses 16,932,471 15,162,209 44,357 32,983 16,976,828 15,195,192
Increase or (Decrease) in
Net Position 192,073 69,526 5,515 18,929 197,588 88,455
-17-
BOROUGH OF ENGLEWOOD CLIFFS BOARD OF EDUCATIONENGLEWOOD CLIFFS, NJ
MANAGEMENT’S DISCUSSION AND ANALYSISFOR THE FISCAL YEAR ENDED JUNE 30, 2018
(CONTINUED)
DISTRICT-WIDE FINANCIAL ANALYSIS, (continued)
Governmental and Business- Activities
As reported in the Statement of Activities the cost of all of our governmental and business-type activitiesthis year was $16,932,471. However, the amount that our taxpayers ultimately financed for these activitiesthrough School District taxes was only $13,231,463 because some of the cost was paid by those whobenefitted from the programs $47,403 by other governments and organizations who subsidized certainprograms with grants and contributions $317,533, unrestricted federal and state aid $3,120,148, tuition$230,500, and by miscellaneous sources of $227,369.
Revenues for the District’s business-type activities (special milk and enrichment programs) were comprisedof charges for services and federal and state subsidy reimbursements. Significant financial results includethe following:
T Special milk, enrichment and Invengineering program revenues exceeded expenses by $5,515.
T Charges for services provided totaled $47,403. This represents amounts paid by consumers for dailymilk purchases, tuition payments and program fees.
T Federal and state reimbursement for milks served was $2,469.
MAJOR GOVERNMENTAL FUNDS BUDGETING AND OPERATING HIGHLIGHTS
The School District’s budgets are prepared according to New Jersey law, and are based on accounting forcertain transactions on a basis of cash receipts, disbursements and encumbrances. The most significantbudgeted funds are the general fund and the special revenue fund.
During the fiscal year ended June 30, 2018, the School District amended the budgets of these majorgovernmental funds several times. Revisions in the budget were made to recognize revenues that were notanticipated and to prevent over-expenditures in specific line item accounts. Several of these revisions bearnotation:
C TPAF, which is the state’s contribution to the pension fund, is neither a revenue item nor anexpenditures item to the district but is required to be reflected in the financial statements.
C The special revenue fund was increased by $54,020 for increases in federal and state grant awards.
General Fund
The general fund actual revenue was $15,499,694. That amount is $1,658,134 above the final amendedbudget of $13,841,560. The variance between the actual revenues and final budget was the result of non-budgeted on-behalf payments of $1,458,172 for TPAF social security reimbursements and on-behalf pensionpayments, $88,207 for additional extraordinary state aid, $35,231 in additional other unrestricted state aid,and $76,524 in excess miscellaneous anticipated revenues.
-18-
BOROUGH OF ENGLEWOOD CLIFFS BOARD OF EDUCATIONENGLEWOOD CLIFFS, NJ
MANAGEMENT’S DISCUSSION AND ANALYSISFOR THE FISCAL YEAR ENDED JUNE 30, 2018
(CONTINUED)
MAJOR GOVERNMENTAL FUNDS BUDGETING AND OPERATING HIGHLIGHTS, (continued)
General Fund, (continued)
The actual expenditures of the general fund were $16,000,348 which is $191,822 below the final amendedbudget of $16,192,170. The variance between the actual expenditures and final budget was due to non-budget on-behalf TPAF social security and pension payments of $1,458,172 and $1,649,994 of unexpendedbudgeted funds.
Special Revenue Fund
The special revenue fund actual revenue was $229,723. That amount is above the original budget estimateof $208,041 and below the final amended budget. The $54,020 variance between the original and finalbudget was due to additional federal and state grant monies awarded to the District after the original budgetwas approved. The $32,338 variance between the final amended budget and the June 30, 2018 actual resultswas due to the deferral of Federal grants received in the current fiscal year to be spent in the next fiscal year.
The actual expenditures of the special revenue fund were $229,173, which is above the original budget of$208,041 and below the final amended budget. The $54,020 variance between the original and final budgetwas due to additional expenditures related to the additional grants awarded to the District after the originalbudget was approved. The $32,338 variance between the final amended budget and the June 30, 2018 actualresults was due to the anticipation of fully expending federal grant programs. Expenditures will be incurred in the next fiscal year.
CAPITAL ASSETS AND DEBT ADMINISTRATION
Capital Assets
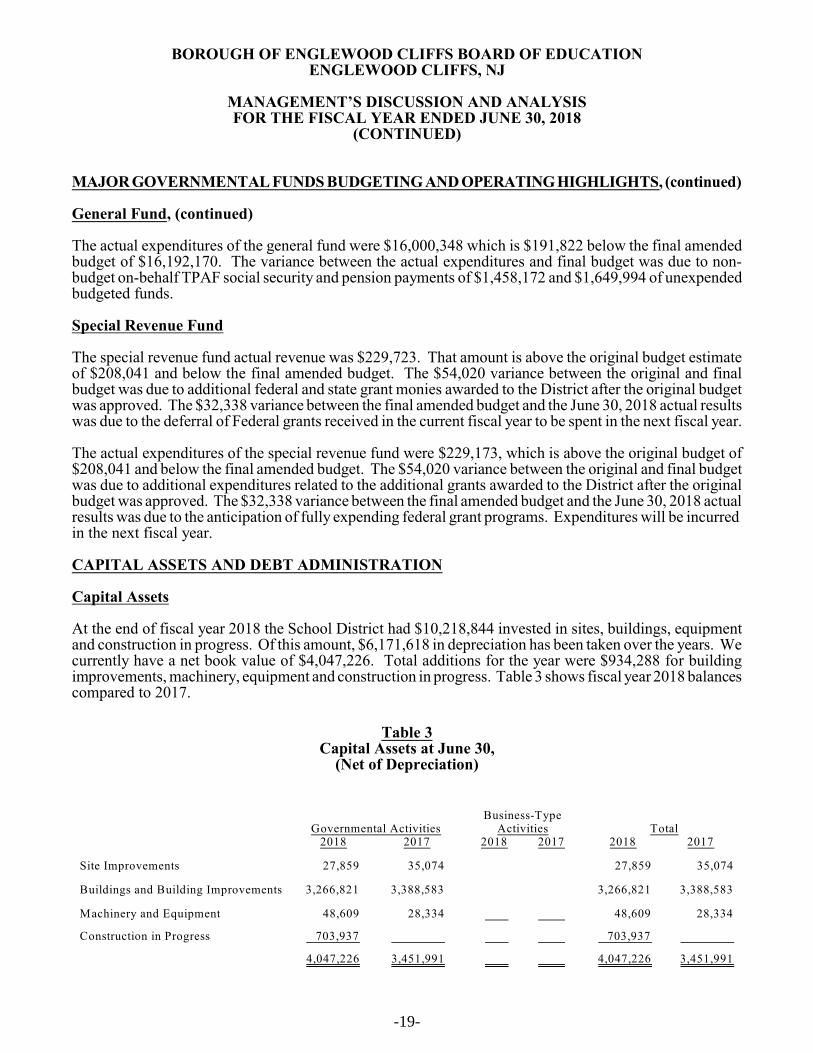
At the end of fiscal year 2018 the School District had $10,218,844 invested in sites, buildings, equipmentand construction in progress. Of this amount, $6,171,618 in depreciation has been taken over the years. Wecurrently have a net book value of $4,047,226. Total additions for the year were $934,288 for buildingimprovements, machinery, equipment and construction in progress. Table 3 shows fiscal year 2018 balancescompared to 2017.
Table 3Capital Assets at June 30,
(Net of Depreciation)
Governmental ActivitiesBusiness-Type
Activities Total2018 2017 2018 2017 2018 2017
Site Improvements 27,859 35,074 27,859 35,074
Buildings and Building Improvements 3,266,821 3,388,583 3,266,821 3,388,583
Machinery and Equipment 48,609 28,334 48,609 28,334
Construction in Progress 703,937 703,937
4,047,226 3,451,991 4,047,226 3,451,991
-19-
BOROUGH OF ENGLEWOOD CLIFFS BOARD OF EDUCATIONENGLEWOOD CLIFFS, NJ
MANAGEMENT’S DISCUSSION AND ANALYSISFOR THE FISCAL YEAR ENDED JUNE 30, 2018
(CONTINUED)
Debt Administration
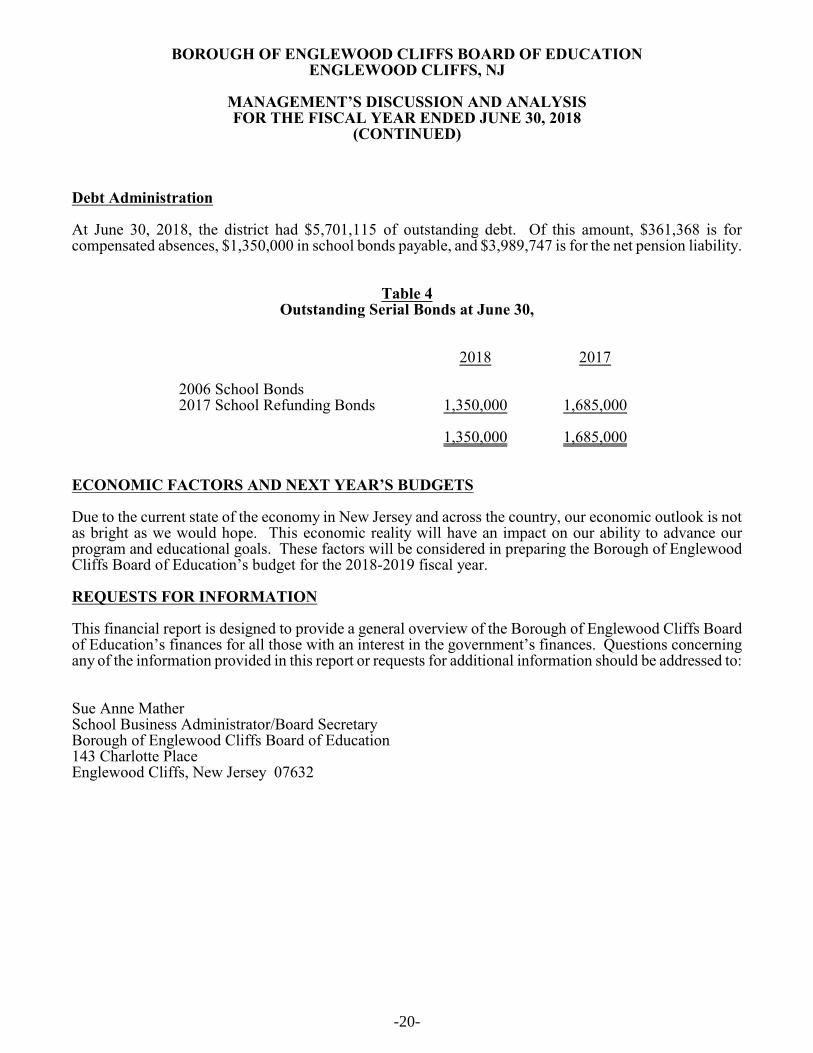
At June 30, 2018, the district had $5,701,115 of outstanding debt. Of this amount, $361,368 is forcompensated absences, $1,350,000 in school bonds payable, and $3,989,747 is for the net pension liability.
Table 4Outstanding Serial Bonds at June 30,
2018 2017
2006 School Bonds 2017 School Refunding Bonds 1,350,000 1,685,000
1,350,000 1,685,000
ECONOMIC FACTORS AND NEXT YEAR’S BUDGETS
Due to the current state of the economy in New Jersey and across the country, our economic outlook is notas bright as we would hope. This economic reality will have an impact on our ability to advance ourprogram and educational goals. These factors will be considered in preparing the Borough of EnglewoodCliffs Board of Education’s budget for the 2018-2019 fiscal year.
REQUESTS FOR INFORMATION
This financial report is designed to provide a general overview of the Borough of Englewood Cliffs Boardof Education’s finances for all those with an interest in the government’s finances. Questions concerningany of the information provided in this report or requests for additional information should be addressed to:
Sue Anne MatherSchool Business Administrator/Board SecretaryBorough of Englewood Cliffs Board of Education143 Charlotte PlaceEnglewood Cliffs, New Jersey 07632
-20-

BASIC FINANCIAL STATEMENTS
DISTRICT-WIDE FINANCIAL STATEMENTS
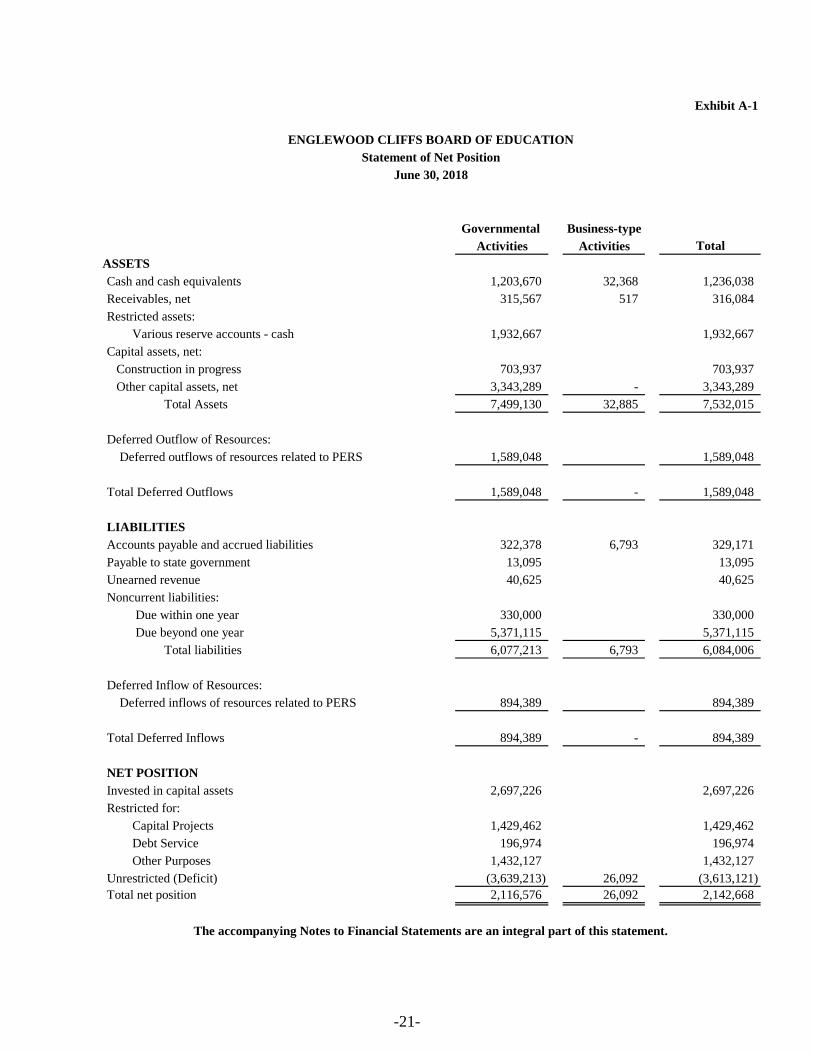
Exhibit A-1
Governmental Business-type
Activities Activities Total
ASSETS
Cash and cash equivalents 1,203,670 32,368 1,236,038
Receivables, net 315,567 517 316,084
Restricted assets:
Various reserve accounts - cash 1,932,667 1,932,667
Capital assets, net:
Construction in progress 703,937 703,937
Other capital assets, net 3,343,289 - 3,343,289
Total Assets 7,499,130 32,885 7,532,015
Deferred Outflow of Resources:
Deferred outflows of resources related to PERS 1,589,048 1,589,048
Total Deferred Outflows 1,589,048 - 1,589,048
LIABILITIES
Accounts payable and accrued liabilities 322,378 6,793 329,171
Payable to state government 13,095 13,095
Unearned revenue 40,625 40,625
Noncurrent liabilities:
Due within one year 330,000 330,000
Due beyond one year 5,371,115 5,371,115
Total liabilities 6,077,213 6,793 6,084,006
Deferred Inflow of Resources:
Deferred inflows of resources related to PERS 894,389 894,389
Total Deferred Inflows 894,389 - 894,389
NET POSITION
Invested in capital assets 2,697,226 2,697,226
Restricted for:
Capital Projects 1,429,462 1,429,462
Debt Service 196,974 196,974
Other Purposes 1,432,127 1,432,127
Unrestricted (Deficit) (3,639,213) 26,092 (3,613,121)
Total net position 2,116,576 26,092 2,142,668
The accompanying Notes to Financial Statements are an integral part of this statement.
ENGLEWOOD CLIFFS BOARD OF EDUCATION
Statement of Net Position
June 30, 2018
-21-
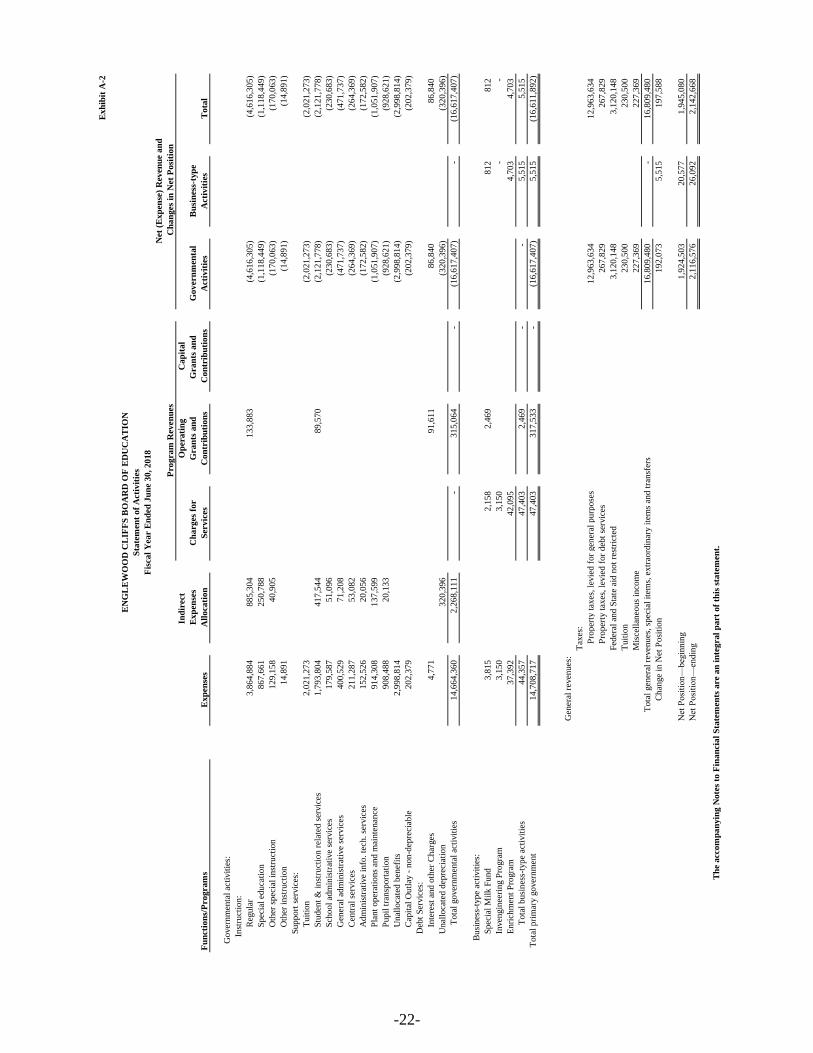
Exh
ibit
A-2
Net
(E
xp
ense
) R
even
ue
an
d
Pro
gram
Rev
en
ues
Ch
an
ges
in
Net
Posi
tion
Ind
irect
O
per
ati
ng
Cap
ital
Exp
ense
sC
harg
es f
or
Gra
nts
an
dG
ran
ts a
nd
G
over
nm
enta
lB
usi
nes
s-ty
pe
Fu
nct
ion
s/P
rog
ra
ms
Exp
ense
sA
lloca
tion
Ser
vic
es
Con
trib
uti
on
sC
on
trib
uti
on
sA
ctiv
itie
sA
ctiv
itie
sT
ota
l
G
over
nm
enta
l ac
tivit
ies:
In
stru
ctio
n:
Reg
ula
r3,8
64,8
84
885,3
04
133,8
83
(4
,616,3
05)
(4
,616,3
05)
Sp
ecia
l ed
uca
tio
n867,6
61
250,7
88
(1
,118,4
49)
(1
,118,4
49)
Oth
er s
pec
ial
inst
ruct
ion
129,1
58
40,9
05
(1
70,0
63)
(170,0
63)
Oth
er i
nst
ruct
ion
14,8
91
(1
4,8
91)
(14,8
91)
S
up
po
rt s
ervic
es:
Tu
itio
n2,0
21,2
73
(2,0
21,2
73)
(2
,021,2
73)
Stu
den
t &
in
stru
ctio
n r
elat
ed s
ervic
es1,7
93,8
04
417,5
44
89,5
70
(2
,121,7
78)
(2
,121,7
78)
Sch
oo
l ad
min
istr
ativ
e se
rvic
es179,5
87
51,0
96
(2
30,6
83)
(230,6
83)
Gen
eral
ad
min
istr
ativ
e se
rvic
es400,5
29
71,2
08
(4
71,7
37)
(471,7
37)
Cen
tral
ser
vic
es211,2
87
53,0
82
(2
64,3
69)
(264,3
69)
Ad
min
istr
ativ
e in
fo. te
ch. se
rvic
es152,5
26
20,0
56
(1
72,5
82)
(172,5
82)
Pla
nt
op
erat
ion
s an
d m
ain
ten
ance
914,3
08
137,5
99
(1
,051,9
07)
(1
,051,9
07)
Pu
pil
tra
nsp
ort
atio
n908,4
88
20,1
33
(9
28,6
21)
(928,6
21)
Un
allo
cate
d b
enef
its
2,9
98,8
14
(2,9
98,8
14)
(2
,998,8
14)
Cap
ital
Ou
tlay
- n
on
-dep
reci
able
202,3
79
(2
02,3
79)
(202,3
79)
D
ebt
Ser
vic
es:
In
tere
st a
nd
oth
er C
har
ges
4,7
71
91,6
11
86,8
40
86,8
40
U
nal
loca
ted
dep
reci
atio
n320,3
96
(3
20,3
96)
(320,3
96)
T
ota
l go
ver
nm
enta
l ac
tivit
ies
14,6
64,3
60
2,2
68,1
11
-
315,0
64
-
(1
6,6
17,4
07)
-
(1
6,6
17,4
07)
B
usi
nes
s-ty
pe
acti
vit
ies:
S
pec
ial
Mil
k F
un
d3,8
15
2,1
58
2,4
69
812
812
In
ven
gin
eeri
ng P
rogra
m3,1
50
3,1
50
-
-
E
nri
chm
ent
Pro
gra
m37,3
92
42,0
95
4,7
03
4,7
03
T
ota
l b
usi
nes
s-ty
pe
acti
vit
ies
44,3
57
47,4
03
2,4
69
-
-
5,5
15
5,5
15
To
tal
pri
mar
y g
over
nm
ent
14,7
08,7
17
47,4
03
317,5
33
-
(1
6,6
17,4
07)
5,5
15
(1
6,6
11,8
92)
Gen
eral
rev
enues
:
Tax
es:
P
roper
ty t
axes
, le
vie
d f
or
gen
eral
purp
ose
s12,9
63,6
34
12,9
63,6
34
P
roper
ty t
axes
, le
vie
d f
or
deb
t se
rvic
es267,8
29
267,8
29
Fed
eral
and S
tate
aid
not
rest
rict
ed
3,1
20,1
48
3,1
20,1
48
Tuit
ion
230,5
00
230,5
00
Mis
cell
aneo
us
inco
me
227,3
69
227,3
69
T
ota
l gen
eral
rev
enues
, sp
ecia
l it
ems,
extr
aord
inar
y i
tem
s an
d t
ransf
ers
16,8
09,4
80
-
16,8
09,4
80
C
han
ge
in N
et P
osi
tion
192,0
73
5,5
15
197,5
88
Net
Posi
tion—
beg
innin
g1,9
24,5
03
20,5
77
1,9
45,0
80
Net
Posi
tion—
endin
g2,1
16,5
76
26,0
92
2,1
42,6
68
EN
GL
EW
OO
D C
LIF
FS
BO
AR
D O
F E
DU
CA
TIO
N
Sta
tem
ent
of
Act
ivit
ies
Fis
cal
Yea
r E
nd
ed J
un
e 30, 2018
Th
e a
cco
mp
an
yin
g N
ote
s to
Fin
an
cia
l S
tate
men
ts a
re a
n i
nte
gral
part
of
this
sta
tem
ent.
-22-
FUND FINANCIAL STATEMENTS
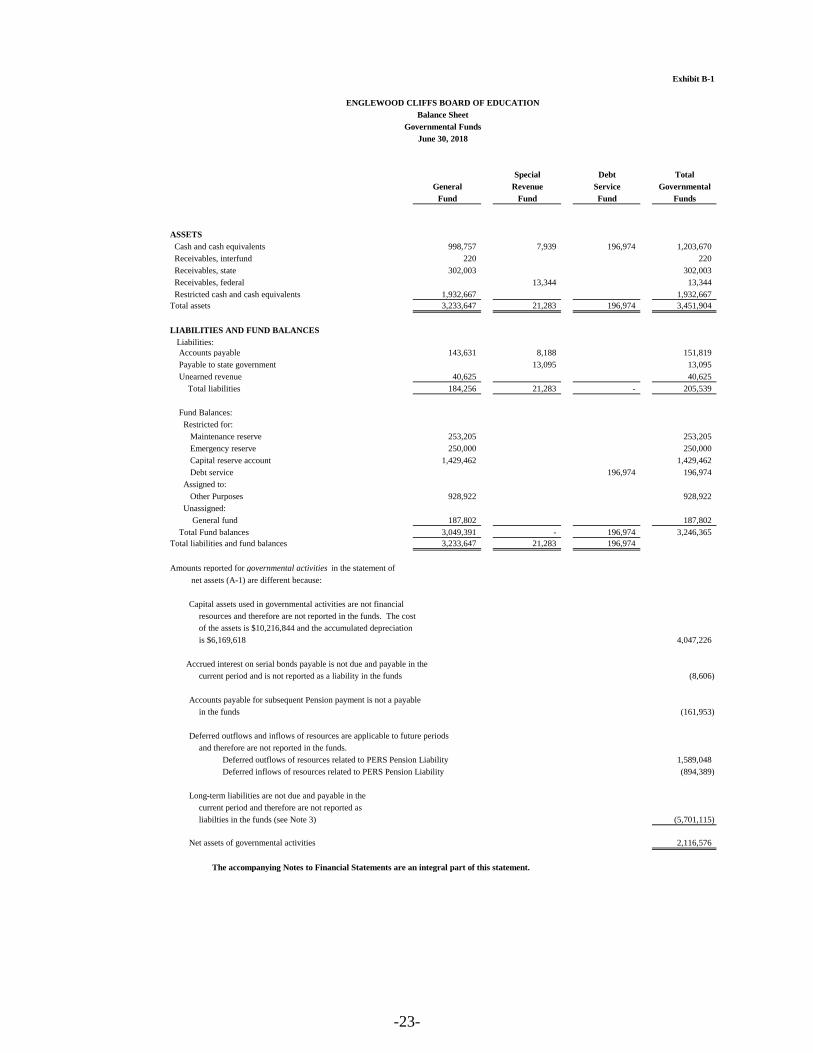
Exhibit B-1
Special Debt Total
General Revenue Service Governmental
Fund Fund Fund Funds
ASSETS
Cash and cash equivalents 998,757 7,939 196,974 1,203,670
Receivables, interfund 220 220
Receivables, state 302,003 302,003
Receivables, federal 13,344 13,344
Restricted cash and cash equivalents 1,932,667 1,932,667
Total assets 3,233,647 21,283 196,974 3,451,904
LIABILITIES AND FUND BALANCES
Liabilities:
Accounts payable 143,631 8,188 151,819
Payable to state government 13,095 13,095
Unearned revenue 40,625 40,625
Total liabilities 184,256 21,283 - 205,539
Fund Balances:
Restricted for:
Maintenance reserve 253,205 253,205
Emergency reserve 250,000 250,000
Capital reserve account 1,429,462 1,429,462
Debt service 196,974 196,974
Assigned to:
Other Purposes 928,922 928,922
Unassigned:
General fund 187,802 187,802
Total Fund balances 3,049,391 - 196,974 3,246,365
Total liabilities and fund balances 3,233,647 21,283 196,974
Amounts reported for governmental activities in the statement of
net assets (A-1) are different because:
Capital assets used in governmental activities are not financial
resources and therefore are not reported in the funds. The cost
of the assets is $10,216,844 and the accumulated depreciation
is $6,169,618 4,047,226
Accrued interest on serial bonds payable is not due and payable in the
current period and is not reported as a liability in the funds (8,606)
Accounts payable for subsequent Pension payment is not a payable
in the funds (161,953)
Deferred outflows and inflows of resources are applicable to future periods
and therefore are not reported in the funds.
Deferred outflows of resources related to PERS Pension Liability 1,589,048
Deferred inflows of resources related to PERS Pension Liability (894,389)
Long-term liabilities are not due and payable in the
current period and therefore are not reported as
liabilties in the funds (see Note 3) (5,701,115)
Net assets of governmental activities 2,116,576
ENGLEWOOD CLIFFS BOARD OF EDUCATION
Balance Sheet
Governmental Funds
June 30, 2018
The accompanying Notes to Financial Statements are an integral part of this statement.
-23-
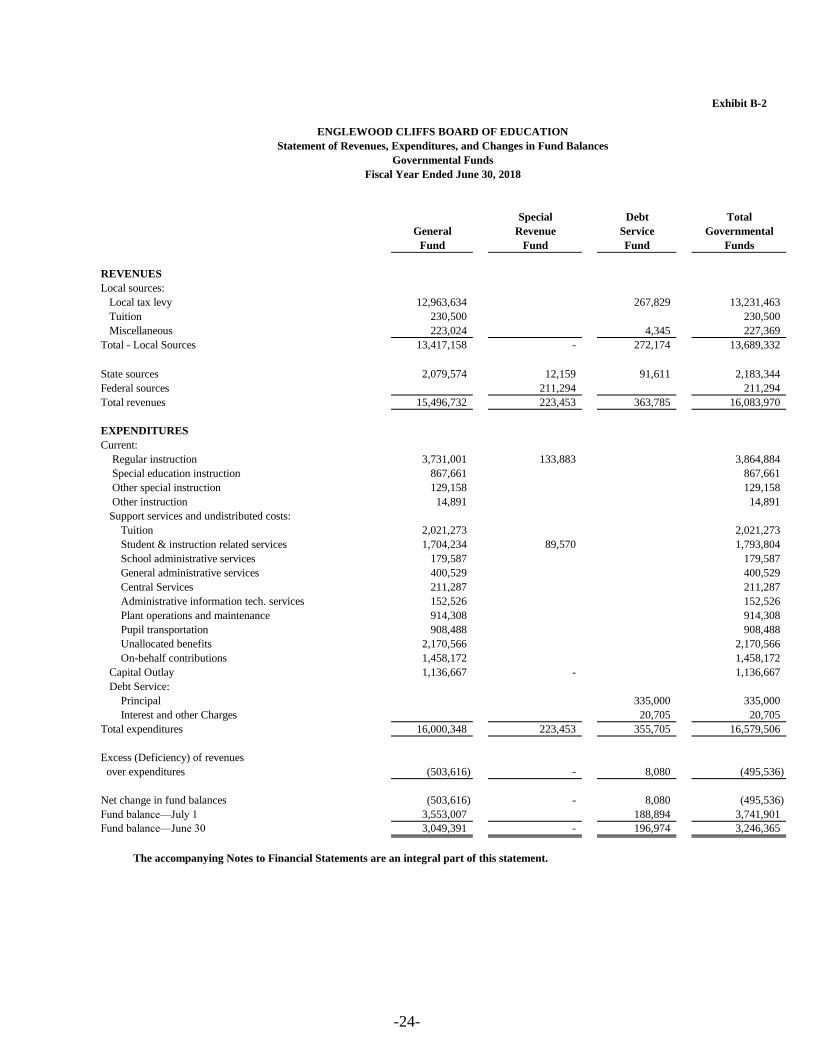
Exhibit B-2
Special Debt Total
General Revenue Service Governmental
Fund Fund Fund Funds
REVENUES
Local sources:
Local tax levy 12,963,634 267,829 13,231,463
Tuition 230,500 230,500
Miscellaneous 223,024 4,345 227,369
Total - Local Sources 13,417,158 - 272,174 13,689,332
State sources 2,079,574 12,159 91,611 2,183,344
Federal sources 211,294 211,294
Total revenues 15,496,732 223,453 363,785 16,083,970
EXPENDITURES
Current:
Regular instruction 3,731,001 133,883 3,864,884
Special education instruction 867,661 867,661
Other special instruction 129,158 129,158
Other instruction 14,891 14,891
Support services and undistributed costs:
Tuition 2,021,273 2,021,273
Student & instruction related services 1,704,234 89,570 1,793,804
School administrative services 179,587 179,587
General administrative services 400,529 400,529
Central Services 211,287 211,287
Administrative information tech. services 152,526 152,526
Plant operations and maintenance 914,308 914,308
Pupil transportation 908,488 908,488
Unallocated benefits 2,170,566 2,170,566
On-behalf contributions 1,458,172 1,458,172
Capital Outlay 1,136,667 - 1,136,667
Debt Service:
Principal 335,000 335,000
Interest and other Charges 20,705 20,705
Total expenditures 16,000,348 223,453 355,705 16,579,506
Excess (Deficiency) of revenues
over expenditures (503,616) - 8,080 (495,536)
Net change in fund balances (503,616) - 8,080 (495,536)
Fund balance—July 1 3,553,007 188,894 3,741,901
Fund balance—June 30 3,049,391 - 196,974 3,246,365
ENGLEWOOD CLIFFS BOARD OF EDUCATION
Statement of Revenues, Expenditures, and Changes in Fund Balances
Governmental Funds
Fiscal Year Ended June 30, 2018
The accompanying Notes to Financial Statements are an integral part of this statement.
-24-
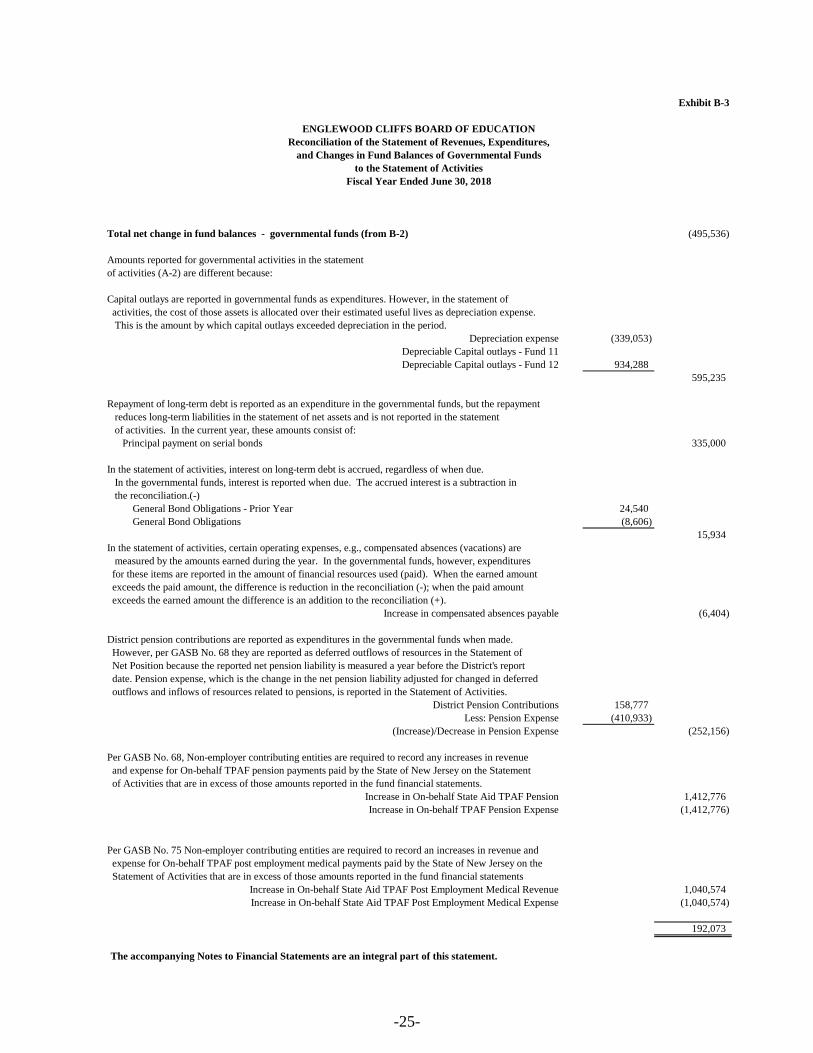
Exhibit B-3
Total net change in fund balances - governmental funds (from B-2) (495,536)
Amounts reported for governmental activities in the statement
of activities (A-2) are different because:
Capital outlays are reported in governmental funds as expenditures. However, in the statement of
activities, the cost of those assets is allocated over their estimated useful lives as depreciation expense.
This is the amount by which capital outlays exceeded depreciation in the period.
Depreciation expense (339,053)
Depreciable Capital outlays - Fund 11
Depreciable Capital outlays - Fund 12 934,288
595,235
Repayment of long-term debt is reported as an expenditure in the governmental funds, but the repayment
reduces long-term liabilities in the statement of net assets and is not reported in the statement
of activities. In the current year, these amounts consist of:
Principal payment on serial bonds 335,000
In the statement of activities, interest on long-term debt is accrued, regardless of when due.
In the governmental funds, interest is reported when due. The accrued interest is a subtraction in
the reconciliation.(-)
General Bond Obligations - Prior Year 24,540
General Bond Obligations (8,606)
15,934
In the statement of activities, certain operating expenses, e.g., compensated absences (vacations) are
measured by the amounts earned during the year. In the governmental funds, however, expenditures
for these items are reported in the amount of financial resources used (paid). When the earned amount
exceeds the paid amount, the difference is reduction in the reconciliation (-); when the paid amount
exceeds the earned amount the difference is an addition to the reconciliation (+).
Increase in compensated absences payable (6,404)
District pension contributions are reported as expenditures in the governmental funds when made.
However, per GASB No. 68 they are reported as deferred outflows of resources in the Statement of
Net Position because the reported net pension liability is measured a year before the District's report
date. Pension expense, which is the change in the net pension liability adjusted for changed in deferred
outflows and inflows of resources related to pensions, is reported in the Statement of Activities.
District Pension Contributions 158,777
Less: Pension Expense (410,933)
(Increase)/Decrease in Pension Expense (252,156)
Per GASB No. 68, Non-employer contributing entities are required to record any increases in revenue
and expense for On-behalf TPAF pension payments paid by the State of New Jersey on the Statement
of Activities that are in excess of those amounts reported in the fund financial statements.
Increase in On-behalf State Aid TPAF Pension 1,412,776
Increase in On-behalf TPAF Pension Expense (1,412,776)
Per GASB No. 75 Non-employer contributing entities are required to record an increases in revenue and
expense for On-behalf TPAF post employment medical payments paid by the State of New Jersey on the
Statement of Activities that are in excess of those amounts reported in the fund financial statements
Increase in On-behalf State Aid TPAF Post Employment Medical Revenue 1,040,574
Increase in On-behalf State Aid TPAF Post Employment Medical Expense (1,040,574)
192,073
The accompanying Notes to Financial Statements are an integral part of this statement.
ENGLEWOOD CLIFFS BOARD OF EDUCATION
Reconciliation of the Statement of Revenues, Expenditures,
and Changes in Fund Balances of Governmental Funds
to the Statement of Activities
Fiscal Year Ended June 30, 2018
-25-
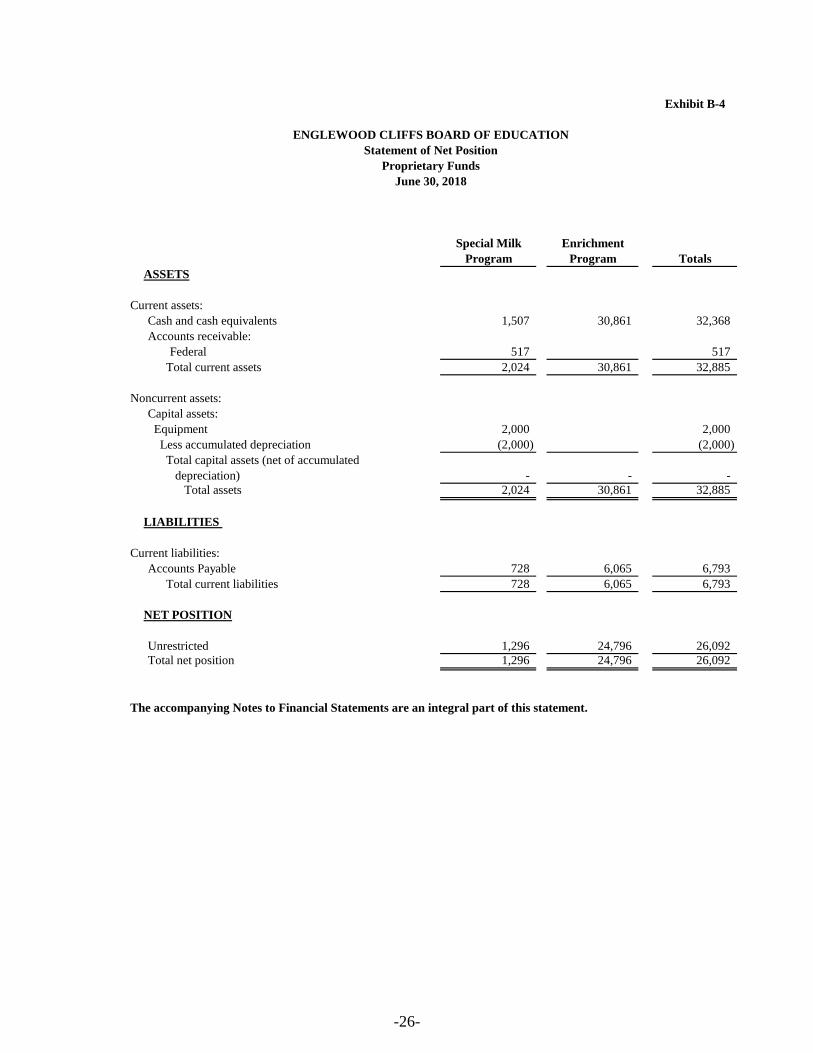
Exhibit B-4
Special Milk Enrichment
Program Program Totals
ASSETS
Current assets:
Cash and cash equivalents 1,507 30,861 32,368
Accounts receivable:
Federal 517 517
Total current assets 2,024 30,861 32,885
Noncurrent assets:
Capital assets:
Equipment 2,000 2,000
Less accumulated depreciation (2,000) (2,000)
Total capital assets (net of accumulated
depreciation) - - -
Total assets 2,024 30,861 32,885
LIABILITIES
Current liabilities:
Accounts Payable 728 6,065 6,793
Total current liabilities 728 6,065 6,793
NET POSITION
Unrestricted 1,296 24,796 26,092
Total net position 1,296 24,796 26,092
The accompanying Notes to Financial Statements are an integral part of this statement.
ENGLEWOOD CLIFFS BOARD OF EDUCATION
Statement of Net Position
Proprietary Funds
June 30, 2018
-26-
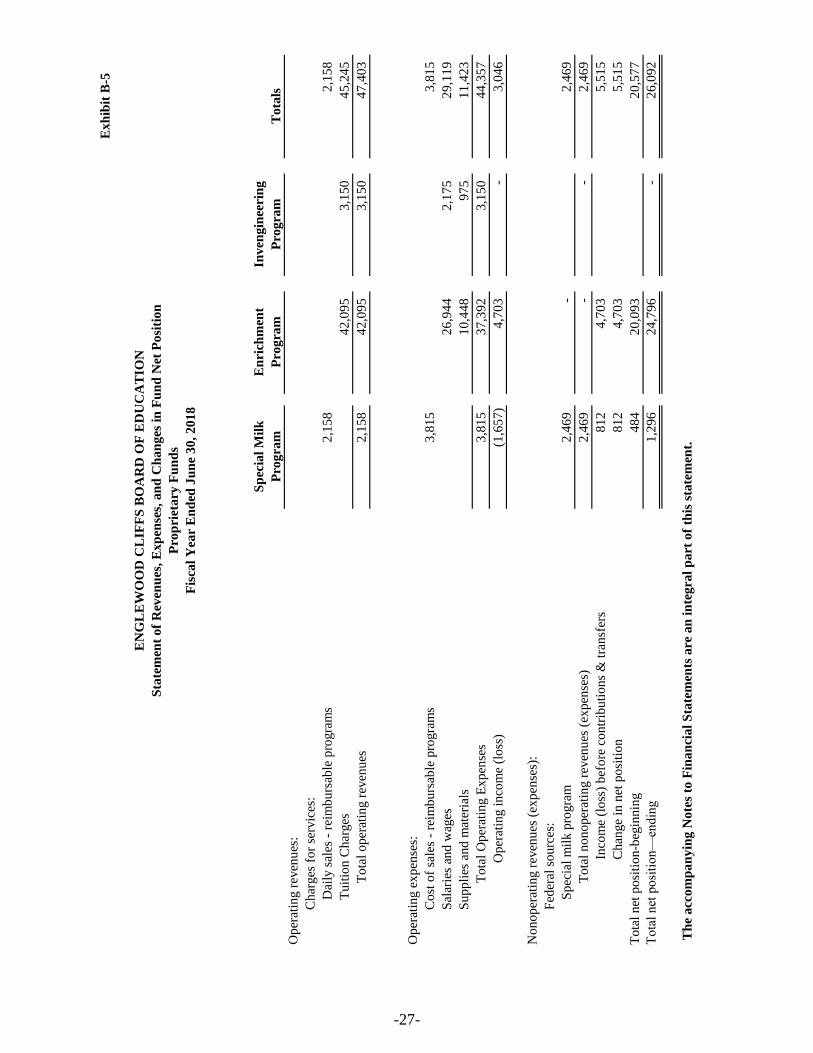
Exh
ibit
B-5
Sp
ecia
l M
ilk
En
rich
men
tIn
ven
gin
eeri
ng
Pro
gra
mP
rogra
mP
rogra
mT
ota
ls
Op
erat
ing r
even
ues
:
Ch
arges
for
serv
ices
:
D
aily
sal
es -
rei
mburs
able
pro
gra
ms
2,1
58
2,1
58
T
uit
ion C
har
ges
42,0
95
3,1
50
45,2
45
T
ota
l oper
atin
g r
even
ues
2,1
58
42,0
95
3,1
50
47,4
03
Op
erat
ing e
xpen
ses:
Co
st o
f sa
les
- re
imburs
able
pro
gra
ms
3,8
15
3,8
15
Sal
arie
s an
d w
ages
26,9
44
2,1
75
29,1
19
Su
pp
lies
and m
ater
ials
10,4
48
975
11,4
23
T
ota
l O
per
atin
g E
xpen
ses
3,8
15
37,3
92
3,1
50
44,3
57
Oper
atin
g i
nco
me
(loss
)(1
,65
7)
4,7
03
-
3,0
46
No
no
per
atin
g r
even
ues
(ex
pen
ses)
:
Fed
eral
sourc
es:
S
pec
ial
mil
k p
rogra
m2
,46
9
-
2,4
69
T
ota
l nonoper
atin
g r
even
ues
(ex
pen
ses)
2,4
69
-
-
2,4
69
Inco
me
(loss
) bef
ore
contr
ibu
tio
ns
& t
ran
sfer
s8
12
4,7
03
5,5
15
Chan
ge
in n
et p
osi
tion
81
2
4,7
03
5,5
15
To
tal
net
po
siti
on-b
egin
nin
g4
84
20,0
93
20,5
77
To
tal
net
po
siti
on—
endin
g1
,29
6
24,7
96
-
26,0
92
Th
e a
cco
mp
an
yin
g N
ote
s to
Fin
an
cial
Sta
tem
ents
are
an
in
teg
ral
pa
rt o
f th
is s
tate
men
t.
EN
GL
EW
OO
D C
LIF
FS
BO
AR
D O
F E
DU
CA
TIO
N
Sta
tem
ent
of
Rev
enu
es, E
xp
ense
s, a
nd
Ch
an
ges
in
Fu
nd
Net
Posi
tion
Pro
pri
eta
ry F
un
ds
Fis
cal
Yea
r E
nd
ed J
un
e 3
0, 2
01
8
-27-
Ex
hib
it B
-6
Sp
ecia
l M
ilk
En
rich
men
tIn
ven
gin
eeri
ng
Pro
gra
mP
rog
ram
Pro
gra
mT
ota
ls
CA
SH
FL
OW
S F
RO
M O
PE
RA
TIN
G A
CT
IVIT
IES
Rec
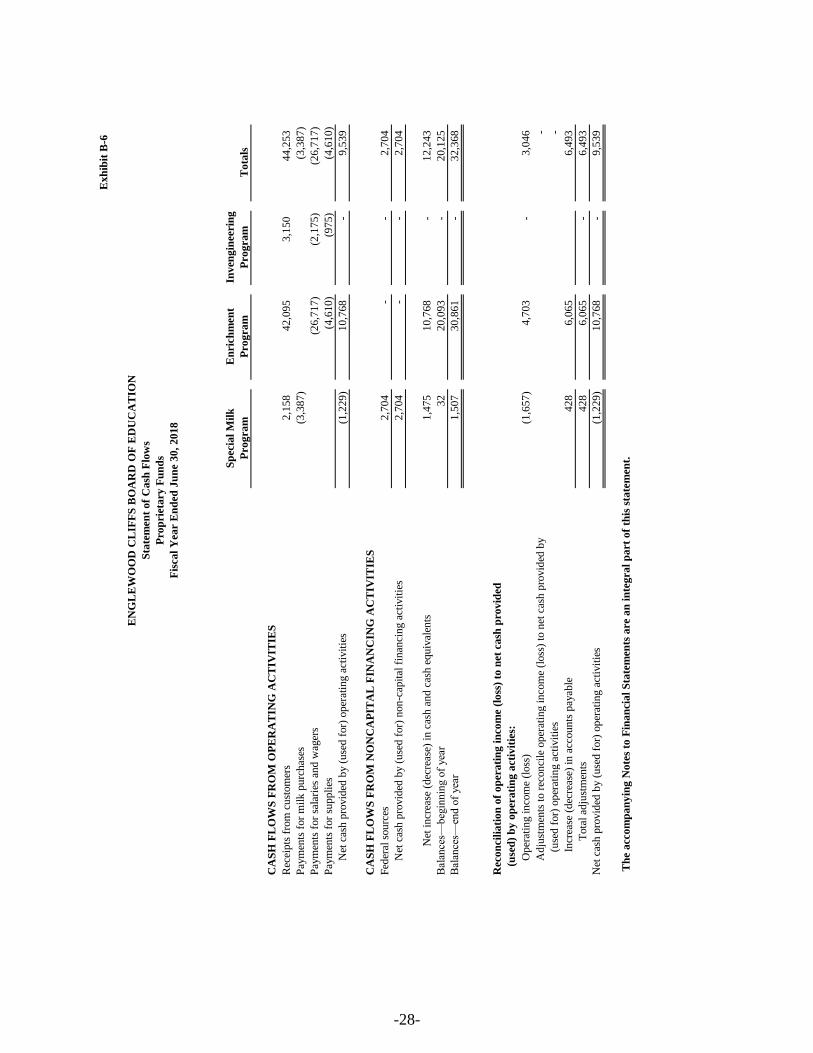
eipts
fro
m c
ust
om
ers
2,1
58
4
2,0
95
3,1
50
4
4,2
53
Pay
men
ts f
or
mil
k p
urc
has
es(3
,38
7)
(3
,38
7)
Pay
men
ts f
or
sala
ries
and w
ager
s(2
6,7
17
)
(2,1
75
)
(2
6,7
17
)
Pay
men
ts f
or
suppli
es(4
,61
0)
(97
5)
(4,6
10
)
Net
cas
h p
rovid
ed b
y (
use
d f
or)
oper
atin
g a
ctiv
itie
s(1
,22
9)
1
0,7
68
-
9,5
39
CA
SH
FL
OW
S F
RO
M N
ON
CA
PIT
AL
FIN
AN
CIN
G A
CT
IVIT
IES
Fed
eral
sourc
es2
,70
4
-
-
2,7
04
Net
cas
h p
rovid
ed b
y (
use
d f
or)
non
-cap
ital
fin
anci
ng a
ctiv
itie
s2
,70
4
-
-
2,7
04
N
et i
ncr
ease
(d
ecre
ase)
in
cas
h a
nd
cas
h e
qu
ival
ents
1,4
75
1
0,7
68
-
12
,24
3
Bal
ance
s—beg
innin
g o
f yea
r3
2
2
0,0
93
-
20
,12
5
Bal
ance
s—en
d o
f yea
r1
,50
7
30
,86
1
-
3
2,3
68
Rec
on
cili
ati
on
of
op
erati
ng i
nco
me
(lo
ss)
to n
et c
ash
pro
vid
ed
(
use
d)
by
op
erati
ng a
ctiv
itie
s:
Oper
atin
g i
nco
me
(loss
)(1
,65
7)
4
,70
3
-
3,0
46
Adju
stm
ents
to r
econci
le o
per
atin
g i
nco
me
(loss
) to
net
cas
h p
rovid
ed b
y-
(use
d f
or)
op
erat
ing a
ctiv
itie
s-
Incr
ease
(d
ecre
ase)
in
acc
ou
nts
pay
able
42
8
6,0
65
6
,49
3
Tota
l ad
just
men
ts4
28
6
,06
5
-
6,4
93
Net
cas
h p
rovid
ed b
y (
use
d f
or)
oper
atin
g a
ctiv
itie
s(1
,22
9)
1
0,7
68
-
9,5
39
Th
e acc
om
pan
yin
g N
ote
s to
Fin
an
cia
l S
tate
men
ts a
re a
n i
nte
gra
l p
art
of
this
sta
tem
ent.
EN
GL
EW
OO
D C
LIF
FS
BO
AR
D O
F E
DU
CA
TIO
N
Sta
tem
ent
of
Ca
sh F
low
s
Pro
pri
eta
ry F
un
ds
Fis
cal
Yea
r E
nd
ed J
un
e 3
0,
20
18
-28-
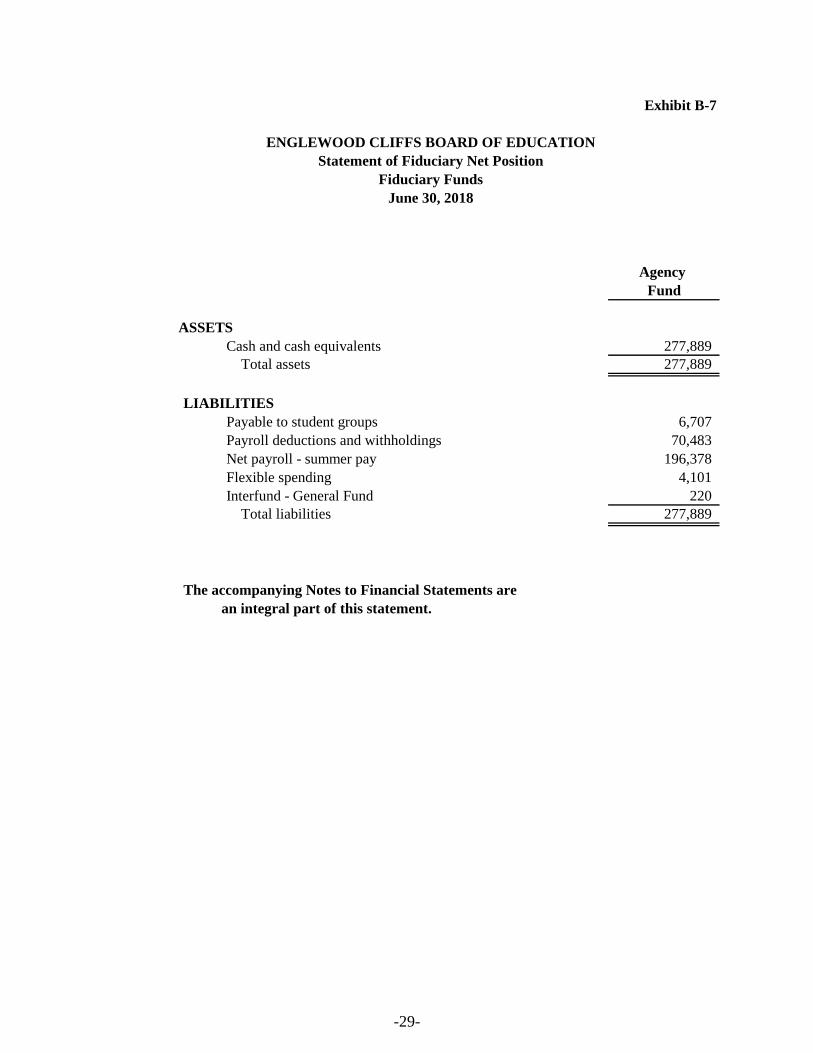
Exhibit B-7
Agency
Fund
ASSETS
Cash and cash equivalents 277,889
Total assets 277,889
LIABILITIES
Payable to student groups 6,707
Payroll deductions and withholdings 70,483
Net payroll - summer pay 196,378
Flexible spending 4,101
Interfund - General Fund 220
Total liabilities 277,889
an integral part of this statement.
ENGLEWOOD CLIFFS BOARD OF EDUCATION
Statement of Fiduciary Net Position
Fiduciary Funds
June 30, 2018
The accompanying Notes to Financial Statements are
-29-

NOTES TO THE FINANCIAL STATEMENTS
Borough of Englewood Cliffs School DistrictNotes to the Basic Financial Statementsfor the fiscal year ended June 30, 2018
NOTE 1. SUMMARY OF SIGNIFICANT ACCOUNTING POLICIES
The financial statements of the Board of Education of the Borough of Englewood Cliffs School District havebeen prepared in conformity with accounting principles generally accepted in the United States of America(GAAP) as applied to governmental units. The Governmental Accounting Standards Board (GASB) is theaccepted standard-setting body for establishing governmental accounting and financial reporting principles. The more significant of the board’s accounting policies are described below.
A. Description of the School District and Reporting Entity:
The Board of Education (“Board”) of the Borough of Englewood Cliffs School District (“District”) is aninstrumentality of the State of New Jersey, established to function as an educational institution. TheBorough of Englewood Cliffs School District is a Type II district located in the County of Bergen, State ofNew Jersey. As a Type II district, the School District functions independently through a Board of Education. The board is comprised of nine members elected to three-year terms. The purpose of the District is toeducate students in grades K-8. A superintendent is appointed by the Board and is responsible for theadministrative control of the District. Under existing statutes, the Board’s duties and powers include, butare not limited to, the development and adoption of a school program; the establishment, organization andoperation of schools; and the acquisition, maintenance and disposition of school property.
The Board also has broad financial responsibilities, including the approval of the annual budget and theestablishment of a system of accounting and budgetary controls.
Governmental Accounting Standards Board publication, Codification of Governmental Accounting andFinancial Reporting Standards, Section 2100, “Defining the Financial Reporting Entity” establishesstandards to determine whether a governmental component unit should be included in the financial reportingentity. The basic criterion for inclusion or exclusion from the financial reporting entity is the exercise ofoversight responsibility over agencies, boards and commissions by the primary government. The exerciseof oversight responsibility includes financial interdependency and a resulting financial benefit or burdenrelationship, selection of governing authority, designation of management, ability to significantly influenceoperations, and accountability for fiscal matters. In addition, certain legally separate, tax-exempt entitiesthat meet specific criteria (i.e. benefit of economic resources, access/entitlement to economic resources, andsignificance) should be included in the financial reporting entity. The combined financial statements includeall funds of the District over which the Board exercises operating control. The operations of the Districtinclude elementary schools and a middle school, located in the Borough of Englewood Cliffs. There wereno additional entities required to be included in the reporting entity under the criteria as described above,in the current fiscal year. Furthermore, the District is not includable in any other reporting entity on the basisof such criteria.
-30-
Borough of Englewood Cliffs School DistrictNotes to the Basic Financial Statementsfor the fiscal year ended June 30, 2018
NOTE 1. SUMMARY OF SIGNIFICANT ACCOUNTING POLICIES, (continued)
B. Basis of Presentation:
The Board’s basic financial statements consist of District-wide statements, including a statement of netposition and a statement of activities, and fund financial statements which provide a more detailed level offinancial information.
District-wide Financial Statements:
The statement of net position and the statement of activities display information about the Board as a whole. These statements include the financial activities of the overall District, except for the fiduciary funds. Thestatements distinguish between those activities of the Board that are governmental and those that areconsidered business-type activities.
The statement of net position presents the financial condition of the governmental and business-typeactivities of the Board at year-end. The statement of activities presents a comparison between directexpenses and program revenues for each program or function of the governmental activities and for thebusiness-type activities of the Board. Direct expenses are those that are specifically associated with aservice, program or department and therefore clearly identifiable to a particular function. Program revenuesinclude charges paid by the recipient of the goods or services offered by the program, grants andcontributions that are restricted to meeting the operational or capital requirements of a particular program. Revenues which are not classified as program revenues are presented as general revenues of the Board, withcertain limited exceptions. The comparison of direct expenses with program revenues identifies the extentto which each business segment or governmental function is self-financing or draws from the generalrevenues of the Board.
Fund Financial Statements:
During the fiscal year, the School District segregates transactions related to certain School District functionsor activities in separate funds in order to aid financial management and to demonstrate legal compliance. The fund financial statements provide information about the District’s funds, including its fiduciary funds. Separate statements for each fund category - government, proprietary, and fiduciary - are presented. TheNew Jersey Department of Education (NJDOE) has elected to require New Jersey districts to treat eachgovernmental fund as a major fund in accordance with the option noted in GASB No. 34, paragraph 76. TheNJDOE believes that the presentation of all funds as major is important for public interest and to promoteconsistency among district financial reporting models. The various funds of the Board are grouped into thecategories governmental, proprietary and fiduciary.
-31-
Borough of Englewood Cliffs School DistrictNotes to the Basic Financial Statementsfor the fiscal year ended June 30, 2018
NOTE 1. SUMMARY OF SIGNIFICANT ACCOUNTING POLICIES, (continued)
Fund Financial Statements: (continued)
GOVERNMENTAL FUNDS
Governmental funds are those through which most governmental functions of the Board are financed. Governmental fund reporting focuses on the sources, uses and balances of current financial resources. Expendable assets are assigned to the various governmental funds according to the purposes for whichthey may or must be used. Current liabilities are assigned to the fund from which they will be paid. The difference between governmental fund assets and liabilities is reported as fund balance. Thefollowing are the Board’s governmental funds:
General Fund - The General Fund is the general operating fund of the Board. It is used to account forall financial resources except those required to be accounted for in another fund. Included are certainexpenditures for vehicles and movable instructional or noninstructional equipment which are classifiedin the Capital Outlay subfund.
As required by the New Jersey State Department of Education, the Board includes budgeted CapitalOutlay in this fund. Accounting principles generally accepted in the United States of America as theypertain to governmental entities state that General Fund resources may be used to directly financecapital outlays for long-lived improvements as long as the resources in such cases are derivedexclusively from unrestricted revenues.
Resources for budgeted capital outlay purposes are normally derived from State of New Jersey Aid,District taxes and appropriated fund balance. Expenditures are those that result in the acquisition ofor additions to fixed assets for land, existing buildings, improvements of grounds, construction ofbuildings, additions to or remodeling of buildings and the purchase of built-in equipment. Theseresources can be transferred from and to Current Expense by board resolution.
Special Revenue Fund - The Special Revenue Fund is used to account for the proceeds of specificrevenue from State and Federal Government, (other than major capital projects, Debt Service or theEnterprise Funds) and local appropriations that are legally restricted to expenditures for specifiedpurposes.
Capital Projects Fund - The Capital Projects Fund is used to account for all financial resources to beused for the acquisition or construction of major capital facilities (other than those financed byProprietary Funds). The financial resources are derived from sale of bonds, lease purchases and otherrevenues.
-32-
Borough of Englewood Cliffs School DistrictNotes to the Basic Financial Statementsfor the fiscal year ended June 30, 2018
NOTE 1. SUMMARY OF SIGNIFICANT ACCOUNTING POLICIES, (continued)
Fund Financial Statements: (continued)
GOVERNMENTAL FUNDS, (continued)
Debt Service Fund - The debt service fund is used to account for the accumulation of resources forand the payment of principal and interest on bonds issued to finance major property acquisition,construction and improvement programs.
PROPRIETARY FUNDS
The focus of Proprietary Fund measurement is upon determination of net income, changes in netposition, financial position and cash flows. The accounting principles generally accepted in the UnitedStates of America applicable are those similar to businesses in the private sector. Proprietary funds areclassified as enterprise or internal service; the Board has no internal service funds. The following isa description of the Proprietary Funds of the Board:
Enterprise Funds - The Enterprise Funds are utilized to account for operations that are financed andoperated in a manner similar to private business enterprises -- where the intent of the Board is that thecosts (i.e. expenses including depreciation and indirect costs) of providing goods or services to thestudents on a continuing basis be financed or recovered primarily through user charges; or, where theBoard has decided that periodic determination of revenues earned, expenses incurred, and/or netincome is appropriate for capital maintenance, public policy, management control, accountability orother purposes.
The Board's Enterprise Fund is comprised of the Special Milk, Enrichment and InvengineeringPrograms.
FIDUCIARY FUNDS
Fiduciary Fund - Fiduciary Fund reporting focuses on net position and changes in net position. TheFiduciary Funds are used to account for assets held by the Board on behalf of individuals, privateorganizations, other governments and/or other funds. Fiduciary Funds include UnemploymentCompensation Insurance, Student Activities Fund, Payroll and Payroll Agency Funds.
C. Measurement Focus:
District-wide Financial Statements
The District-wide statements (i.e., the statement of net position and the statement of activities) are preparedusing the economic resources measurements focus and the accrual basis of accounting. All assets andliabilities associated with the operation of the Board are included on the statement of net position, exceptfor fiduciary funds.
-33-
Borough of Englewood Cliffs School DistrictNotes to the Basic Financial Statementsfor the fiscal year ended June 30, 2018
NOTE 1. SUMMARY OF SIGNIFICANT ACCOUNTING POLICIES, (continued)
C. Measurement Focus: (continued)
Fund Financial Statements
All governmental funds are accounted for using a flow of current financial resources measurement focus. With this measurement focus, only current assets and current liabilities generally are included on the balancesheet. The statement of revenues, expenditures and changes in fund balances reports on the sources (i.e.,revenues and other financing sources) and uses (i.e., expenditures and other financing uses) of currentfinancial resources. This approach differs from the manner in which the governmental activities of theDistrict-wide financial statements are prepared. Governmental fund financial statements therefore includea reconciliation with brief explanations to better identify the relationship between the government-widestatements and the statements for governmental funds.
Like the District-wide statements, all proprietary fund types are accounted for on a flow of economicresources measurement focus. All assets and all liabilities associated with the operation of these funds areincluded on the statement of net position. The statement of changes in fund net position presents increases(i.e., revenues) and decreases (i.e., expenses) in net total position. The statement of cash flows providesinformation about how the Board finances and meets the cash flow needs of its proprietary activities.
D. Basis of Accounting:
Basis of accounting determines when transactions are recorded in the financial records and reported on thefinancial statements. The District-wide financial statements and the financial statements of the proprietaryand fiduciary funds are prepared using the accrual basis of accounting. Governmental funds use themodified accrual basis of accounting. Differences in the accrual and the modified accrual basis ofaccounting arise in the recognition of revenue, the recording of deferred revenue, and in the presentation ofexpenses versus expenditures.
Revenues - Exchange and Non-exchange Transactions
Revenue resulting from exchange transactions, in which each party gives and receives essentially equalvalue, is recorded on the accrual basis when the exchange takes place. On a modified accrual basis, revenueis recorded in the fiscal year in which the resources are measurable and become available. Available meansthat the resources will be collected within the current fiscal year or are expected to be collected soon enoughthereafter to be used to pay liabilities of the current fiscal year.
-34-
Borough of Englewood Cliffs School DistrictNotes to the Basic Financial Statementsfor the fiscal year ended June 30, 2018
NOTE 1. SUMMARY OF SIGNIFICANT ACCOUNTING POLICIES, (continued)
D. Basis of Accounting: (continued)
Revenues - Exchange and Non-exchange Transactions, (continued)
Nonexchange transactions, in which the Board receives value without directly giving equal value in return,include property taxes, grants, entitlements and donations. On an accrual basis, revenue from property taxesis recognized in the fiscal year for which the taxes are levied. Revenue from grants, entitlements anddonations is recognized in the fiscal year in which all eligibility requirements have been satisfied. Eligibilityrequirements include timing requirements, which specify the year when the resources are required to be usedor the year when use is first permitted, matching requirements, in which the Board must provide localresources to be used for a specified purpose, and expenditure requirements, in which the resources areprovided to the Board on a reimbursement basis. On a modified accrual basis, revenue from nonexchangetransactions must also be available before it can be recognized. Under GAAP, in accordance with GASBNo. 33, Accounting and Financial Reporting for Nonexchange Transactions, the last state aid payment is notconsidered revenue to the school district if the state has not recorded the corresponding expenditure, eventhough state law dictates recording the revenue.
Under the modified accrual basis, the following revenue sources are considered to be both measurable andavailable at year-end: ad valorem property taxes, tuition, unrestricted grants and interest.
Expenses/Expenditures
On the accrual basis of accounting, expenses are recognized at the time they are incurred. The fair value ofdonated commodities used during the year is reported in the operating statement as an expense with a likeamount reported as donated commodities revenue.
The measurement of focus of governmental fund accounting is on decreases in net financial resources(expenditures) rather than expenses. Expenditures are generally recognized in the accounting period inwhich the related fund liability is incurred, if measurable. Allocations of cost, such as depreciation andamortization, are not recognized in the governmental funds.
E. Budgets/Budgetary Control:
Annual appropriated budgets are adopted in the spring of the preceding year for the general, and specialrevenue funds. The budgets are submitted to the county superintendents office for approval. Budgets areprepared using the modified accrual basis of accounting, except for the special revenue fund as describedlater. The legal level of budgetary control is established at line item accounts within each fund. Line itemaccounts are defined as the lowest (most specific) level of detail as established pursuant to the minimumchart of accounts referenced in N.J.A.C. 6A:23-2(g)1. Transfers of appropriations may be made by SchoolBoard resolution at any time during the fiscal year. The Board of Education made additional appropriationsof $159,963 to required maintenance – cleaning, repair and maintenance service from prior yearextraordinary aid and $31,906 in additional State aid for instructional supplies.
-35-
Borough of Englewood Cliffs School DistrictNotes to the Basic Financial Statementsfor the fiscal year ended June 30, 2018
NOTE 1. SUMMARY OF SIGNIFICANT ACCOUNTING POLICIES, (continued)
E. Budgets/Budgetary Control: (continued)
Formal budgetary integration into the accounting system is employed as a management control device duringthe year. For governmental funds there are no substantial differences between the budgetary basis ofaccounting and accounting principles generally accepted in the United States of America with the exceptionof the legally mandated revenue recognition of the last state aid payment for budgetary purposes only andspecial revenue fund as noted below. Encumbrance accounting is also employed as an extension of formalbudgetary integration in the governmental fund types. Unencumbered appropriations lapse at fiscal year end.
The accounting records of the special revenue fund are maintained on the grant accounting budgetary basis. The grant accounting budgetary basis differs from GAAP in that the grant accounting budgetary basisrecognizes encumbrances as expenditures and also recognizes the related revenues, whereas the GAAP basisdoes not. Sufficient supplemental records are maintained to allow for the presentation of GAAP basisfinancial reports.
F. Encumbrances:
Under encumbrance accounting purchase orders, contracts and other commitments for the expenditure ofresources are recorded to reserve a portion of the applicable appropriation. Open encumbrances ingovernmental funds, other than the special revenue fund, are reported as reservations of fund balances atfiscal year end as they do not constitute expenditures or liabilities but rather commitments related tounperformed contracts for goods and services.
Open encumbrances in the special revenue fund, for which the Board has received advances, are reflectedin the balance sheet as unearned revenues at fiscal year end.
The encumbered appropriation authority carries over into the next fiscal year. An entry will be made at thebeginning of the next fiscal year to increase the appropriation reflected in the certified budget by theoutstanding encumbrance amount as of the current fiscal year end.
G. Cash, Cash Equivalents and Investments:
Cash and cash equivalents include petty cash, change funds, cash in banks and all highly liquid investmentswith a maturity of three months or less at the time of purchase and are stated at cost plus accrued interest. U.S. Treasury and agency obligations and certificates of deposit with maturities of one year or less whenpurchased are stated at cost. All other investments are stated at fair value.
New Jersey school districts are limited as to the types of investments and types of financial institutions theymay invest in. New Jersey statute 18A:20-37 provides a list of permissible investments that may bepurchased by New Jersey school districts.
-36-
Borough of Englewood Cliffs School DistrictNotes to the Basic Financial Statementsfor the fiscal year ended June 30, 2018
NOTE 1. SUMMARY OF SIGNIFICANT ACCOUNTING POLICIES, (continued)
G. Cash, Cash Equivalents and Investments: (continued)
Additionally, the Board has adopted a cash management plan that requires it to deposit public funds in publicdepositories protected from loss under the provisions of the Governmental Unit Deposit Protection Act("GUDPA"). GUDPA was enacted in 1970 to protect Governmental Units from a loss of funds on depositwith a failed banking institution in New Jersey.
N.J.S.A. 17:9-41 et. seq. establishes the requirements for the security of deposits of governmental units. Thestatute requires that no governmental unit shall deposit public funds in a public depository unless such fundsare secured in accordance with the Act. Public depositories include Savings and Loan institutions, banks(both state and national banks) and savings banks the deposits of which are federally insured. All publicdepositories must pledge collateral, having a market value at least equal to five percent of the average dailybalance of collected public funds, to secure the deposits of Governmental Units. If a public depository fails,the collateral it has pledged, plus the collateral of all other public depositories, is available to pay the fullamount of their deposits to the Governmental Units.
H. Tuition Payable:
Tuition charges were established by the receiving district. The charges are subject to adjustment when thefinal costs have been determined.
I. Inventories:
On District-wide financial statements, inventories are presented at cost, which approximates market on afirst-in, first-out basis and are expensed when used.
On fund financial statements inventories are valued at cost, which approximates market, using thefirst-in-first-out (FIFO) method. Inventories of proprietary funds consist of food and goods held for resale,as well as supplies, and are expensed when used.
J. Prepaid Items:
Payments made to vendors for services that will benefit periods beyond June 30, 2018, are recorded asprepaid items using the consumption method. A current asset for the prepaid amount is recorded at the timeof purchase and an expenditure/expense is reported in the year in which services are consumed.
K. Short-Term Interfund Receivables/Payables:
On fund financial statements, receivables and payables resulting from short-term interfund loans areclassified as “interfund receivables/payables.” These amounts are eliminated in the governmental andbusiness-type activities columns of the statement of net position, except for the net residual amounts duebetween governmental and business-type activities, which are presented as internal balances.
-37-
Borough of Englewood Cliffs School DistrictNotes to the Basic Financial Statementsfor the fiscal year ended June 30, 2018
NOTE 1. SUMMARY OF SIGNIFICANT ACCOUNTING POLICIES, (continued)
L. Capital Assets:
General capital assets are those assets not specifically related to activities reported in the enterprise fund. These assets generally result from expenditures in the governmental funds. These assets are reported in thegovernmental activities column of the district -wide statement of net position but are not reported in the fundfinancial statements. Capital assets utilized by the enterprise fund are reported both in the business-typeactivity column of the District-wide statement of net position and in the fund.
All capital assets acquired or constructed during the year are recorded at actual cost. Donated fixed assetsare valued at their estimated fair market value on the date received. The capital assets acquired orconstructed prior to June 30, 1993 are valued at cost based on historical records or through estimationprocedures performed by an independent appraisal company. Donated capital assets are valued at theirestimated fair market value on the date received. The Board maintains a capitalization threshold of$2,000.00. The Board does not possess any infrastructure. Improvements are capitalized; the costs ofnormal maintenance and repairs that do not add to the value of the asset or materially extend an asset’s lifeare not.
All reported capital assets except land and construction in progress are depreciated. Improvements aredepreciated over the remaining useful lives of the related capital assets. Depreciation is computed using thestraight-line method over the following useful lives:
Description
GovernmentalActivities
Estimated Lives
Business-TypeActivity
Estimated LivesSites and Improvements 20 years N/A
Buildings and Improvements 7-50 years N/A
Furniture, Equipment and Vehicles 5-20 years 5-20 years
M. Compensated Absences:
Compensated absences are those absences for which employees will be paid, such as vacation, sick leave,and sabbatical leave. A liability for compensated absences that are attributable to services already rendered,and that are not contingent on a specific event that is outside the control of the Board and its employees, isaccrued as the employees earn the rights to the benefits. Compensated absences that relate to future services,or that are contingent on a specific event that is outside the control of the Board and its employees, areaccounted for in the period in which such services are rendered or in which such events take place.
For the District-wide Statements, the current portion is the amount estimated to be used in the followingyear. In accordance with GAAP, for the governmental funds, in the Fund Financial Statements, all of thecompensated absences are considered long-term and therefore, are not a fund liability and represents areconciling item between the fund level and District-wide presentations.
-38-
Borough of Englewood Cliffs School DistrictNotes to the Basic Financial Statementsfor the fiscal year ended June 30, 2018
NOTE 1. SUMMARY OF SIGNIFICANT ACCOUNTING POLICIES, (continued)
N. Deferred Revenue:
Deferred revenue arises when assets are recognized before revenue recognition criteria have been satisfied.
Deferred revenue in the special revenue fund represents cash that has been received but not yet earned. SeeNote 1(F) regarding the special revenue fund.
O. Accrued Liabilities and Long-term Obligations:
All payables, accrued liabilities and long-term obligations are reported in the District-wide financialstatements.
In general, governmental fund payables and accrued liabilities that, once incurred, are paid in a timelymanner and in full from current financial resources, are reported as obligations of the funds. However,claims and judgements, compensated absences, special termination benefits and contractually requiredpension contributions that will be paid from governmental funds are reported as a liability in the fundfinancial statements only to the extent that they are due for payment in the current year. Bonds, long-termobligations, and capital leases that will be paid from governmental funds are recognized as a liability in thefund financial statements when due.
P. Accounting and Financial Reporting for Pensions:
In fiscal year 2015, the District implemented GASB 68. This Statement amends GASB Statement No. 27.It improves accounting and financial reporting by state and local governments for pensions. It also improvesinformation provided by state and local government employers about financial support for pensions that isprovided by other entities. This Statement results from a comprehensive review of the effectiveness ofexisting standards of accounting and financial reporting for pensions with regard to providing decision usefulinformation, supporting assessments of accountability and interperiod equity, and creating additionaltransparency. This Statement replaces the requirement of Statement No. 27, Accounting for Pension by Stateand Local Governmental Employers, as well as the requirements of Statement No. 50, Pension Disclosures,as they relate to pensions that are provided through pension plans administered as trusts or equivalentarrangements that meet certain criteria. The requirements of Statements 27 and 50 remain applicable forpensions that are not covered by the scope of this Statement.
The District has also implemented GASB Statement 71, Pension Transition for Contributions madeSubsequent to the Measurement Date-an amendment to GASB No. 68. The objective of this Statement isto address an issue regarding application of the transition provisions of Statement No. 68, Accounting andFinancial Reporting for Pensions. The issue relates to amounts associated with contributions, if any, madeby a state or local government employer or nonemployer contributing entity to a defined benefit pension planafter the measurement date of the government's beginning net pension liability.
-39-
Borough of Englewood Cliffs School DistrictNotes to the Basic Financial Statementsfor the fiscal year ended June 30, 2018
NOTE 1. SUMMARY OF SIGNIFICANT ACCOUNTING POLICIES, (continued)
P. Accounting and Financial Reporting for Pensions: (continued)
Statement 68 requires a state or local government employer (or nonemployer contributing entity in a specialfunding situation) to recognize a net pension liability measured as of a date (the measurement date) no earlierthan the end of its prior fiscal year. If a state or local government employer or nonemployer contributingentity makes a contribution to a defined benefit pension plan between the measurement date of the reportednet pension liability and the end of the government's reporting period, Statement 68 requires that thegovernment recognize its contribution as a deferred outflow of resources.
In addition, Statement 68 requires recognition of deferred outflows of resources and deferred inflows ofresources for changes in the net pension liability of a state or local government employer or nonemployercontributing entity that arise from other types of events. At transition to Statement 68, if it is not practicalfor an employer or nonemployer contributing entity to determine the amounts of all deferred outflows ofresources and deferred inflows of resources related to pensions, paragraph 137 of Statement 68 required thatbeginning balances for deferred outflows of resources and deferred inflows of resources not be reported.Consequently, if it is not practical to determine the amounts of all deferred outflows of resources anddeferred inflows of resources related to pensions, contributions made after the measurement date of thebeginning net pension liability could not have been reported as deferred outflows of resources at transition.This could have resulted in a significant understatement of an employer or nonemployer contributing entity'sbeginning net position and expense in the initial period of implementation.
This Statement amends paragraph 137 of Statement 68 to require that, at transition, a government recognizea beginning deferred outflow of resources for its pension contributions, if any, made subsequent to themeasurement date of the beginning net pension liability. Statement 68, as amended, continues to require thatbeginning balances for other deferred outflows of resources and deferred inflows of resources related topensions be reported at transition only if it is practical to determine all such amounts.
Q. Deferred Outflows/Inflows of Resources
In addition to assets, the statement of financial position will sometimes report a separate section for deferredoutflows of resources. This separate financial statement element, deferred outflows of resources, representsa consumption of net position that applies to a future period(s) and so will not be recognized as an outflowof resources (expense/expenditure) until then. Currently, the District has only one item that qualifies forreporting in this category, deferred amounts related to pension.
In addition to liabilities, the statement of financial position will sometimes report a separate section fordeferred inflows of resources. This separate financial statement element, deferred inflows of resources,represents an acquisition of net position that applies to a future period(s) and so will not be recognized asan inflow of resources (revenue) until that time. The District has one item that qualifies in this category,deferred amounts related to pension.
-40-
Borough of Englewood Cliffs School DistrictNotes to the Basic Financial Statementsfor the fiscal year ended June 30, 2018
NOTE 1. SUMMARY OF SIGNIFICANT ACCOUNTING POLICIES, (continued)
R. Fund Balances:
Fund balance is divided into five classifications based primarily on the extent to which the Board is boundto observe constraints imposed upon the resources in the governmental funds. The classifications are asfollows:
• Nonspendable fund balance includes amounts that are not in a spendable form (inventory,for example) or are required to be maintained intact (the principal of an endowment fund,for example).
• Restricted fund balance includes amounts that can be spent only for the specific purposesstipulated by external resource providers (for example, grant providers), constitutionally,or through enabling legislation (that is, legislation that creates a new revenue source andrestricts its use). Effectively, restrictions may be changed or lifted only with the consent ofresource providers.
• Committed fund balance includes amounts that can be used only for the specific purposesdetermined by a formal action of the Board’s highest level of decision-making authority. Commitments may be changed or lifted only by the government taking the same formalaction that imposed the constraint originally.
• Assigned fund balance comprises amounts intended to be used by the Board for specificpurposes. Intent can be expressed by the governing body or by an official or body to whichthe governing body delegates the authority. In governmental funds other than the generalfund, assigned fund balance represents the amount that is not restricted or committed. Thisindicates that resources in other governmental funds are, at a minimum, intended to be usedfor the purpose of that fund.
• Unassigned fund balance is the residual classification for the general fund and includes allamounts not contained in the other classifications. Unassigned amounts are technicallyavailable for any purpose. If another governmental fund has a fund balance deficit, then itwill be reported as a negative amount in the unassigned classification in that fund. Positiveunassigned amounts will be reported only in the general fund.
S. Net Position:
Net position represent the difference between assets and liabilities. Net position invested in capital assets,net of related debt consists of capital assets, net of accumulated depreciation, reduced by the outstandingbalances of any borrowings used for the acquisition, construction or improvement of those assets. Netposition are reported as restricted when there are limitations imposed on their use either through the enablinglegislation adopted by the Board or through external restrictions imposed by creditors, grantors or laws orregulations of other governments.
-41-
Borough of Englewood Cliffs School DistrictNotes to the Basic Financial Statementsfor the fiscal year ended June 30, 2018
NOTE 1. SUMMARY OF SIGNIFICANT ACCOUNTING POLICIES, (continued)
S. Net Position: (continued)
The Board applies restricted resources first when an expense is incurred for purposes for which bothrestricted and unrestricted net position are available.
T. Operating Revenues and Expenses:
Operating revenues are those revenues that are generated directly from the primary activity of the proprietaryfunds. For the Board, these revenues are sales for food service. Operating expenses are necessary costsincurred to provide the good or service that is the primary activity of the fund.
U. Extraordinary and Special Items:
Extraordinary items are transactions or events that are both unusual in nature and infrequent in occurrence. Special items are transactions or events that are within the control of the Board and that are either unusualin nature or infrequent in occurrence. Neither type of transaction occurred during the fiscal year.
V. Allocation of Indirect Expenses:
The District reports all direct expenses by function in the Statement of Activities. Direct expenses are thosethat are clearly identifiable with a function. Indirect expenses are allocated to functions but are reportedseparately in the Statement of Activities. Employee benefits, including the employer’s share of socialsecurity, workers compensation, and medical and dental benefits, were allocated based on salaries of thatprogram. TPAF on-behalf contributions and changes in compensated absences have not been allocated andhave been reported as unallocated benefits on the Statement of Activities. Depreciation expense, wherepracticable, is specifically identified by function and is included in the indirect expense column of theStatement of Activities. Depreciation expense that could not be attributed to a specific function isconsidered an indirect expense and is reported separately on the Statement of Activities as unallocateddepreciation. Interest on long-term debt is considered an indirect expense and is reported separately on theStatement of Activities.
W. Use of Estimates:
The preparation of financial statements in accordance with accounting principles generally accepted in theUnited States of America requires management to make estimates and assumptions that effect certainreports, amounts and disclosures. Accordingly, actual results could differ from those estimates.
-42-
Borough of Englewood Cliffs School DistrictNotes to the Basic Financial Statementsfor the fiscal year ended June 30, 2018
NOTE 1. SUMMARY OF SIGNIFICANT ACCOUNTING POLICIES, (continued)
X. Recent Accounting Pronouncements:
The Government Accounting Standards Board issued GASB Statement No. 75, Accounting and FinancialReporting for Postemployment Benefits Other Than Pensions. This Statement applies to governmentemployers who provided OPEB plans to their employees and basically parallels GASB Statement 68 andreplaces GASB Statement 45. The Statement is effective for fiscal years beginning after June 15, 2017 andwas implemented by the District for the year ended June 30, 2018.
In March 2016, the Government Accounting Standards Board issued GASB Statement No. 81, IrrevocableSplit-Interest Agreements. The objective of this Statement is to improve accounting and financial reportingfor irrevocable split-interest agreements by providing recognition and measurement guidance for situationsin which a government is a beneficiary of the agreement. The District does not believe this Statement willhave any effect on future financial statements.
In November 2016, the Government Accounting Standards Board issued GASB Statement No. 83, CertainAsset Retirement Obligations. This Statement establishes criteria for determining the timing and pattern ofrecognition of a liability and a corresponding deferred outflows of resources for asset retirement obligations(AROs). The District does not believe this Statement will have any effect on future financial statements.
In January 2017, the Government Accounting Standards Board issued GASB Statement No. 84, FiduciaryActivities. This Statement establishes criteria for identifying fiduciary activities of all state and localgovernments. The focus on the criteria generally is on (1) whether a government is controlling the assetsof the fiduciary activity and (2) the beneficiaries with whom a fiduciary relationship exists. Separate criteriaare included to identify component units and postemployment benefit arrangements that are fiduciaryactivities. The District is currently evaluating the effects, if any, this Statement may have on future financialstatements.
In March 2017, the Government Accounting Standards Board issued GASB Statement No. 85, Omnibus2017, which addresses practice issues that have been identified during the implementation and applicationof certain GASB statements. This Statement addresses a variety of topics including issues relating toblending component units, goodwill, fair value measurement and application, and postemployment benefits. The District implemented this Statement for the year ended June 30, 2018.
In May 2017, the Governmental Accounting Standards Board issued GASB Statement No. 86, Certain DebtExtinguishment Issues, which improves consistency in accounting and financial reporting for in-substancedefeasance of debt by providing guidance for transactions in which cash and other monetary assets acquiredwith only existing resources—resources other than the proceeds of refunding debt—are placed in anirrevocable trust for the sole purpose of extinguishing debt. This Statement also improves accounting and
-43-
Borough of Englewood Cliffs School DistrictNotes to the Basic Financial Statementsfor the fiscal year ended June 30, 2018
NOTE 1. SUMMARY OF SIGNIFICANT ACCOUNTING POLICIES, (continued)
X. Recent Accounting Pronouncements: (continued)
financial reporting for prepaid insurance on debt that is extinguished and notes to financial statements fordebt that is defeased in substance. The requirements of this Statement are effective for reporting periodsbeginning after June 15, 2017. The District had no transactions of this type for the year ended June 30, 2018.
In June 2017, the Government Accounting Standards Board issued GASB Statement No. 87, Leases, whichimproves accounting and financial reporting for leases by governments. This Statement requires recognitionof certain lease assets and liabilities for leases that previously were classified as operating leases andrecognized as inflows of resources or outflows of resources based on the payment provisions of the contract. It establishes a single model for lease accounting based on the fundamental principle that leases arefinancings of the right to use an underlying asset. The requirements of this Statement are effective forreporting periods beginning after December 15, 2019. The District is currently reviewing what effect, if any,this Statement may have on future financial statements.
In March 2018, Government Accounting Standards Board issued GASB Statement No. 88, CertainDisclosures Related to Debt, Including Direct Borrowings and Direct Placement. The objective of thisStatement is to improve consistency in the information that is disclosed in notes to government financialstatements related to debt, including direct borrowings and direct placements, and to provide financialstatement users with additional essential information about debt. This Statement is effective for reportingperiods beginning after June 15, 2018. The District believes this may impact the disclosures relating to debtin the notes to the financial statements.
NOTE 2. CASH AND CASH EQUIVALENTS AND INVESTMENTS
Cash
Custodial Credit Risk - Deposits
Custodial credit risk is the risk that in the event of a bank failure, the government’s deposits may notbe returned to it. The District’s policy is based on New Jersey Statutes requiring cash be depositedonly in New Jersey based banking institutions that participate in New Jersey Governmental DepositoryProtection Act (GUDPA) or in qualified investments established in New Jersey Statutes 18A:20-37that are treated as cash equivalents. As of June 30, 2018, $-0- of the District’s bank balance of$4,402,263 was exposed to custodial credit
-44-

Borough of Englewood Cliffs School DistrictNotes to the Basic Financial Statementsfor the fiscal year ended June 30, 2018
NOTE 2. CASH AND CASH EQUIVALENTS AND INVESTMENTS, (continued)
Investments
Investment Rate Risk
The District does not have a formal investment policy that limits investment maturities as a means ofmanaging its exposure to fair value losses arising from increasing interest rates. However, New JerseyStatutes 18A:20-37 limits the length of time for most investments to 397 days.
Credit Risk
New Jersey Statutes 18A:20-37 limits school district investments to those specified in the Statutes. The type of allowable investments are Bonds of the United States of America, bonds or otherobligations of the school districts or bonds or other obligations of the local unit or units within whichthe school district is located; obligations of federal agencies not exceeding 397 days; governmentmoney market mutual funds; the State of New Jersey Cash Management Plan; local governmentinvestment pools; or repurchase of fully collateralized securities.
Concentration of Credit Risk
The District places no limit on the amount the District may invest in any one issuer.
NOTE 3. RECEIVABLES
Receivables at June 30, 2018, consisted of accounts and intergovernmental. All receivables areconsidered collectible in full. A summary of the principal items of receivables follows:
GovernmentalFund Financial
Statements
Business-Type
Activities
District WideFinancial
Statements
State Aid $302,003 $ $302,003Federal Aid 13,344 517 13,861
Interfund Receivables 220 220
Gross Receivables 315,567 517 316,084
Less: Allowance for Uncollectibles
Total Receivables, Net $315,567 $517 $316,084
-45-
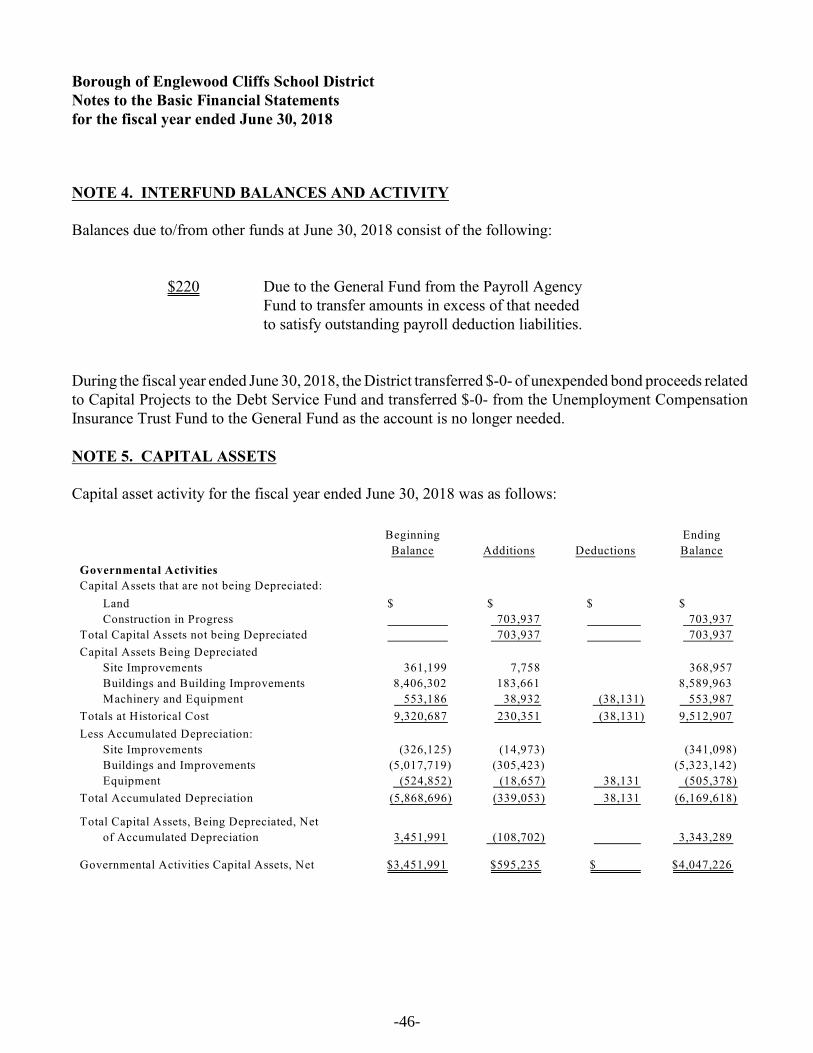
Borough of Englewood Cliffs School DistrictNotes to the Basic Financial Statementsfor the fiscal year ended June 30, 2018
NOTE 4. INTERFUND BALANCES AND ACTIVITY
Balances due to/from other funds at June 30, 2018 consist of the following:
$220 Due to the General Fund from the Payroll AgencyFund to transfer amounts in excess of that neededto satisfy outstanding payroll deduction liabilities.
During the fiscal year ended June 30, 2018, the District transferred $-0- of unexpended bond proceeds relatedto Capital Projects to the Debt Service Fund and transferred $-0- from the Unemployment CompensationInsurance Trust Fund to the General Fund as the account is no longer needed.
NOTE 5. CAPITAL ASSETS
Capital asset activity for the fiscal year ended June 30, 2018 was as follows:
Beginning
Balance Additions Deductions
Ending
Balance
Governmental Activities
Capital Assets that are not being Depreciated:
Land $ $ $ $
Construction in Progress 703,937 703,937
Total Capital Assets not being Depreciated 703,937 703,937
Capital Assets Being Depreciated
Site Improvements 361,199 7,758 368,957
Buildings and Building Improvements 8,406,302 183,661 8,589,963
Machinery and Equipment 553,186 38,932 (38,131) 553,987
Totals at Historical Cost 9,320,687 230,351 (38,131) 9,512,907
Less Accumulated Depreciation:
Site Improvements (326,125) (14,973) (341,098)
Buildings and Improvements (5,017,719) (305,423) (5,323,142)
Equipment (524,852) (18,657) 38,131 (505,378)
Total Accumulated Depreciation (5,868,696) (339,053) 38,131 (6,169,618)
Total Capital Assets, Being Depreciated, Net
of Accumulated Depreciation 3,451,991 (108,702) 3,343,289
Governmental Activities Capital Assets, Net $3,451,991 $595,235 $ $4,047,226
-46-
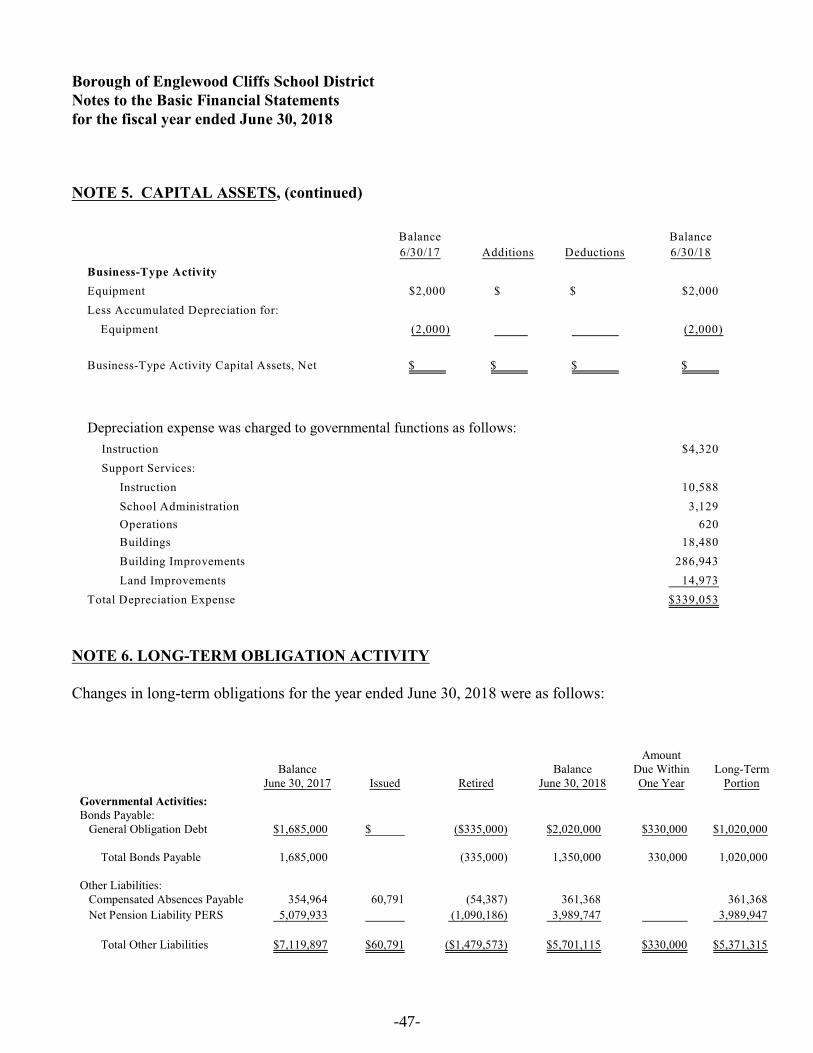
Borough of Englewood Cliffs School DistrictNotes to the Basic Financial Statementsfor the fiscal year ended June 30, 2018
NOTE 5. CAPITAL ASSETS, (continued)
Balance
6/30/17 Additions Deductions
Balance
6/30/18
Business-Type Activity
Equipment $2,000 $ $ $2,000
Less Accumulated Depreciation for:
Equipment (2,000) (2,000)
Business-Type Activity Capital Assets, Net $ $ $ $
Depreciation expense was charged to governmental functions as follows:
Instruction $4,320
Support Services:
Instruction 10,588
School Administration 3,129
Operations 620
Buildings 18,480
Building Improvements 286,943
Land Improvements 14,973
Total Depreciation Expense $339,053
NOTE 6. LONG-TERM OBLIGATION ACTIVITY
Changes in long-term obligations for the year ended June 30, 2018 were as follows:
BalanceJune 30, 2017 Issued Retired
BalanceJune 30, 2018
AmountDue WithinOne Year
Long-TermPortion
Governmental Activities:Bonds Payable: General Obligation Debt $1,685,000 $ ($335,000) $2,020,000 $330,000 $1,020,000
Total Bonds Payable 1,685,000 (335,000) 1,350,000 330,000 1,020,000
Other Liabilities:
Compensated Absences Payable 354,964 60,791 (54,387) 361,368 361,368
Net Pension Liability PERS 5,079,933 (1,090,186) 3,989,747 3,989,947
Total Other Liabilities $7,119,897 $60,791 ($1,479,573) $5,701,115 $330,000 $5,371,315
-47-
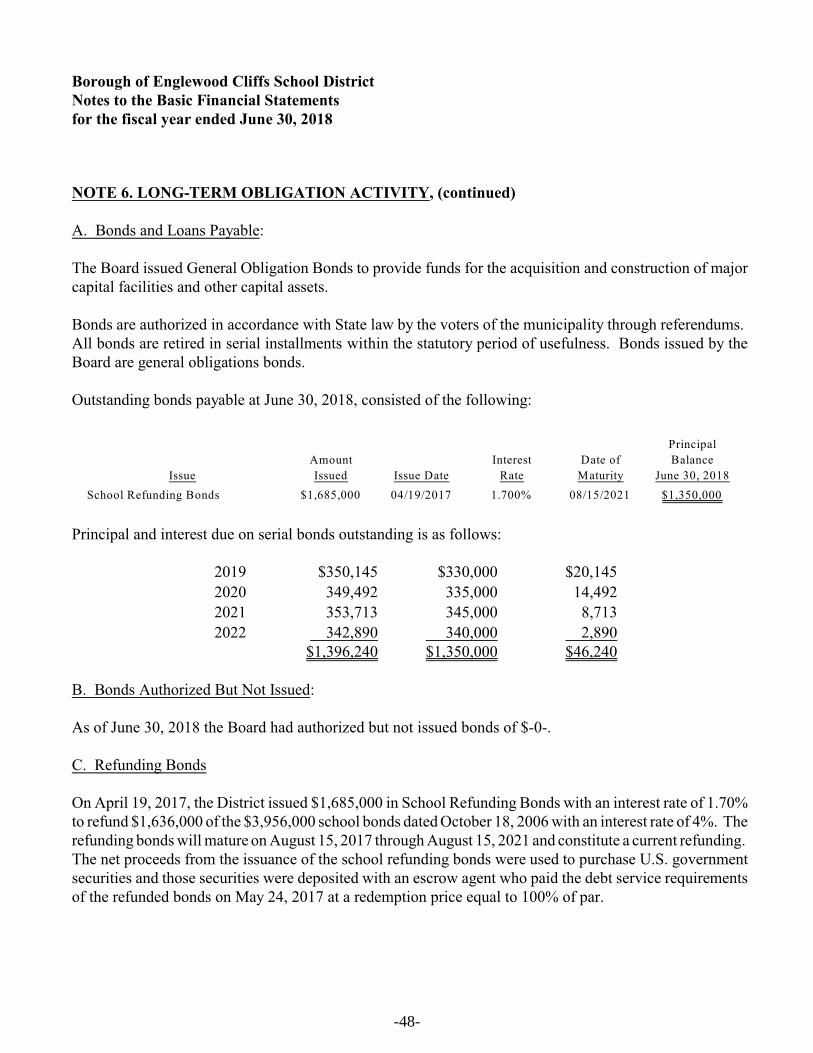
Borough of Englewood Cliffs School DistrictNotes to the Basic Financial Statementsfor the fiscal year ended June 30, 2018
NOTE 6. LONG-TERM OBLIGATION ACTIVITY, (continued)
A. Bonds and Loans Payable:
The Board issued General Obligation Bonds to provide funds for the acquisition and construction of majorcapital facilities and other capital assets.
Bonds are authorized in accordance with State law by the voters of the municipality through referendums. All bonds are retired in serial installments within the statutory period of usefulness. Bonds issued by theBoard are general obligations bonds.
Outstanding bonds payable at June 30, 2018, consisted of the following:
Issue
Amount
Issued Issue Date
Interest
Rate
Date of
Maturity
Principal
Balance
June 30, 2018
School Refunding Bonds $1,685,000 04/19/2017 1.700% 08/15/2021 $1,350,000
Principal and interest due on serial bonds outstanding is as follows:
2019 $350,145 $330,000 $20,145
2020 349,492 335,000 14,492
2021 353,713 345,000 8,713
2022 342,890 340,000 2,890$1,396,240 $1,350,000 $46,240
B. Bonds Authorized But Not Issued:
As of June 30, 2018 the Board had authorized but not issued bonds of $-0-.
C. Refunding Bonds
On April 19, 2017, the District issued $1,685,000 in School Refunding Bonds with an interest rate of 1.70%to refund $1,636,000 of the $3,956,000 school bonds dated October 18, 2006 with an interest rate of 4%. Therefunding bonds will mature on August 15, 2017 through August 15, 2021 and constitute a current refunding. The net proceeds from the issuance of the school refunding bonds were used to purchase U.S. governmentsecurities and those securities were deposited with an escrow agent who paid the debt service requirementsof the refunded bonds on May 24, 2017 at a redemption price equal to 100% of par.
-48-
Borough of Englewood Cliffs School DistrictNotes to the Basic Financial Statementsfor the fiscal year ended June 30, 2018
NOTE 7. OPERATING LEASES
The District has entered into various operating leases for copying equipment and computers which expire in2022. Total operating lease payments made during the year ended June 30, 2018 were $19,744. Futureminimum lease payments are as follows:
Year Amount
June 30, 2019 $34,278June 30, 2020 34,278June 30, 2021 22,488June 30, 2022 18,896June 30, 2023 18,666
$128,606
NOTE 8. PENSION PLANS
Description of Plans - All required employees of the District are covered by either the Public Employees'Retirement System or the Teachers' Pension and Annuity Fund which have been established by state statuteand are administered by the New Jersey Division of Pension and Benefits (Division). According to the Stateof New Jersey Administrative Code, all obligations of both Systems will be assumed by the State of NewJersey should the Systems terminate. The Division issues a publicly available financial report that includesthe financial statements and required supplementary information for the Public Employees Retirement Systemand the Teachers' Pension and Annuity Fund. These reports may be obtained by writing to the Division ofPensions and Benefits, PO Box 295, Trenton, New Jersey, 08625 or reports can be accessed on the internetat: http://www.state.nj.us/treasury/pensions/annrpts_archive.htm.
Teachers' Pension and Annuity Fund (TPAF) - The Teachers' Pension and Annuity Fund was establishedas of January 1, 1955, under the provisions of N.J.S.A. 18A:66 to provide retirement benefits, death,disability and medical benefits to certain qualified members. The Teachers' Pension and Annuity Fund isconsidered a cost-sharing multiple-employer plan with a special funding situation, as under current statute,all employer contributions are made by the State of New Jersey on behalf of the District and the system'sother related non-contributing employers. Membership is mandatory for substantially all teachers or membersof the professional staff certified by the State Board of Examiners, and employees of the Department ofEducation who have titles that are unclassified, professional and certified.
Benefits Provided
The vesting and benefit provisions are set by N.J.S.A. 18A:66. TPAF provides retirement, death anddisability benefits. All benefits vest after ten years of service, except for medical benefits, which vest after25 years of service or under the disability provisions of TPAF. Members are fully vested for their owncontributions and, after three years of service credit, become vested for 2% of related interest earned on thecontributions. In the case of death before retirement, members' beneficiaries are entitled to full interestcredited to the members' accounts.
-49-
Borough of Englewood Cliffs School DistrictNotes to the Basic Financial Statementsfor the fiscal year ended June 30, 2018
NOTE 8. PENSION PLANS, (continued)
The following represents the membership tiers for TPAF:
Tier Definition 1 Members who were enrolled prior to July 1, 2007 2 Members who were eligible to enroll on or after July 1, 2007 and prior to November 2, 2008 3 Members who were eligible to enroll on or after November 2, 2008 and prior to May 22, 2010 4 Members who were eligible to enroll on or after May 22, 2010 and prior to June 28, 2011 5 Members who were eligible to enroll on or after June 28, 2011
Service retirement benefits of 1/55 of final average salary for each year of service credit is available to Tiersth
1 and 2 members upon reaching age 60 and to Tier 3 members upon reaching age 62. Service retirementbenefits of 1/60 of final average salary for each year of service credit is available to Tier 4 members uponth
reaching age 62 and to Tier 5 members upon reaching age 65. Early retirement benefits are available to Tiers1 and 2 members before reaching age 60, to Tiers 3 and 4 before age 62 with 25 or more years of servicecredit and Tier 5 with 30 or more years of service credit before age 65. Benefits are reduced by a fraction ofa percent for each month that a member retires prior to the age at which a member can receive full earlyretirement benefits in accordance with their respective tier. Tier 1 members can receive an unreduced benefitfrom age 50 to age 60 if they have at least 25 years of service. Deferred retirement is available to memberswho have at least 10 years of service credit and have not reached the service retirement age for the respectivetier.
Public Employees' Retirement System (PERS) - The Public Employees' Retirement System (PERS) wasestablished as of January 1, 1955 under the provisions of N.J.S.A. 43:15A to provide retirement, death,disability and medical benefits to certain qualified members. The Public Employees' Retirement System isa cost-sharing multiple-employer plan. Membership is mandatory for substantially all full-time employeesof the State of New Jersey or any county, municipality, school district, or public agency, provided theemployee is not required to be a member of another state-administered retirement system or other state orlocal jurisdiction.
Benefits Provided
The vesting and benefit provisions are set by N.J.S.A. 43:15A. PERS provides retirement, death anddisability benefits. All benefits vest after ten years of service, except for medical benefits, which vest after25 years of service or under the disability provisions of PERS.
The following represents the membership tiers for PERS:
Tier Definition 1 Members who were enrolled prior to July 1, 2007 2 Members who were eligible to enroll on or after July 1, 2007 and prior to November 2, 2008 3 Members who were eligible to enroll on or after November 2, 2008 and prior to May 22, 2010 4 Members who were eligible to enroll on or after May 22, 2010 and prior to June 28, 2011 5 Members who were eligible to enroll on or after June 28, 2011
-50-
Borough of Englewood Cliffs School DistrictNotes to the Basic Financial Statementsfor the fiscal year ended June 30, 2018
NOTE 8. PENSION PLANS, (continued)
Service retirement benefits of 1/55 of final average salary for each year of service credit is available to Tiersth
1 and 2 members upon reaching age 60 and to Tier 3 members upon reaching age 62. Service retirementbenefits of 1/60 of final average salary for each year of service credit is available to Tier 4 members uponth
reaching age 62 and to Tier 5 members upon reaching age 65. Early retirement benefits are available to Tiers1 and 2 members before reaching age 60, to Tiers 3 and 4 before age 62 with 25 or more years of servicecredit and Tier 5 with 30 or more years of service credit before age 65. Benefits are reduced by a fraction ofa percent for each month that a member retires prior to the age at which a member can receive full earlyretirement benefits in accordance with their respective tier. Tier 1 members can receive an unreduced benefitfrom age 50 to age 60 if they have at least 25 years of service. Deferred retirement is available to memberswho have at least 10 years of service credit and have not reached the service retirement age for the respectivetier.
Defined Contribution Retirement Program
Prudential Financial jointly administers the DCRP investments with the NJ Division of Pensions andBenefits. If an employee is ineligible to enroll in the PERS or PFRS, the employee may be eligible to enrollin the DCRP. DCRP provides eligible members with a tax-sheltered, defined contribution retirement benefit,along with life insurance and disability coverage. Vesting is immediate upon enrollment for members of theDCRP.
The State of New Jersey, Department of the Treasury, Division of Pensions and Benefits, issues publiclyavailable financial reports that include the financial statements and required supplementary information ofthe DCRP. The financial reports may be obtained by writing to the State of New Jersey, Department of theTreasury, Division of Pensions and Benefits, PO Box 295, Trenton, New Jersey, 08625-0295.
Employers are required to contribute at an actuarially determined rate. Employee contributions are based onpercentages of 5.50% for DCRP of employees' annual compensation, as defined. The DCRP was establishedJuly 1, 2007, under the provisions of Chapter 92, P.L. 2007 and expanded under the provisions of Chapter89, P.L. 2008. Employee contributions for DCRP are matched by a 3% employer contribution.
Contributions Requirements Fund Based Statements
The Board’s contribution to PERS and DCRP, equal to the required contributions for each year as reportedin the fund based statements, were as follows:
YearEnding PERS DCRP6/30/18 $158,777 $-0- 6/30/17 152,376 -0- 6/30/16 122,164 -0-
-51-
Borough of Englewood Cliffs School DistrictNotes to the Basic Financial Statementsfor the fiscal year ended June 30, 2018
NOTE 8. PENSION PLANS, (continued)
The State of New Jersey contribution to TPAF (paid on-behalf of the District) for normal and post retirementbenefits have been included in the fund-based statements as revenues and expenditures in accordance withGASB 24, paragraphs 7 through 13, as follows:
YearEnding
PensionContributions
Post-RetirementMedical
ContributionsNCGI
Premium
Long-TermDisabilityInsurance
6/30/18 $667,009 $441,261 $16,187 $990
6/30/17 487,098 420,568 17,649 1,351
6/30/16 320,053 400,079 15,943
In addition, the post-retirement medical benefits are included in the district-wide financial statements.
Also, in accordance with N.J.S.A. 18A:66-66 the State of New Jersey reimbursed the Board $332,725 duringthe year ended June 30, 2018 for the employer’s share of social security contributions for TPAF membersas calculated on their base salaries. This amount has been included in the fund-based statements as revenuesand expenditures in accordance with GASB 24, paragraphs 7 through 13.
ACCOUNTING AND FINANCIAL REPORTING FOR PENSION IN THE DISTRICT-WIDESTATEMENTS PER - GASB NO. 68
Public Employees Retirement System (PERS)
At June 30, 2018, the District had a liability of $3,989,747 for its proportionate share of the PERS net pensionliability. The net pension liability was measured as of June 30, 2017, and the total pension liability used tocalculate the net pension liability was determined by an actuarial valuation as of that date. The District'sproportion of the net pension liability was based on a projection of the District's long-term share ofcontributions to the pension plan relative to the projected contributions of all participating governmentalentities, actuarially determined. At June 30, 2017, the District's proportion was .0171392665 percent, whichwas a decrease of .000012743 percent from its proportion measured as of June 30, 2016.
For the year ended June 30, 2018, the District recognized pension expense of $410,933. At June 30, 2018,deferred outflows of resources and deferred inflows of resources related to PERS from the following sources:
-52-
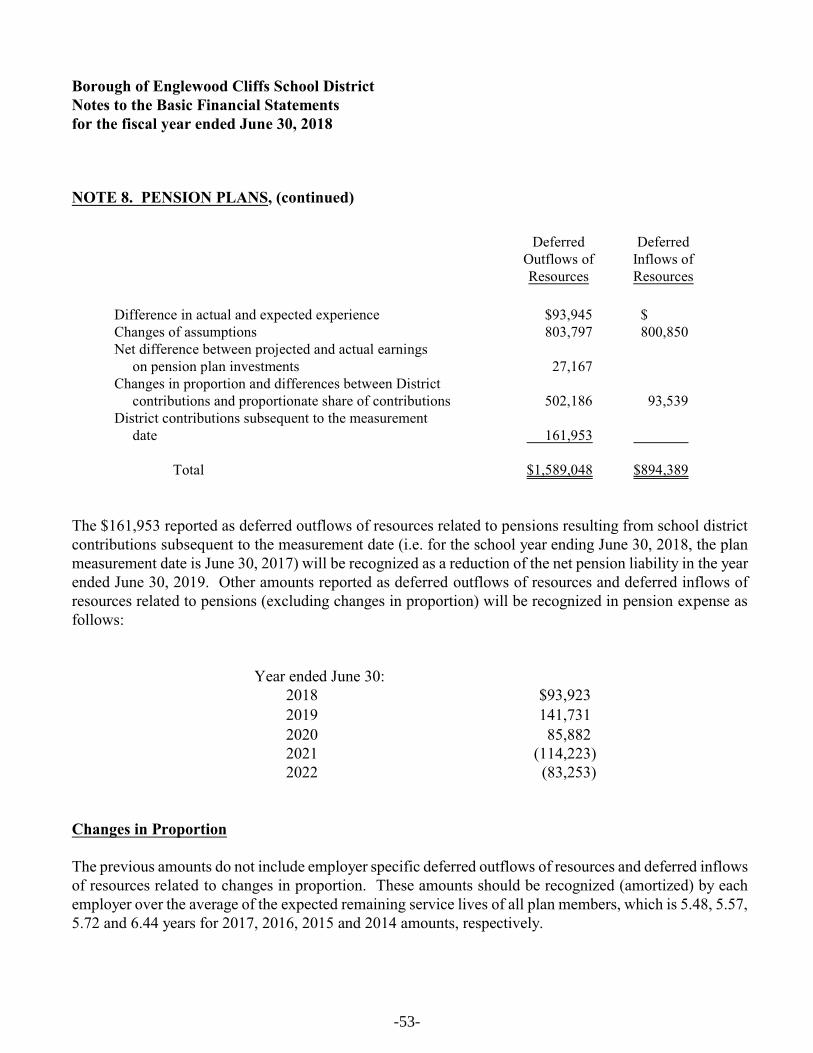
Borough of Englewood Cliffs School DistrictNotes to the Basic Financial Statementsfor the fiscal year ended June 30, 2018
NOTE 8. PENSION PLANS, (continued)
DeferredOutflows ofResources
DeferredInflows ofResources
Difference in actual and expected experience $93,945 $ Changes of assumptions 803,797 800,850Net difference between projected and actual earnings on pension plan investments 27,167Changes in proportion and differences between District contributions and proportionate share of contributions 502,186 93,539District contributions subsequent to the measurement date 161,953
Total $1,589,048 $894,389
The $161,953 reported as deferred outflows of resources related to pensions resulting from school districtcontributions subsequent to the measurement date (i.e. for the school year ending June 30, 2018, the planmeasurement date is June 30, 2017) will be recognized as a reduction of the net pension liability in the yearended June 30, 2019. Other amounts reported as deferred outflows of resources and deferred inflows ofresources related to pensions (excluding changes in proportion) will be recognized in pension expense asfollows:
Year ended June 30:2018 $93,9232019 141,7312020 85,8822021 (114,223)2022 (83,253)
Changes in Proportion
The previous amounts do not include employer specific deferred outflows of resources and deferred inflowsof resources related to changes in proportion. These amounts should be recognized (amortized) by eachemployer over the average of the expected remaining service lives of all plan members, which is 5.48, 5.57,5.72 and 6.44 years for 2017, 2016, 2015 and 2014 amounts, respectively.
-53-
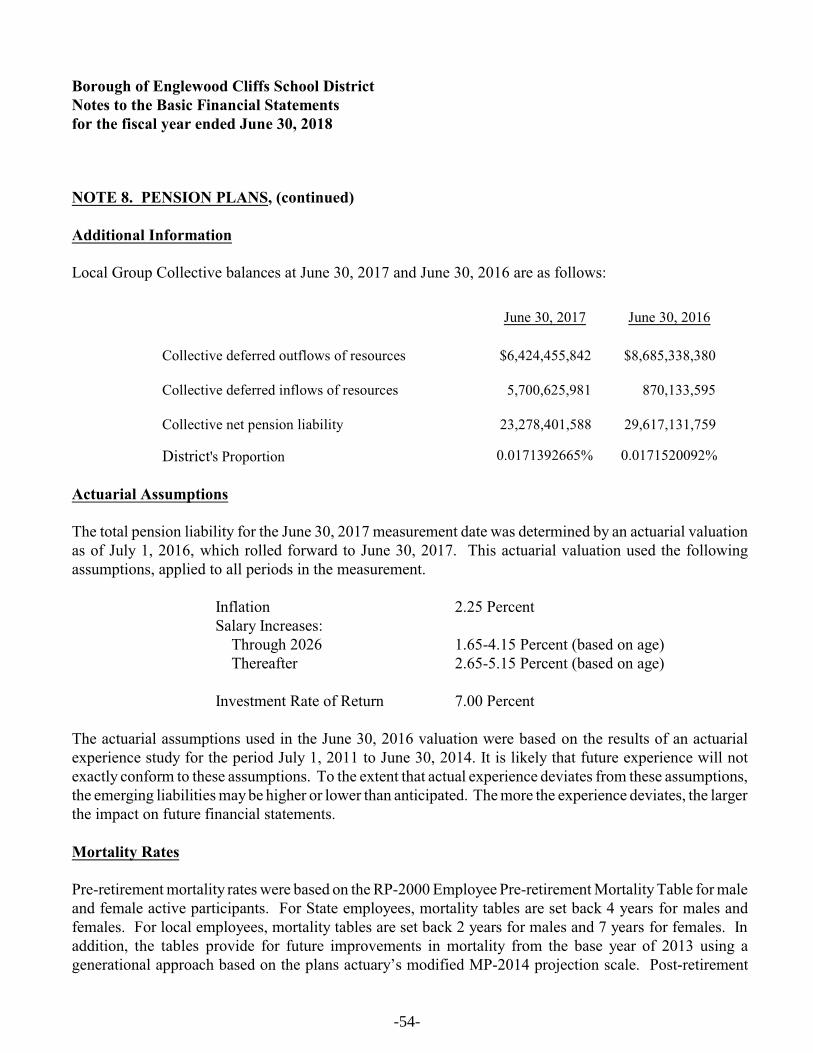
Borough of Englewood Cliffs School DistrictNotes to the Basic Financial Statementsfor the fiscal year ended June 30, 2018
NOTE 8. PENSION PLANS, (continued)
Additional Information
Local Group Collective balances at June 30, 2017 and June 30, 2016 are as follows:
June 30, 2017 June 30, 2016
Collective deferred outflows of resources $6,424,455,842 $8,685,338,380
Collective deferred inflows of resources 5,700,625,981 870,133,595
Collective net pension liability 23,278,401,588 29,617,131,759
District's Proportion 0.0171392665% 0.0171520092%
Actuarial Assumptions
The total pension liability for the June 30, 2017 measurement date was determined by an actuarial valuationas of July 1, 2016, which rolled forward to June 30, 2017. This actuarial valuation used the followingassumptions, applied to all periods in the measurement.
Inflation 2.25 PercentSalary Increases: Through 2026 1.65-4.15 Percent (based on age) Thereafter 2.65-5.15 Percent (based on age)
Investment Rate of Return 7.00 Percent
The actuarial assumptions used in the June 30, 2016 valuation were based on the results of an actuarialexperience study for the period July 1, 2011 to June 30, 2014. It is likely that future experience will notexactly conform to these assumptions. To the extent that actual experience deviates from these assumptions,the emerging liabilities may be higher or lower than anticipated. The more the experience deviates, the largerthe impact on future financial statements.
Mortality Rates
Pre-retirement mortality rates were based on the RP-2000 Employee Pre-retirement Mortality Table for maleand female active participants. For State employees, mortality tables are set back 4 years for males andfemales. For local employees, mortality tables are set back 2 years for males and 7 years for females. Inaddition, the tables provide for future improvements in mortality from the base year of 2013 using agenerational approach based on the plans actuary’s modified MP-2014 projection scale. Post-retirement
-54-
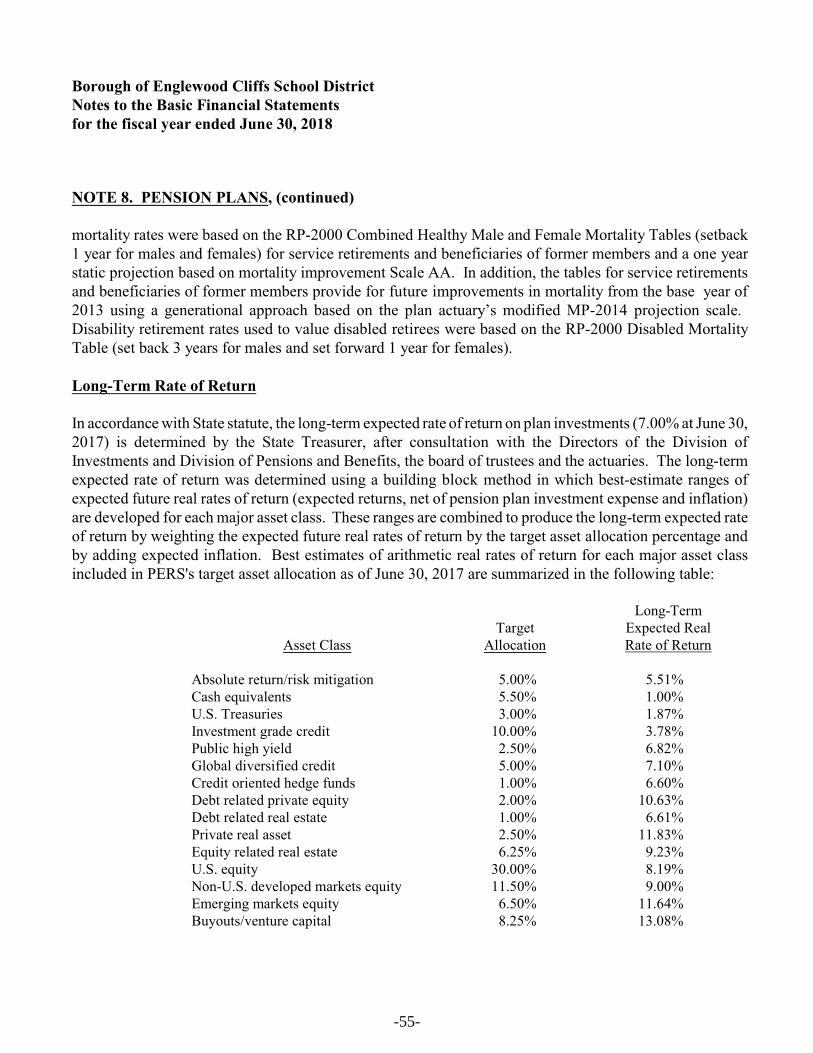
Borough of Englewood Cliffs School DistrictNotes to the Basic Financial Statementsfor the fiscal year ended June 30, 2018
NOTE 8. PENSION PLANS, (continued)
mortality rates were based on the RP-2000 Combined Healthy Male and Female Mortality Tables (setback1 year for males and females) for service retirements and beneficiaries of former members and a one yearstatic projection based on mortality improvement Scale AA. In addition, the tables for service retirementsand beneficiaries of former members provide for future improvements in mortality from the base year of2013 using a generational approach based on the plan actuary’s modified MP-2014 projection scale. Disability retirement rates used to value disabled retirees were based on the RP-2000 Disabled MortalityTable (set back 3 years for males and set forward 1 year for females).
Long-Term Rate of Return
In accordance with State statute, the long-term expected rate of return on plan investments (7.00% at June 30,2017) is determined by the State Treasurer, after consultation with the Directors of the Division ofInvestments and Division of Pensions and Benefits, the board of trustees and the actuaries. The long-termexpected rate of return was determined using a building block method in which best-estimate ranges ofexpected future real rates of return (expected returns, net of pension plan investment expense and inflation)are developed for each major asset class. These ranges are combined to produce the long-term expected rateof return by weighting the expected future real rates of return by the target asset allocation percentage andby adding expected inflation. Best estimates of arithmetic real rates of return for each major asset classincluded in PERS's target asset allocation as of June 30, 2017 are summarized in the following table:
Asset ClassTarget
Allocation
Long-TermExpected RealRate of Return
Absolute return/risk mitigation 5.00% 5.51%Cash equivalents 5.50% 1.00%U.S. Treasuries 3.00% 1.87%Investment grade credit 10.00% 3.78%Public high yield 2.50% 6.82%Global diversified credit 5.00% 7.10%Credit oriented hedge funds 1.00% 6.60%Debt related private equity 2.00% 10.63%Debt related real estate 1.00% 6.61%Private real asset 2.50% 11.83%Equity related real estate 6.25% 9.23%U.S. equity 30.00% 8.19%Non-U.S. developed markets equity 11.50% 9.00%Emerging markets equity 6.50% 11.64%Buyouts/venture capital 8.25% 13.08%
-55-
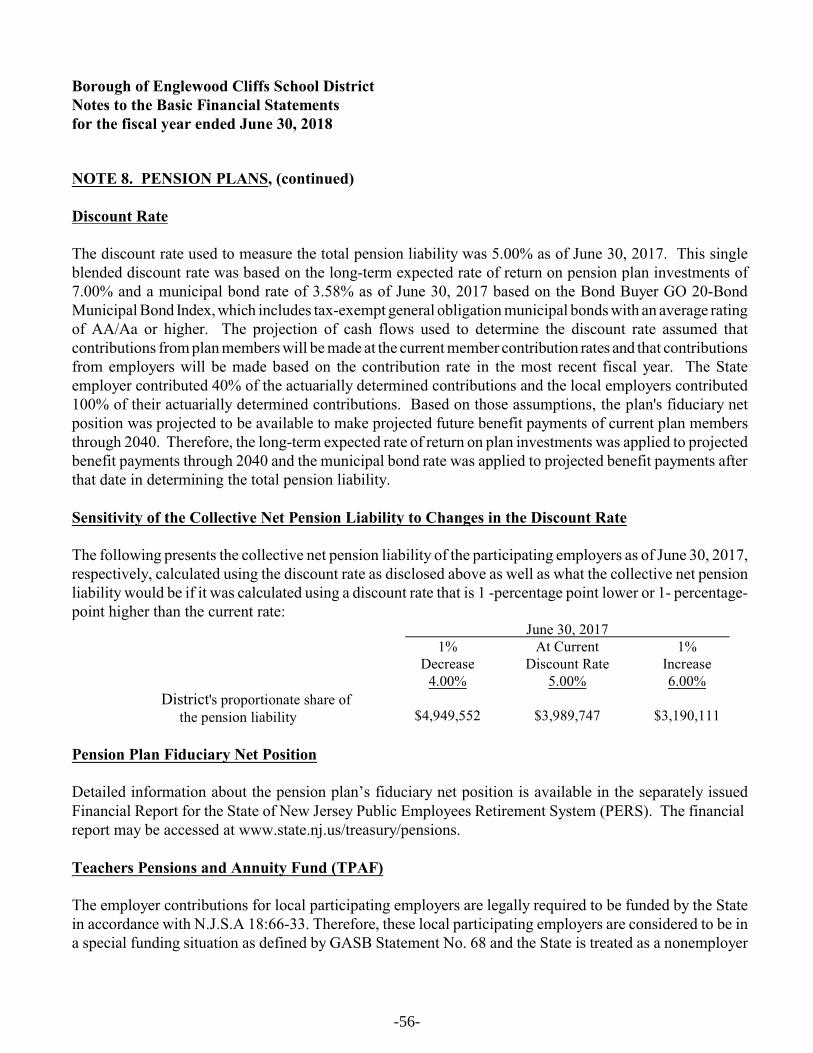
Borough of Englewood Cliffs School DistrictNotes to the Basic Financial Statementsfor the fiscal year ended June 30, 2018
NOTE 8. PENSION PLANS, (continued)
Discount Rate
The discount rate used to measure the total pension liability was 5.00% as of June 30, 2017. This singleblended discount rate was based on the long-term expected rate of return on pension plan investments of7.00% and a municipal bond rate of 3.58% as of June 30, 2017 based on the Bond Buyer GO 20-BondMunicipal Bond Index, which includes tax-exempt general obligation municipal bonds with an average ratingof AA/Aa or higher. The projection of cash flows used to determine the discount rate assumed thatcontributions from plan members will be made at the current member contribution rates and that contributionsfrom employers will be made based on the contribution rate in the most recent fiscal year. The Stateemployer contributed 40% of the actuarially determined contributions and the local employers contributed100% of their actuarially determined contributions. Based on those assumptions, the plan's fiduciary netposition was projected to be available to make projected future benefit payments of current plan membersthrough 2040. Therefore, the long-term expected rate of return on plan investments was applied to projectedbenefit payments through 2040 and the municipal bond rate was applied to projected benefit payments afterthat date in determining the total pension liability.
Sensitivity of the Collective Net Pension Liability to Changes in the Discount Rate
The following presents the collective net pension liability of the participating employers as of June 30, 2017,respectively, calculated using the discount rate as disclosed above as well as what the collective net pensionliability would be if it was calculated using a discount rate that is 1 -percentage point lower or 1- percentage-point higher than the current rate:
June 30, 2017 1%
Decrease4.00%
At CurrentDiscount Rate
5.00%
1%Increase6.00%
District's proportionate share of the pension liability $4,949,552 $3,989,747 $3,190,111
Pension Plan Fiduciary Net Position
Detailed information about the pension plan’s fiduciary net position is available in the separately issuedFinancial Report for the State of New Jersey Public Employees Retirement System (PERS). The financial report may be accessed at www.state.nj.us/treasury/pensions.
Teachers Pensions and Annuity Fund (TPAF)
The employer contributions for local participating employers are legally required to be funded by the Statein accordance with N.J.S.A 18:66-33. Therefore, these local participating employers are considered to be ina special funding situation as defined by GASB Statement No. 68 and the State is treated as a nonemployer
-56-
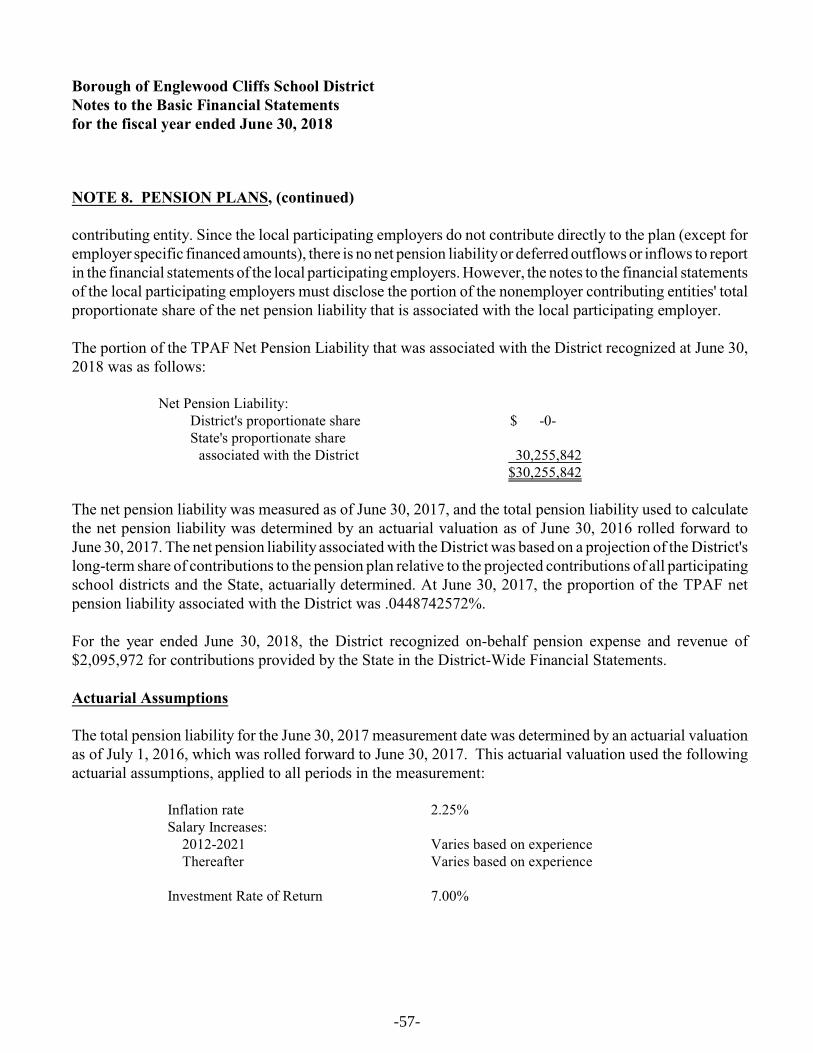
Borough of Englewood Cliffs School DistrictNotes to the Basic Financial Statementsfor the fiscal year ended June 30, 2018
NOTE 8. PENSION PLANS, (continued)
contributing entity. Since the local participating employers do not contribute directly to the plan (except foremployer specific financed amounts), there is no net pension liability or deferred outflows or inflows to reportin the financial statements of the local participating employers. However, the notes to the financial statementsof the local participating employers must disclose the portion of the nonemployer contributing entities' totalproportionate share of the net pension liability that is associated with the local participating employer.
The portion of the TPAF Net Pension Liability that was associated with the District recognized at June 30,2018 was as follows:
Net Pension Liability:District's proportionate share $ -0- State's proportionate share
associated with the District 30,255,842$30,255,842
The net pension liability was measured as of June 30, 2017, and the total pension liability used to calculatethe net pension liability was determined by an actuarial valuation as of June 30, 2016 rolled forward toJune 30, 2017. The net pension liability associated with the District was based on a projection of the District'slong-term share of contributions to the pension plan relative to the projected contributions of all participatingschool districts and the State, actuarially determined. At June 30, 2017, the proportion of the TPAF netpension liability associated with the District was .0448742572%.
For the year ended June 30, 2018, the District recognized on-behalf pension expense and revenue of$2,095,972 for contributions provided by the State in the District-Wide Financial Statements.
Actuarial Assumptions
The total pension liability for the June 30, 2017 measurement date was determined by an actuarial valuationas of July 1, 2016, which was rolled forward to June 30, 2017. This actuarial valuation used the followingactuarial assumptions, applied to all periods in the measurement:
Inflation rate 2.25%Salary Increases: 2012-2021 Varies based on experience Thereafter Varies based on experience
Investment Rate of Return 7.00%
-57-
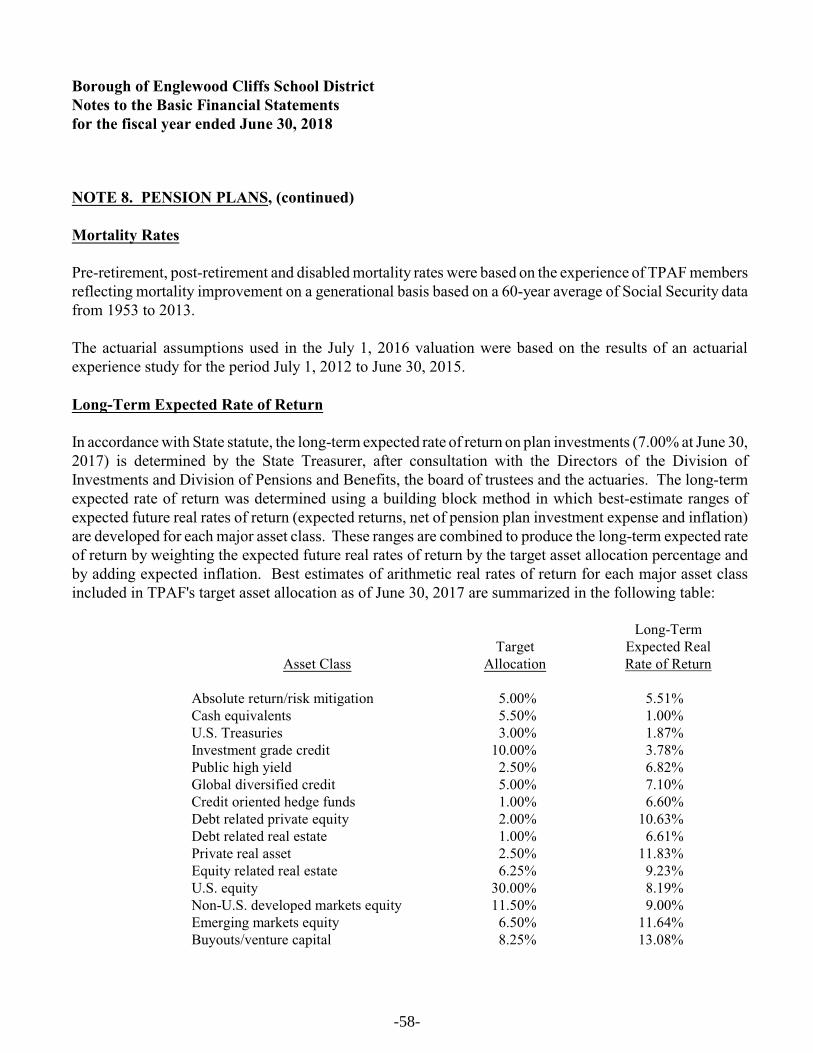
Borough of Englewood Cliffs School DistrictNotes to the Basic Financial Statementsfor the fiscal year ended June 30, 2018
NOTE 8. PENSION PLANS, (continued)
Mortality Rates
Pre-retirement, post-retirement and disabled mortality rates were based on the experience of TPAF membersreflecting mortality improvement on a generational basis based on a 60-year average of Social Security datafrom 1953 to 2013.
The actuarial assumptions used in the July 1, 2016 valuation were based on the results of an actuarialexperience study for the period July 1, 2012 to June 30, 2015.
Long-Term Expected Rate of Return
In accordance with State statute, the long-term expected rate of return on plan investments (7.00% at June 30,2017) is determined by the State Treasurer, after consultation with the Directors of the Division ofInvestments and Division of Pensions and Benefits, the board of trustees and the actuaries. The long-termexpected rate of return was determined using a building block method in which best-estimate ranges ofexpected future real rates of return (expected returns, net of pension plan investment expense and inflation)are developed for each major asset class. These ranges are combined to produce the long-term expected rateof return by weighting the expected future real rates of return by the target asset allocation percentage andby adding expected inflation. Best estimates of arithmetic real rates of return for each major asset classincluded in TPAF's target asset allocation as of June 30, 2017 are summarized in the following table:
Asset ClassTarget
Allocation
Long-TermExpected RealRate of Return
Absolute return/risk mitigation 5.00% 5.51%Cash equivalents 5.50% 1.00%U.S. Treasuries 3.00% 1.87%Investment grade credit 10.00% 3.78%Public high yield 2.50% 6.82%Global diversified credit 5.00% 7.10%Credit oriented hedge funds 1.00% 6.60%Debt related private equity 2.00% 10.63%Debt related real estate 1.00% 6.61%Private real asset 2.50% 11.83%Equity related real estate 6.25% 9.23%U.S. equity 30.00% 8.19%Non-U.S. developed markets equity 11.50% 9.00%Emerging markets equity 6.50% 11.64%Buyouts/venture capital 8.25% 13.08%
-58-
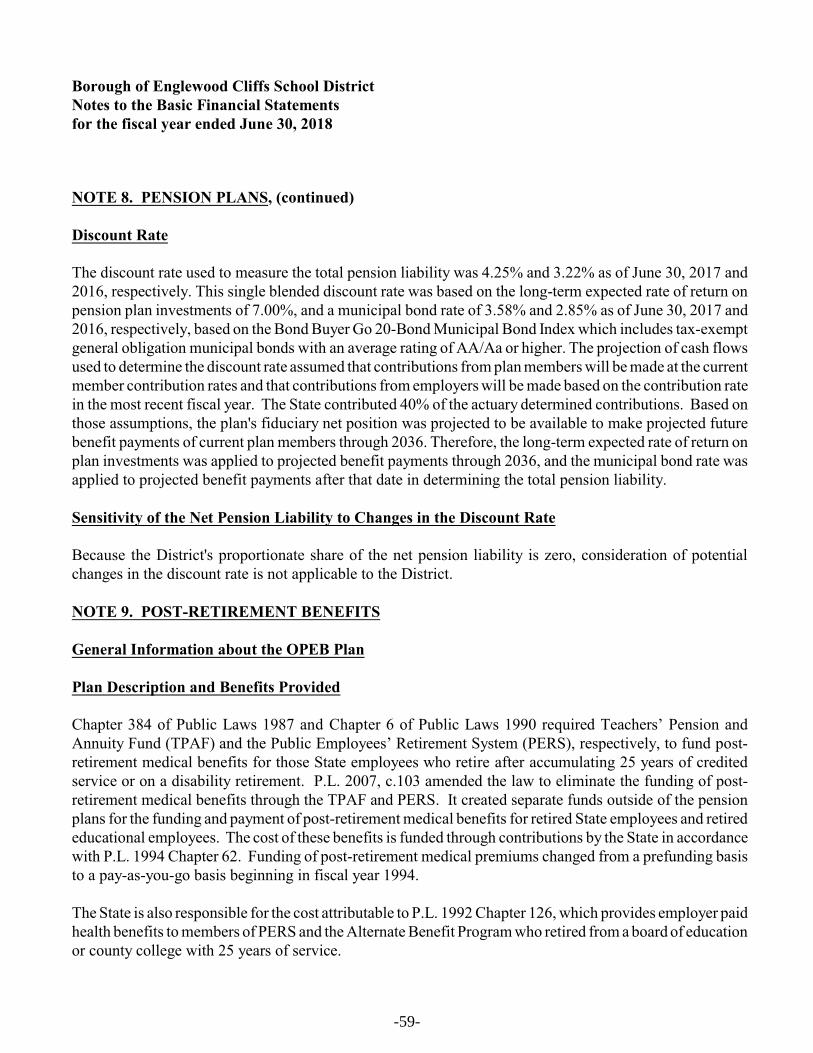
Borough of Englewood Cliffs School DistrictNotes to the Basic Financial Statementsfor the fiscal year ended June 30, 2018
NOTE 8. PENSION PLANS, (continued)
Discount Rate
The discount rate used to measure the total pension liability was 4.25% and 3.22% as of June 30, 2017 and2016, respectively. This single blended discount rate was based on the long-term expected rate of return onpension plan investments of 7.00%, and a municipal bond rate of 3.58% and 2.85% as of June 30, 2017 and2016, respectively, based on the Bond Buyer Go 20-Bond Municipal Bond Index which includes tax-exemptgeneral obligation municipal bonds with an average rating of AA/Aa or higher. The projection of cash flowsused to determine the discount rate assumed that contributions from plan members will be made at the currentmember contribution rates and that contributions from employers will be made based on the contribution ratein the most recent fiscal year. The State contributed 40% of the actuary determined contributions. Based onthose assumptions, the plan's fiduciary net position was projected to be available to make projected futurebenefit payments of current plan members through 2036. Therefore, the long-term expected rate of return onplan investments was applied to projected benefit payments through 2036, and the municipal bond rate wasapplied to projected benefit payments after that date in determining the total pension liability.
Sensitivity of the Net Pension Liability to Changes in the Discount Rate
Because the District's proportionate share of the net pension liability is zero, consideration of potentialchanges in the discount rate is not applicable to the District.
NOTE 9. POST-RETIREMENT BENEFITS
General Information about the OPEB Plan
Plan Description and Benefits Provided
Chapter 384 of Public Laws 1987 and Chapter 6 of Public Laws 1990 required Teachers’ Pension andAnnuity Fund (TPAF) and the Public Employees’ Retirement System (PERS), respectively, to fund post-retirement medical benefits for those State employees who retire after accumulating 25 years of creditedservice or on a disability retirement. P.L. 2007, c.103 amended the law to eliminate the funding of post-retirement medical benefits through the TPAF and PERS. It created separate funds outside of the pensionplans for the funding and payment of post-retirement medical benefits for retired State employees and retirededucational employees. The cost of these benefits is funded through contributions by the State in accordancewith P.L. 1994 Chapter 62. Funding of post-retirement medical premiums changed from a prefunding basisto a pay-as-you-go basis beginning in fiscal year 1994.
The State is also responsible for the cost attributable to P.L. 1992 Chapter 126, which provides employer paidhealth benefits to members of PERS and the Alternate Benefit Program who retired from a board of educationor county college with 25 years of service.
-59-
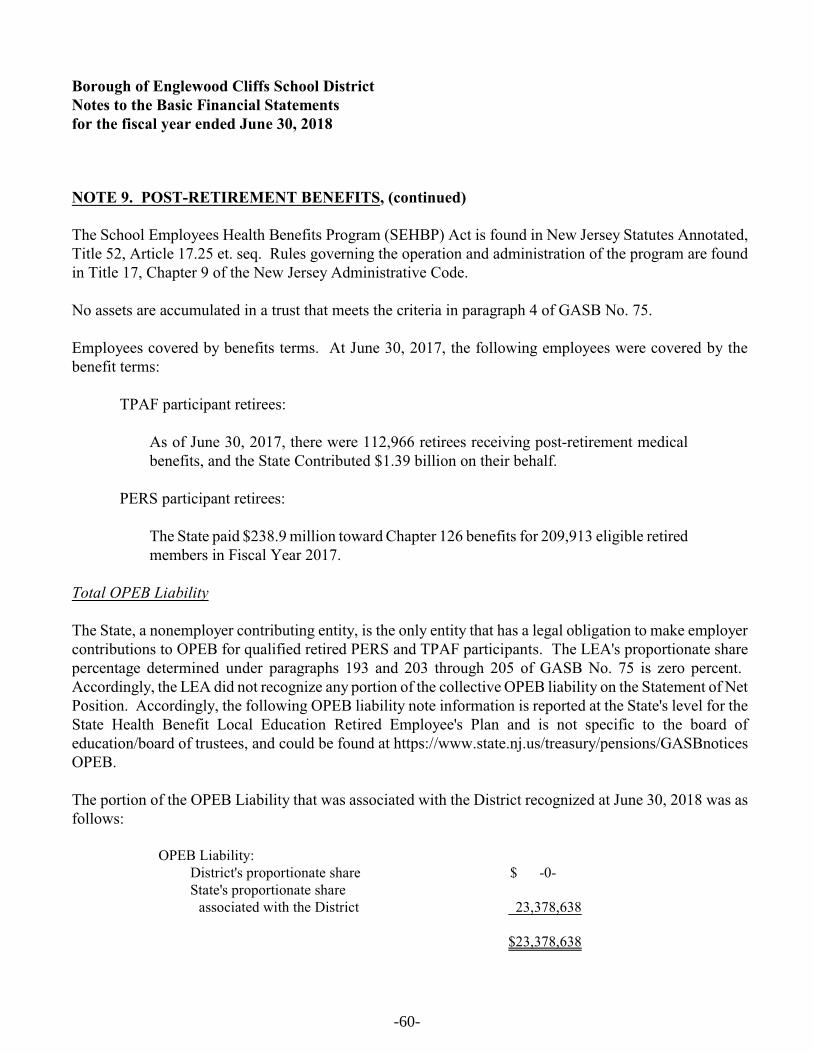
Borough of Englewood Cliffs School DistrictNotes to the Basic Financial Statementsfor the fiscal year ended June 30, 2018
NOTE 9. POST-RETIREMENT BENEFITS, (continued)
The School Employees Health Benefits Program (SEHBP) Act is found in New Jersey Statutes Annotated,Title 52, Article 17.25 et. seq. Rules governing the operation and administration of the program are foundin Title 17, Chapter 9 of the New Jersey Administrative Code.
No assets are accumulated in a trust that meets the criteria in paragraph 4 of GASB No. 75.
Employees covered by benefits terms. At June 30, 2017, the following employees were covered by thebenefit terms:
TPAF participant retirees:
As of June 30, 2017, there were 112,966 retirees receiving post-retirement medicalbenefits, and the State Contributed $1.39 billion on their behalf.
PERS participant retirees:
The State paid $238.9 million toward Chapter 126 benefits for 209,913 eligible retiredmembers in Fiscal Year 2017.
Total OPEB Liability
The State, a nonemployer contributing entity, is the only entity that has a legal obligation to make employercontributions to OPEB for qualified retired PERS and TPAF participants. The LEA's proportionate sharepercentage determined under paragraphs 193 and 203 through 205 of GASB No. 75 is zero percent. Accordingly, the LEA did not recognize any portion of the collective OPEB liability on the Statement of NetPosition. Accordingly, the following OPEB liability note information is reported at the State's level for theState Health Benefit Local Education Retired Employee's Plan and is not specific to the board ofeducation/board of trustees, and could be found at https://www.state.nj.us/treasury/pensions/GASBnoticesOPEB.
The portion of the OPEB Liability that was associated with the District recognized at June 30, 2018 was asfollows:
OPEB Liability:District's proportionate share $ -0- State's proportionate share
associated with the District 23,378,638
$23,378,638
-60-
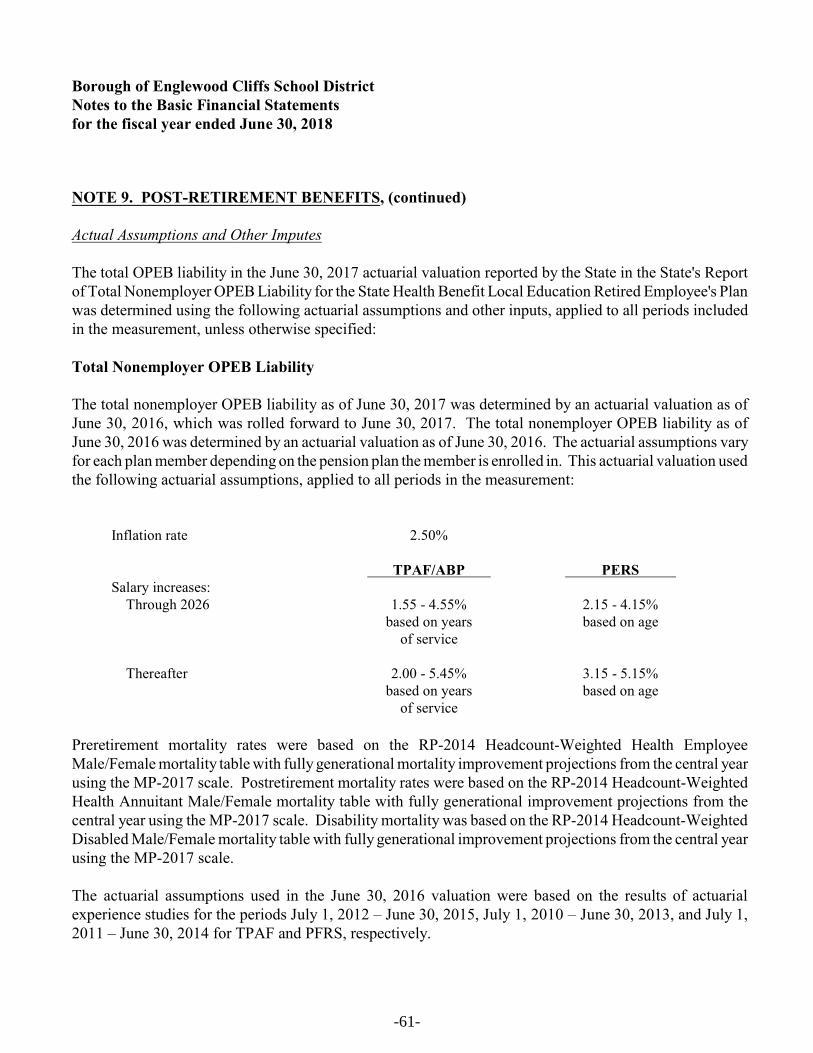
Borough of Englewood Cliffs School DistrictNotes to the Basic Financial Statementsfor the fiscal year ended June 30, 2018
NOTE 9. POST-RETIREMENT BENEFITS, (continued)
Actual Assumptions and Other Imputes
The total OPEB liability in the June 30, 2017 actuarial valuation reported by the State in the State's Reportof Total Nonemployer OPEB Liability for the State Health Benefit Local Education Retired Employee's Planwas determined using the following actuarial assumptions and other inputs, applied to all periods includedin the measurement, unless otherwise specified:
Total Nonemployer OPEB Liability
The total nonemployer OPEB liability as of June 30, 2017 was determined by an actuarial valuation as ofJune 30, 2016, which was rolled forward to June 30, 2017. The total nonemployer OPEB liability as ofJune 30, 2016 was determined by an actuarial valuation as of June 30, 2016. The actuarial assumptions varyfor each plan member depending on the pension plan the member is enrolled in. This actuarial valuation usedthe following actuarial assumptions, applied to all periods in the measurement:
Inflation rate 2.50%
TPAF/ABP PERS Salary increases: Through 2026 1.55 - 4.55%
based on yearsof service
2.15 - 4.15%based on age
Thereafter 2.00 - 5.45%based on years
of service
3.15 - 5.15%based on age
Preretirement mortality rates were based on the RP-2014 Headcount-Weighted Health EmployeeMale/Female mortality table with fully generational mortality improvement projections from the central yearusing the MP-2017 scale. Postretirement mortality rates were based on the RP-2014 Headcount-WeightedHealth Annuitant Male/Female mortality table with fully generational improvement projections from thecentral year using the MP-2017 scale. Disability mortality was based on the RP-2014 Headcount-WeightedDisabled Male/Female mortality table with fully generational improvement projections from the central yearusing the MP-2017 scale.
The actuarial assumptions used in the June 30, 2016 valuation were based on the results of actuarialexperience studies for the periods July 1, 2012 – June 30, 2015, July 1, 2010 – June 30, 2013, and July 1,2011 – June 30, 2014 for TPAF and PFRS, respectively.
-61-
Borough of Englewood Cliffs School DistrictNotes to the Basic Financial Statementsfor the fiscal year ended June 30, 2018
NOTE 9. POST-RETIREMENT BENEFITS, (continued)
(a) Health Care Trend Assumptions
For pre-Medicare preferred provider organization (PPO) medical benefits, this amount initially is 5.9%and decreases to a 5.0% long-term trend rate after nine years. For self-insured post-65 PPO medicalbenefits, the trend rate is 4.5%. For health maintenance organization (HMO) medical benefits, the trendrate is initially 5.9% and decreases to a 5.0% long-term trend rate after nine years. For prescription drugbenefits, the initial trend rate is 10.5% decreasing to a 5.0% long-term trend rate after eight years. Forthe Medicare Part B reimbursement, the trend rate is 5.0%. The Medicare Advantage trend rate is 4.5%and will continue in all future years.
(b) Discount Rate
The discount rate for June 30, 2017 and 2016 was 3.58% and 2.85%, respectively. This represents themunicipal bond return rate as chosen by the Division. The source is the Bond Buyer Go 20-BondMunicipal Bond Index, which includes tax-exempt general obligation municipal bonds with an averagerating of AA/Aa or higher.
Sensitivity of Total Nonemployer OPEB Liability to Changes in the Discount Rate
Because the District's proportionate share of the OPEB liability is zero, consideration of potential changesin the discount rate is not applicable to the District.
Sensitivity of the Total Nonemployer OPEB Liability to Changes in the Healthcare Cost Trend Rates:
Because the District's proportionate share of the OPEB liability is zero, consideration of potential changesin the healthcare cost trend rates is not applicable to the District.
OPEB Expense and Deferred Outflows of Resources and Deferred Inflows of Resources Related to OPEB:
For the year ended June 30, 2018, the board of education/board of trustees recognized on-behalf OPEBexpense of $1,481,835 in the district-wide financial statements as determined by the State as the total OPEBliability for benefits provided through a defined benefit OPEB plan that is not administered through a trustthat meets the criteria in paragraph 4 of GASB No. 75 and in which there is a special funding situation.
In accordance with GASB No. 75, the Borough of Englewood Cliffs School District's proportionate share ofschool retirees OPEB is zero; therefore, there is no recognition of the allocation of proportionate share ofdeferred outflows of resources and deferred inflows of resources.
-62-
Borough of Englewood Cliffs School DistrictNotes to the Basic Financial Statementsfor the fiscal year ended June 30, 2018
NOTE 10. DEFERRED COMPENSATION
The Board offers its employees a choice of the following deferred compensation plans created in accordancewith Internal Revenue Code Section 403(b). The plans, which are administered by the entities listed below,permits participants to defer a portion of their salary until future years. Amounts deferred under the plansare not available to employees until termination, retirement, death or unforeseeable emergency. The planadministrators are as follows:
Equitable Equi-Vest Facility ServicesWashington National Galic Disbursing CompanyValic
NOTE 11. RISK MANAGEMENT
The District is exposed to various risks of loss related to torts; theft of, damage to, and destruction of assets;errors and omissions; injuries to employees; and natural disasters.
Property and Liability Insurance - The District maintains commercial insurance coverage for property,liability, student accident and surety bonds. A complete schedule of insurance coverage can be found in theStatistical Section of this Comprehensive Annual Financial Report.
There has been no significant reduction in insurance coverage from the previous year nor have there been anysettlements in excess of insurance coverages.
New Jersey Unemployment Compensation Insurance - The District has elected to fund its New JerseyUnemployment Compensation Insurance under the “Contributory Method”. Under this plan, the Districtremits contributions directly to the New Jersey Unemployment Trust Fund. The following is a summary ofDistrict contributions, employee contributions, reimbursements to the State for benefits paid and the endingbalance of the District’s expendable trust fund for the current and previous two years:
Fiscal Year
Interest Earnings/District
ContributionsEmployee
ContributionsAmount
ReimbursedEndingBalance
2017-2018 -0- -0-
2016-2017 6 -0-
2015-2016 22 4 21,611
-63-
Borough of Englewood Cliffs School DistrictNotes to the Basic Financial Statementsfor the fiscal year ended June 30, 2018
NOTE 12. CAPITAL RESERVE ACCOUNT
A capital reserve account was established by the Borough of Englewood Cliffs Board of Education byinclusion of $1.00 on October 2, 2000 for the accumulation of funds for use as capital outlay expendituresin subsequent fiscal years. The capital reserve account is maintained in the general fund and its activity isincluded in the general fund annual budget.
Funds placed in the capital reserve account are restricted to capital projects in the district’s approved LongRange Facilities Plan (LRFP). A district may increase the balance in the capital reserve by appropriatingfunds in the annual general fund budget certified for taxes or by transfer by board resolution at year end ofany unanticipated revenue or unexpended line-item appropriation amounts, or both. A district may alsoappropriate additional amounts when the express approval of the voters has been obtained either by a separateproposal at budget time or by a special question at one of the four special elections authorized pursuant toN.J.S.A. 19:60-2. Pursuant to N.J.A.C. 6A:23A-14.1(g), the balance in the account cannot at any time exceedthe local support costs of uncompleted capital projects in its approved LRFP.
The activity of the capital reserve for the July 1, 2017 to June 30, 2018 fiscal year is as follows:
Beginning balance, July 1, 2017 $2,360,908
Increased by: Interest Earnings 7,554 Board Transfer 800,000Withdrawal from Capital Reserve (1,739,000)
Ending balance, June 30, 2018 $1,429,462
NOTE 13. MAINTENANCE RESERVE ACCOUNT
The maintenance reserve account is used to accumulate funds for the required maintenance of a facility inaccordance with the EFCRA (N.J.A.A. 18A:7G-9). EFCFA requires that upon district completion of a schoolfacilities project, the district must submit a plan for the maintenance of that facility. All such plans mustinclude a provision for a maintenance reserve fund.
Section 6 of N.J.S.A. 18A:7F-41(a) and 41(b) provides that a district may supplement a maintenance reserveaccount by board resolution at year end for any unanticipated revenue and/or unexpended line itemappropriations.
-64-
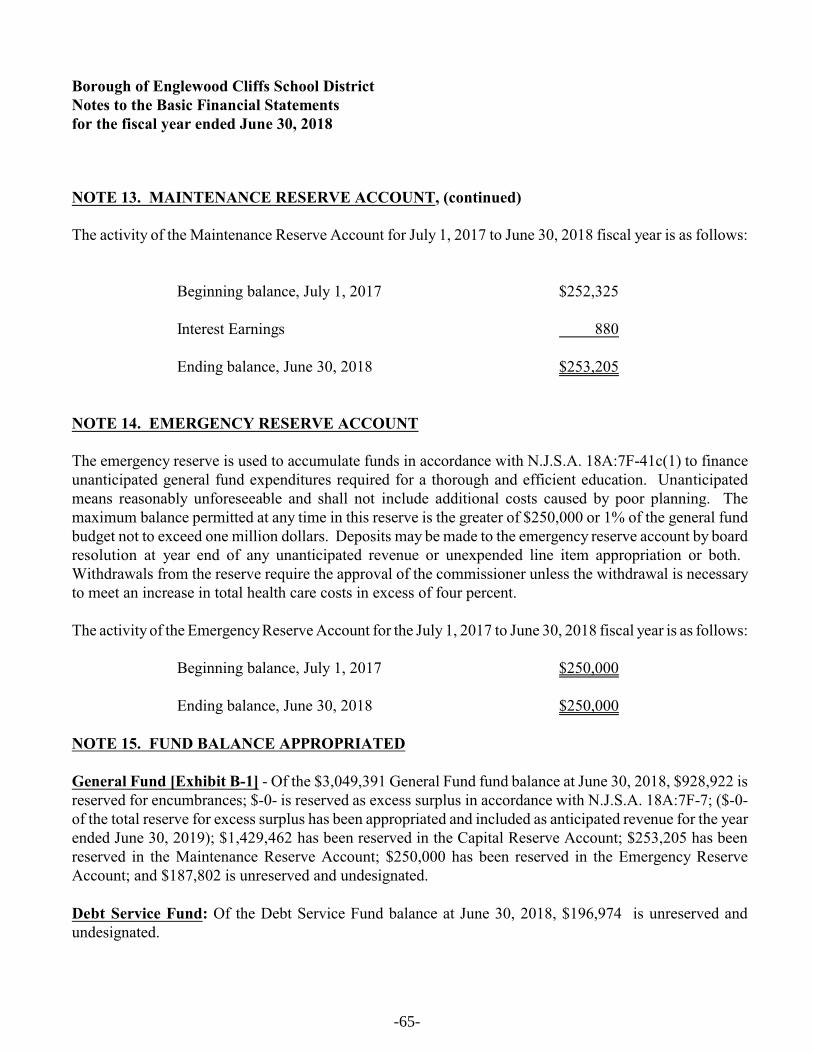
Borough of Englewood Cliffs School DistrictNotes to the Basic Financial Statementsfor the fiscal year ended June 30, 2018
NOTE 13. MAINTENANCE RESERVE ACCOUNT, (continued)
The activity of the Maintenance Reserve Account for July 1, 2017 to June 30, 2018 fiscal year is as follows:
Beginning balance, July 1, 2017 $252,325
Interest Earnings 880
Ending balance, June 30, 2018 $253,205
NOTE 14. EMERGENCY RESERVE ACCOUNT
The emergency reserve is used to accumulate funds in accordance with N.J.S.A. 18A:7F-41c(1) to financeunanticipated general fund expenditures required for a thorough and efficient education. Unanticipatedmeans reasonably unforeseeable and shall not include additional costs caused by poor planning. Themaximum balance permitted at any time in this reserve is the greater of $250,000 or 1% of the general fundbudget not to exceed one million dollars. Deposits may be made to the emergency reserve account by boardresolution at year end of any unanticipated revenue or unexpended line item appropriation or both. Withdrawals from the reserve require the approval of the commissioner unless the withdrawal is necessaryto meet an increase in total health care costs in excess of four percent.
The activity of the Emergency Reserve Account for the July 1, 2017 to June 30, 2018 fiscal year is as follows:
Beginning balance, July 1, 2017 $250,000
Ending balance, June 30, 2018 $250,000
NOTE 15. FUND BALANCE APPROPRIATED
General Fund [Exhibit B-1] - Of the $3,049,391 General Fund fund balance at June 30, 2018, $928,922 isreserved for encumbrances; $-0- is reserved as excess surplus in accordance with N.J.S.A. 18A:7F-7; ($-0-of the total reserve for excess surplus has been appropriated and included as anticipated revenue for the yearended June 30, 2019); $1,429,462 has been reserved in the Capital Reserve Account; $253,205 has beenreserved in the Maintenance Reserve Account; $250,000 has been reserved in the Emergency ReserveAccount; and $187,802 is unreserved and undesignated.
Debt Service Fund: Of the Debt Service Fund balance at June 30, 2018, $196,974 is unreserved andundesignated.
-65-
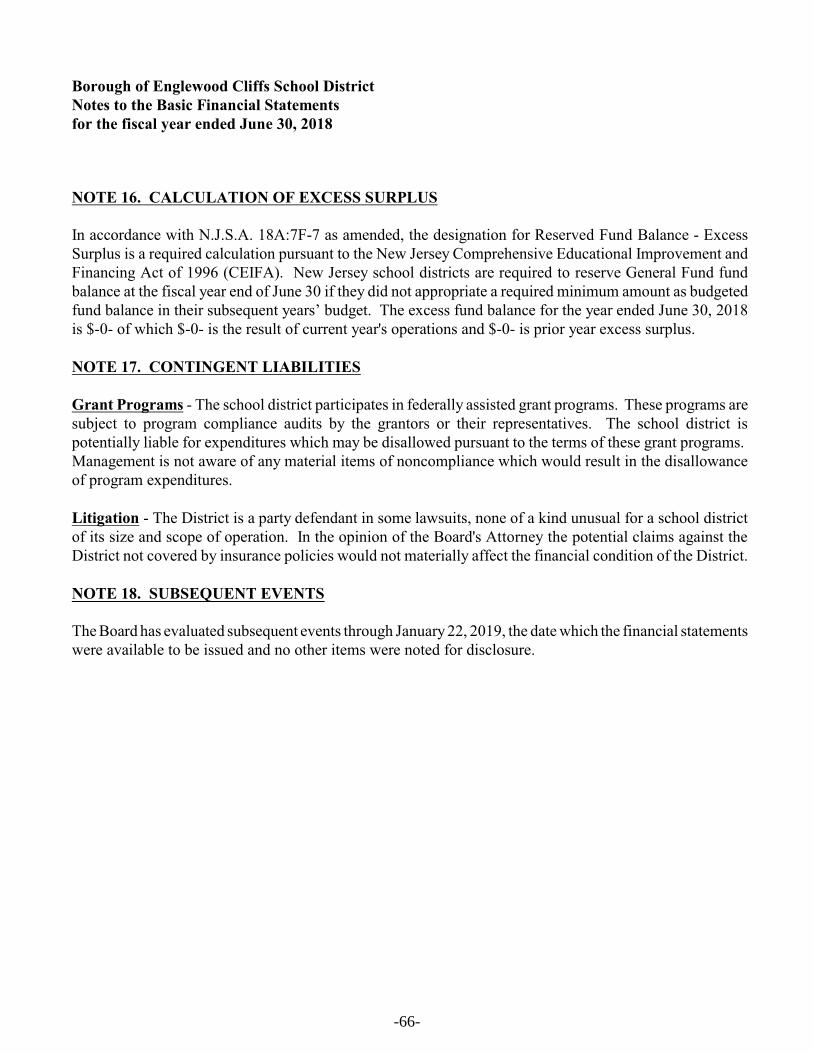
Borough of Englewood Cliffs School DistrictNotes to the Basic Financial Statementsfor the fiscal year ended June 30, 2018
NOTE 16. CALCULATION OF EXCESS SURPLUS
In accordance with N.J.S.A. 18A:7F-7 as amended, the designation for Reserved Fund Balance - ExcessSurplus is a required calculation pursuant to the New Jersey Comprehensive Educational Improvement andFinancing Act of 1996 (CEIFA). New Jersey school districts are required to reserve General Fund fundbalance at the fiscal year end of June 30 if they did not appropriate a required minimum amount as budgetedfund balance in their subsequent years’ budget. The excess fund balance for the year ended June 30, 2018is $-0- of which $-0- is the result of current year's operations and $-0- is prior year excess surplus.
NOTE 17. CONTINGENT LIABILITIES
Grant Programs - The school district participates in federally assisted grant programs. These programs aresubject to program compliance audits by the grantors or their representatives. The school district ispotentially liable for expenditures which may be disallowed pursuant to the terms of these grant programs. Management is not aware of any material items of noncompliance which would result in the disallowanceof program expenditures.
Litigation - The District is a party defendant in some lawsuits, none of a kind unusual for a school districtof its size and scope of operation. In the opinion of the Board's Attorney the potential claims against theDistrict not covered by insurance policies would not materially affect the financial condition of the District.
NOTE 18. SUBSEQUENT EVENTS
The Board has evaluated subsequent events through January 22, 2019, the date which the financial statementswere available to be issued and no other items were noted for disclosure.
-66-

REQUIRED SUPPLEMENTARY
INFORMATION - PART II
BUDGETARY COMPARISON SCHEDULES
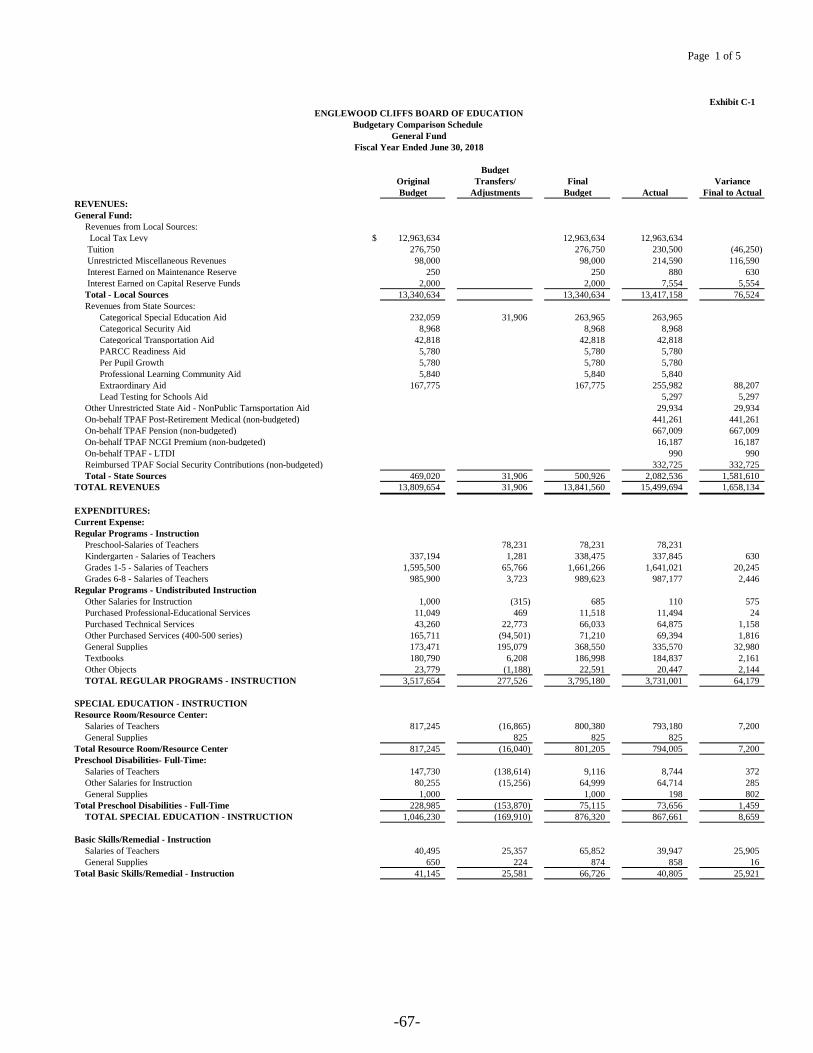
Page 1 of 5
Exhibit C-1
Budget
Original Transfers/ Final Variance
Budget Adjustments Budget Actual Final to Actual
REVENUES:
General Fund:
Revenues from Local Sources:
Local Tax Levy $ 12,963,634 12,963,634 12,963,634
Tuition 276,750 276,750 230,500 (46,250)
Unrestricted Miscellaneous Revenues 98,000 98,000 214,590 116,590
Interest Earned on Maintenance Reserve 250 250 880 630
Interest Earned on Capital Reserve Funds 2,000 2,000 7,554 5,554
Total - Local Sources 13,340,634 13,340,634 13,417,158 76,524
Revenues from State Sources:
Categorical Special Education Aid 232,059 31,906 263,965 263,965
Categorical Security Aid 8,968 8,968 8,968
Categorical Transportation Aid 42,818 42,818 42,818
PARCC Readiness Aid 5,780 5,780 5,780
Per Pupil Growth 5,780 5,780 5,780
Professional Learning Community Aid 5,840 5,840 5,840
Extraordinary Aid 167,775 167,775 255,982 88,207
Lead Testing for Schools Aid 5,297 5,297
Other Unrestricted State Aid - NonPublic Tarnsportation Aid 29,934 29,934
On-behalf TPAF Post-Retirement Medical (non-budgeted) 441,261 441,261
On-behalf TPAF Pension (non-budgeted) 667,009 667,009
On-behalf TPAF NCGI Premium (non-budgeted) 16,187 16,187
On-behalf TPAF - LTDI 990 990
Reimbursed TPAF Social Security Contributions (non-budgeted) 332,725 332,725
Total - State Sources 469,020 31,906 500,926 2,082,536 1,581,610
TOTAL REVENUES 13,809,654 31,906 13,841,560 15,499,694 1,658,134
EXPENDITURES:
Current Expense:
Regular Programs - Instruction
Preschool-Salaries of Teachers 78,231 78,231 78,231
Kindergarten - Salaries of Teachers 337,194 1,281 338,475 337,845 630
Grades 1-5 - Salaries of Teachers 1,595,500 65,766 1,661,266 1,641,021 20,245
Grades 6-8 - Salaries of Teachers 985,900 3,723 989,623 987,177 2,446
Regular Programs - Undistributed Instruction
Other Salaries for Instruction 1,000 (315) 685 110 575
Purchased Professional-Educational Services 11,049 469 11,518 11,494 24
Purchased Technical Services 43,260 22,773 66,033 64,875 1,158
Other Purchased Services (400-500 series) 165,711 (94,501) 71,210 69,394 1,816
General Supplies 173,471 195,079 368,550 335,570 32,980
Textbooks 180,790 6,208 186,998 184,837 2,161
Other Objects 23,779 (1,188) 22,591 20,447 2,144
TOTAL REGULAR PROGRAMS - INSTRUCTION 3,517,654 277,526 3,795,180 3,731,001 64,179
SPECIAL EDUCATION - INSTRUCTION
Resource Room/Resource Center:
Salaries of Teachers 817,245 (16,865) 800,380 793,180 7,200
General Supplies 825 825 825
Total Resource Room/Resource Center 817,245 (16,040) 801,205 794,005 7,200
Preschool Disabilities- Full-Time:
Salaries of Teachers 147,730 (138,614) 9,116 8,744 372
Other Salaries for Instruction 80,255 (15,256) 64,999 64,714 285
General Supplies 1,000 1,000 198 802
Total Preschool Disabilities - Full-Time 228,985 (153,870) 75,115 73,656 1,459
TOTAL SPECIAL EDUCATION - INSTRUCTION 1,046,230 (169,910) 876,320 867,661 8,659
Basic Skills/Remedial - Instruction
Salaries of Teachers 40,495 25,357 65,852 39,947 25,905
General Supplies 650 224 874 858 16
Total Basic Skills/Remedial - Instruction 41,145 25,581 66,726 40,805 25,921
ENGLEWOOD CLIFFS BOARD OF EDUCATION
Budgetary Comparison Schedule
General Fund
Fiscal Year Ended June 30, 2018
-67-
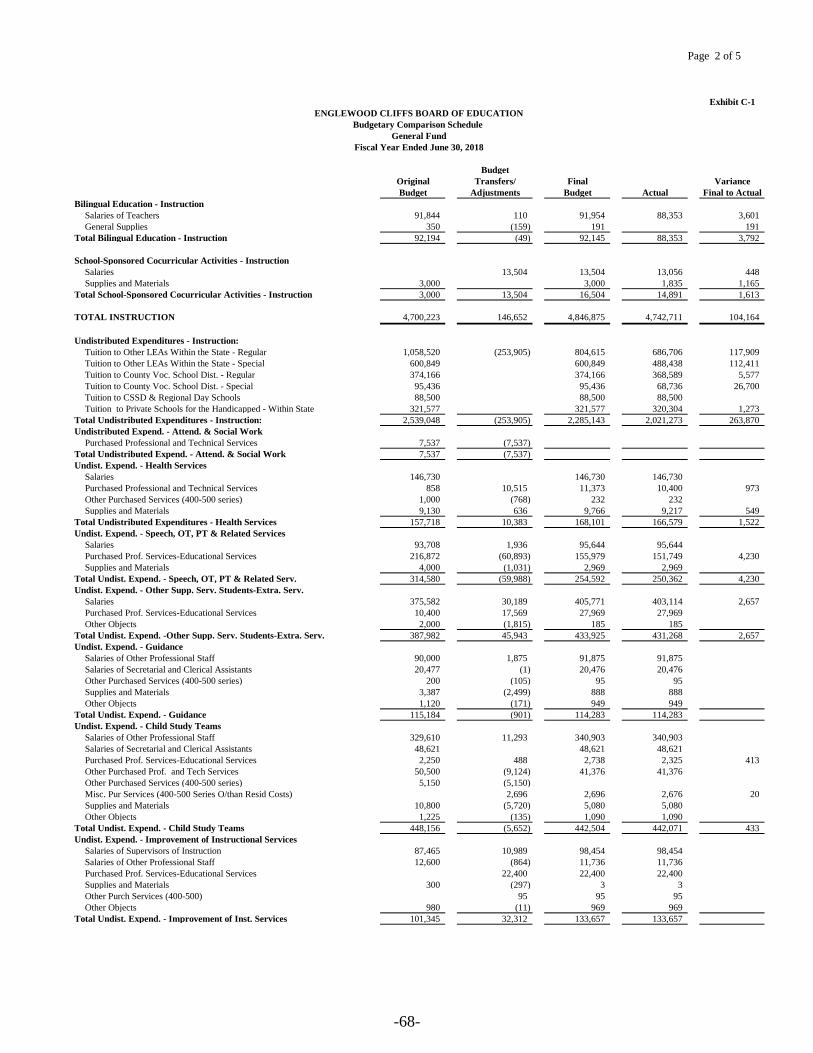
Page 2 of 5
Exhibit C-1
Budget
Original Transfers/ Final Variance
Budget Adjustments Budget Actual Final to Actual
ENGLEWOOD CLIFFS BOARD OF EDUCATION
Budgetary Comparison Schedule
General Fund
Fiscal Year Ended June 30, 2018
Bilingual Education - Instruction
Salaries of Teachers 91,844 110 91,954 88,353 3,601
General Supplies 350 (159) 191 191
Total Bilingual Education - Instruction 92,194 (49) 92,145 88,353 3,792
School-Sponsored Cocurricular Activities - Instruction
Salaries 13,504 13,504 13,056 448
Supplies and Materials 3,000 3,000 1,835 1,165
Total School-Sponsored Cocurricular Activities - Instruction 3,000 13,504 16,504 14,891 1,613
TOTAL INSTRUCTION 4,700,223 146,652 4,846,875 4,742,711 104,164
Tuition to Other LEAs Within the State - Regular 1,058,520 (253,905) 804,615 686,706 117,909
Tuition to Other LEAs Within the State - Special 600,849 600,849 488,438 112,411
Tuition to County Voc. School Dist. - Regular 374,166 374,166 368,589 5,577
Tuition to County Voc. School Dist. - Special 95,436 95,436 68,736 26,700
Tuition to CSSD & Regional Day Schools 88,500 88,500 88,500
Tuition to Private Schools for the Handicapped - Within State 321,577 321,577 320,304 1,273
Total Undistributed Expenditures - Instruction: 2,539,048 (253,905) 2,285,143 2,021,273 263,870
Undistributed Expend. - Attend. & Social Work
Purchased Professional and Technical Services 7,537 (7,537)
Total Undistributed Expend. - Attend. & Social Work 7,537 (7,537)
Undist. Expend. - Health Services
Salaries 146,730 146,730 146,730
Purchased Professional and Technical Services 858 10,515 11,373 10,400 973
Other Purchased Services (400-500 series) 1,000 (768) 232 232
Supplies and Materials 9,130 636 9,766 9,217 549
Total Undistributed Expenditures - Health Services 157,718 10,383 168,101 166,579 1,522
Undist. Expend. - Speech, OT, PT & Related Services
Salaries 93,708 1,936 95,644 95,644
Purchased Prof. Services-Educational Services 216,872 (60,893) 155,979 151,749 4,230
Supplies and Materials 4,000 (1,031) 2,969 2,969
Total Undist. Expend. - Speech, OT, PT & Related Serv. 314,580 (59,988) 254,592 250,362 4,230
Undist. Expend. - Other Supp. Serv. Students-Extra. Serv.
Salaries 375,582 30,189 405,771 403,114 2,657
Purchased Prof. Services-Educational Services 10,400 17,569 27,969 27,969
Other Objects 2,000 (1,815) 185 185
Total Undist. Expend. -Other Supp. Serv. Students-Extra. Serv. 387,982 45,943 433,925 431,268 2,657
Undist. Expend. - Guidance
Salaries of Other Professional Staff 90,000 1,875 91,875 91,875
Salaries of Secretarial and Clerical Assistants 20,477 (1) 20,476 20,476
Other Purchased Services (400-500 series) 200 (105) 95 95
Supplies and Materials 3,387 (2,499) 888 888
Other Objects 1,120 (171) 949 949
Total Undist. Expend. - Guidance 115,184 (901) 114,283 114,283
Undist. Expend. - Child Study Teams
Salaries of Other Professional Staff 329,610 11,293 340,903 340,903
Salaries of Secretarial and Clerical Assistants 48,621 48,621 48,621
Purchased Prof. Services-Educational Services 2,250 488 2,738 2,325 413
Other Purchased Prof. and Tech Services 50,500 (9,124) 41,376 41,376
Other Purchased Services (400-500 series) 5,150 (5,150)
Misc. Pur Services (400-500 Series O/than Resid Costs) 2,696 2,696 2,676 20
Supplies and Materials 10,800 (5,720) 5,080 5,080
Other Objects 1,225 (135) 1,090 1,090
Total Undist. Expend. - Child Study Teams 448,156 (5,652) 442,504 442,071 433
Undist. Expend. - Improvement of Instructional Services
Salaries of Supervisors of Instruction 87,465 10,989 98,454 98,454
Salaries of Other Professional Staff 12,600 (864) 11,736 11,736
Purchased Prof. Services-Educational Services 22,400 22,400 22,400
Supplies and Materials 300 (297) 3 3
Other Purch Services (400-500) 95 95 95
Other Objects 980 (11) 969 969
Total Undist. Expend. - Improvement of Inst. Services 101,345 32,312 133,657 133,657
Undistributed Expenditures - Instruction:
-68-
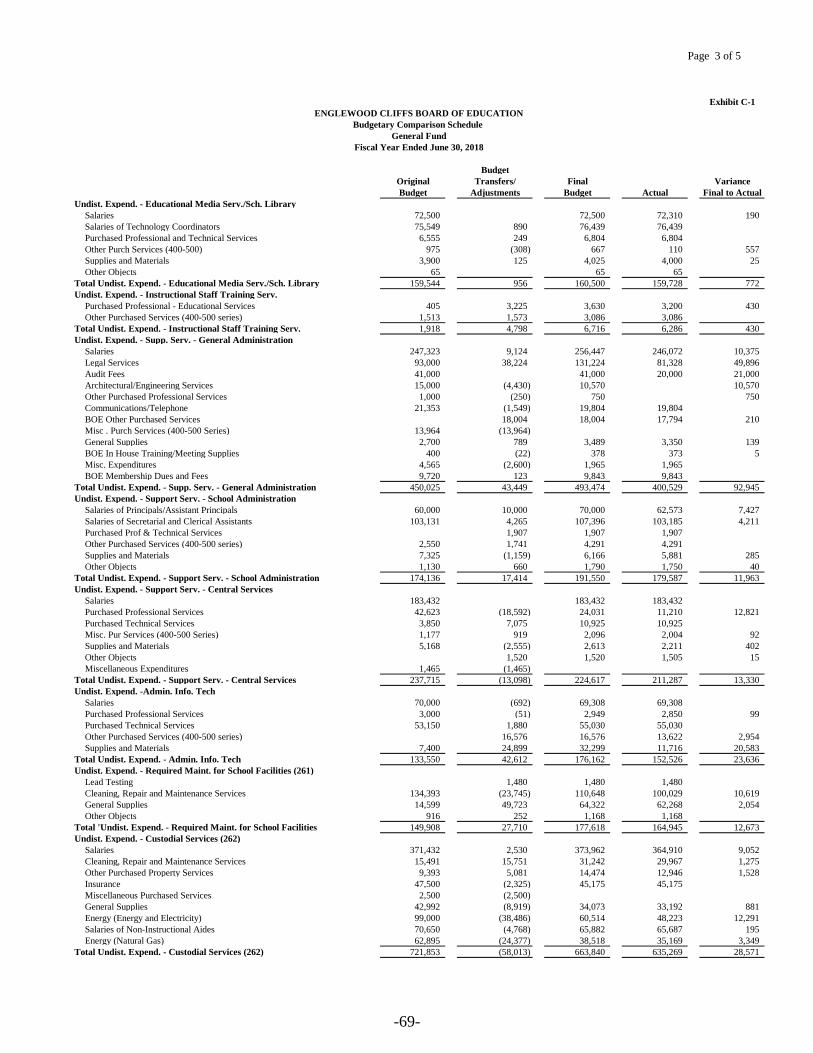
Page 3 of 5
Exhibit C-1
Budget
Original Transfers/ Final Variance
Budget Adjustments Budget Actual Final to Actual
ENGLEWOOD CLIFFS BOARD OF EDUCATION
Budgetary Comparison Schedule
General Fund
Fiscal Year Ended June 30, 2018
Undist. Expend. - Educational Media Serv./Sch. Library
Salaries 72,500 72,500 72,310 190
Salaries of Technology Coordinators 75,549 890 76,439 76,439
Purchased Professional and Technical Services 6,555 249 6,804 6,804
Other Purch Services (400-500) 975 (308) 667 110 557
Supplies and Materials 3,900 125 4,025 4,000 25
Other Objects 65 65 65
Total Undist. Expend. - Educational Media Serv./Sch. Library 159,544 956 160,500 159,728 772
Undist. Expend. - Instructional Staff Training Serv.
Purchased Professional - Educational Services 405 3,225 3,630 3,200 430
Other Purchased Services (400-500 series) 1,513 1,573 3,086 3,086
Total Undist. Expend. - Instructional Staff Training Serv. 1,918 4,798 6,716 6,286 430
Undist. Expend. - Supp. Serv. - General Administration
Salaries 247,323 9,124 256,447 246,072 10,375
Legal Services 93,000 38,224 131,224 81,328 49,896
Audit Fees 41,000 41,000 20,000 21,000
Architectural/Engineering Services 15,000 (4,430) 10,570 10,570
Other Purchased Professional Services 1,000 (250) 750 750
Communications/Telephone 21,353 (1,549) 19,804 19,804
BOE Other Purchased Services 18,004 18,004 17,794 210
Misc . Purch Services (400-500 Series) 13,964 (13,964)
General Supplies 2,700 789 3,489 3,350 139
BOE In House Training/Meeting Supplies 400 (22) 378 373 5
Misc. Expenditures 4,565 (2,600) 1,965 1,965
BOE Membership Dues and Fees 9,720 123 9,843 9,843
Total Undist. Expend. - Supp. Serv. - General Administration 450,025 43,449 493,474 400,529 92,945
Undist. Expend. - Support Serv. - School Administration
Salaries of Principals/Assistant Principals 60,000 10,000 70,000 62,573 7,427
Salaries of Secretarial and Clerical Assistants 103,131 4,265 107,396 103,185 4,211
Purchased Prof & Technical Services 1,907 1,907 1,907
Other Purchased Services (400-500 series) 2,550 1,741 4,291 4,291
Supplies and Materials 7,325 (1,159) 6,166 5,881 285
Other Objects 1,130 660 1,790 1,750 40
Total Undist. Expend. - Support Serv. - School Administration 174,136 17,414 191,550 179,587 11,963
Undist. Expend. - Support Serv. - Central Services
Salaries 183,432 183,432 183,432
Purchased Professional Services 42,623 (18,592) 24,031 11,210 12,821
Purchased Technical Services 3,850 7,075 10,925 10,925
Misc. Pur Services (400-500 Series) 1,177 919 2,096 2,004 92
Supplies and Materials 5,168 (2,555) 2,613 2,211 402
Other Objects 1,520 1,520 1,505 15
Miscellaneous Expenditures 1,465 (1,465)
Total Undist. Expend. - Support Serv. - Central Services 237,715 (13,098) 224,617 211,287 13,330
Undist. Expend. -Admin. Info. Tech
Salaries 70,000 (692) 69,308 69,308
Purchased Professional Services 3,000 (51) 2,949 2,850 99
Purchased Technical Services 53,150 1,880 55,030 55,030
Other Purchased Services (400-500 series) 16,576 16,576 13,622 2,954
Supplies and Materials 7,400 24,899 32,299 11,716 20,583
Total Undist. Expend. - Admin. Info. Tech 133,550 42,612 176,162 152,526 23,636
Undist. Expend. - Required Maint. for School Facilities (261)
Lead Testing 1,480 1,480 1,480
Cleaning, Repair and Maintenance Services 134,393 (23,745) 110,648 100,029 10,619
General Supplies 14,599 49,723 64,322 62,268 2,054
Other Objects 916 252 1,168 1,168
Total 'Undist. Expend. - Required Maint. for School Facilities 149,908 27,710 177,618 164,945 12,673
Undist. Expend. - Custodial Services (262)
Salaries 371,432 2,530 373,962 364,910 9,052
Cleaning, Repair and Maintenance Services 15,491 15,751 31,242 29,967 1,275
Other Purchased Property Services 9,393 5,081 14,474 12,946 1,528
Insurance 47,500 (2,325) 45,175 45,175
Miscellaneous Purchased Services 2,500 (2,500)
General Supplies 42,992 (8,919) 34,073 33,192 881
Energy (Energy and Electricity) 99,000 (38,486) 60,514 48,223 12,291
Salaries of Non-Instructional Aides 70,650 (4,768) 65,882 65,687 195
Energy (Natural Gas) 62,895 (24,377) 38,518 35,169 3,349
Total Undist. Expend. - Custodial Services (262) 721,853 (58,013) 663,840 635,269 28,571
-69-
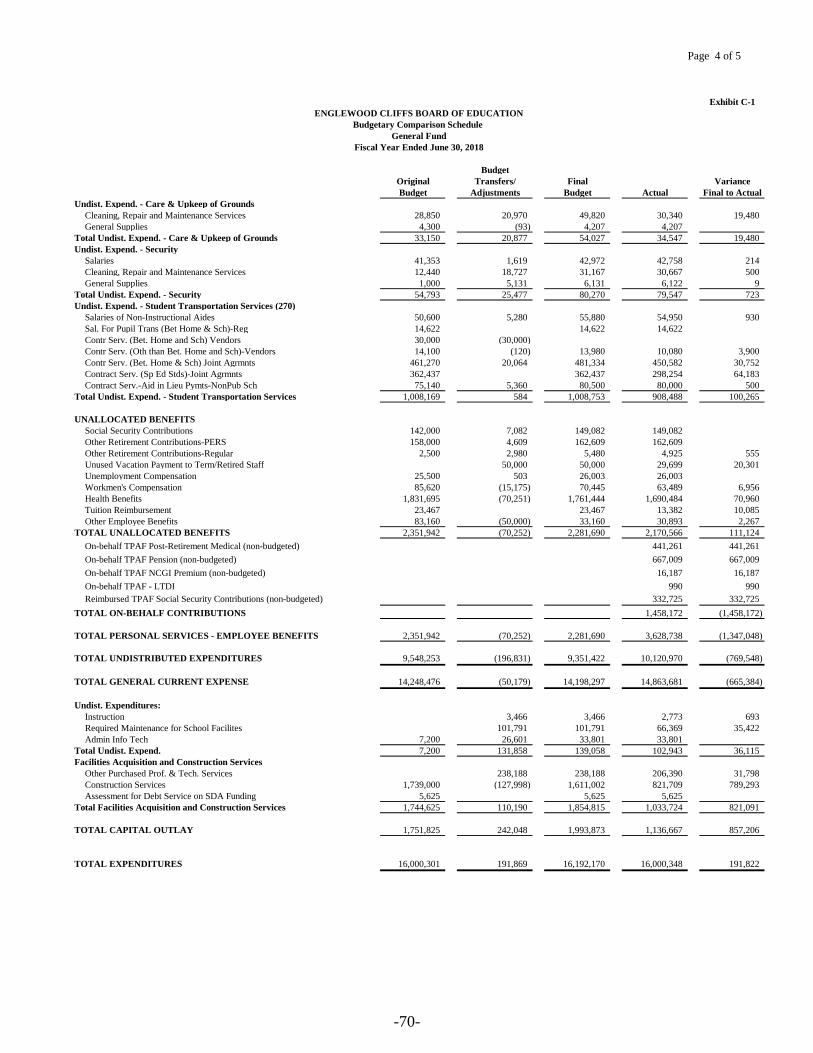
Page 4 of 5
Exhibit C-1
Budget
Original Transfers/ Final Variance
Budget Adjustments Budget Actual Final to Actual
ENGLEWOOD CLIFFS BOARD OF EDUCATION
Budgetary Comparison Schedule
General Fund
Fiscal Year Ended June 30, 2018
Undist. Expend. - Care & Upkeep of Grounds
Cleaning, Repair and Maintenance Services 28,850 20,970 49,820 30,340 19,480
General Supplies 4,300 (93) 4,207 4,207
Total Undist. Expend. - Care & Upkeep of Grounds 33,150 20,877 54,027 34,547 19,480
Undist. Expend. - Security
Salaries 41,353 1,619 42,972 42,758 214
Cleaning, Repair and Maintenance Services 12,440 18,727 31,167 30,667 500
General Supplies 1,000 5,131 6,131 6,122 9
Total Undist. Expend. - Security 54,793 25,477 80,270 79,547 723
Undist. Expend. - Student Transportation Services (270)
Salaries of Non-Instructional Aides 50,600 5,280 55,880 54,950 930
Sal. For Pupil Trans (Bet Home & Sch)-Reg 14,622 14,622 14,622
Contr Serv. (Bet. Home and Sch) Vendors 30,000 (30,000)
Contr Serv. (Oth than Bet. Home and Sch)-Vendors 14,100 (120) 13,980 10,080 3,900
Contr Serv. (Bet. Home & Sch) Joint Agrmnts 461,270 20,064 481,334 450,582 30,752
Contract Serv. (Sp Ed Stds)-Joint Agrmnts 362,437 362,437 298,254 64,183
Contract Serv.-Aid in Lieu Pymts-NonPub Sch 75,140 5,360 80,500 80,000 500
Total Undist. Expend. - Student Transportation Services 1,008,169 584 1,008,753 908,488 100,265
UNALLOCATED BENEFITS
Social Security Contributions 142,000 7,082 149,082 149,082
Other Retirement Contributions-PERS 158,000 4,609 162,609 162,609
Other Retirement Contributions-Regular 2,500 2,980 5,480 4,925 555
Unused Vacation Payment to Term/Retired Staff 50,000 50,000 29,699 20,301
Unemployment Compensation 25,500 503 26,003 26,003
Workmen's Compensation 85,620 (15,175) 70,445 63,489 6,956
Health Benefits 1,831,695 (70,251) 1,761,444 1,690,484 70,960
Tuition Reimbursement 23,467 23,467 13,382 10,085
Other Employee Benefits 83,160 (50,000) 33,160 30,893 2,267
TOTAL UNALLOCATED BENEFITS 2,351,942 (70,252) 2,281,690 2,170,566 111,124
On-behalf TPAF Post-Retirement Medical (non-budgeted) 441,261 441,261
On-behalf TPAF Pension (non-budgeted) 667,009 667,009
On-behalf TPAF NCGI Premium (non-budgeted) 16,187 16,187
On-behalf TPAF - LTDI 990 990
Reimbursed TPAF Social Security Contributions (non-budgeted) 332,725 332,725
TOTAL ON-BEHALF CONTRIBUTIONS 1,458,172 (1,458,172)
TOTAL PERSONAL SERVICES - EMPLOYEE BENEFITS 2,351,942 (70,252) 2,281,690 3,628,738 (1,347,048)
TOTAL UNDISTRIBUTED EXPENDITURES 9,548,253 (196,831) 9,351,422 10,120,970 (769,548)
TOTAL GENERAL CURRENT EXPENSE 14,248,476 (50,179) 14,198,297 14,863,681 (665,384)
Undist. Expenditures:
Instruction 3,466 3,466 2,773 693
Required Maintenance for School Facilites 101,791 101,791 66,369 35,422
Admin Info Tech 7,200 26,601 33,801 33,801
Total Undist. Expend. 7,200 131,858 139,058 102,943 36,115
Facilities Acquisition and Construction Services
Other Purchased Prof. & Tech. Services 238,188 238,188 206,390 31,798
Construction Services 1,739,000 (127,998) 1,611,002 821,709 789,293
Assessment for Debt Service on SDA Funding 5,625 5,625 5,625
Total Facilities Acquisition and Construction Services 1,744,625 110,190 1,854,815 1,033,724 821,091
TOTAL CAPITAL OUTLAY 1,751,825 242,048 1,993,873 1,136,667 857,206
TOTAL EXPENDITURES 16,000,301 191,869 16,192,170 16,000,348 191,822
-70-
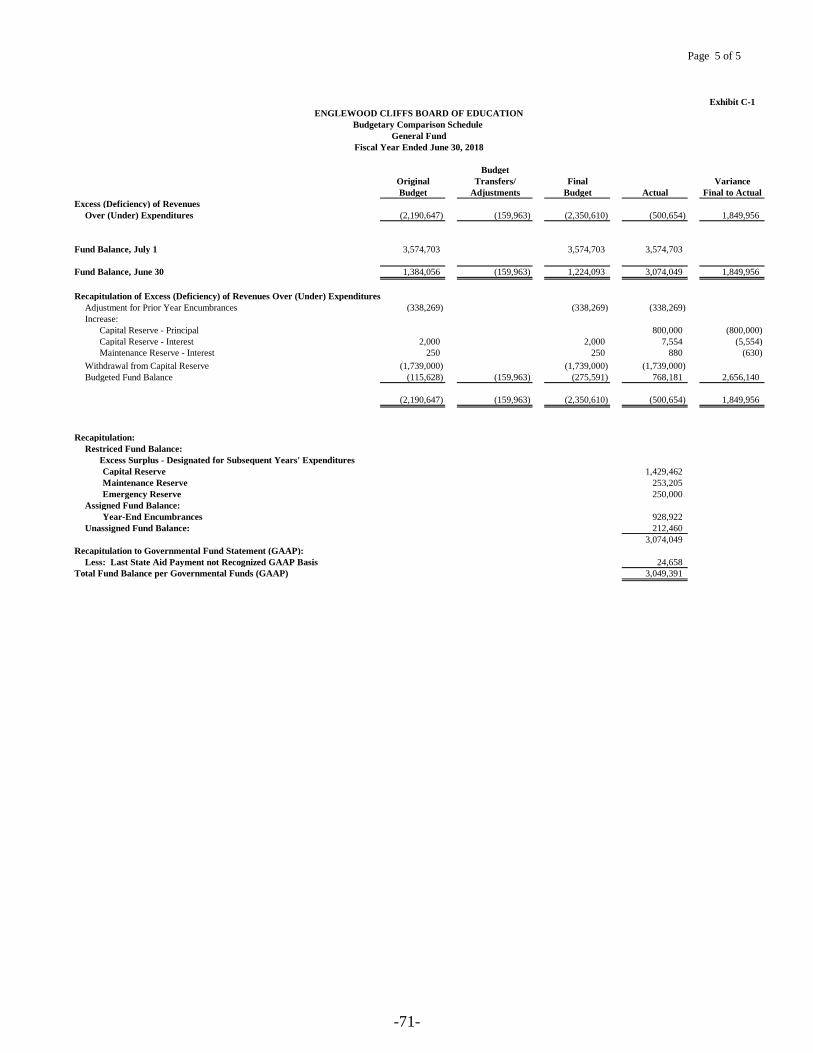
Page 5 of 5
Exhibit C-1
Budget
Original Transfers/ Final Variance
Budget Adjustments Budget Actual Final to Actual
ENGLEWOOD CLIFFS BOARD OF EDUCATION
Budgetary Comparison Schedule
General Fund
Fiscal Year Ended June 30, 2018
Excess (Deficiency) of Revenues
Over (Under) Expenditures (2,190,647) (159,963) (2,350,610) (500,654) 1,849,956
Fund Balance, July 1 3,574,703 3,574,703 3,574,703
Fund Balance, June 30 1,384,056 (159,963) 1,224,093 3,074,049 1,849,956
Recapitulation of Excess (Deficiency) of Revenues Over (Under) Expenditures
Adjustment for Prior Year Encumbrances (338,269) (338,269) (338,269)
Increase:
Capital Reserve - Principal 800,000 (800,000)
Capital Reserve - Interest 2,000 2,000 7,554 (5,554)
Maintenance Reserve - Interest 250 250 880 (630)
Withdrawal from Capital Reserve (1,739,000) (1,739,000) (1,739,000)
Budgeted Fund Balance (115,628) (159,963) (275,591) 768,181 2,656,140
(2,190,647) (159,963) (2,350,610) (500,654) 1,849,956
Recapitulation:
Restriced Fund Balance:
Excess Surplus - Designated for Subsequent Years' Expenditures
Capital Reserve 1,429,462
Maintenance Reserve 253,205
Emergency Reserve 250,000
Assigned Fund Balance:
Year-End Encumbrances 928,922
Unassigned Fund Balance: 212,460
3,074,049
Recapitulation to Governmental Fund Statement (GAAP):
Less: Last State Aid Payment not Recognized GAAP Basis 24,658
Total Fund Balance per Governmental Funds (GAAP) 3,049,391
-71-
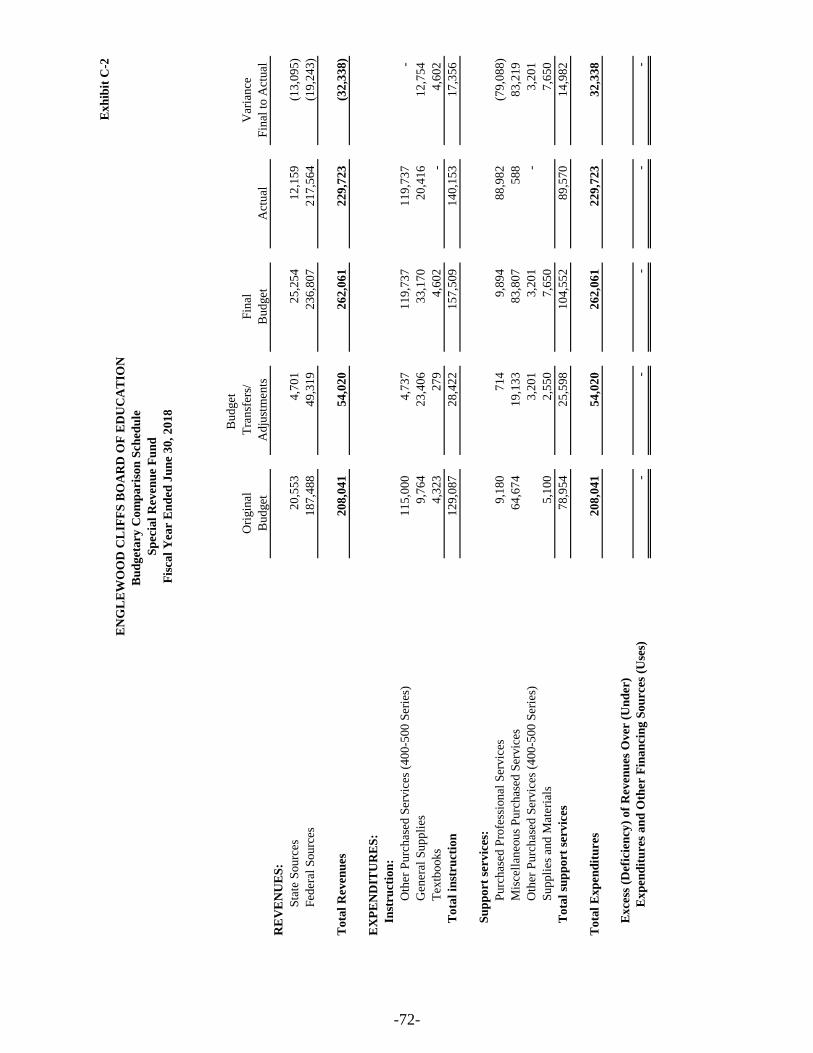
Exh
ibit
C-2
Budget
Ori
gin
alT
ransf
ers/
Fin
alV
aria
nce
Budget
Adju
stm
ents
Budget
Act
ual
Fin
al t
o A
ctual
RE
VE
NU
ES
:
Sta
te S
ourc
es20,5
53
4,7
01
25,2
54
12,1
59
(1
3,0
95)
Fed
eral
Sourc
es187,4
88
49,3
19
236,8
07
217,5
64
(19,2
43)
To
tal
Rev
en
ues
208,0
41
54,0
20
262,0
61
229,7
23
(32,3
38)
EX
PE
ND
ITU
RE
S:
Inst
ru
cti
on
:
O
ther
Purc
has
ed S
ervic
es (
400-5
00 S
erie
s)115,0
00
4,7
37
119,7
37
119,7
37
-
G
ener
al S
uppli
es9,7
64
23,4
06
33,1
70
20,4
16
12,7
54
T
extb
ooks
4,3
23
279
4,6
02
-
4,6
02
To
tal
inst
ru
cti
on
129,0
87
28,4
22
157,5
09
140,1
53
17,3
56
Su
pp
ort
servic
es:
P
urc
has
ed P
rofe
ssio
nal
Ser
vic
es9,1
80
714
9,8
94
88,9
82
(7
9,0
88)
M
isce
llan
eous
Purc
has
ed S
ervic
es64,6
74
19,1
33
83,8
07
588
83,2
19
O
ther
Purc
has
ed S
ervic
es (
400-5
00 S
erie
s)3,2
01
3,2
01
-
3,2
01
S
up
pli
es a
nd M
ater
ials
5,1
00
2,5
50
7,6
50
7,6
50
To
tal
sup
port
servic
es
78,9
54
25,5
98
104,5
52
89,5
70
14,9
82
To
tal
Ex
pen
dit
ures
208,0
41
54,0
20
262,0
61
229,7
23
32,3
38
Ex
cess
(D
efi
cie
ncy
) of
Reven
ues
Over (
Un
der)
Ex
pen
dit
ures
an
d O
ther F
inan
cin
g S
ou
rces
(Use
s)-
-
-
-
-
EN
GL
EW
OO
D C
LIF
FS
BO
AR
D O
F E
DU
CA
TIO
N
Bu
dgeta
ry
Com
paris
on
Sch
ed
ule
Sp
ecia
l R
even
ue F
un
d
Fis
cal
Year E
nd
ed
Ju
ne 3
0,
2018
-72-
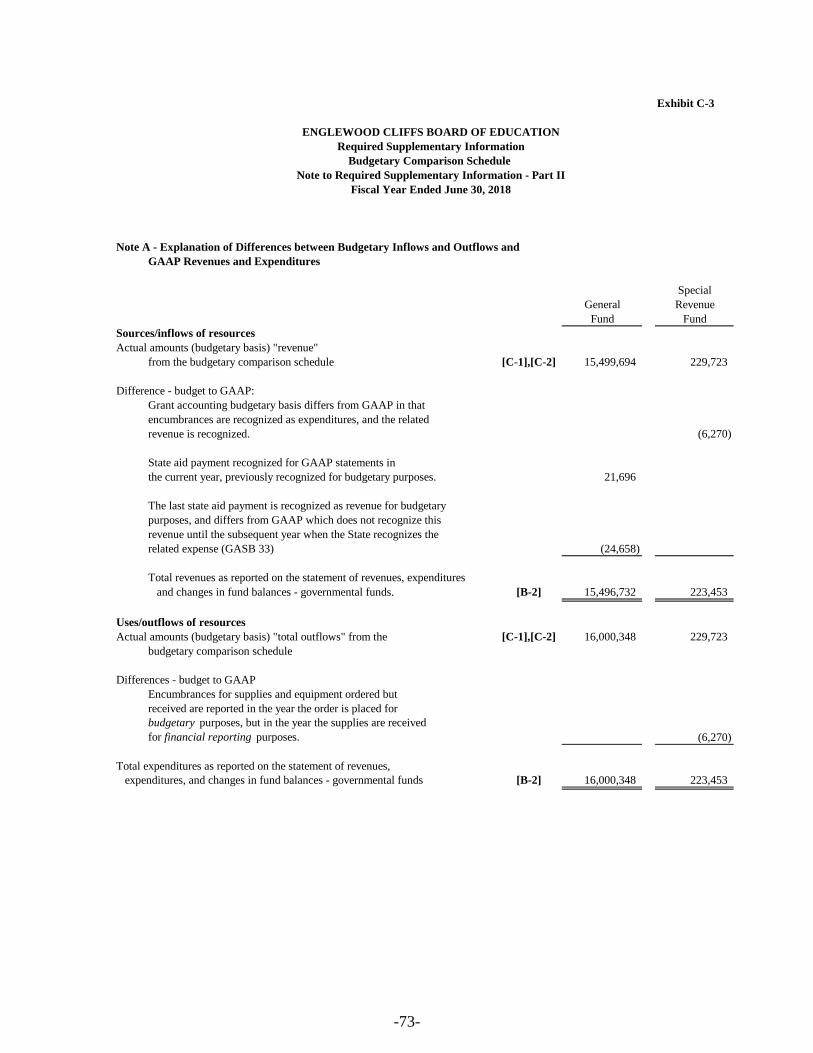
Exhibit C-3
Note A - Explanation of Differences between Budgetary Inflows and Outflows and
GAAP Revenues and Expenditures
Special
General Revenue
Fund Fund
Sources/inflows of resources
Actual amounts (budgetary basis) "revenue"
from the budgetary comparison schedule [C-1],[C-2] 15,499,694 229,723
Difference - budget to GAAP:
Grant accounting budgetary basis differs from GAAP in that
encumbrances are recognized as expenditures, and the related
revenue is recognized. (6,270)
State aid payment recognized for GAAP statements in
the current year, previously recognized for budgetary purposes. 21,696
The last state aid payment is recognized as revenue for budgetary
purposes, and differs from GAAP which does not recognize this
revenue until the subsequent year when the State recognizes the
related expense (GASB 33) (24,658)
Total revenues as reported on the statement of revenues, expenditures
and changes in fund balances - governmental funds. [B-2] 15,496,732 223,453
Uses/outflows of resources
Actual amounts (budgetary basis) "total outflows" from the [C-1],[C-2] 16,000,348 229,723
budgetary comparison schedule
Differences - budget to GAAP
Encumbrances for supplies and equipment ordered but
received are reported in the year the order is placed for
budgetary purposes, but in the year the supplies are received
for financial reporting purposes. (6,270)
Total expenditures as reported on the statement of revenues,
expenditures, and changes in fund balances - governmental funds [B-2] 16,000,348 223,453
ENGLEWOOD CLIFFS BOARD OF EDUCATION
Required Supplementary Information
Budgetary Comparison Schedule
Note to Required Supplementary Information - Part II
Fiscal Year Ended June 30, 2018
-73-

REQUIRED SUPPLEMENTARY
INFORMATION - PART III
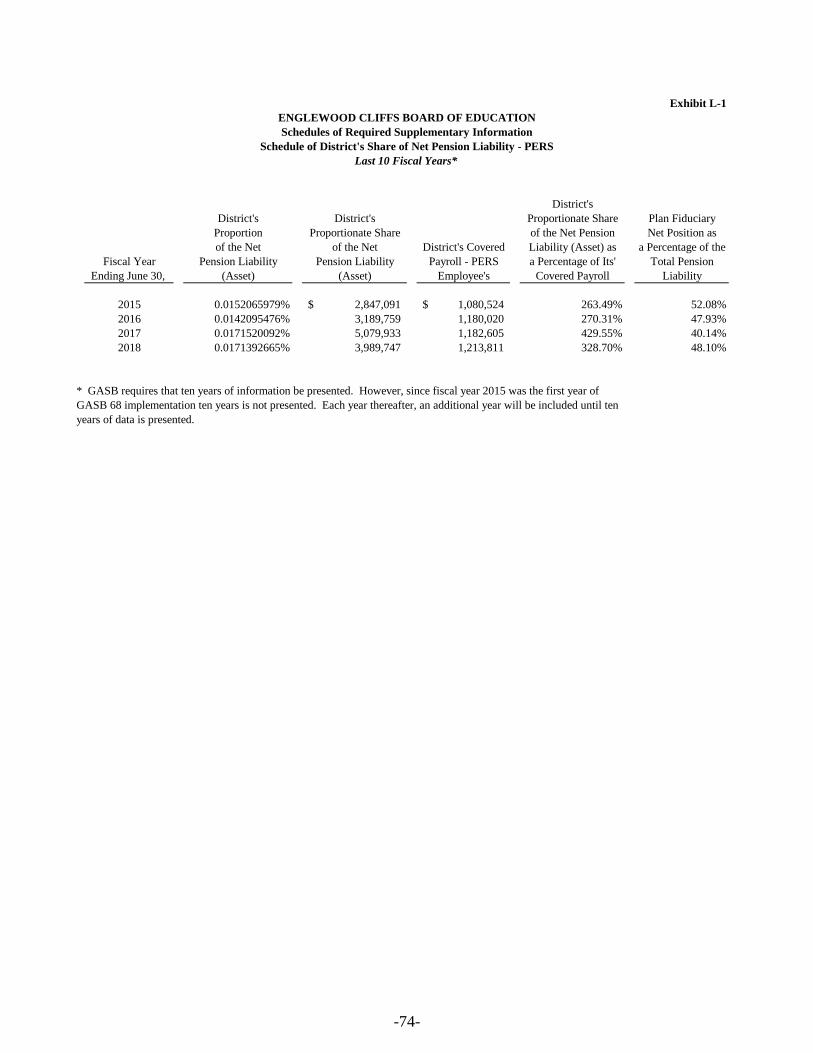
Exhibit L-1
Schedules of Required Supplementary Information
Schedule of District's Share of Net Pension Liability - PERS
Last 10 Fiscal Years*
District's
District's District's Proportionate Share Plan Fiduciary
Proportion Proportionate Share of the Net Pension Net Position as
of the Net of the Net District's Covered Liability (Asset) as a Percentage of the
Fiscal Year Pension Liability Pension Liability Payroll - PERS a Percentage of Its' Total Pension
Ending June 30, (Asset) (Asset) Employee's Covered Payroll Liability
2015 0.0152065979% 2,847,091$ 1,080,524$ 263.49% 52.08%
2016 0.0142095476% 3,189,759 1,180,020 270.31% 47.93%
2017 0.0171520092% 5,079,933 1,182,605 429.55% 40.14%
2018 0.0171392665% 3,989,747 1,213,811 328.70% 48.10%
* GASB requires that ten years of information be presented. However, since fiscal year 2015 was the first year of
GASB 68 implementation ten years is not presented. Each year thereafter, an additional year will be included until ten
years of data is presented.
ENGLEWOOD CLIFFS BOARD OF EDUCATION
-74-
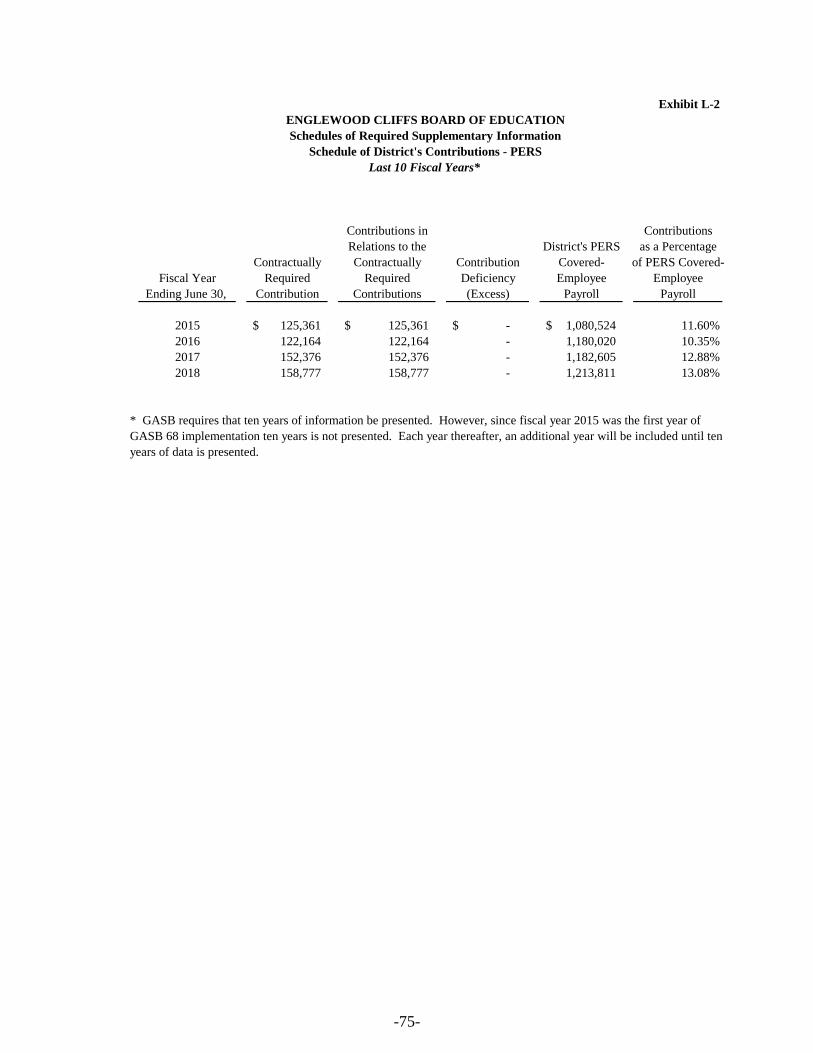
Exhibit L-2
Contributions in Contributions
Relations to the District's PERS as a Percentage
Contractually Contractually Contribution Covered- of PERS Covered-
Fiscal Year Required Required Deficiency Employee Employee
Ending June 30, Contribution Contributions (Excess) Payroll Payroll
2015 125,361$ 125,361$ -$ 1,080,524$ 11.60%
2016 122,164 122,164 - 1,180,020 10.35%
2017 152,376 152,376 - 1,182,605 12.88%
2018 158,777 158,777 - 1,213,811 13.08%
* GASB requires that ten years of information be presented. However, since fiscal year 2015 was the first year of
GASB 68 implementation ten years is not presented. Each year thereafter, an additional year will be included until ten
years of data is presented.
ENGLEWOOD CLIFFS BOARD OF EDUCATION
Schedules of Required Supplementary Information
Schedule of District's Contributions - PERS
Last 10 Fiscal Years*
-75-
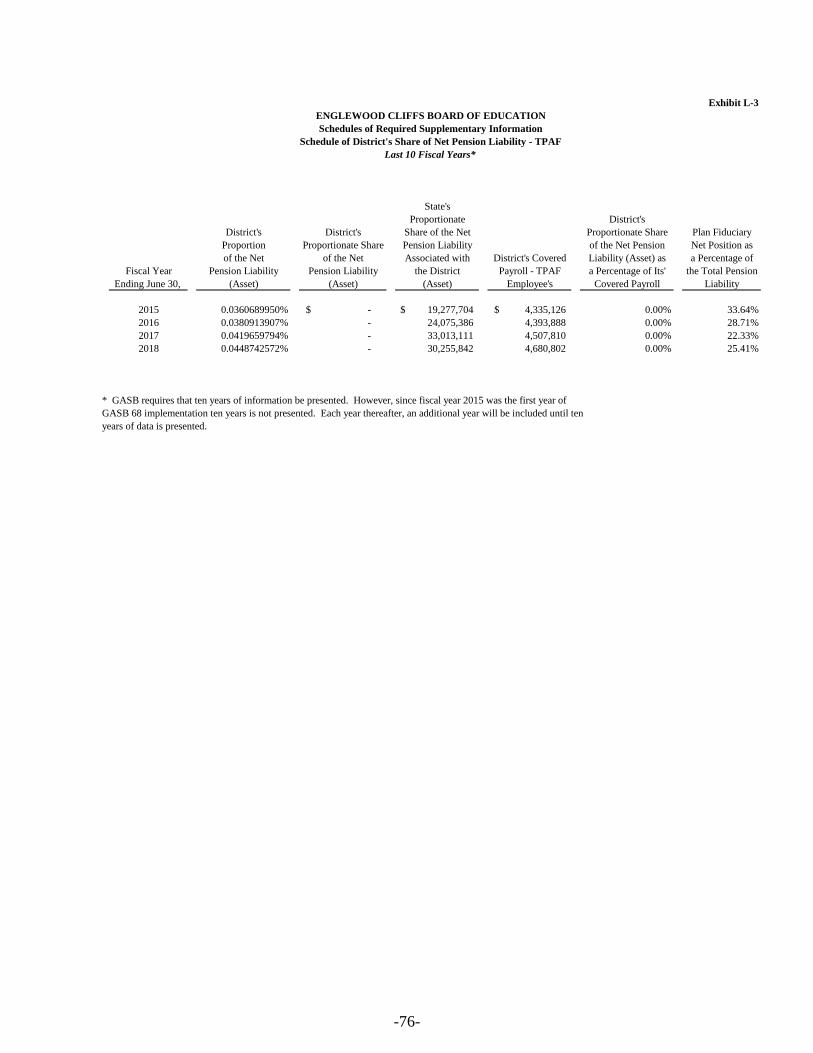
Exhibit L-3
Schedules of Required Supplementary Information
Schedule of District's Share of Net Pension Liability - TPAF
Last 10 Fiscal Years*
State's
Proportionate District's
District's District's Share of the Net Proportionate Share Plan Fiduciary
Proportion Proportionate Share Pension Liability of the Net Pension Net Position as
of the Net of the Net Associated with District's Covered Liability (Asset) as a Percentage of
Fiscal Year Pension Liability Pension Liability the District Payroll - TPAF a Percentage of Its' the Total Pension
Ending June 30, (Asset) (Asset) (Asset) Employee's Covered Payroll Liability
2015 0.0360689950% -$ 19,277,704$ 4,335,126$ 0.00% 33.64%
2016 0.0380913907% - 24,075,386 4,393,888 0.00% 28.71%
2017 0.0419659794% - 33,013,111 4,507,810 0.00% 22.33%
2018 0.0448742572% - 30,255,842 4,680,802 0.00% 25.41%
* GASB requires that ten years of information be presented. However, since fiscal year 2015 was the first year of
GASB 68 implementation ten years is not presented. Each year thereafter, an additional year will be included until ten
years of data is presented.
ENGLEWOOD CLIFFS BOARD OF EDUCATION
-76-
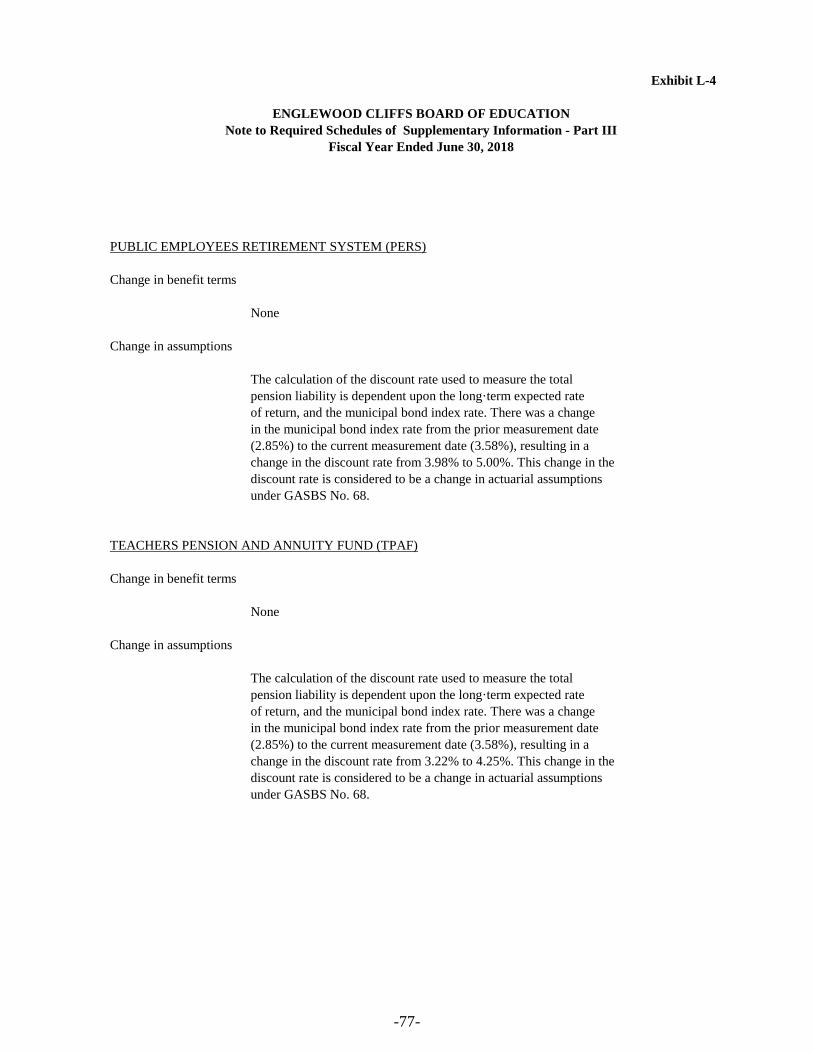
Exhibit L-4
Note to Required Schedules of Supplementary Information - Part III
PUBLIC EMPLOYEES RETIREMENT SYSTEM (PERS)
Change in benefit terms
None
Change in assumptions
The calculation of the discount rate used to measure the total
pension liability is dependent upon the long·term expected rate
of return, and the municipal bond index rate. There was a change
in the municipal bond index rate from the prior measurement date
(2.85%) to the current measurement date (3.58%), resulting in a
change in the discount rate from 3.98% to 5.00%. This change in the
discount rate is considered to be a change in actuarial assumptions
under GASBS No. 68.
TEACHERS PENSION AND ANNUITY FUND (TPAF)
Change in benefit terms
None
Change in assumptions
The calculation of the discount rate used to measure the total
pension liability is dependent upon the long·term expected rate
of return, and the municipal bond index rate. There was a change
in the municipal bond index rate from the prior measurement date
(2.85%) to the current measurement date (3.58%), resulting in a
change in the discount rate from 3.22% to 4.25%. This change in the
discount rate is considered to be a change in actuarial assumptions
under GASBS No. 68.
ENGLEWOOD CLIFFS BOARD OF EDUCATION
Fiscal Year Ended June 30, 2018
-77-

Supplementary Schedules
SPECIAL REVENUE FUND
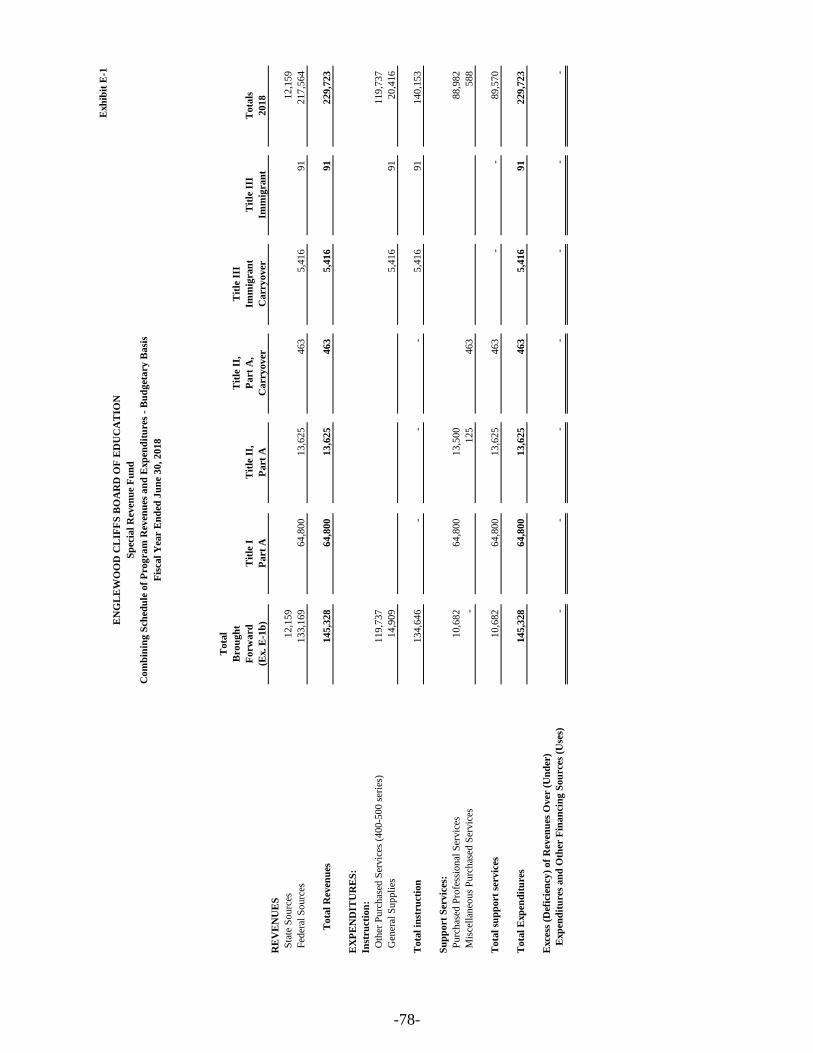
Exh
ibit
E-1
Tota
l
Bro
ugh
tT
itle
II,
Tit
le I
II
Forw
ard
Tit
le I
Tit
le I
I,P
art
A,
Imm
igra
nt
Tit
le I
IIT
ota
ls
(Ex.
E-1
b)
Part
AP
art
AC
arr
yo
ver
Ca
rry
ov
erIm
mig
ran
t2
01
8
RE
VE
NU
ES
S
tate
Sourc
es12,1
59
12
,15
9
F
eder
al S
ourc
es133,1
69
64,8
00
13,6
25
4
63
5,4
16
9
1
21
7,5
64
T
ota
l R
even
ues
145,3
28
64,8
00
13,6
25
4
63
5,4
16
9
1
22
9,7
23
EX
PE
ND
ITU
RE
S:
Inst
ruct
ion
:
O
ther
Purc
has
ed S
ervic
es (
400-5
00 s
erie
s)119,7
37
11
9,7
37
G
ener
al S
uppli
es14,9
09
5,4
16
9
1
20
,41
6
Tota
l in
stru
ctio
n134,6
46
-
-
-
5,4
16
9
1
14
0,1
53
Su
pp
ort
Ser
vic
es:
P
urc
has
ed P
rofe
ssio
nal
Ser
vic
es10,6
82
64,8
00
13,5
00
8
8,9
82
M
isce
llan
eous
Pu
rchas
ed S
ervic
es-
125
4
63
58
8
Tota
l su
pp
ort
ser
vic
es10,6
82
64,8
00
13,6
25
4
63
-
-
8
9,5
70
Tota
l E
xp
end
itu
res
145,3
28
64,8
00
13,6
25
4
63
5,4
16
9
1
22
9,7
23
Exce
ss (
Def
icie
ncy
) of
Rev
enu
es O
ver
(U
nd
er)
E
xp
end
itu
res
an
d O
ther
Fin
an
cin
g S
ou
rces
(U
ses)
-
-
-
-
-
-
-
EN
GL
EW
OO
D C
LIF
FS
BO
AR
D O
F E
DU
CA
TIO
N
Sp
ecia
l R
even
ue
Fu
nd
Com
bin
ing S
ched
ule
of
Pro
gra
m R
even
ues
an
d E
xp
end
itu
res
- B
ud
get
ary
Ba
sis
Fis
cal
Yea
r E
nd
ed J
un
e 30,
2018
-78-
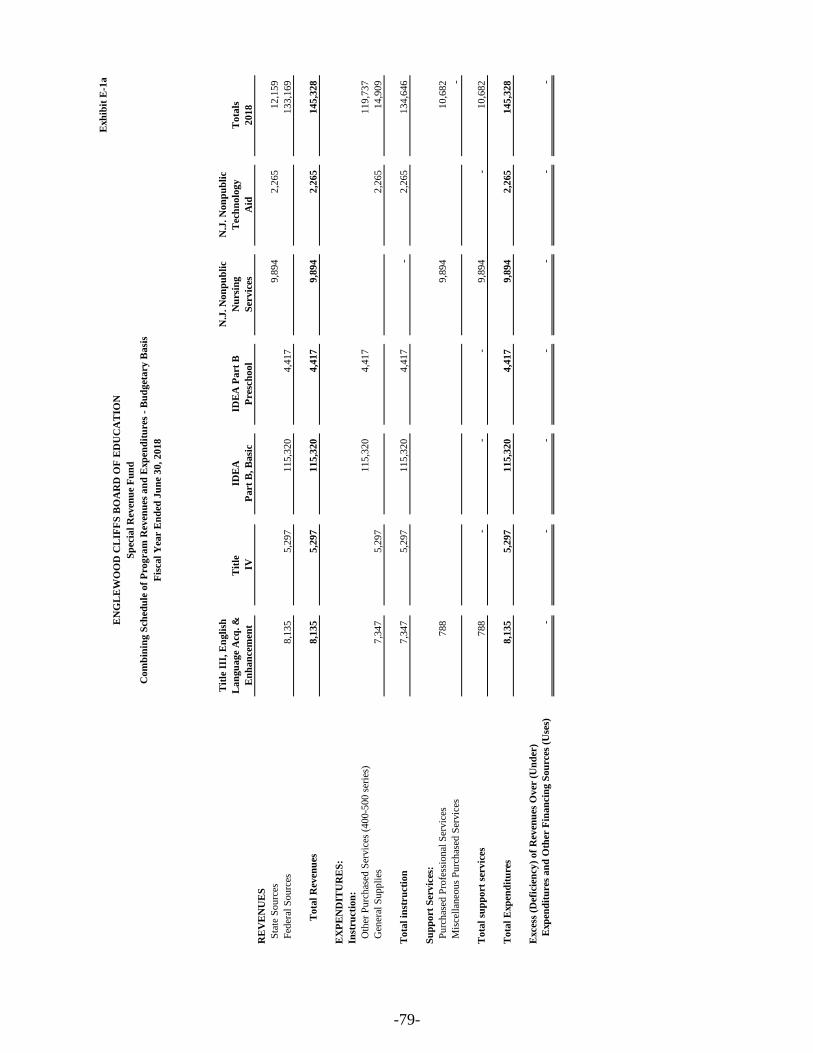
Exh
ibit
E-1
a
Tit
le I
II,
En
gli
shN
.J. N
on
pu
bli
cN
.J. N
on
pu
bli
c
Lan
gu
age
Acq
. &
Tit
le
IDE
AID
EA
Part
BN
urs
ing
Tec
hn
olo
gy
To
tals
En
han
cem
ent
IVP
art
B,
Basi
cP
resc
hoo
lS
erv
ices
Aid
20
18
RE
VE
NU
ES
S
tate
Sourc
es9
,89
4
2
,26
5
1
2,1
59
F
eder
al S
ourc
es8,1
35
5,2
97
115,3
20
4,4
17
13
3,1
69
T
ota
l R
even
ues
8,1
35
5,2
97
115,3
20
4,4
17
9,8
94
2
,26
5
1
45
,32
8
EX
PE
ND
ITU
RE
S:
Inst
ruct
ion
:
O
ther
Purc
has
ed S
ervic
es (
400-5
00 s
erie
s)115,3
20
4,4
17
11
9,7
37
G
ener
al S
uppli
es7,3
47
5,2
97
2,2
65
1
4,9
09
Tota
l in
stru
ctio
n7,3
47
5,2
97
115,3
20
4,4
17
-
2
,26
5
1
34
,64
6
Su
pp
ort
Ser
vic
es:
P
urc
has
ed P
rofe
ssio
nal
Ser
vic
es788
9
,89
4
1
0,6
82
M
isce
llan
eous
Purc
has
ed S
ervic
es-
Tota
l su
pp
ort
ser
vic
es788
-
-
-
9,8
94
-
1
0,6
82
Tota
l E
xp
end
itu
res
8,1
35
5,2
97
115,3
20
4,4
17
9,8
94
2
,26
5
1
45
,32
8
Exce
ss (
Def
icie
ncy
) of
Rev
enu
es O
ver
(U
nd
er)
E
xp
end
itu
res
an
d O
ther
Fin
an
cin
g S
ou
rces
(U
ses)
-
-
-
-
-
-
-
EN
GL
EW
OO
D C
LIF
FS
BO
AR
D O
F E
DU
CA
TIO
N
Sp
ecia
l R
even
ue
Fu
nd
Com
bin
ing S
ched
ule
of
Pro
gra
m R
even
ues
an
d E
xp
end
itu
res
- B
ud
get
ary
Ba
sis
Fis
cal
Yea
r E
nd
ed J
un
e 30,
2018
-79-
PROPRIETARY FUNDS
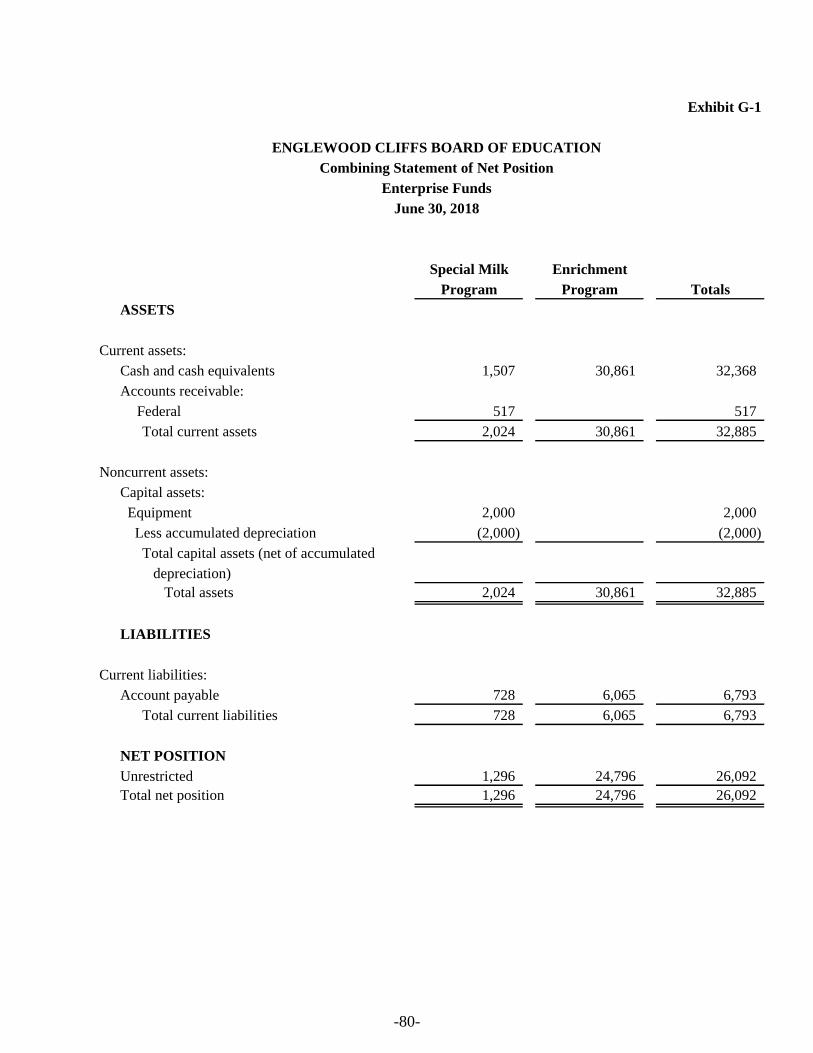
Exhibit G-1
Special Milk Enrichment
Program Program Totals
ASSETS
Current assets:
Cash and cash equivalents 1,507 30,861 32,368
Accounts receivable:
Federal 517 517
Total current assets 2,024 30,861 32,885
Noncurrent assets:
Capital assets:
Equipment 2,000 2,000
Less accumulated depreciation (2,000) (2,000)
Total capital assets (net of accumulated
depreciation)
Total assets 2,024 30,861 32,885
LIABILITIES
Current liabilities:
Account payable 728 6,065 6,793
Total current liabilities 728 6,065 6,793
NET POSITION
Unrestricted 1,296 24,796 26,092
Total net position 1,296 24,796 26,092
ENGLEWOOD CLIFFS BOARD OF EDUCATION
Combining Statement of Net Position
Enterprise Funds
June 30, 2018
-80-

Ex
hib
it G
-2
Sp
ecia
l M
ilk
En
rich
men
tIn
ven
gin
eeri
ng
Pro
gra
mP
rog
ram
Pro
gra
mT
ota
ls
Op
erat
ing r
even
ues
:
Ch
arges
for
serv
ices
:
D
aily
sal
es -
rei
mb
urs
able
pro
gra
ms
2,1
58
2,1
58
T
uit
ion
Ch
arges
42
,09
5
3,1
50
45
,24
5
T
ota
l op
erat
ing r
even
ues
2,1
58
42
,09
5
3,1
50
47
,40
3
Op
erat
ing e
xp
ense
s:
Cost
of
sale
s -
reim
bu
rsab
le p
rogra
ms
3,8
15
3,8
15
Sal
arie
s an
d w
ages
26
,94
4
2,1
75
29
,11
9
Su
pp
lies
an
d m
ater
ials
10
,44
8
97
5
11
,42
3
T
ota
l O
per
atin
g E
xp
ense
s3
,81
5
37
,39
2
3,1
50
44
,35
7
O
per
atin
g i
nco
me
(loss
)(1
,65
7)
4,7
03
-
3,0
46
Non
op
erat
ing r
even
ues
(ex
pen
ses)
:
Fed
eral
sou
rces
:
S
pec
ial
mil
k p
rogra
m2
,46
9
-
-
2,4
69
T
ota
l n
on
op
erat
ing r
even
ues
(ex
pen
ses)
2,4
69
-
-
2,4
69
I
nco
me
(loss
) b
efore
con
trib
uti
on
s &
tra
nsf
ers
81
2
4,7
03
-
5,5
15
C
han
ge
in n
et p
osi
tion
81
2
4,7
03
-
5,5
15
Tota
l n
et p
osi
tion
—b
egin
nin
g4
84
20
,09
3
20
,57
7
Tota
l n
et p
osi
tion
—en
din
g1
,29
6
24
,79
6
-
26
,09
2
EN
GL
EW
OO
D C
LIF
FS
BO
AR
D O
F E
DU
CA
TIO
N
Co
mb
inin
g S
tate
men
t o
f R
even
ues
, E
xp
ense
s, a
nd
Ch
an
ges
in
Fu
nd
Net
Po
siti
on
En
terp
rise
Fu
nd
s
Fis
cal
Yea
r E
nd
ed J
un
e 3
0, 2
01
8
-81-
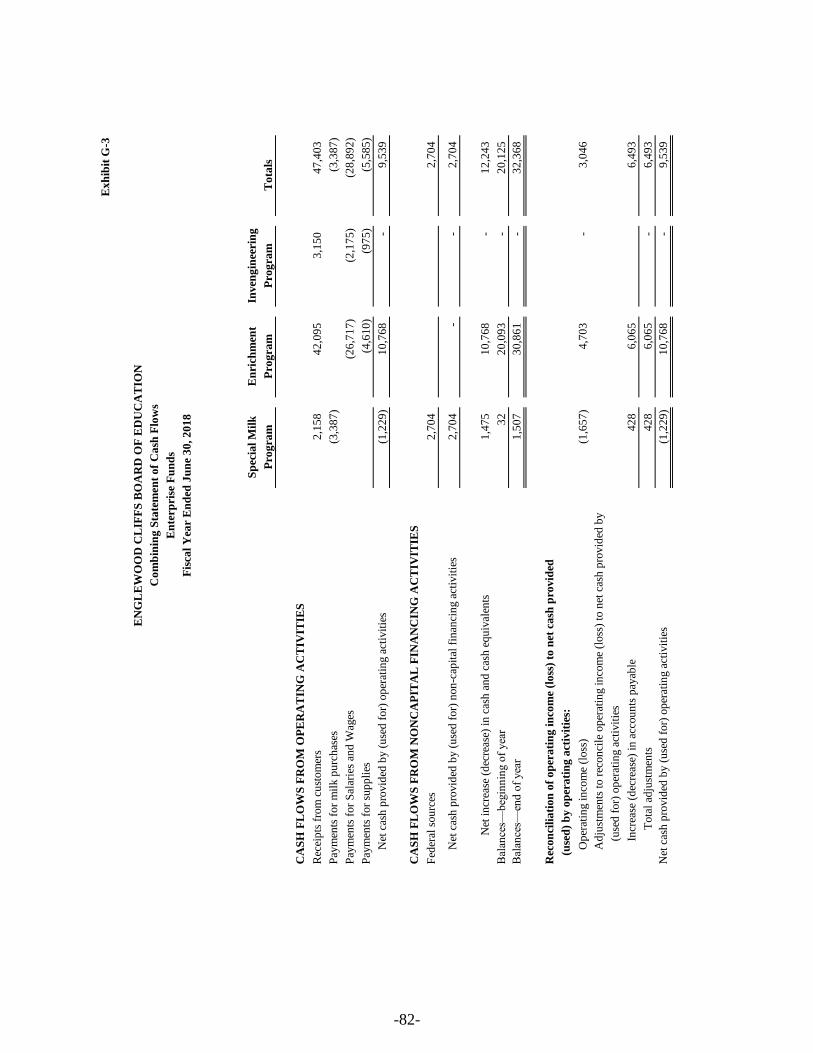
Ex
hib
it G
-3
Co
mb
inin
g S
tate
men
t o
f C
ash
Flo
ws
En
terp
rise
Fu
nd
s
Sp
ecia
l M
ilk
En
rich
men
tIn
ven
gin
eeri
ng
Pro
gra
mP
rog
ram
Pro
gra
mT
ota
ls
CA
SH
FL
OW
S F
RO
M O
PE
RA
TIN
G A
CT
IVIT
IES
Rec
eip
ts f
rom
cu
stom
ers
2,1
58
42
,09
53
,15
04
7,4
03
Pay
men
ts f
or
mil
k p
urc
has
es(3
,38
7)
(3,3
87
)
Pay
men
ts f
or
Sal
arie
s an
d W
ages
(26
,71
7)
(2,1
75
)
(28
,89
2)
Pay
men
ts f
or
sup
pli
es(4
,61
0)
(97
5)
(5,5
85
)
N
et c
ash
pro
vid
ed b
y (
use
d f
or)
op
erat
ing a
ctiv
itie
s(1
,22
9)
10
,76
8
-
9,5
39
CA
SH
FL
OW
S F
RO
M N
ON
CA
PIT
AL
FIN
AN
CIN
G A
CT
IVIT
IES
Fed
eral
sou
rces
2,7
04
2,7
04
N
et c
ash
pro
vid
ed b
y (
use
d f
or)
non
-cap
ital
fin
anci
ng a
ctiv
itie
s2
,70
4
-
-
2,7
04
N
et i
ncr
ease
(d
ecre
ase)
in
cas
h a
nd
cas
h e
qu
ival
ents
1,4
75
10
,76
8
-
12
,24
3
Bal
ance
s—b
egin
nin
g o
f yea
r3
2
20
,09
3
-
20
,12
5
Bal
ance
s—en
d o
f yea
r1
,50
7
30
,86
1
-
32
,36
8
Rec
on
cili
ati
on
of
op
era
tin
g i
nco
me
(lo
ss)
to n
et c
ash
pro
vid
ed
(
use
d)
by
op
era
tin
g a
ctiv
itie
s:
O
per
atin
g i
nco
me
(loss
)(1
,65
7)
4,7
03
-
3,0
46
A
dju
stm
ents
to r
econ
cile
op
erat
ing i
nco
me
(loss
) to
net
cas
h p
rovid
ed b
y
(u
sed
for)
op
erat
ing a
ctiv
itie
s
In
crea
se (
dec
reas
e) i
n a
ccou
nts
pay
able
42
8
6,0
65
6,4
93
T
ota
l ad
just
men
ts4
28
6,0
65
-
6,4
93
Net
cas
h p
rovid
ed b
y (
use
d f
or)
op
erat
ing a
ctiv
itie
s(1
,22
9)
10
,76
8
-
9,5
39
EN
GL
EW
OO
D C
LIF
FS
BO
AR
D O
F E
DU
CA
TIO
N
Fis
cal
Yea
r E
nd
ed J
un
e 3
0, 2
01
8
-82-
FIDUCIARY FUND
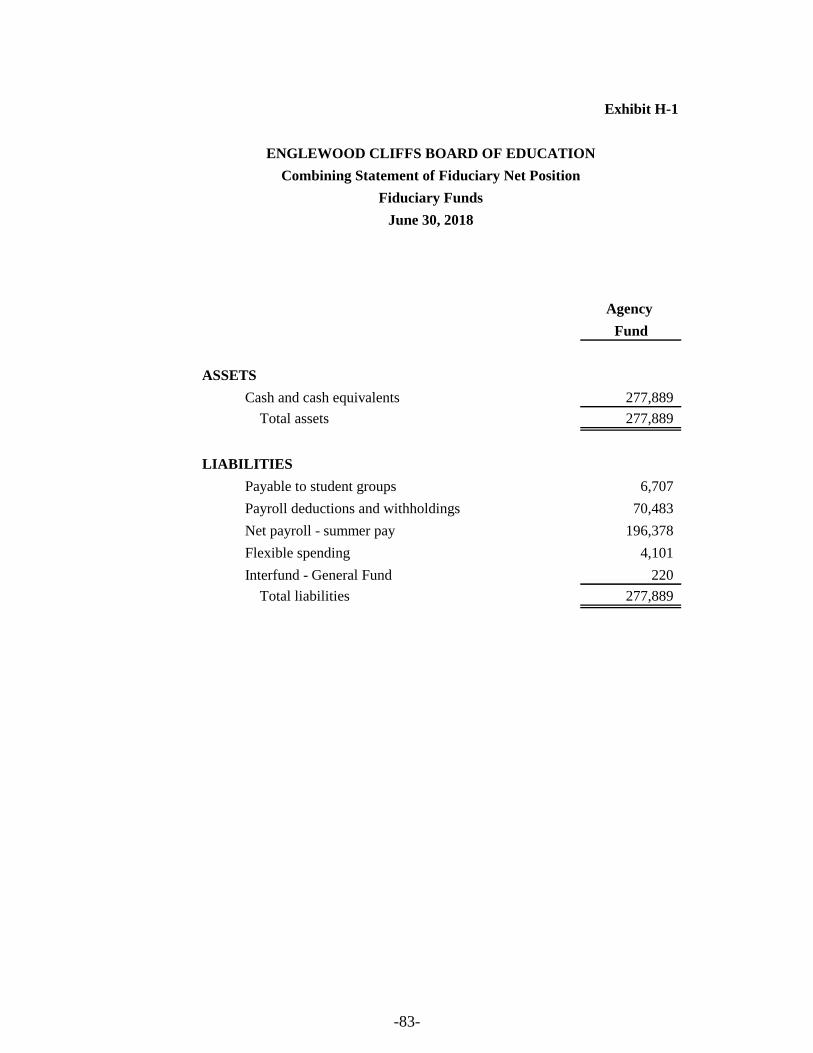
Exhibit H-1
Agency
Fund
ASSETS
Cash and cash equivalents 277,889
Total assets 277,889
LIABILITIES
Payable to student groups 6,707
Payroll deductions and withholdings 70,483
Net payroll - summer pay 196,378
Flexible spending 4,101
Interfund - General Fund 220
Total liabilities 277,889
ENGLEWOOD CLIFFS BOARD OF EDUCATION
Combining Statement of Fiduciary Net Position
Fiduciary Funds
June 30, 2018
-83-
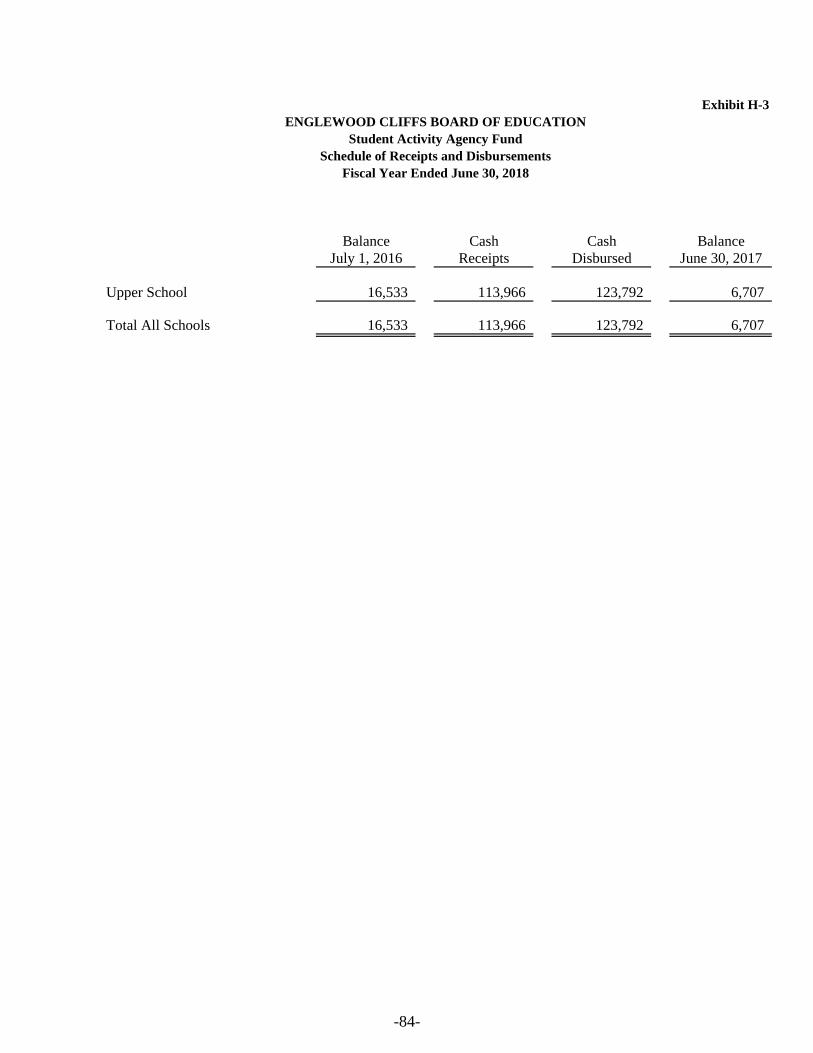
Exhibit H-3
Student Activity Agency Fund
Schedule of Receipts and Disbursements
Balance Cash Cash Balance
July 1, 2016 Receipts Disbursed June 30, 2017
Upper School 16,533 113,966 123,792 6,707
Total All Schools 16,533 113,966 123,792 6,707
ENGLEWOOD CLIFFS BOARD OF EDUCATION
Fiscal Year Ended June 30, 2018
-84-
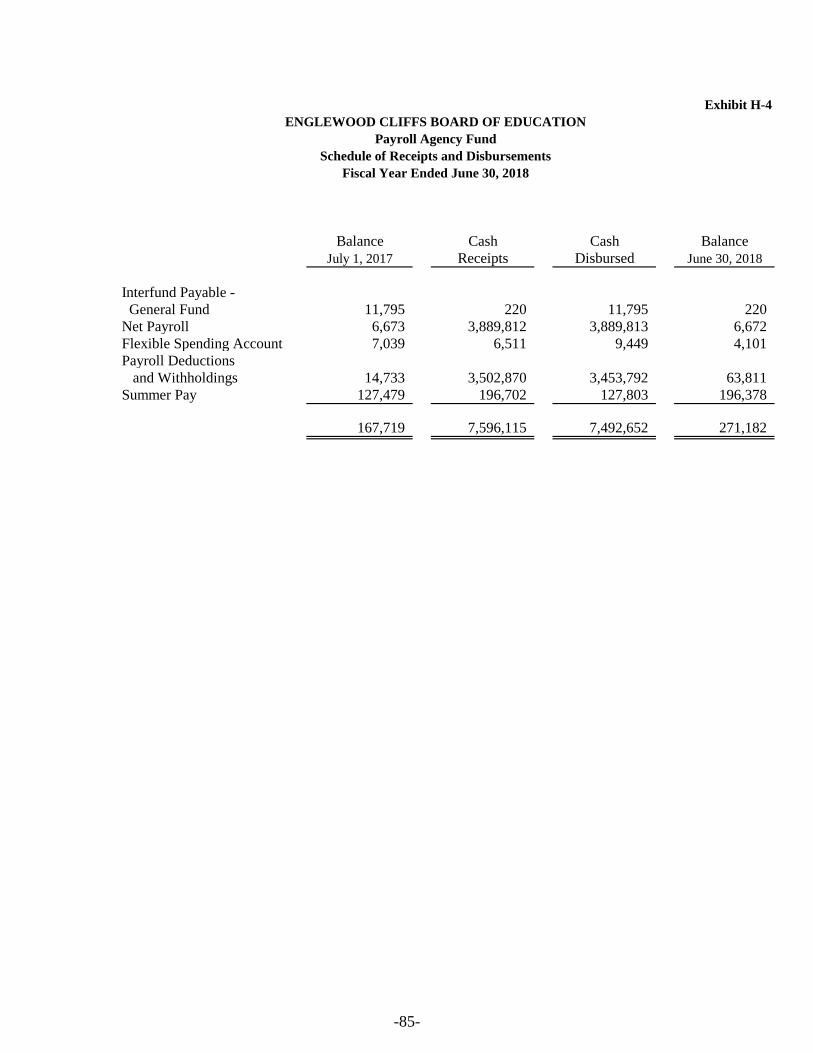
Exhibit H-4
Payroll Agency Fund
Schedule of Receipts and Disbursements
Balance Cash Cash Balance
July 1, 2017 Receipts Disbursed June 30, 2018
Interfund Payable -
General Fund 11,795 220 11,795 220
Net Payroll 6,673 3,889,812 3,889,813 6,672
Flexible Spending Account 7,039 6,511 9,449 4,101
Payroll Deductions
and Withholdings 14,733 3,502,870 3,453,792 63,811
Summer Pay 127,479 196,702 127,803 196,378
167,719 7,596,115 7,492,652 271,182
ENGLEWOOD CLIFFS BOARD OF EDUCATION
Fiscal Year Ended June 30, 2018
-85-
LONG-TERM DEBT
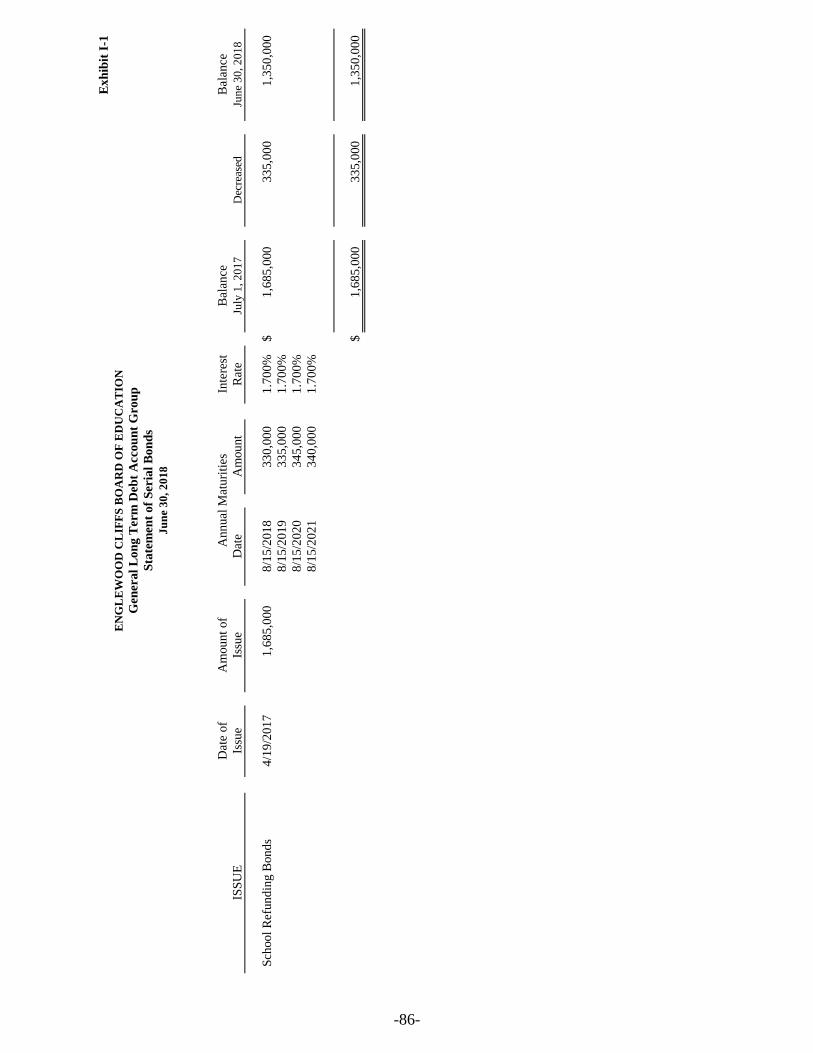
Exh
ibit
I-1
Dat
e of
Am
ount
of
Annual
Mat
uri
ties
Inte
rest
Bal
ance
Bal
ance
ISS
UE
Issu
eIs
sue
Dat
eA
mount
Rat
eJu
ly 1
, 2
01
7D
ecre
ased
Jun
e 3
0, 2
01
8
Sch
ool
Ref
un
din
g B
on
ds
4/1
9/2
01
71,6
85,0
00
8/1
5/2
018
330,0
00
1.7
00
%$
1,6
85,0
00
335,0
00
1,3
50,0
00
8/1
5/2
019
335,0
00
1.7
00
%
8/1
5/2
020
345,0
00
1.7
00
%
8/1
5/2
021
340,0
00
1.7
00
%
$1,6
85,0
00
335,0
00
1,3
50,0
00
EN
GL
EW
OO
D C
LIF
FS
BO
AR
D O
F E
DU
CA
TIO
N
Ju
ne
30
, 2
01
8
Gen
eral
Lon
g T
erm
Deb
t A
ccou
nt
Grou
p
Sta
tem
en
t of
Seria
l B
on
ds
-86-
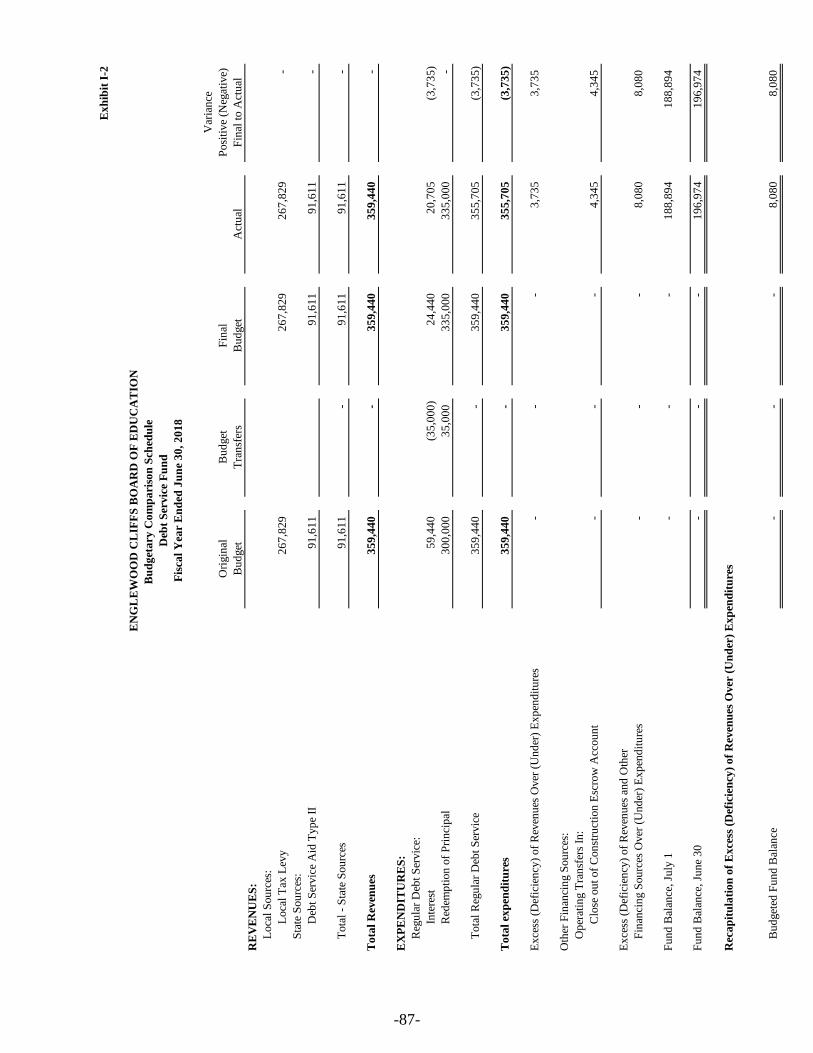
Ex
hib
it I
-2
Bu
dg
eta
ry C
om
pa
riso
n S
ched
ule
Deb
t S
ervic
e F
un
d
Var
ian
ce
Ori
gin
alB
ud
get
Fin
alP
osi
tive
(Neg
ativ
e)
Bu
dget
Tra
nsf
ers
Bu
dget
Act
ual
Fin
al t
o A
ctu
al
RE
VE
NU
ES
:
Loca
l S
ou
rces
:
Loca
l T
ax L
evy
26
7,8
29
26
7,8
29
26
7,8
29
-
Sta
te S
ou
rces
:
Deb
t S
ervic
e A
id T
yp
e II
91
,61
1
91
,61
1
91
,61
1
-
Tota
l -
Sta
te S
ou
rces
91
,61
1
-
91
,61
1
91
,61
1
-
To
tal
Rev
enu
es3
59
,44
0
-
35
9,4
40
35
9,4
40
-
EX
PE
ND
ITU
RE
S:
Reg
ula
r D
ebt
Ser
vic
e:
Inte
rest
59
,44
0
(35
,00
0)
24
,44
0
20
,70
5
(3,7
35
)
Red
emp
tion
of
Pri
nci
pal
30
0,0
00
35
,00
0
33
5,0
00
33
5,0
00
-
Tota
l R
egu
lar
Deb
t S
ervic
e3
59
,44
0
-
35
9,4
40
35
5,7
05
(3,7
35
)
To
tal
exp
end
itu
res
35
9,4
40
-
35
9,4
40
35
5,7
05
(3,7
35
)
Ex
cess
(D
efic
ien
cy)
of
Rev
enu
es O
ver
(U
nd
er)
Ex
pen
dit
ure
s-
-
-
3,7
35
3,7
35
Oth
er F
inan
cin
g S
ou
rces
:
Op
erat
ing T
ran
sfer
s In
:
Clo
se o
ut
of
Con
stru
ctio
n E
scro
w A
ccou
nt
-
-
-
4,3
45
4,3
45
Ex
cess
(D
efic
ien
cy)
of
Rev
enu
es a
nd
Oth
er
Fin
anci
ng S
ou
rces
Over
(U
nd
er)
Ex
pen
dit
ure
s-
-
-
8,0
80
8,0
80
Fu
nd
Bal
ance
, Ju
ly 1
-
-
-
18
8,8
94
18
8,8
94
Fu
nd
Bal
ance
, Ju
ne
30
-
-
-
19
6,9
74
19
6,9
74
Rec
ap
itu
lati
on
of
Ex
cess
(D
efic
ien
cy)
of
Rev
enu
es O
ver
(U
nd
er)
Ex
pen
dit
ure
s
Bu
dget
ed F
un
d B
alan
ce-
-
-
8,0
80
8,0
80
EN
GL
EW
OO
D C
LIF
FS
BO
AR
D O
F E
DU
CA
TIO
N
Fis
cal
Yea
r E
nd
ed J
un
e 3
0, 2
01
8
-87-
STATISTICAL SECTION

STATISTICAL SECTION (UNAUDITED)
Introduction to the Statistical Section
Financial Trends
J-1 Net Assets/Position by Component
J-2 Changes in Net Assets/Position
J-3 Fund Balances - Governmental Funds
J-4 Changes in Fund Balances - Governmental Funds
J-5 General Fund Other Local Revenue by Source
Revenue Capacity
J-6 Assessed Value and Estimated Actual Value of Taxable Property
J-7 Direct and Overlapping Property Tax Rates
J-8 Principal Property Taxpayers
J-9 Property Tax Levies and Collections
Debt Capacity
J-10 Ratios of Outstanding Debt by Type
J-11 Ratios of General Bonded Debt Outstanding
J-12 Direct and Overlapping Governmental Activities Debt
J-13 Legal Debt Margin Information
Demographic and Economic Information
J-14 Demographic and Economic Statistics
J-15 Principal Employers
Operating Information
J-16 Full-time Equivalent District Employees by Function/Program
J-17 Operating Statistics
J-18 School Building Information*
J-19 Schedule of Allowable Maintenance Expenditures by School Facility
J-20 Insurance Schedule
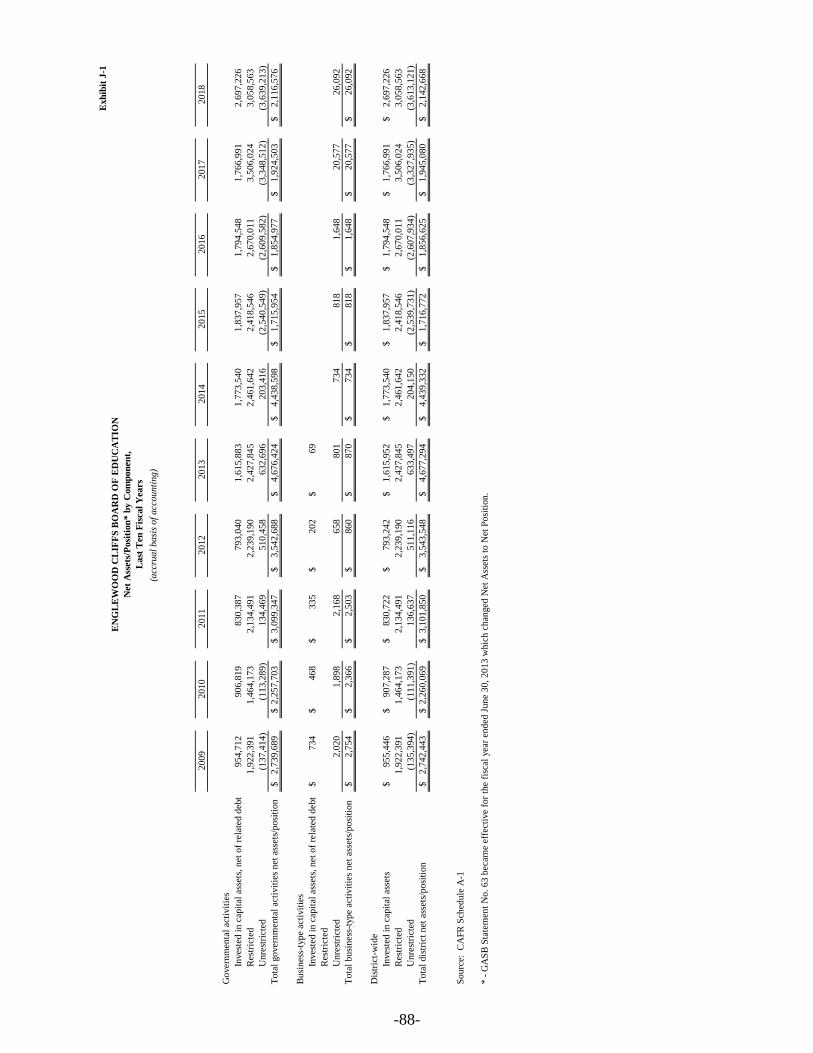
Exh
ibit
J-1
20
09
20
10
20
11
20
12
20
13
20
14
2015
2016
2017
2018
Gover
nm
enta
l ac
tivit
ies
Inves
ted i
n c
apit
al a
sset
s, n
et o
f re
late
d d
ebt
95
4,7
12
90
6,8
19
83
0,3
87
79
3,0
40
1,6
15
,88
31
,77
3,5
40
1,8
37,9
57
1,7
94,5
48
1,7
66,9
91
2,6
97,2
26
Res
tric
ted
1,9
22
,39
11
,46
4,1
73
2,1
34
,49
12
,23
9,1
90
2,4
27
,84
52
,46
1,6
42
2,4
18,5
46
2,6
70,0
11
3,5
06,0
24
3,0
58,5
63
Unre
stri
cted
(13
7,4
14
)(1
13
,28
9)
13
4,4
69
51
0,4
58
63
2,6
96
20
3,4
16
(2,5
40
,54
9)
(2,6
09
,58
2)
(3,3
48
,51
2)
(3,6
39
,21
3)
Tota
l gover
nm
enta
l ac
tivit
ies
net
ass
ets/
po
siti
on
2,7
39
,68
9$
2,2
57
,70
3$
3
,09
9,3
47
$
3
,54
2,6
88
$
4
,67
6,4
24
$
4
,43
8,5
98
$
1,7
15,9
54
$
1,8
54,9
77
$
1,9
24,5
03
$
2,1
16,5
76
$
Busi
nes
s-ty
pe
acti
vit
ies
Inves
ted i
n c
apit
al a
sset
s, n
et o
f re
late
d d
ebt
73
4$
4
68
$
33
5$
2
02
$
6
9$
Res
tric
ted
Unre
stri
cted
2,0
20
1,8
98
2,1
68
65
88
01
73
4818
1,6
48
20,5
77
26,0
92
Tota
l busi
nes
s-ty
pe
acti
vit
ies
net
ass
ets/
po
siti
on
2,7
54
$
2,3
66
$
2
,50
3$
86
0$
8
70
$
7
34
$
818
$
1,6
48
$
20,5
77
$
26,0
92
$
Dis
tric
t-w
ide
Inves
ted i
n c
apit
al a
sset
s9
55
,44
6$
90
7,2
87
$
8
30
,72
2$
79
3,2
42
$
1,6
15
,95
2$
1
,77
3,5
40
$
1,8
37,9
57
$
1,7
94,5
48
$
1,7
66,9
91
$
2,6
97,2
26
$
Res
tric
ted
1,9
22
,39
1
1,4
64
,17
3
2
,13
4,4
91
2
,23
9,1
90
2
,42
7,8
45
2
,46
1,6
42
2,4
18,5
46
2,6
70,0
11
3,5
06,0
24
3,0
58,5
63
Unre
stri
cted
(13
5,3
94
)
(1
11
,39
1)
13
6,6
37
51
1,1
16
63
3,4
97
20
4,1
50
(2,5
39
,73
1)
(2
,60
7,9
34
)
(3
,32
7,9
35
)
(3
,61
3,1
21
)
Tota
l dis
tric
t net
ass
ets/
posi
tio
n2
,74
2,4
43
$
2
,26
0,0
69
$
3,1
01
,85
0$
3,5
43
,54
8$
4
,67
7,2
94
$
4
,43
9,3
32
$
1,7
16,7
72
$
1,8
56,6
25
$
1,9
45,0
80
$
2,1
42,6
68
$
Sourc
e:
CA
FR
Sch
edule
A-1
* -
GA
SB
Sta
tem
ent
No.
63
bec
ame
effe
ctiv
e fo
r th
e fi
scal
yea
r en
ded
Ju
ne
30
, 2
01
3 w
hic
h c
han
ged
Net
Ass
ets
to N
et P
osi
tio
n.
(acc
rua
l b
asi
s o
f a
cco
un
tin
g)
EN
GL
EW
OO
D C
LIF
FS
BO
AR
D O
F E
DU
CA
TIO
N
Net
Ass
ets
/Posi
tion
* b
y C
om
pon
en
t,
La
st T
en
Fis
ca
l Y
ea
rs
-88-
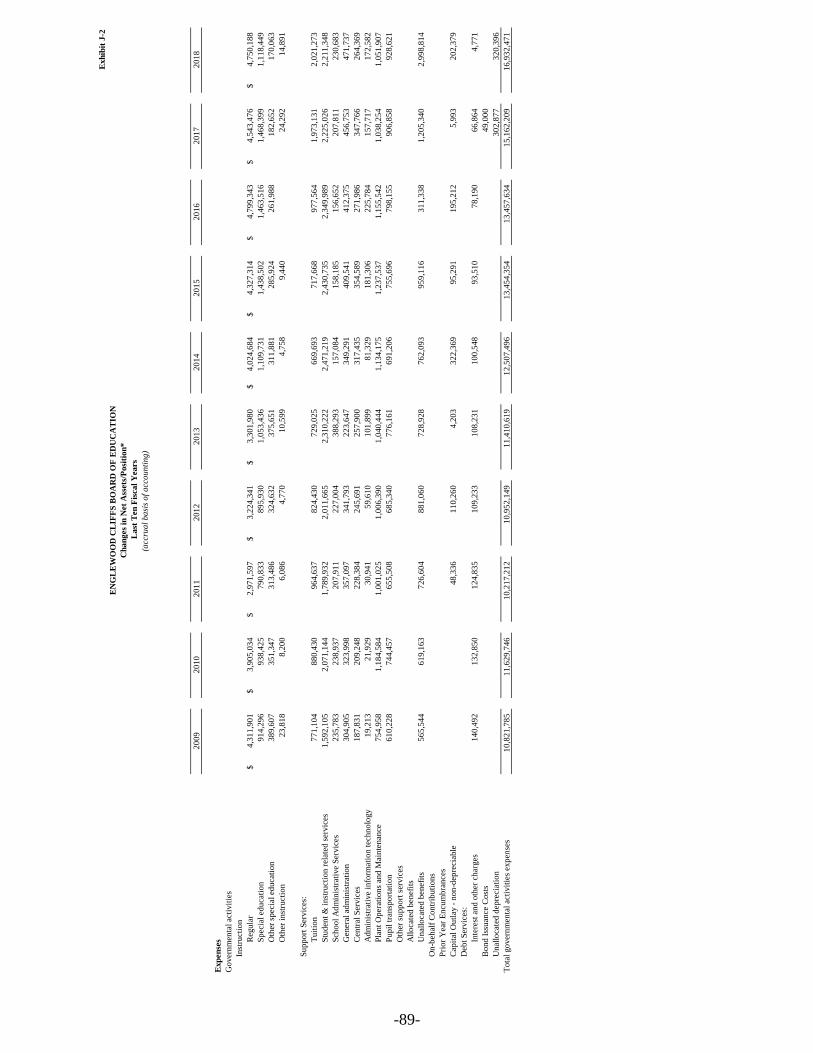
Exh
ibit
J-2
20
09
20
10
20
11
20
12
20
13
20
14
20
15
20
16
20
17
20
18
Exp
en
ses
Go
ver
nm
enta
l ac
tivit
ies
Inst
ruct
ion
Reg
ula
r4
,31
1,9
01
$
3,9
05
,03
4$
2,9
71
,59
7$
3,2
24
,34
1$
3,3
01
,98
0$
4,0
24
,68
4$
4,3
27
,31
4$
4,7
99
,34
3$
4,5
43
,47
6$
4,7
50
,18
8$
Sp
ecia
l ed
uca
tio
n9
14
,29
6
93
8,4
25
79
0,8
33
89
5,9
30
1,0
53
,43
6
1,1
09
,73
1
1,4
38
,50
2
1,4
63
,51
6
1,4
68
,39
9
1,1
18
,44
9
Oth
er s
pec
ial
edu
cati
on
38
9,6
07
35
1,3
47
31
3,4
86
32
4,6
32
37
5,6
51
31
1,8
81
28
5,9
24
26
1,9
88
18
2,6
52
17
0,0
63
Oth
er i
nst
ruct
ion
23
,81
8
8,2
00
6,0
86
4,7
70
10
,59
9
4,7
58
9,4
40
24
,29
2
14
,89
1
Su
pp
ort
Ser
vic
es:
Tu
itio
n7
71
,10
4
88
0,4
30
96
4,6
37
82
4,4
30
72
9,0
25
66
9,6
93
71
7,6
68
97
7,5
64
1,9
73
,13
1
2,0
21
,27
3
Stu
den
t &
in
stru
ctio
n r
elat
ed s
ervic
es1
,59
2,1
05
2,0
71
,14
4
1,7
89
,93
2
2,0
11
,66
5
2,3
10
,22
2
2,4
71
,21
9
2,4
30
,73
5
2,3
49
,98
9
2,2
25
,02
6
2,2
11
,34
8
Sch
oo
l A
dm
inis
trat
ive
Ser
vic
es2
35
,78
3
23
8,9
37
20
7,9
11
22
7,0
04
38
8,2
93
15
7,0
84
15
8,1
85
15
6,6
52
20
7,8
11
23
0,6
83
Gen
eral
ad
min
istr
atio
n3
04
,90
5
32
3,9
98
35
7,0
97
34
1,7
93
22
3,6
47
34
9,2
91
40
9,5
41
41
2,3
75
45
6,7
53
47
1,7
37
Cen
tral
Ser
vic
es1
87
,83
1
20
9,2
48
22
8,3
84
24
5,6
91
25
7,9
00
31
7,4
35
35
4,5
89
27
1,9
86
34
7,7
66
26
4,3
69
Ad
min
istr
ativ
e in
form
atio
n t
ech
no
logy
19
,21
3
21
,92
9
30
,94
1
59
,61
0
10
1,8
99
81
,32
9
18
1,3
06
22
5,7
84
15
7,7
17
17
2,5
82
Pla
nt
Op
erat
ion
s an
d M
ain
ten
ance
75
4,9
58
1,1
84
,58
4
1,0
01
,02
5
1,0
06
,39
0
1,0
40
,44
4
1,1
34
,17
5
1,2
37
,53
7
1,1
55
,54
2
1,0
38
,25
4
1,0
51
,90
7
Pu
pil
tra
nsp
ort
atio
n6
10
,22
8
74
4,4
57
65
5,5
08
68
5,3
40
77
6,1
61
69
1,2
06
75
5,6
96
79
8,1
55
90
6,8
58
92
8,6
21
Oth
er s
up
po
rt s
ervic
es
All
oca
ted
ben
efit
s
Un
allo
cate
d b
enef
its
56
5,5
44
61
9,1
63
72
6,6
04
88
1,0
60
72
8,9
28
76
2,0
93
95
9,1
16
31
1,3
38
1,2
05
,34
0
2,9
98
,81
4
On
-beh
alf
Co
ntr
ibu
tio
ns
Pri
or
Yea
r E
ncu
mb
ran
ces
Cap
ital
Ou
tlay
- n
on
-dep
reci
able
48
,33
6
11
0,2
60
4,2
03
32
2,3
69
95
,29
1
19
5,2
12
5,9
93
20
2,3
79
Deb
t S
ervic
es:
Inte
rest
an
d o
ther
ch
arges
14
0,4
92
13
2,8
50
12
4,8
35
10
9,2
33
10
8,2
31
10
0,5
48
93
,51
0
78
,19
0
66
,86
4
4,7
71
Bo
nd
Iss
uan
ce C
ost
s4
9,0
00
Un
allo
cate
d d
epre
ciat
ion
30
2,8
77
32
0,3
96
To
tal
go
ver
nm
enta
l ac
tivit
ies
exp
ense
s1
0,8
21
,78
5
11
,62
9,7
46
10
,21
7,2
12
10
,95
2,1
49
11
,41
0,6
19
12
,50
7,4
96
13
,45
4,3
54
13
,45
7,6
34
15
,16
2,2
09
16
,93
2,4
71
EN
GL
EW
OO
D C
LIF
FS
BO
AR
D O
F E
DU
CA
TIO
N
Ch
an
ges
in N
et
Ass
ets
/Posi
tion
*
La
st T
en
Fis
ca
l Y
ea
rs
(acc
rua
l b
asi
s o
f a
cco
un
tin
g)
-89-
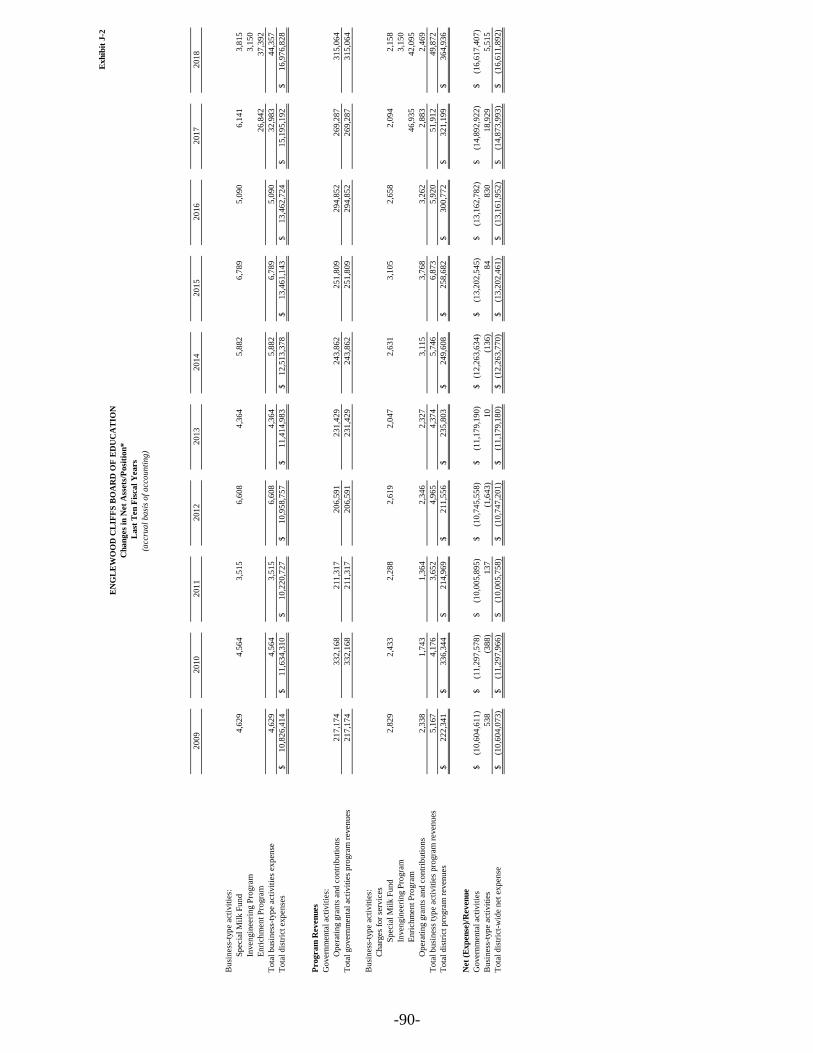
Exh
ibit
J-2
20
09
20
10
20
11
20
12
20
13
20
14
20
15
20
16
20
17
20
18
EN
GL
EW
OO
D C
LIF
FS
BO
AR
D O
F E
DU
CA
TIO
N
Ch
an
ges
in N
et
Ass
ets
/Posi
tion
*
La
st T
en
Fis
ca
l Y
ea
rs
(acc
rua
l b
asi
s o
f a
cco
un
tin
g)
Bu
sin
ess-
typ
e ac
tivit
ies:
Sp
ecia
l M
ilk F
un
d4
,62
9
4,5
64
3,5
15
6,6
08
4,3
64
5,8
82
6,7
89
5,0
90
6,1
41
3,8
15
Inven
gin
eeri
ng P
rogra
m3
,15
0
En
rich
men
t P
rogra
m2
6,8
42
37
,39
2
To
tal
bu
sin
ess-
typ
e ac
tivit
ies
exp
ense
4,6
29
4,5
64
3,5
15
6,6
08
4,3
64
5,8
82
6,7
89
5,0
90
32
,98
3
44
,35
7
To
tal
dis
tric
t ex
pen
ses
10
,82
6,4
14
$
11
,63
4,3
10
$
10
,22
0,7
27
$
10
,95
8,7
57
$
11
,41
4,9
83
$
12
,51
3,3
78
$
13
,46
1,1
43
$
13
,46
2,7
24
$
15
,19
5,1
92
$
16
,97
6,8
28
$
Prog
ra
m R
ev
en
ues
Go
ver
nm
enta
l ac
tivit
ies:
Op
erat
ing g
ran
ts a
nd
co
ntr
ibu
tio
ns
21
7,1
74
33
2,1
68
21
1,3
17
20
6,5
91
23
1,4
29
24
3,8
62
25
1,8
09
29
4,8
52
26
9,2
87
31
5,0
64
To
tal
go
ver
nm
enta
l ac
tivit
ies
pro
gra
m r
even
ues
21
7,1
74
33
2,1
68
21
1,3
17
20
6,5
91
23
1,4
29
24
3,8
62
25
1,8
09
29
4,8
52
26
9,2
87
31
5,0
64
Bu
sin
ess-
typ
e ac
tivit
ies:
Ch
arges
fo
r se
rvic
es
Sp
ecia
l M
ilk F
un
d2
,82
9
2,4
33
2,2
88
2,6
19
2,0
47
2,6
31
3,1
05
2,6
58
2,0
94
2,1
58
Inven
gin
eeri
ng P
rogra
m3
,15
0
En
rich
men
t P
rogra
m4
6,9
35
42
,09
5
Op
erat
ing g
ran
ts a
nd
co
ntr
ibu
tio
ns
2,3
38
1,7
43
1,3
64
2,3
46
2,3
27
3,1
15
3,7
68
3,2
62
2,8
83
2,4
69
To
tal
bu
sin
ess
typ
e ac
tivit
ies
pro
gra
m r
even
ues
5,1
67
4,1
76
3,6
52
4,9
65
4,3
74
5,7
46
6,8
73
5,9
20
51
,91
2
49
,87
2
To
tal
dis
tric
t p
rogra
m r
even
ues
22
2,3
41
$
33
6,3
44
$
21
4,9
69
$
21
1,5
56
$
23
5,8
03
$
24
9,6
08
$
25
8,6
82
$
30
0,7
72
$
32
1,1
99
$
36
4,9
36
$
Net
(Exp
en
se)/
Rev
en
ue
Go
ver
nm
enta
l ac
tivit
ies
(10
,60
4,6
11
)$
(11
,29
7,5
78
)$
(10
,00
5,8
95
)$
(10
,74
5,5
58
)$
(11
,17
9,1
90
)$
(12
,26
3,6
34
)$
(13
,20
2,5
45
)$
(13
,16
2,7
82
)$
(14
,89
2,9
22
)$
(16
,61
7,4
07
)$
Bu
sin
ess-
typ
e ac
tivit
ies
53
8
(38
8)
13
7
(1,6
43
)
10
(13
6)
84
83
0
18
,92
9
5,5
15
To
tal
dis
tric
t-w
ide
net
ex
pen
se(1
0,6
04
,07
3)
$
(11
,29
7,9
66
)$
(10
,00
5,7
58
)$
(10
,74
7,2
01
)$
(11
,17
9,1
80
)$
(12
,26
3,7
70
)$
(13
,20
2,4
61
)$
(13
,16
1,9
52
)$
(14
,87
3,9
93
)$
(16
,61
1,8
92
)$
-90-
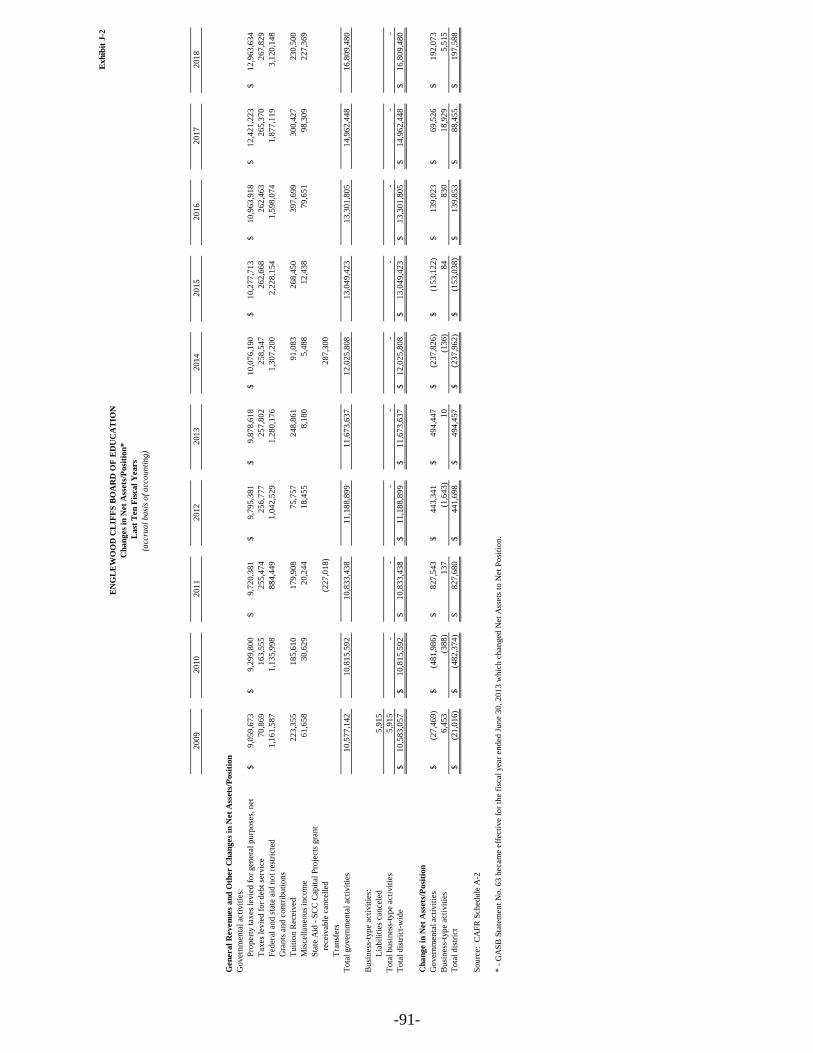
Exh
ibit
J-2
20
09
20
10
20
11
20
12
20
13
20
14
20
15
20
16
20
17
20
18
EN
GL
EW
OO
D C
LIF
FS
BO
AR
D O
F E
DU
CA
TIO
N
Ch
an
ges
in N
et
Ass
ets
/Posi
tion
*
La
st T
en
Fis
ca
l Y
ea
rs
(acc
rua
l b
asi
s o
f a
cco
un
tin
g)
Gen
era
l R
ev
en
ues
an
d O
ther C
ha
ng
es
in N
et
Ass
ets
/Posi
tion
Go
ver
nm
enta
l ac
tivit
ies:
Pro
per
ty t
axes
lev
ied
fo
r gen
eral
pu
rpo
ses,
net
9,0
59
,67
3$
9,2
99
,80
0$
9,7
20
,38
1$
9,7
95
,38
1$
9,8
78
,61
8$
10
,07
6,1
90
$
10
,27
7,7
13
$
10
,96
3,9
18
$
12
,42
1,2
23
$
12
,96
3,6
34
$
Tax
es l
evie
d f
or
deb
t se
rvic
e7
0,8
69
16
3,5
55
25
5,4
74
25
6,7
77
25
7,8
02
25
8,5
47
26
2,6
68
26
2,4
63
26
5,3
70
26
7,8
29
Fed
eral
an
d s
tate
aid
no
t re
stri
cted
1,1
61
,58
7
1,1
35
,99
8
88
4,4
49
1,0
42
,52
9
1,2
80
,17
6
1,3
07
,20
0
2,2
28
,15
4
1,5
98
,07
4
1,8
77
,11
9
3,1
20
,14
8
Gra
nts
an
d c
on
trib
uti
on
s
Tu
itio
n R
ecei
ved
22
3,3
55
18
5,6
10
17
9,9
08
75
,75
7
24
8,8
61
91
,08
3
26
8,4
50
39
7,6
99
30
0,4
27
23
0,5
00
Mis
cell
aneo
us
inco
me
61
,65
8
30
,62
9
20
,24
4
18
,45
5
8,1
80
5,4
88
12
,43
8
79
,65
1
98
,30
9
22
7,3
69
Sta
te A
id -
SC
C C
apit
al P
roje
cts
gra
nt
r
ecei
vab
le c
ance
lled
(22
7,0
18
)
28
7,3
00
Tra
nsf
ers
To
tal
go
ver
nm
enta
l ac
tivit
ies
10
,57
7,1
42
10
,81
5,5
92
10
,83
3,4
38
11
,18
8,8
99
11
,67
3,6
37
12
,02
5,8
08
13
,04
9,4
23
13
,30
1,8
05
14
,96
2,4
48
16
,80
9,4
80
Bu
sin
ess-
typ
e ac
tivit
ies:
Lia
bil
itie
s ca
nce
led
5,9
15
To
tal
bu
sin
ess-
typ
e ac
tivit
ies
5,9
15
-
-
-
-
-
-
-
-
-
To
tal
dis
tric
t-w
ide
10
,58
3,0
57
$
10
,81
5,5
92
$
10
,83
3,4
38
$
11
,18
8,8
99
$
11
,67
3,6
37
$
12
,02
5,8
08
$
13
,04
9,4
23
$
13
,30
1,8
05
$
14
,96
2,4
48
$
16
,80
9,4
80
$
Ch
an
ge i
n N
et
Ass
ets
/Posi
tion
Go
ver
nm
enta
l ac
tivit
ies
(27
,46
9)
$
(48
1,9
86
)$
82
7,5
43
$
44
3,3
41
$
49
4,4
47
$
(23
7,8
26
)$
(15
3,1
22
)$
13
9,0
23
$
69
,52
6$
19
2,0
73
$
Bu
sin
ess-
typ
e ac
tivit
ies
6,4
53
(38
8)
13
7
(1,6
43
)
10
(13
6)
84
83
0
18
,92
9
5,5
15
To
tal
dis
tric
t(2
1,0
16
)$
(48
2,3
74
)$
82
7,6
80
$
44
1,6
98
$
49
4,4
57
$
(23
7,9
62
)$
(15
3,0
38
)$
13
9,8
53
$
88
,45
5$
19
7,5
88
$
So
urc
e: C
AF
R S
ched
ule
A-2
* -
GA
SB
Sta
tem
ent
No
. 6
3 b
ecam
e ef
fect
ive
for
the
fisc
al y
ear
end
ed J
un
e 3
0, 2
01
3 w
hic
h c
han
ged
Net
Ass
ets
to N
et P
osi
tio
n.
-91-
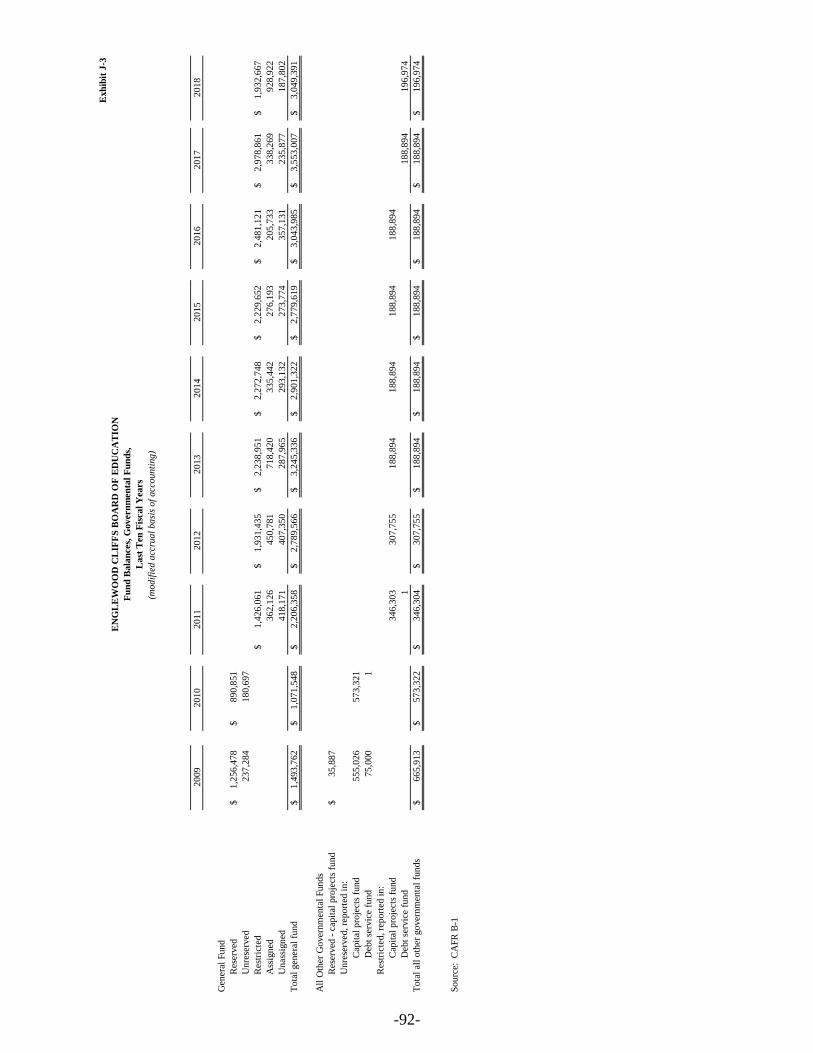
Exh
ibit
J-3
20
09
20
10
20
11
20
12
20
13
20
14
2015
2016
2017
2018
Gen
eral
Fund
Res
erved
1,2
56
,47
8$
89
0,8
51
$
Un
rese
rved
23
7,2
84
18
0,6
97
Res
tric
ted
1,4
26
,06
1$
1,9
31
,43
5$
2
,23
8,9
51
$
2
,27
2,7
48
$
2,2
29,6
52
$
2,4
81,1
21
$
2,9
78,8
61
$
1,9
32,6
67
$
Ass
igned
36
2,1
26
45
0,7
81
71
8,4
20
33
5,4
42
276,1
93
205,7
33
338,2
69
928,9
22
Un
assi
gned
41
8,1
71
40
7,3
50
28
7,9
65
29
3,1
32
273,7
74
357,1
31
235,8
77
187,8
02
Tota
l gen
eral
fund
1,4
93
,76
2$
1,0
71
,54
8$
2,2
06
,35
8$
2,7
89
,56
6$
3
,24
5,3
36
$
2
,90
1,3
22
$
2,7
79,6
19
$
3,0
43,9
85
$
3,5
53,0
07
$
3,0
49,3
91
$
All
Oth
er G
over
nm
enta
l F
unds
Res
erved
- c
apit
al p
roje
cts
fun
d3
5,8
87
$
Un
rese
rved
, re
port
ed i
n:
Cap
ital
pro
ject
s fu
nd
55
5,0
26
57
3,3
21
Deb
t se
rvic
e fu
nd
75
,00
01
Res
tric
ted,
report
ed i
n:
Cap
ital
pro
ject
s fu
nd
34
6,3
03
3
07
,75
5
18
8,8
94
18
8,8
94
188,8
94
188,8
94
Deb
t se
rvic
e fu
nd
1
188,8
94
196,9
74
Tota
l al
l oth
er g
over
nm
enta
l fu
nd
s6
65
,91
3$
57
3,3
22
$
34
6,3
04
$
3
07
,75
5$
18
8,8
94
$
18
8,8
94
$
188,8
94
$
188,8
94
$
188,8
94
$
196,9
74
$
Sourc
e:
CA
FR
B-1
(mo
dif
ied
acc
rua
l b
asi
s o
f a
cco
un
tin
g)
EN
GL
EW
OO
D C
LIF
FS
BO
AR
D O
F E
DU
CA
TIO
N
Fu
nd
Ba
lan
ces,
Gov
ern
men
tal
Fu
nd
s,
La
st T
en
Fis
ca
l Y
ea
rs
-92-
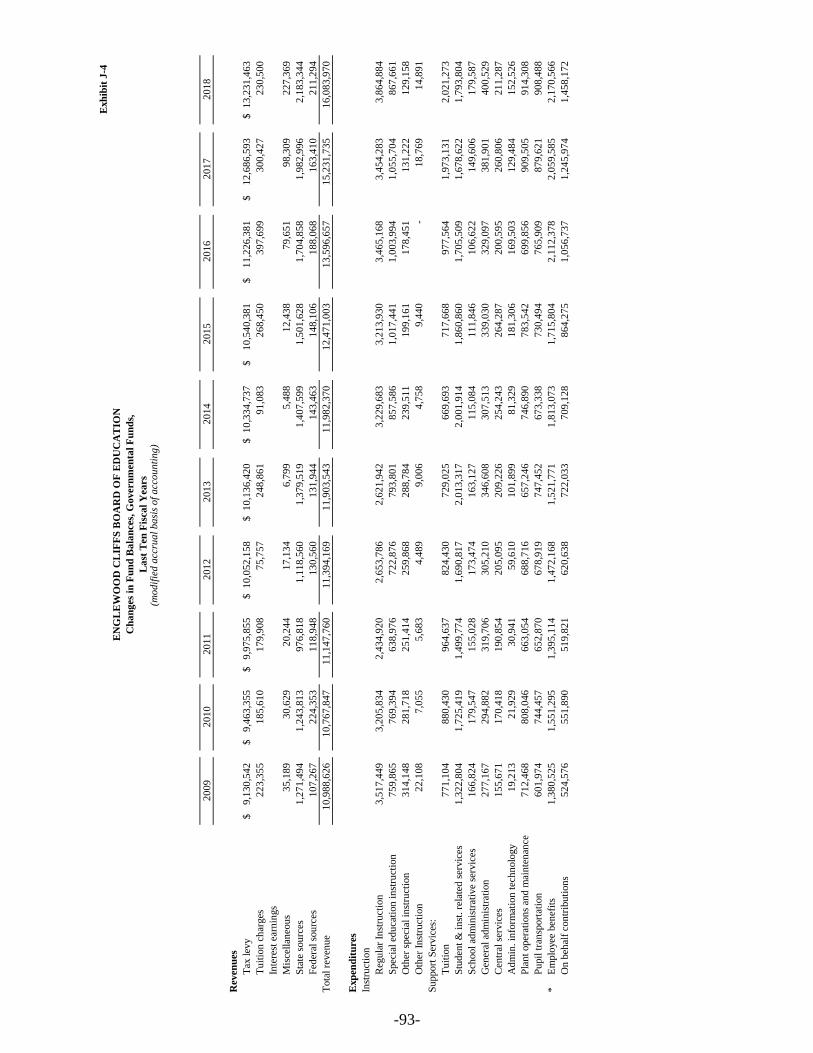
Exh
ibit
J-4
20
09
20
10
20
11
20
12
20
13
20
14
20
15
20
16
20
17
20
18
Rev
enu
es
Tax
lev
y9
,13
0,5
42
$
9,4
63
,35
5$
9,9
75
,85
5$
10
,05
2,1
58
$
10
,13
6,4
20
$
10
,33
4,7
37
$
10
,54
0,3
81
$
11
,22
6,3
81
$
12
,68
6,5
93
$
13
,23
1,4
63
$
Tu
itio
n c
har
ges
22
3,3
55
18
5,6
10
17
9,9
08
75
,75
7
24
8,8
61
91
,08
3
26
8,4
50
39
7,6
99
30
0,4
27
23
0,5
00
Inte
rest
ear
nin
gs
Mis
cell
aneo
us
35
,18
9
30
,62
9
20
,24
4
17
,13
4
6,7
99
5,4
88
12
,43
8
79
,65
1
98
,30
9
22
7,3
69
Sta
te s
ou
rces
1,2
71
,49
4
1,2
43
,81
3
97
6,8
18
1,1
18
,56
0
1,3
79
,51
9
1,4
07
,59
9
1,5
01
,62
8
1,7
04
,85
8
1,9
82
,99
6
2,1
83
,34
4
Fed
eral
sou
rces
10
7,2
67
22
4,3
53
11
8,9
48
13
0,5
60
13
1,9
44
14
3,4
63
14
8,1
06
18
8,0
68
16
3,4
10
21
1,2
94
Tota
l re
ven
ue
10
,98
8,6
26
10
,76
7,8
47
11
,14
7,7
60
11
,39
4,1
69
11
,90
3,5
43
11
,98
2,3
70
12
,47
1,0
03
13
,59
6,6
57
15
,23
1,7
35
16
,08
3,9
70
Exp
end
itu
res
Inst
ruct
ion
Reg
ula
r In
stru
ctio
n3
,51
7,4
49
3,2
05
,83
4
2,4
34
,92
0
2,6
53
,78
6
2,6
21
,94
2
3,2
29
,68
3
3,2
13
,93
0
3,4
65
,16
8
3,4
54
,28
3
3,8
64
,88
4
Spec
ial
edu
cati
on
in
stru
ctio
n7
59
,86
5
76
9,3
94
63
8,9
76
72
2,8
76
79
3,8
01
85
7,5
86
1,0
17
,44
1
1,0
03
,99
4
1,0
55
,70
4
86
7,6
61
Oth
er s
pec
ial
inst
ruct
ion
31
4,1
48
28
1,7
18
25
1,4
14
25
9,8
68
28
8,7
84
23
9,5
11
19
9,1
61
17
8,4
51
13
1,2
22
12
9,1
58
Oth
er I
nst
ruct
ion
22
,10
8
7,0
55
5,6
83
4,4
89
9,0
06
4,7
58
9,4
40
-
18
,76
9
14
,89
1
Su
pport
Ser
vic
es:
Tu
itio
n7
71
,10
4
88
0,4
30
96
4,6
37
82
4,4
30
72
9,0
25
66
9,6
93
71
7,6
68
97
7,5
64
1,9
73
,13
1
2,0
21
,27
3
Stu
den
t &
in
st. re
late
d s
ervic
es1
,32
2,8
04
1,7
25
,41
9
1,4
99
,77
4
1,6
90
,81
7
2,0
13
,31
7
2,0
01
,91
4
1,8
60
,86
0
1,7
05
,50
9
1,6
78
,62
2
1,7
93
,80
4
Sch
ool
adm
inis
trat
ive
serv
ices
16
6,8
24
17
9,5
47
15
5,0
28
17
3,4
74
16
3,1
27
11
5,0
84
11
1,8
46
10
6,6
22
14
9,6
06
17
9,5
87
Gen
eral
ad
min
istr
atio
n2
77
,16
7
29
4,8
82
31
9,7
06
30
5,2
10
34
6,6
08
30
7,5
13
33
9,0
30
32
9,0
97
38
1,9
01
40
0,5
29
Cen
tral
ser
vic
es1
55
,67
1
17
0,4
18
19
0,8
54
20
5,0
95
20
9,2
26
25
4,2
43
26
4,2
87
20
0,5
95
26
0,8
06
21
1,2
87
Ad
min
. in
form
atio
n t
ech
nolo
gy
19
,21
3
21
,92
9
30
,94
1
59
,61
0
10
1,8
99
81
,32
9
18
1,3
06
16
9,5
03
12
9,4
84
15
2,5
26
Pla
nt
oper
atio
ns
and
mai
nte
nan
ce7
12
,46
8
80
8,0
46
66
3,0
54
68
8,7
16
65
7,2
46
74
6,8
90
78
3,5
42
69
9,8
56
90
9,5
05
91
4,3
08
Pu
pil
tra
nsp
ort
atio
n6
01
,97
4
74
4,4
57
65
2,8
70
67
8,9
19
74
7,4
52
67
3,3
38
73
0,4
94
76
5,9
09
87
9,6
21
90
8,4
88
*E
mplo
yee
ben
efit
s1
,38
0,5
25
1,5
51
,29
5
1,3
95
,11
4
1,4
72
,16
8
1,5
21
,77
1
1,8
13
,07
3
1,7
15
,80
4
2,1
12
,37
8
2,0
59
,58
5
2,1
70
,56
6
On
beh
alf
con
trib
uti
on
s5
24
,57
6
55
1,8
90
51
9,8
21
62
0,6
38
72
2,0
33
70
9,1
28
86
4,2
75
1,0
56
,73
7
1,2
45
,97
4
1,4
58
,17
2
EN
GL
EW
OO
D C
LIF
FS
BO
AR
D O
F E
DU
CA
TIO
N
Ch
an
ges
in
Fu
nd
Ba
lan
ces,
Go
ver
nm
enta
l F
un
ds,
La
st T
en F
isca
l Y
ears
(mo
dif
ied
acc
rua
l b
asi
s o
f a
cco
un
tin
g)
-93-
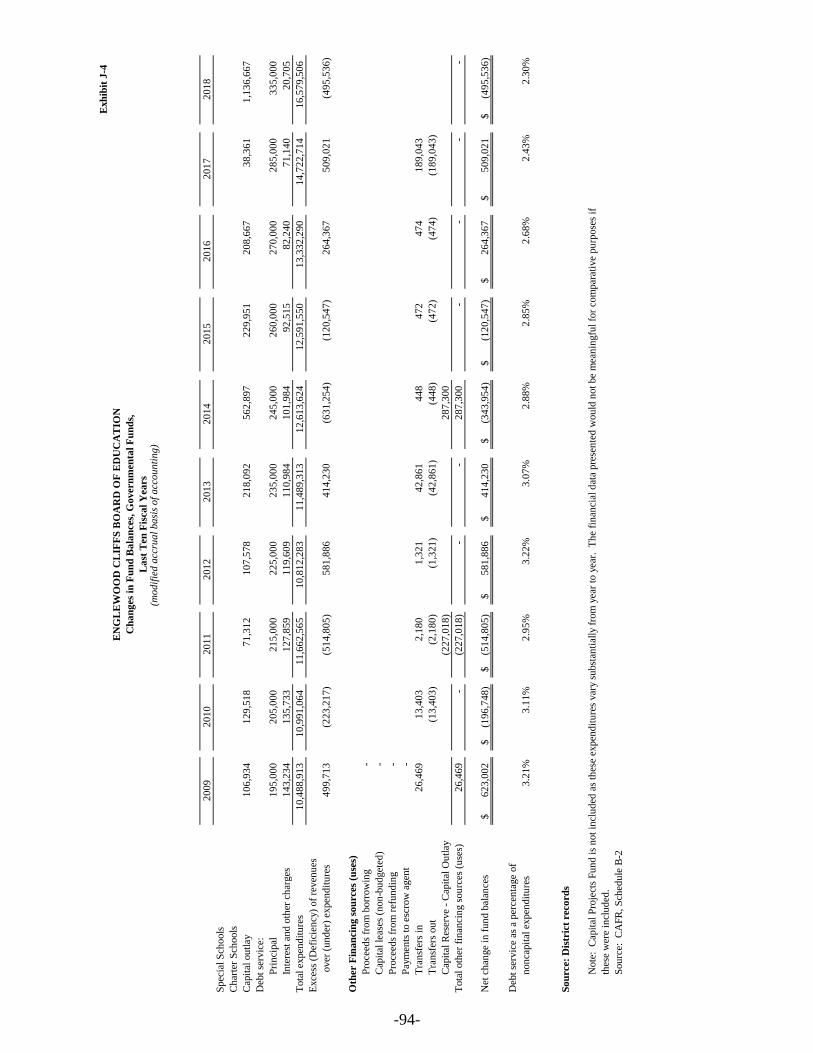
Exh
ibit
J-4
20
09
20
10
20
11
20
12
20
13
20
14
20
15
20
16
20
17
20
18
EN
GL
EW
OO
D C
LIF
FS
BO
AR
D O
F E
DU
CA
TIO
N
Ch
an
ges
in
Fu
nd
Ba
lan
ces,
Go
ver
nm
enta
l F
un
ds,
La
st T
en F
isca
l Y
ears
(mo
dif
ied
acc
rua
l b
asi
s o
f a
cco
un
tin
g)
Spec
ial
Sch
ools
Ch
arte
r S
chools
Cap
ital
ou
tlay
10
6,9
34
12
9,5
18
71
,31
2
10
7,5
78
21
8,0
92
56
2,8
97
22
9,9
51
20
8,6
67
38
,36
1
1,1
36
,66
7
Deb
t se
rvic
e:
Pri
nci
pal
19
5,0
00
20
5,0
00
21
5,0
00
22
5,0
00
23
5,0
00
24
5,0
00
26
0,0
00
27
0,0
00
28
5,0
00
33
5,0
00
Inte
rest
an
d o
ther
ch
arges
14
3,2
34
13
5,7
33
12
7,8
59
11
9,6
09
11
0,9
84
10
1,9
84
92
,51
5
82
,24
0
71
,14
0
20
,70
5
Tota
l ex
pen
dit
ure
s1
0,4
88
,91
3
10
,99
1,0
64
11
,66
2,5
65
10
,81
2,2
83
11
,48
9,3
13
12
,61
3,6
24
12
,59
1,5
50
13
,33
2,2
90
14
,72
2,7
14
16
,57
9,5
06
Exce
ss (
Def
icie
ncy
) of
reven
ues
over
(u
nd
er)
expen
dit
ure
s4
99
,71
3
(22
3,2
17
)
(51
4,8
05
)
58
1,8
86
41
4,2
30
(63
1,2
54
)
(12
0,5
47
)
26
4,3
67
50
9,0
21
(49
5,5
36
)
Oth
er F
ina
nci
ng
so
urc
es
(use
s)
Pro
ceed
s fr
om
borr
ow
ing
-
Cap
ital
lea
ses
(non
-bu
dget
ed)
-
Pro
ceed
s fr
om
ref
un
din
g-
Pay
men
ts t
o e
scro
w a
gen
t -
Tra
nsf
ers
in2
6,4
69
13
,40
3
2,1
80
1,3
21
42
,86
1
44
8
47
2
47
4
18
9,0
43
Tra
nsf
ers
ou
t(1
3,4
03
)
(2,1
80
)
(1,3
21
)
(42
,86
1)
(44
8)
(47
2)
(47
4)
(18
9,0
43
)
Cap
ital
Res
erve
- C
apit
al O
utl
ay(2
27
,01
8)
28
7,3
00
Tota
l oth
er f
inan
cin
g s
ou
rces
(u
ses)
26
,46
9
-
(22
7,0
18
)
-
-
28
7,3
00
-
-
-
-
Net
ch
ange
in f
un
d b
alan
ces
62
3,0
02
$
(19
6,7
48
)$
(51
4,8
05
)$
58
1,8
86
$
41
4,2
30
$
(34
3,9
54
)$
(12
0,5
47
)$
26
4,3
67
$
50
9,0
21
$
(49
5,5
36
)$
Deb
t se
rvic
e as
a p
erce
nta
ge
of
non
capit
al e
xpen
dit
ure
s3
.21
%3
.11
%2
.95
%3
.22
%3
.07
%2
.88
%2
.85
%2
.68
%2
.43
%2
.30
%
So
urc
e:
Dis
tric
t re
cord
s
Note
: C
apit
al P
roje
cts
Fu
nd
is
not
incl
ud
ed a
s th
ese
expen
dit
ure
s var
y s
ubst
anti
ally
fro
m y
ear
to y
ear.
T
he
fin
anci
al d
ata
pre
sen
ted
wou
ld n
ot
be
mea
nin
gfu
l fo
r co
mpar
ativ
e pu
rpose
s if
thes
e w
ere
incl
ud
ed.
Sou
rce:
C
AF
R, S
ched
ule
B-2
-94-
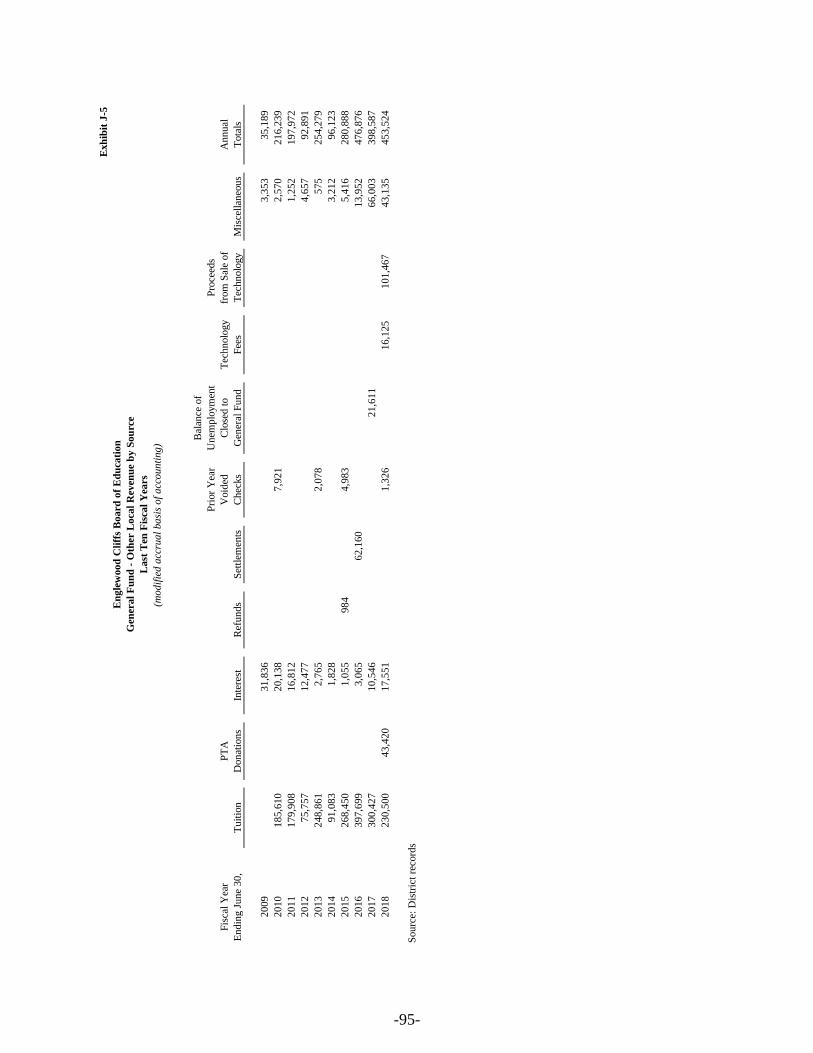
Exh
ibit
J-5
Fis
cal
Yea
r
Endin
g J
une
30,
Tu
itio
n
PT
A
Don
atio
ns
Inte
rest
Ref
unds
Set
tlem
ents
Pri
or
Yea
r
Void
ed
Chec
ks
Bal
ance
of
Unem
plo
ym
ent
Clo
sed t
o
Gen
eral
Fund
Tec
hn
olo
gy
Fee
s
Pro
ceed
s
from
Sal
e of
Tec
hn
olo
gy
Mis
cell
aneo
us
An
nu
al
Tota
ls
2009
31,8
36
3,3
53
35
,18
9
2010
18
5,6
10
20,1
38
7,9
21
2,5
70
21
6,2
39
2011
17
9,9
08
16,8
12
1,2
52
19
7,9
72
2012
75
,75
712,4
77
4,6
57
92
,89
1
2013
24
8,8
61
2,7
65
2,0
78
57
52
54
,27
9
2014
91
,08
31,8
28
3,2
12
96
,12
3
2015
26
8,4
50
1,0
55
984
4,9
83
5,4
16
28
0,8
88
2016
39
7,6
99
3,0
65
62,1
60
13
,95
24
76
,87
6
2017
30
0,4
27
10,5
46
21,6
11
66
,00
33
98
,58
7
2018
23
0,5
00
43
,42
017,5
51
1,3
26
16
,12
51
01
,46
74
3,1
35
45
3,5
24
Sourc
e: D
istr
ict
reco
rds
En
gle
wood
Cli
ffs
Board
of
Ed
uca
tion
Gen
eral
Fu
nd
- O
ther
Loca
l R
even
ue
by
Sou
rce
Last
Ten
Fis
cal
Yea
rs
(modif
ied a
ccru
al
basi
s of
acc
ounti
ng)
-95-
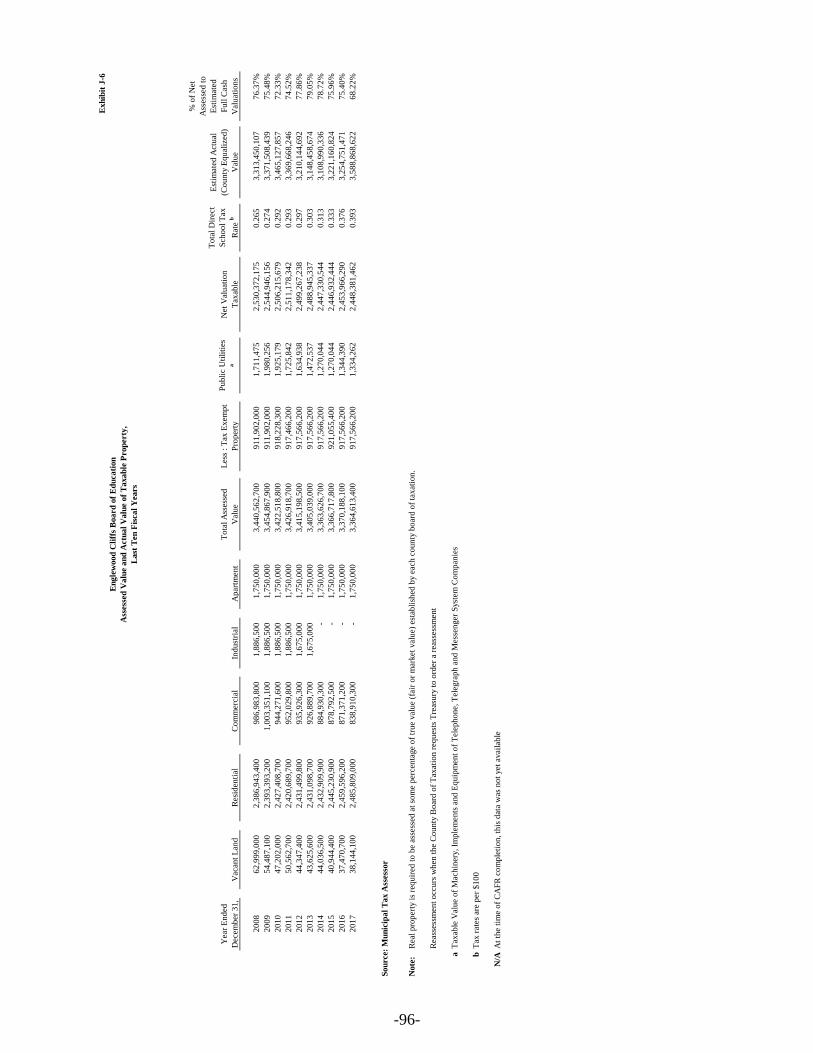
Exh
ibit
J-6
Yea
r E
nd
ed
Dec
emb
er 3
1,
Vac
ant
Lan
dR
esid
enti
alC
om
mer
cial
Ind
ust
rial
Ap
artm
ent
To
tal
Ass
esse
d
Val
ue
Les
s :
Tax
Ex
emp
t
Pro
per
ty
Pu
bli
c U
tili
ties
a
Net
Val
uat
ion
Tax
able
To
tal
Dir
ect
Sch
oo
l T
ax
Rat
e b
Est
imat
ed A
ctu
al
(Co
un
ty E
qu
aliz
ed)
Val
ue
% o
f N
et
Ass
esse
d t
o
Est
imat
ed
Fu
ll C
ash
Val
uat
ion
s
20
08
62
,99
9,0
00
2,3
86
,94
3,4
00
98
6,9
83
,80
0
1,8
86
,50
0
1,7
50
,00
0
3,4
40
,56
2,7
00
91
1,9
02
,00
0
1,7
11
,47
5
2,5
30
,37
2,1
75
0.2
65
3,3
13
,45
0,1
07
76
.37
%
20
09
54
,48
7,1
00
2,3
93
,39
3,2
00
1,0
03
,35
1,1
00
1,8
86
,50
0
1,7
50
,00
0
3,4
54
,86
7,9
00
91
1,9
02
,00
0
1,9
80
,25
6
2,5
44
,94
6,1
56
0.2
74
3,3
71
,50
8,4
39
75
.48
%
20
10
47
,20
2,0
00
2,4
27
,40
8,7
00
94
4,2
71
,60
0
1,8
86
,50
0
1,7
50
,00
0
3,4
22
,51
8,8
00
91
8,2
28
,30
0
1,9
25
,17
9
2,5
06
,21
5,6
79
0.2
92
3,4
65
,12
7,8
57
72
.33
%
20
11
50
,56
2,7
00
2,4
20
,68
9,7
00
95
2,0
29
,80
0
1,8
86
,50
0
1,7
50
,00
0
3,4
26
,91
8,7
00
91
7,4
66
,20
0
1,7
25
,84
2
2,5
11
,17
8,3
42
0.2
93
3,3
69
,66
8,2
46
74
.52
%
20
12
44
,34
7,4
00
2,4
31
,49
9,8
00
93
5,9
26
,30
0
1,6
75
,00
0
1,7
50
,00
0
3,4
15
,19
8,5
00
91
7,5
66
,20
0
1,6
34
,93
8
2,4
99
,26
7,2
38
0.2
97
3,2
10
,14
4,6
92
77
.86
%
20
13
43
,62
5,6
00
2,4
31
,09
8,7
00
92
6,8
89
,70
0
1,6
75
,00
0
1,7
50
,00
0
3,4
05
,03
9,0
00
91
7,5
66
,20
0
1,4
72
,53
7
2,4
88
,94
5,3
37
0.3
03
3,1
48
,45
8,6
74
79
.05
%
20
14
44
,03
6,5
00
2,4
32
,90
9,9
00
88
4,9
30
,30
0
-
1,7
50
,00
0
3,3
63
,62
6,7
00
91
7,5
66
,20
0
1,2
70
,04
4
2,4
47
,33
0,5
44
0.3
13
3,1
08
,99
0,3
36
78
.72
%
20
15
40
,94
4,4
00
2,4
45
,23
0,9
00
87
8,7
92
,50
0
-
1,7
50
,00
0
3,3
66
,71
7,8
00
92
1,0
55
,40
0
1,2
70
,04
4
2,4
46
,93
2,4
44
0.3
33
3,2
21
,16
0,8
24
75
.96
%
20
16
37
,47
0,7
00
2,4
59
,59
6,2
00
87
1,3
71
,20
0
-
1,7
50
,00
0
3,3
70
,18
8,1
00
91
7,5
66
,20
0
1,3
44
,39
0
2,4
53
,96
6,2
90
0.3
76
3,2
54
,75
1,4
71
75
.40
%
20
17
38
,14
4,1
00
2,4
85
,80
9,0
00
83
8,9
10
,30
0
-
1,7
50
,00
0
3,3
64
,61
3,4
00
91
7,5
66
,20
0
1,3
34
,26
2
2,4
48
,38
1,4
62
0.3
93
3,5
88
,86
8,6
22
68
.22
%
Sou
rce:
Mu
nic
ipa
l T
ax A
ssess
or
Note
:
Rea
sses
smen
t o
ccu
rs w
hen
th
e C
ou
nty
Bo
ard
of
Tax
atio
n r
equ
ests
Tre
asu
ry t
o o
rder
a r
eass
essm
ent
aT
axab
le V
alu
e o
f M
ach
iner
y, Im
ple
men
ts a
nd
Eq
uip
men
t o
f T
elep
ho
ne,
Tel
egra
ph
an
d M
esse
nger
Syst
em C
om
pan
ies
bT
ax r
ates
are
per
$1
00
N/A
At
the
tim
e o
f C
AF
R c
om
ple
tio
n, th
is d
ata
was
no
t yet
avai
lab
le
En
gle
wood
Cli
ffs
Boa
rd
of
Ed
uca
tion
Ass
ess
ed
Va
lue a
nd
Actu
al
Va
lue o
f T
axa
ble
Prop
erty
,
La
st T
en
Fis
ca
l Y
ea
rs
Rea
l p
rop
erty
is
req
uir
ed t
o b
e as
sess
ed a
t so
me
per
cen
tage
of
tru
e val
ue
(fai
r o
r m
arket
val
ue)
est
abli
shed
by e
ach
co
un
ty b
oar
d o
f ta
xat
ion
.
-96-
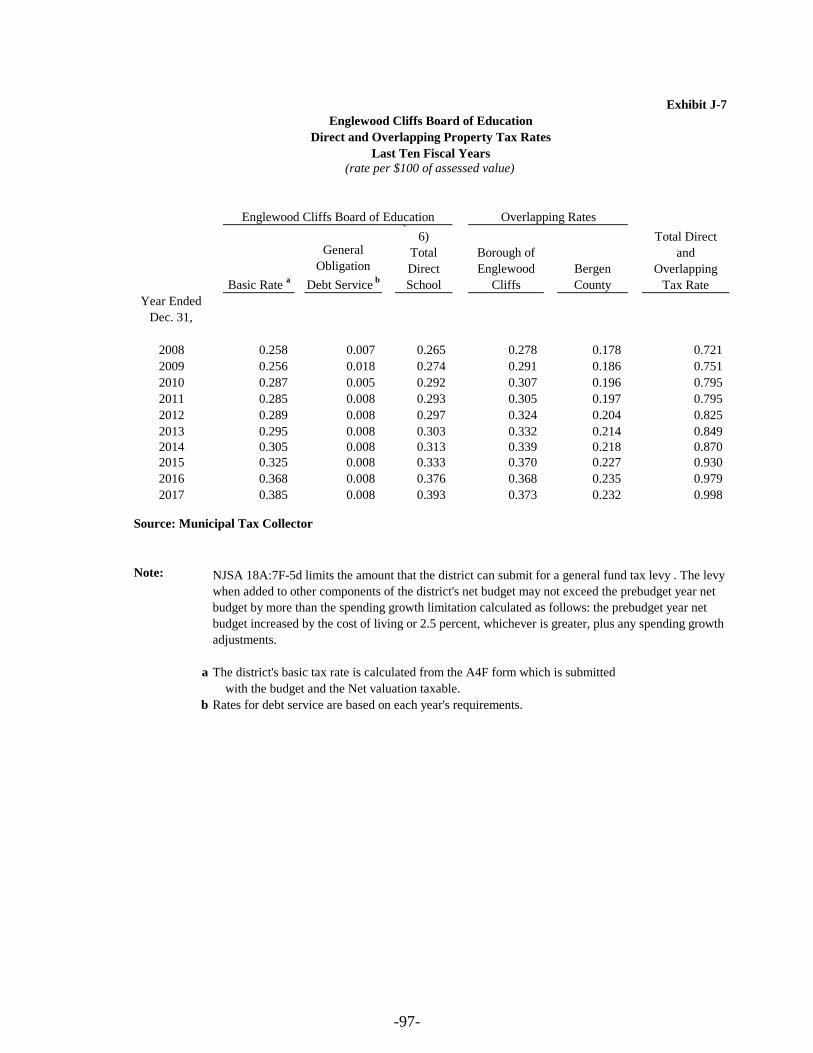
Exhibit J-7
Basic Rate a
General
Obligation
Debt Service b
(From J-
6)
Total
Direct
School
Borough of
Englewood
Cliffs
Bergen
County
Year Ended
Dec. 31,
2008 0.258 0.007 0.265 0.278 0.178 0.721
2009 0.256 0.018 0.274 0.291 0.186 0.751
2010 0.287 0.005 0.292 0.307 0.196 0.795
2011 0.285 0.008 0.293 0.305 0.197 0.795
2012 0.289 0.008 0.297 0.324 0.204 0.825
2013 0.295 0.008 0.303 0.332 0.214 0.849
2014 0.305 0.008 0.313 0.339 0.218 0.870
2015 0.325 0.008 0.333 0.370 0.227 0.930
2016 0.368 0.008 0.376 0.368 0.235 0.979
2017 0.385 0.008 0.393 0.373 0.232 0.998
Source: Municipal Tax Collector
Note:
a The district's basic tax rate is calculated from the A4F form which is submitted
with the budget and the Net valuation taxable.
b Rates for debt service are based on each year's requirements.
NJSA 18A:7F-5d limits the amount that the district can submit for a general fund tax levy . The levy
when added to other components of the district's net budget may not exceed the prebudget year net
budget by more than the spending growth limitation calculated as follows: the prebudget year net
budget increased by the cost of living or 2.5 percent, whichever is greater, plus any spending growth
adjustments.
Englewood Cliffs Board of Education
Direct and Overlapping Property Tax Rates
Last Ten Fiscal Years
(rate per $100 of assessed value)
Englewood Cliffs Board of Education Overlapping Rates
Total Direct
and
Overlapping
Tax Rate
-97-
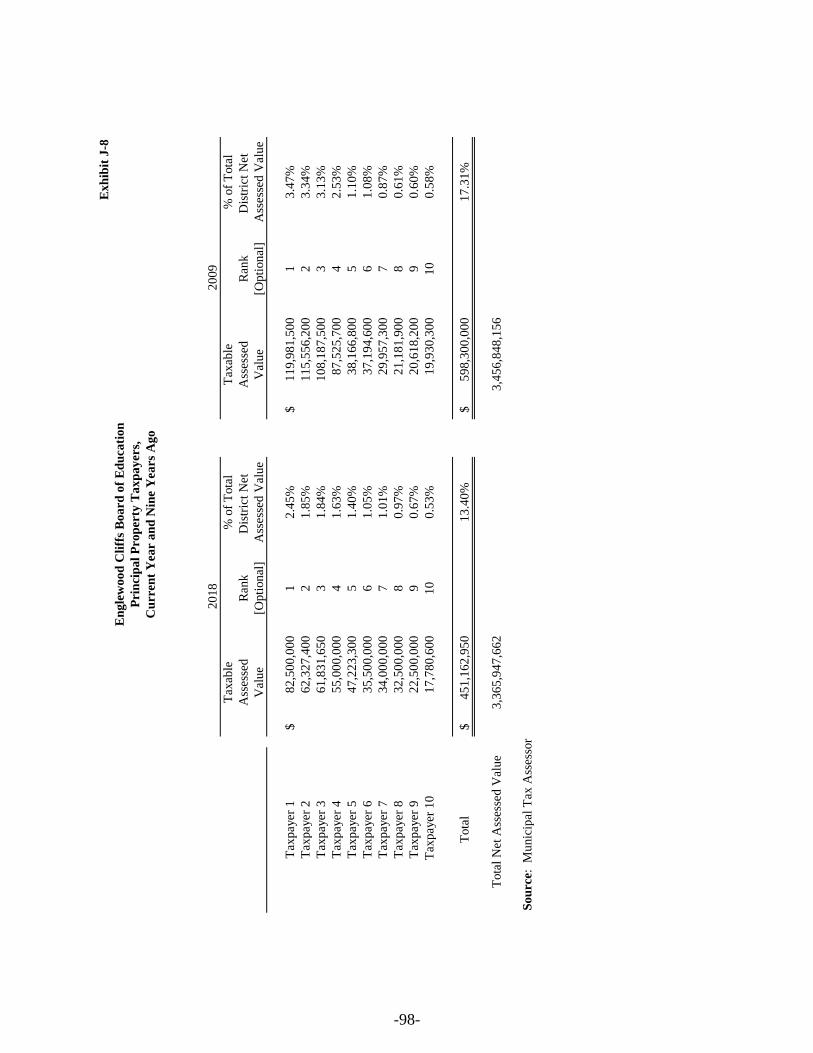
Exh
ibit
J-8
Tax
able
% o
f T
ota
lT
axab
le%
of
Tota
l
Ass
esse
dR
ank
Dis
tric
t N
et
Ass
esse
dR
ank
Dis
tric
t N
et
Val
ue
[Opti
onal
]A
sses
sed V
alue
Val
ue
[Opti
onal
]A
sses
sed V
alue
Tax
pay
er 1
82,5
00,0
00
$
12.4
5%
11
9,9
81,5
00
$
13.4
7%
Tax
pay
er 2
62,3
27,4
00
21.8
5%
11
5,5
56,2
00
23.3
4%
Tax
pay
er 3
61,8
31,6
50
31.8
4%
10
8,1
87,5
00
33.1
3%
Tax
pay
er 4
55,0
00,0
00
41.6
3%
87,5
25,7
00
42.5
3%
Tax
pay
er 5
47,2
23,3
00
51.4
0%
38,1
66,8
00
51.1
0%
Tax
pay
er 6
35,5
00,0
00
61.0
5%
37,1
94,6
00
61.0
8%
Tax
pay
er 7
34,0
00,0
00
71.0
1%
29,9
57,3
00
70.8
7%
Tax
pay
er 8
32,5
00,0
00
80.9
7%
21,1
81,9
00
80.6
1%
Tax
pay
er 9
22,5
00,0
00
90.6
7%
20,6
18,2
00
90.6
0%
Tax
pay
er 1
017,7
80,6
00
10
0.5
3%
19,9
30,3
00
10
0.5
8%
Tota
l451,1
62,9
50
$
13.4
0%
59
8,3
00,0
00
$
17.3
1%
Tota
l N
et A
sses
sed
Val
ue
3,3
65,9
47,6
62
3,4
56,8
48,1
56
So
urce:
Mu
nic
ipal
Tax
Ass
esso
r
En
gle
wood
Cli
ffs
Board
of
Ed
ucati
on
Prin
cip
al
Prop
erty
Taxp
ay
ers,
Cu
rren
t Y
ear a
nd
Nin
e Y
ears
Ago
2018
2009
-98-
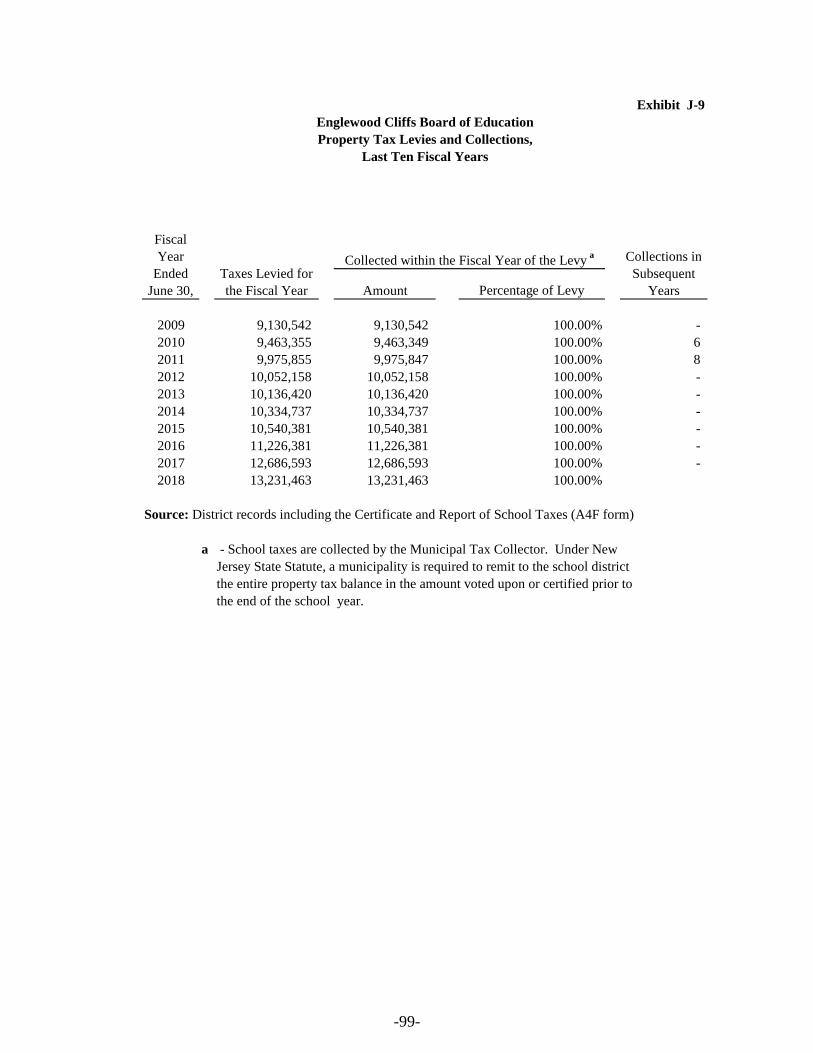
Exhibit J-9
Amount Percentage of Levy
2009 9,130,542 9,130,542 100.00% -
2010 9,463,355 9,463,349 100.00% 6
2011 9,975,855 9,975,847 100.00% 8
2012 10,052,158 10,052,158 100.00% -
2013 10,136,420 10,136,420 100.00% -
2014 10,334,737 10,334,737 100.00% -
2015 10,540,381 10,540,381 100.00% -
2016 11,226,381 11,226,381 100.00% -
2017 12,686,593 12,686,593 100.00% -
2018 13,231,463 13,231,463 100.00%
Source: District records including the Certificate and Report of School Taxes (A4F form)
a - School taxes are collected by the Municipal Tax Collector. Under New
Jersey State Statute, a municipality is required to remit to the school district
the entire property tax balance in the amount voted upon or certified prior to
the end of the school year.
Englewood Cliffs Board of Education
Property Tax Levies and Collections,
Last Ten Fiscal Years
Fiscal
Year
Ended
June 30,
Taxes Levied for
the Fiscal Year
Collected within the Fiscal Year of the Levy a Collections in
Subsequent
Years
-99-
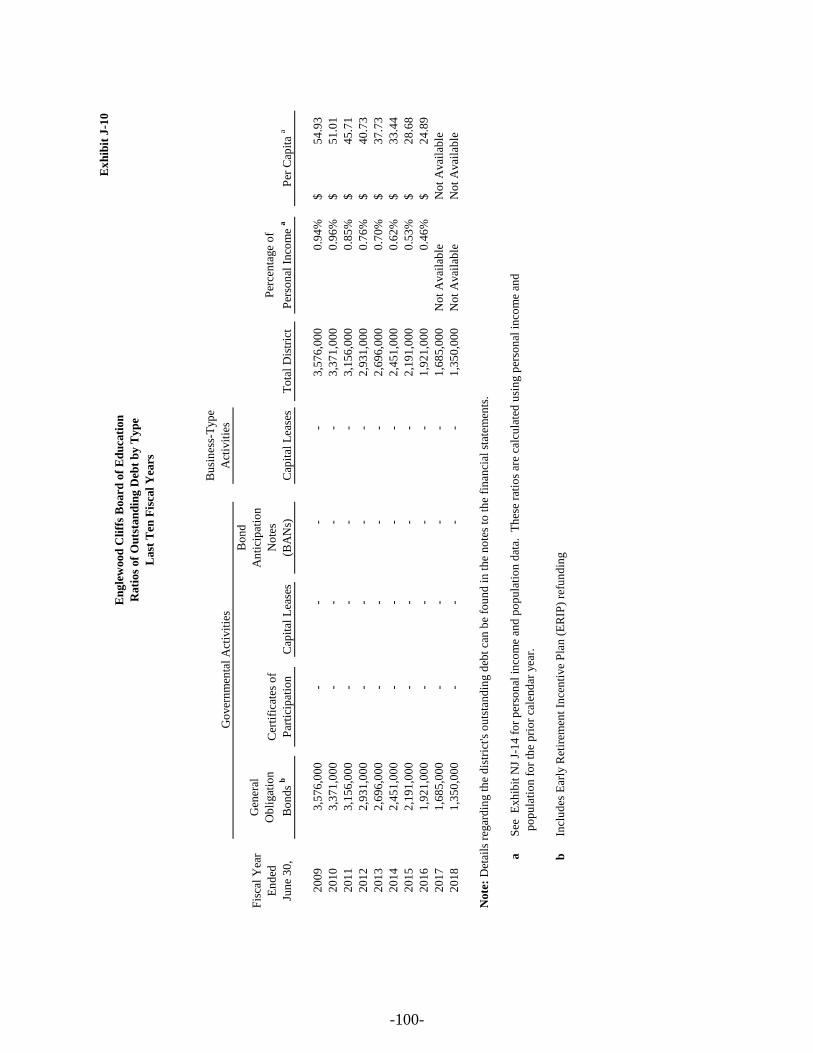
Ex
hib
it J
-10
Bu
sin
ess-
Typ
e
Act
ivit
ies
Fis
cal
Yea
r
En
ded
Jun
e 3
0,
Gen
eral
Ob
ligat
ion
Bo
nd
s b
Cer
tifi
cate
s o
f
Par
tici
pat
ion
Cap
ital
Lea
ses
Bo
nd
An
tici
pat
ion
No
tes
(BA
Ns)
Cap
ital
Lea
ses
To
tal
Dis
tric
t
Per
cen
tage
of
Per
son
al I
nco
me
aP
er C
apit
a a
20
09
3,5
76
,00
0
-
-
-
-
3,5
76
,00
0
0
.94
%5
4.9
3$
20
10
3,3
71
,00
0
-
-
-
-
3,3
71
,00
0
0
.96
%5
1.0
1$
20
11
3,1
56
,00
0
-
-
-
-
3,1
56
,00
0
0
.85
%4
5.7
1$
20
12
2,9
31
,00
0
-
-
-
-
2,9
31
,00
0
0
.76
%4
0.7
3$
20
13
2,6
96
,00
0
-
-
-
-
2,6
96
,00
0
0
.70
%3
7.7
3$
20
14
2,4
51
,00
0
-
-
-
-
2,4
51
,00
0
0
.62
%3
3.4
4$
20
15
2,1
91
,00
0
-
-
-
-
2,1
91
,00
0
0
.53
%2
8.6
8$
20
16
1,9
21
,00
0
-
-
-
-
1,9
21
,00
0
0
.46
%2
4.8
9$
20
17
1,6
85
,00
0
-
-
-
-
1,6
85
,00
0
N
ot
Avai
lab
leN
ot
Avai
lab
le
20
18
1,3
50
,00
0-
-
-
-
1,3
50
,00
0
N
ot
Avai
lab
leN
ot
Avai
lab
le
Note
: D
etai
ls r
egar
din
g t
he
dis
tric
t's o
uts
tan
din
g d
ebt
can
be
fou
nd
in
th
e n
ote
s to
th
e fi
nan
cial
sta
tem
ents
.
aS
ee
Exh
ibit
NJ
J-1
4 f
or
per
son
al i
nco
me
and
po
pu
lati
on
dat
a.
Th
ese
rati
os
are
calc
ula
ted
usi
ng p
erso
nal
in
com
e an
d
p
op
ula
tio
n f
or
the
pri
or
cale
nd
ar y
ear.
bIn
clu
des
Ear
ly R
etir
emen
t In
cen
tive
Pla
n (
ER
IP)
refu
nd
ing
En
gle
wood
Cli
ffs
Board
of
Ed
uca
tion
Rati
os
of
Ou
tsta
nd
ing
Deb
t b
y T
yp
e
Last
Ten
Fis
cal
Yea
rs
Go
ver
nm
enta
l A
ctiv
itie
s
-100-
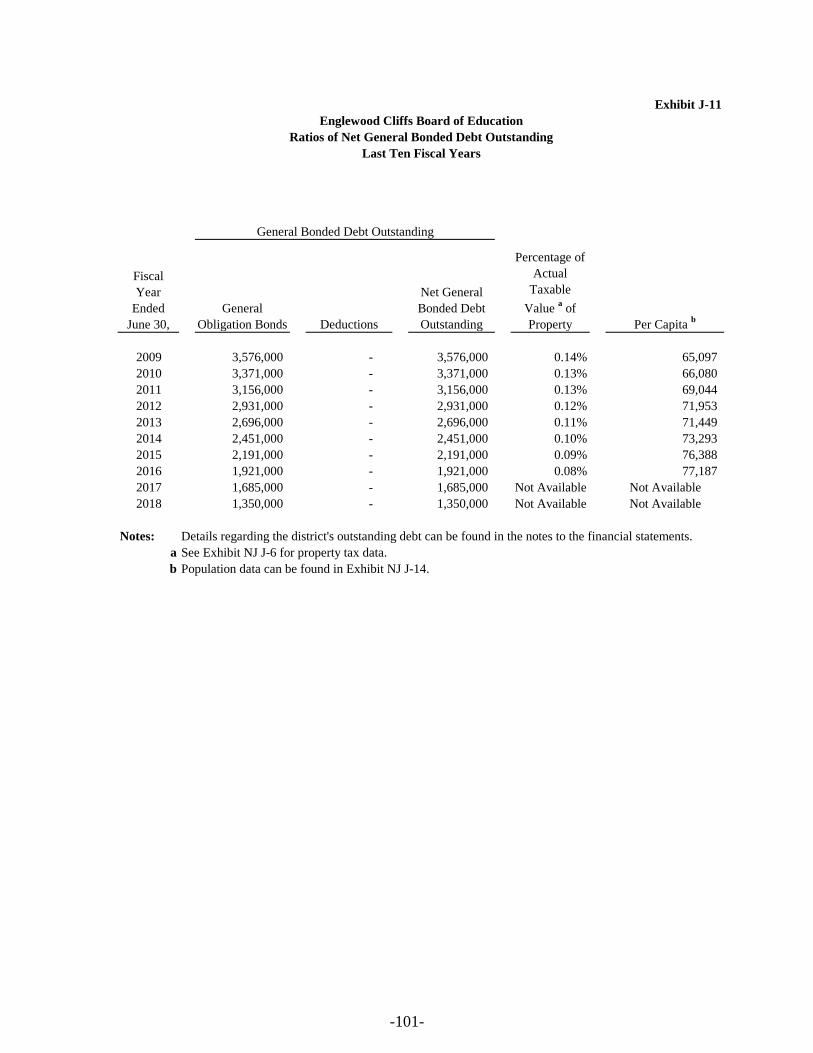
Exhibit J-11
Fiscal
Year
Ended
June 30,
General
Obligation Bonds Deductions
Net General
Bonded Debt
Outstanding
Percentage of
Actual
Taxable
Value a of
Property Per Capita b
2009 3,576,000 - 3,576,000 0.14% 65,097
2010 3,371,000 - 3,371,000 0.13% 66,080
2011 3,156,000 - 3,156,000 0.13% 69,044
2012 2,931,000 - 2,931,000 0.12% 71,953
2013 2,696,000 - 2,696,000 0.11% 71,449
2014 2,451,000 - 2,451,000 0.10% 73,293
2015 2,191,000 - 2,191,000 0.09% 76,388
2016 1,921,000 - 1,921,000 0.08% 77,187
2017 1,685,000 - 1,685,000 Not Available Not Available
2018 1,350,000 - 1,350,000 Not Available Not Available
Notes: Details regarding the district's outstanding debt can be found in the notes to the financial statements.
a See Exhibit NJ J-6 for property tax data.
b Population data can be found in Exhibit NJ J-14.
Englewood Cliffs Board of Education
Ratios of Net General Bonded Debt Outstanding
Last Ten Fiscal Years
General Bonded Debt Outstanding
-101-
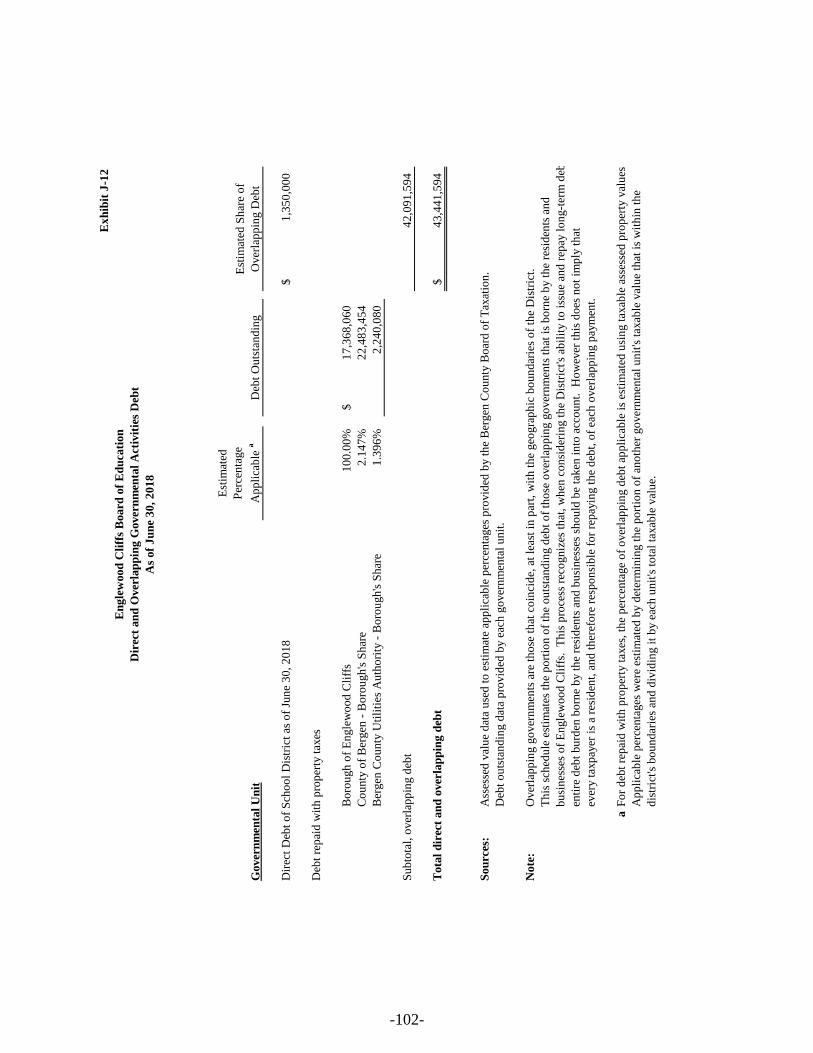
Ex
hib
it J
-12
Gover
nm
enta
l U
nit
Est
imat
ed
Per
cen
tage
Ap
pli
cab
le a
Deb
t O
uts
tan
din
g
Est
imat
ed S
har
e o
f
Over
lap
pin
g D
ebt
Dir
ect
Deb
t o
f S
cho
ol
Dis
tric
t as
of
Jun
e 3
0,
20
18
1,3
50
,00
0$
Deb
t re
pai
d w
ith
pro
per
ty t
axes
Bo
rou
gh
of
En
gle
wo
od
Cli
ffs
10
0.0
0%
17
,36
8,0
60
$
Co
un
ty o
f B
ergen
- B
oro
ugh
's S
har
e2
.14
7%
22
,48
3,4
54
Ber
gen
Co
un
ty U
tili
ties
Au
tho
rity
- B
oro
ugh
's S
har
e1
.39
6%
2,2
40
,08
0
Su
bto
tal,
over
lap
pin
g d
ebt
42
,09
1,5
94
Tota
l d
irec
t an
d o
ver
lap
pin
g d
ebt
43
,44
1,5
94
$
Sou
rces
:A
sses
sed
val
ue
dat
a u
sed
to
est
imat
e ap
pli
cab
le p
erce
nta
ges
pro
vid
ed b
y t
he
Ber
gen
Co
un
ty B
oar
d o
f T
axat
ion
.
Deb
t o
uts
tan
din
g d
ata
pro
vid
ed b
y e
ach
go
ver
nm
enta
l u
nit
.
Note
: O
ver
lap
pin
g g
over
nm
ents
are
th
ose
th
at c
oin
cid
e, a
t le
ast
in p
art,
wit
h t
he
geo
gra
ph
ic b
ou
nd
arie
s o
f th
e D
istr
ict.
Th
is s
ched
ule
est
imat
es t
he
po
rtio
n o
f th
e o
uts
tan
din
g d
ebt
of
tho
se o
ver
lap
pin
g g
over
nm
ents
th
at i
s b
orn
e b
y t
he
resi
den
ts a
nd
bu
sin
esse
s o
f E
ngle
wo
od
Cli
ffs.
T
his
pro
cess
rec
ogn
izes
th
at,
wh
en c
on
sid
erin
g t
he
Dis
tric
t's a
bil
ity t
o i
ssu
e an
d r
epay
lo
ng-t
erm
deb
t, t
he
enti
re d
ebt
bu
rden
bo
rne
by t
he
resi
den
ts a
nd
bu
sin
esse
s sh
ou
ld b
e ta
ken
in
to a
cco
un
t.
Ho
wev
er t
his
do
es n
ot
imp
ly t
hat
ever
y t
axp
ayer
is
a re
sid
ent,
an
d t
her
efo
re r
esp
on
sib
le f
or
rep
ayin
g t
he
deb
t, o
f ea
ch o
ver
lap
pin
g p
aym
ent.
aF
or
deb
t re
pai
d w
ith
pro
per
ty t
axes
, th
e p
erce
nta
ge
of
over
lap
pin
g d
ebt
app
lica
ble
is
esti
mat
ed u
sin
g t
axab
le a
sses
sed
pro
per
ty v
alu
es.
Ap
pli
cab
le p
erce
nta
ges
wer
e es
tim
ated
by d
eter
min
ing t
he
po
rtio
n o
f an
oth
er g
over
nm
enta
l u
nit
's t
axab
le v
alu
e th
at i
s w
ith
in t
he
dis
tric
t's b
ou
nd
arie
s an
d d
ivid
ing i
t b
y e
ach
un
it's
to
tal
taxab
le v
alu
e.
En
gle
wood
Cli
ffs
Board
of
Ed
uca
tion
Dir
ect
an
d O
ver
lap
pin
g G
over
nm
enta
l A
ctiv
itie
s D
ebt
As
of
Ju
ne
30
, 2
01
8
-102-
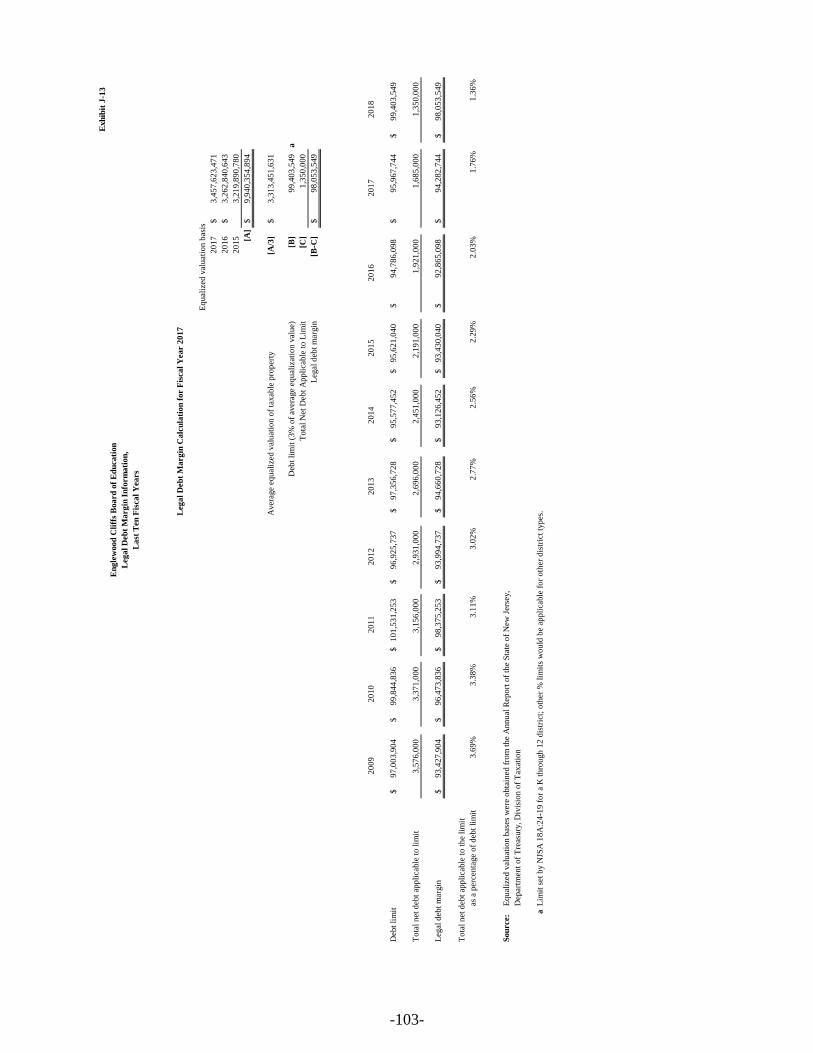
Exh
ibit
J-1
3
Leg
al
Deb
t M
arg
in C
alc
ula
tion
for F
isca
l Y
ea
r 2
01
7
Eq
ual
ized
val
uat
ion
bas
is
20
17
3,4
57
,62
3,4
71
$
20
16
3,2
62
,84
0,6
43
$
20
15
3,2
19
,89
0,7
80
[A]
9,9
40
,35
4,8
94
$
Aver
age
equ
aliz
ed v
alu
atio
n o
f ta
xab
le p
rop
erty
[A/3
]3
,31
3,4
51
,63
1$
Deb
t li
mit
(3
% o
f av
erag
e eq
ual
izat
ion
val
ue)
[B]
99
,40
3,5
49
a
To
tal
Net
Deb
t A
pp
lica
ble
to
Lim
it[C
]1
,35
0,0
00
L
egal
deb
t m
argin
[B-C
]9
8,0
53
,54
9$
20
09
20
10
20
11
20
12
20
13
20
14
20
15
20
16
20
17
20
18
Deb
t li
mit
97
,00
3,9
04
$
99
,84
4,8
36
$
10
1,5
31
,25
3$
96
,92
5,7
37
$
97
,35
6,7
28
$
95
,57
7,4
52
$
95
,62
1,0
40
$
94
,78
6,0
98
$
95
,96
7,7
44
$
99
,40
3,5
49
$
To
tal
net
deb
t ap
pli
cab
le t
o l
imit
3,5
76
,00
0
3,3
71
,00
0
3,1
56
,00
0
2,9
31
,00
0
2,6
96
,00
0
2,4
51
,00
0
2,1
91
,00
0
1,9
21
,00
0
1,6
85
,00
0
1,3
50
,00
0
Leg
al d
ebt
mar
gin
93
,42
7,9
04
$
96
,47
3,8
36
$
98
,37
5,2
53
$
93
,99
4,7
37
$
94
,66
0,7
28
$
93
,12
6,4
52
$
93
,43
0,0
40
$
92
,86
5,0
98
$
94
,28
2,7
44
$
98
,05
3,5
49
$
To
tal
net
deb
t ap
pli
cab
le t
o t
he
lim
it
as a
per
cen
tage
of
deb
t li
mit
3.6
9%
3.3
8%
3.1
1%
3.0
2%
2.7
7%
2.5
6%
2.2
9%
2.0
3%
1.7
6%
1.3
6%
Sou
rce:
Eq
ual
ized
val
uat
ion
bas
es w
ere
ob
tain
ed f
rom
th
e A
nn
ual
Rep
ort
of
the
Sta
te o
f N
ew J
erse
y,
Dep
artm
ent
of
Tre
asu
ry, D
ivis
ion
of
Tax
atio
n
aL
imit
set
by N
JSA
18
A:2
4-1
9 f
or
a K
th
rou
gh
12
dis
tric
t; o
ther
% l
imit
s w
ou
ld b
e ap
pli
cab
le f
or
oth
er d
istr
ict
typ
es.
En
gle
wood
Cli
ffs
Boa
rd
of
Ed
uca
tion
Leg
al
Deb
t M
arg
in I
nfo
rm
ati
on
,
La
st T
en
Fis
ca
l Y
ea
rs
-103-
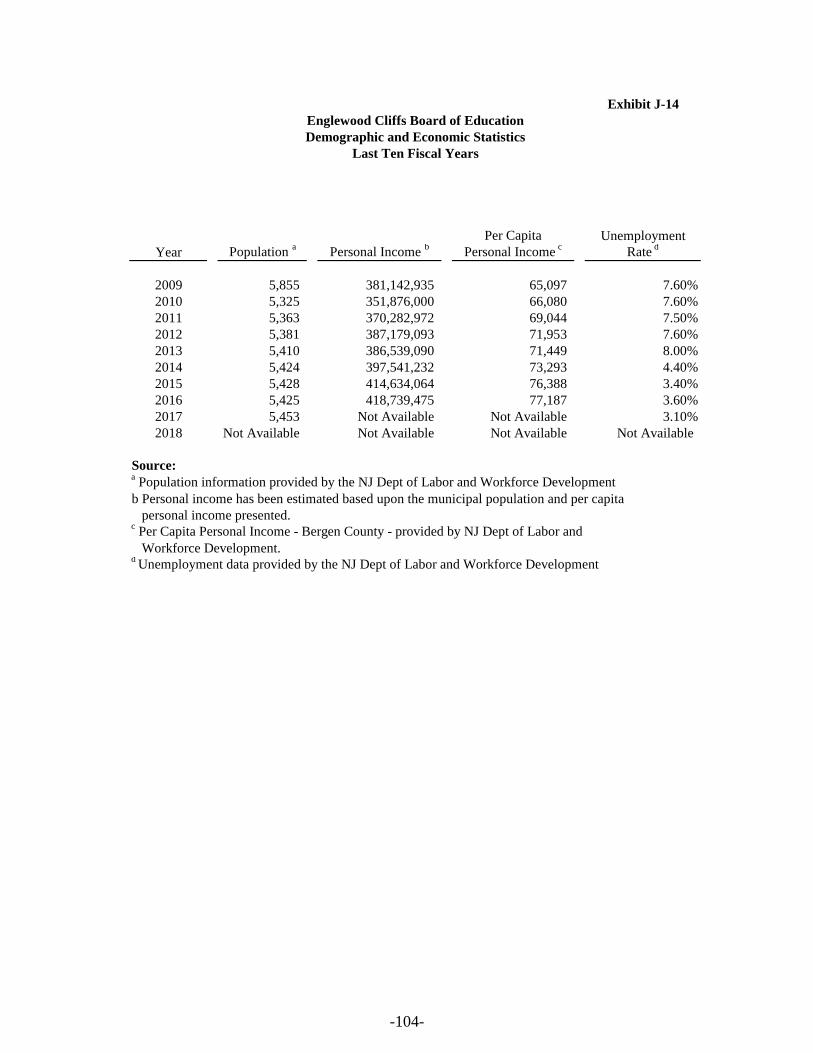
Exhibit J-14
Per Capita Unemployment
Year Population a
Personal Income b
Personal Income c
Rate d
2009 5,855 381,142,935 65,097 7.60%
2010 5,325 351,876,000 66,080 7.60%
2011 5,363 370,282,972 69,044 7.50%
2012 5,381 387,179,093 71,953 7.60%
2013 5,410 386,539,090 71,449 8.00%
2014 5,424 397,541,232 73,293 4.40%
2015 5,428 414,634,064 76,388 3.40%
2016 5,425 418,739,475 77,187 3.60%
2017 5,453 Not Available Not Available 3.10%
2018 Not Available Not Available Not Available Not Available
Source: a Population information provided by the NJ Dept of Labor and Workforce Development
b Personal income has been estimated based upon the municipal population and per capita
personal income presented.c Per Capita Personal Income - Bergen County - provided by NJ Dept of Labor and
Workforce Development.d
Unemployment data provided by the NJ Dept of Labor and Workforce Development
Englewood Cliffs Board of Education
Demographic and Economic Statistics
Last Ten Fiscal Years
-104-

Ex
hib
it J
-15
Em
plo
yer
Em
plo
yee
s
Ra
nk
[Op
tio
na
l]
Perc
enta
ge
of
To
tal
Mu
nic
ipa
l
Em
plo
ym
ent
Em
plo
yee
s
Ra
nk
[Op
tio
na
l]
Perc
enta
ge
of
To
tal
Mu
nic
ipa
l
Em
plo
ym
ent
TH
E N
EW
JE
RS
EY
DE
PA
RT
ME
NT
OF
LA
BO
R A
ND
AR
EA
EM
PL
OY
ER
S R
EF
US
ED
TO
RE
LE
AS
E I
NF
OR
MA
TIO
N N
EE
DE
D
TO
CO
MP
LE
TE
TH
IS S
CH
ED
UL
E D
UE
TO
PR
IVA
CY
CO
NC
ER
NS
.
En
gle
wo
od
Cli
ffs
Bo
ard
of
Ed
uca
tio
n
Prin
cip
al
Em
plo
yer
s,
Cu
rren
t Y
ear
an
d T
en
Yea
rs A
go
20
18
20
09
-105-
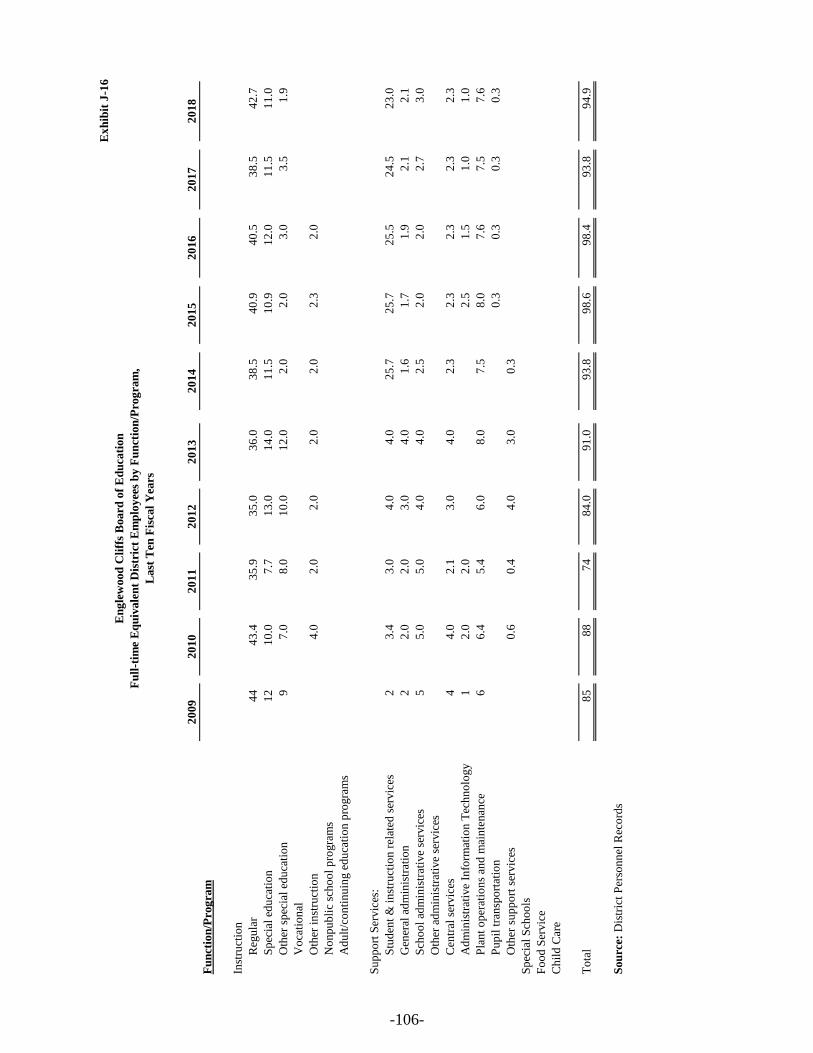
Ex
hib
it J
-16
20
09
20
10
20
11
20
12
20
13
20
14
20
15
20
16
20
17
20
18
Fu
nct
ion
/Pro
gra
m
Inst
ruct
ion
Reg
ula
r4
4
4
3.4
35
.9
3
5.0
36
.0
3
8.5
40
.9
4
0.5
3
8.5
4
2.7
Sp
ecia
l ed
uca
tio
n1
2
1
0.0
7.7
1
3.0
14
.0
1
1.5
10
.9
1
2.0
1
1.5
1
1.0
Oth
er s
pec
ial
edu
cati
on
9
7.0
8
.0
10
.0
1
2.0
2.0
2
.0
3.0
3.5
1.9
Vo
cati
on
al
Oth
er i
nst
ruct
ion
4.0
2
.0
2.0
2
.0
2.0
2
.3
2.0
No
np
ub
lic
sch
oo
l p
rogra
ms
Ad
ult
/co
nti
nu
ing e
du
cati
on
pro
gra
ms
Su
pp
ort
Ser
vic
es:
Stu
den
t &
in
stru
ctio
n r
elat
ed s
ervic
es2
3
.4
3.0
4
.0
4.0
2
5.7
25
.7
2
5.5
2
4.5
2
3.0
Gen
eral
ad
min
istr
atio
n2
2
.0
2.0
3
.0
4.0
1
.6
1.7
1
.9
2
.1
2
.1
Sch
oo
l ad
min
istr
ativ
e se
rvic
es5
5
.0
5.0
4
.0
4.0
2
.5
2.0
2
.0
2
.7
3
.0
Oth
er a
dm
inis
trat
ive
serv
ices
Cen
tral
ser
vic
es4
4
.0
2.1
3
.0
4.0
2
.3
2.3
2
.3
2
.3
2
.3
Ad
min
istr
ativ
e In
form
atio
n T
ech
no
logy
1
2.0
2
.0
2.5
1
.5
1
.0
1
.0
Pla
nt
op
erat
ion
s an
d m
ain
ten
ance
6
6.4
5
.4
6.0
8
.0
7.5
8
.0
7.6
7.5
7.6
Pu
pil
tra
nsp
ort
atio
n0
.3
0.3
0.3
0.3
Oth
er s
up
po
rt s
ervic
es0
.6
0.4
4
.0
3.0
0
.3
Sp
ecia
l S
cho
ols
Fo
od
Ser
vic
e
Ch
ild
Car
e
To
tal
85
88
74
84
.0
9
1.0
93
.8
9
8.6
98
.4
93
.8
94
.9
Sou
rce:
Dis
tric
t P
erso
nn
el R
eco
rds
En
gle
wood
Cli
ffs
Board
of
Ed
uca
tion
Fu
ll-t
ime
Eq
uiv
ale
nt
Dis
tric
t E
mp
loy
ees
by
Fu
nct
ion
/Pro
gra
m,
Last
Ten
Fis
cal
Yea
rs
-106-
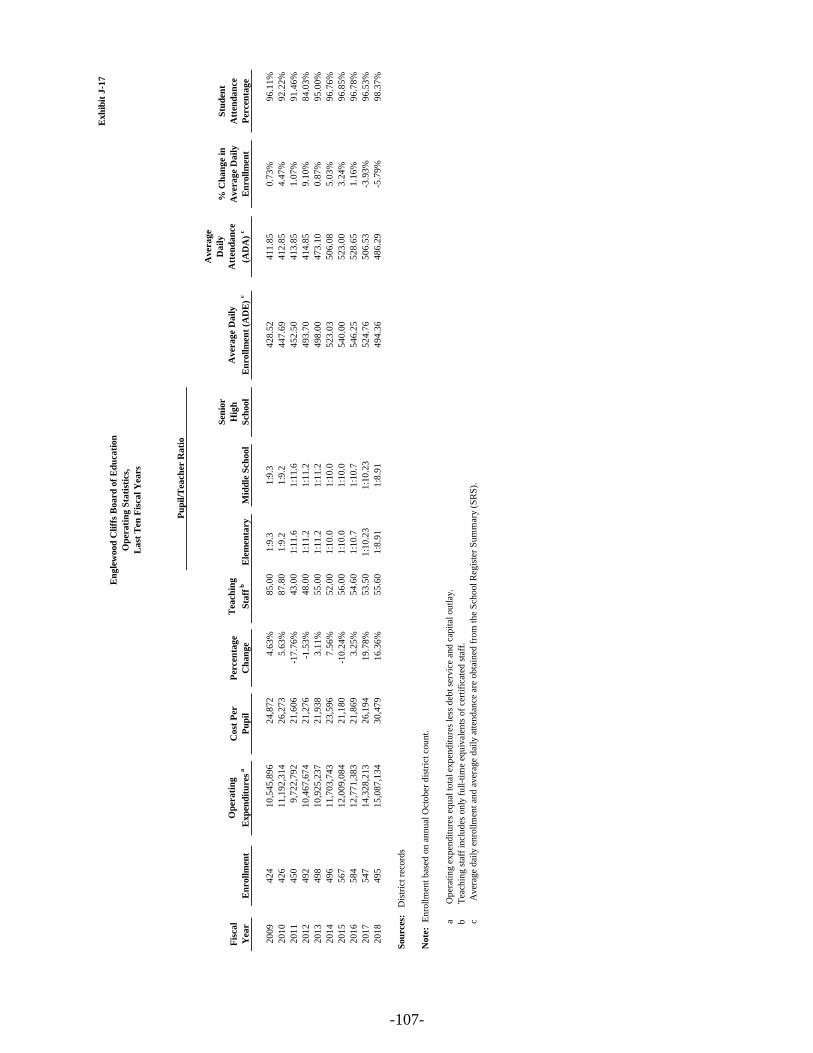
Exh
ibit
J-1
7
Fis
cal
Yea
rE
nro
llm
ent
Op
era
tin
g
Exp
end
itu
res a
Cost
Per
Pu
pil
Per
cen
tag
e
Ch
an
ge
Tea
chin
g
Sta
ff b
Ele
men
tary
Mid
dle
Sch
ool
Sen
ior
Hig
h
Sch
ool
Aver
ag
e D
ail
y
En
roll
men
t (A
DE
) c
Aver
ag
e
Da
ily
Att
end
an
ce
(AD
A)
c
% C
ha
ng
e in
Aver
ag
e D
ail
y
En
roll
men
t
Stu
den
t
Att
end
an
ce
Per
cen
tag
e
20
09
42
4
1
0,5
45
,89
6
2
4,8
72
4
.63
%
85
.00
1
:9.3
1:9
.34
28
.52
41
1.8
5
0.7
3%
96
.11
%
20
10
42
6
1
1,1
92
,31
4
2
6,2
73
5
.63
%
87
.80
1
:9.2
1:9
.24
47
.69
41
2.8
5
4.4
7%
92
.22
%
20
11
45
0
9,7
22
,79
2
2
1,6
06
-1
7.7
6%
4
3.0
0
1:1
1.6
1:1
1.6
45
2.5
04
13
.85
1
.07
%9
1.4
6%
20
12
49
2
1
0,4
67
,67
4
2
1,2
76
-1
.53
%
48
.00
1
:11
.21
:11
.24
93
.70
41
4.8
5
9.1
0%
84
.03
%
20
13
49
8
1
0,9
25
,23
7
2
1,9
38
3
.11
%
55
.00
1
:11
.21
:11
.24
98
.00
47
3.1
0
0.8
7%
95
.00
%
20
14
49
6
1
1,7
03
,74
3
2
3,5
96
7
.56
%
52
.00
1
:10
.01
:10
.05
23
.03
50
6.0
8
5.0
3%
96
.76
%
20
15
56
7
1
2,0
09
,08
4
2
1,1
80
-1
0.2
4%
5
6.0
0
1:1
0.0
1:1
0.0
54
0.0
05
23
.00
3
.24
%9
6.8
5%
20
16
58
4
1
2,7
71
,38
3
2
1,8
69
3
.25
%
54
.60
1
:10
.71
:10
.75
46
.25
52
8.6
5
1.1
6%
96
.78
%
20
17
54
7
1
4,3
28
,21
3
2
6,1
94
1
9.7
8%
5
3.5
0
1:1
0.2
31
:10
.23
52
4.7
65
06
.53
-3
.93
%9
6.5
3%
20
18
49
5
1
5,0
87
,13
4
3
0,4
79
1
6.3
6%
5
5.6
0
1:8
.91
1:8
.91
49
4.3
64
86
.29
-5
.79
%9
8.3
7%
Sou
rces
:
Dis
tric
t re
cord
s
Note
: E
nro
llm
ent
bas
ed o
n a
nn
ual
Oct
ob
er d
istr
ict
cou
nt.
aO
per
atin
g e
xp
end
itu
res
equ
al t
ota
l ex
pen
dit
ure
s le
ss d
ebt
serv
ice
and
cap
ital
ou
tlay
.
bT
each
ing s
taff
in
clu
des
on
ly f
ull
-tim
e eq
uiv
alen
ts o
f ce
rtif
icat
ed s
taff
.
cA
ver
age
dai
ly e
nro
llm
ent
and
aver
age
dai
ly a
tten
dan
ce a
re o
bta
ined
fro
m t
he
Sch
ool
Reg
iste
r S
um
mar
y (
SR
S).
En
gle
wood
Cli
ffs
Boa
rd o
f E
du
cati
on
Op
era
tin
g S
tati
stic
s,
La
st T
en F
isca
l Y
ears
Pu
pil
/Tea
cher
Ra
tio
-107-
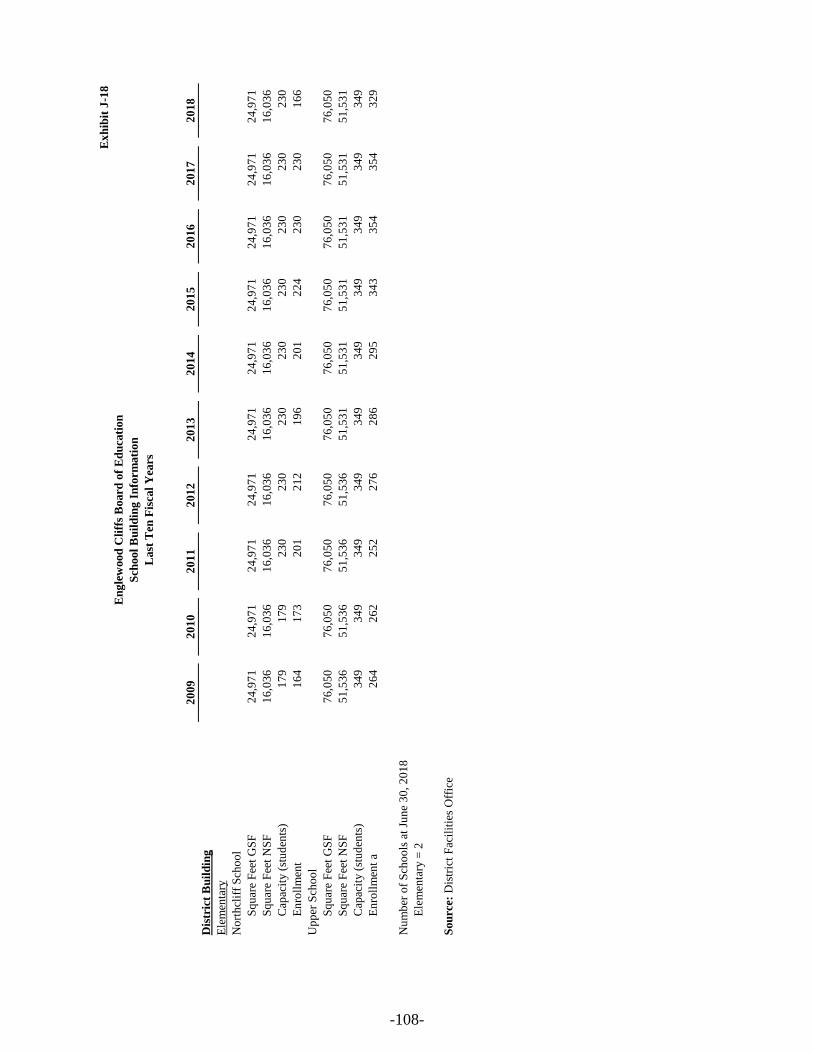
Ex
hib
it J
-18
20
09
20
10
20
11
20
12
20
13
20
14
20
15
20
16
20
17
20
18
Dis
tric
t B
uil
din
g
No
rth
clif
f S
cho
ol
Sq
uar
e F
eet
GS
F2
4,9
71
2
4,9
71
24
,97
1
2
4,9
71
24
,97
1
2
4,9
71
24
,97
1
2
4,9
71
24
,97
1
2
4,9
71
Sq
uar
e F
eet
NS
F1
6,0
36
1
6,0
36
16
,03
6
1
6,0
36
16
,03
6
1
6,0
36
16
,03
6
1
6,0
36
16
,03
6
1
6,0
36
Cap
acit
y (
stu
den
ts)
17
9
17
9
23
0
23
0
23
0
23
0
23
0
2
30
23
0
2
30
En
roll
men
t1
64
1
73
2
01
2
12
1
96
2
01
2
24
23
0
2
30
16
6
Up
per
Sch
oo
l
Sq
uar
e F
eet
GS
F7
6,0
50
7
6,0
50
76
,05
0
7
6,0
50
76
,05
0
7
6,0
50
76
,05
0
7
6,0
50
76
,05
0
7
6,0
50
Sq
uar
e F
eet
NS
F5
1,5
36
5
1,5
36
51
,53
6
5
1,5
36
51
,53
1
5
1,5
31
51
,53
1
5
1,5
31
51
,53
1
5
1,5
31
Cap
acit
y (
stu
den
ts)
34
9
34
9
34
9
34
9
34
9
34
9
34
9
3
49
34
9
3
49
En
roll
men
t a
26
4
26
2
25
2
27
6
28
6
29
5
34
3
3
54
35
4
3
29
Nu
mb
er o
f S
cho
ols
at
Jun
e 3
0,
20
18
Ele
men
tary
= 2
Sou
rce:
Dis
tric
t F
acil
itie
s O
ffic
e
En
gle
wood
Cli
ffs
Board
of
Ed
uca
tion
Sch
ool
Bu
ild
ing
In
form
ati
on
Last
Ten
Fis
cal
Yea
rs
Ele
men
tary
-108-

Exh
ibit
J-1
9
Sch
ool
Fac
ilit
ies
Pro
ject
. N
o.'s
2018
2017
2016
2015
2014
20
13
20
12
20
11
20
10
20
09
Nort
hcl
iff
Sch
ool
N/A
59,9
64
59,7
38
15,3
24
14,0
54
14,8
90
10
,47
3
7
,66
9
2
3,7
02
4
8,9
42
$
2
2,5
49
$
Upper
Sch
ool
N/A
104,9
81
79,7
87
61,7
93
48,2
37
48,3
57
38
,71
7
1
08
,76
8
4
7,0
51
7
6,3
05
4
6,7
46
Gra
nd T
ota
l164,9
45
$
139,5
25
$
77,1
17
$
62,2
91
$
63,2
47
$
49
,19
0$
11
6,4
37
$
7
0,7
53
$
1
25
,24
7$
69
,29
5$
Sourc
e: D
istr
ict
reco
rds
En
gle
wood
Cli
ffs
Board
of
Ed
uca
tion
Sch
edu
le o
f R
equ
ired
Main
ten
an
ce
Last
Ten
Fis
cal
Yea
rs
UN
DIS
TR
IBU
TE
D E
XP
EN
DIT
UR
ES
- R
EQ
UIR
ED
MA
INT
EN
AN
CE
FO
R S
CH
OO
L F
AC
ILIT
IES
11-0
00-2
61-X
XX
-109-
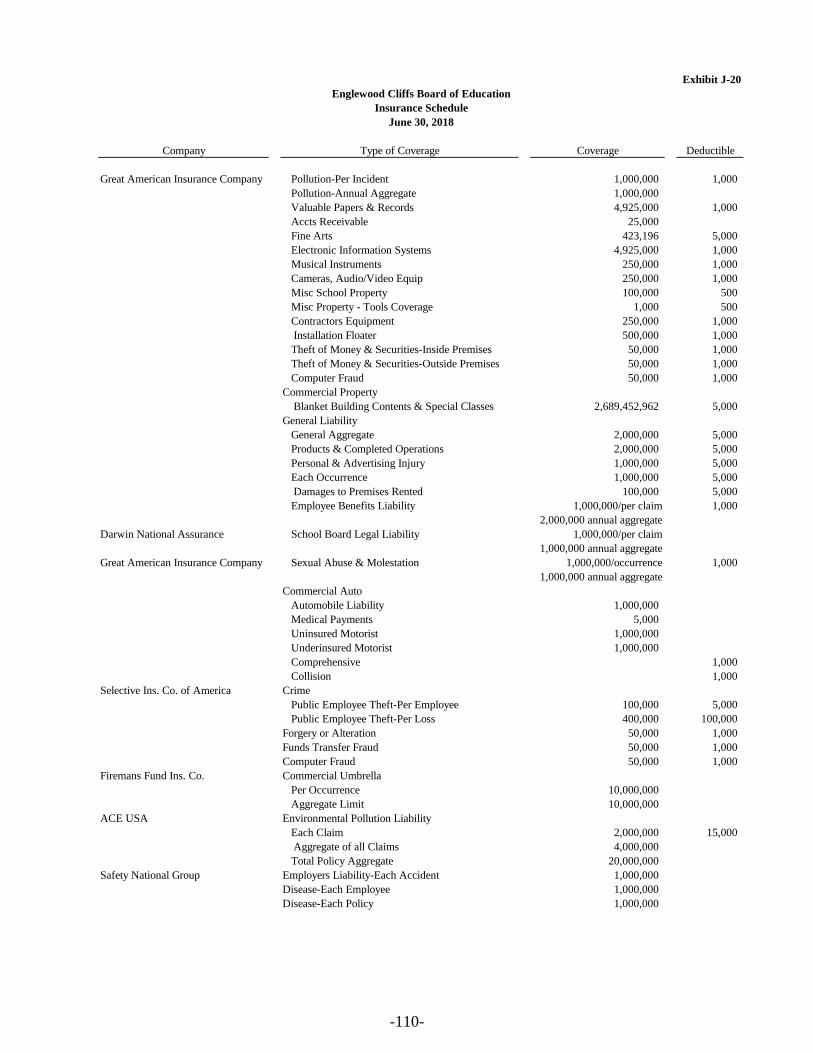
Exhibit J-20
Company Type of Coverage Coverage Deductible
Great American Insurance Company Pollution-Per Incident 1,000,000 1,000
Pollution-Annual Aggregate 1,000,000
Valuable Papers & Records 4,925,000 1,000
Accts Receivable 25,000
Fine Arts 423,196 5,000
Electronic Information Systems 4,925,000 1,000
Musical Instruments 250,000 1,000
Cameras, Audio/Video Equip 250,000 1,000
Misc School Property 100,000 500
Misc Property - Tools Coverage 1,000 500
Contractors Equipment 250,000 1,000
Installation Floater 500,000 1,000
Theft of Money & Securities-Inside Premises 50,000 1,000
Theft of Money & Securities-Outside Premises 50,000 1,000
Computer Fraud 50,000 1,000
Commercial Property
Blanket Building Contents & Special Classes 2,689,452,962 5,000
General Liability
General Aggregate 2,000,000 5,000
Products & Completed Operations 2,000,000 5,000
Personal & Advertising Injury 1,000,000 5,000
Each Occurrence 1,000,000 5,000
Damages to Premises Rented 100,000 5,000
Employee Benefits Liability 1,000,000/per claim 1,000
2,000,000 annual aggregate
Darwin National Assurance School Board Legal Liability 1,000,000/per claim
1,000,000 annual aggregate
Great American Insurance Company Sexual Abuse & Molestation 1,000,000/occurrence 1,000
1,000,000 annual aggregate
Commercial Auto
Automobile Liability 1,000,000
Medical Payments 5,000
Uninsured Motorist 1,000,000
Underinsured Motorist 1,000,000
Comprehensive 1,000
Collision 1,000
Selective Ins. Co. of America Crime
Public Employee Theft-Per Employee 100,000 5,000
Public Employee Theft-Per Loss 400,000 100,000
Forgery or Alteration 50,000 1,000
Funds Transfer Fraud 50,000 1,000
Computer Fraud 50,000 1,000
Firemans Fund Ins. Co. Commercial Umbrella
Per Occurrence 10,000,000
Aggregate Limit 10,000,000
ACE USA Environmental Pollution Liability
Each Claim 2,000,000 15,000
Aggregate of all Claims 4,000,000
Total Policy Aggregate 20,000,000
Safety National Group Employers Liability-Each Accident 1,000,000
Disease-Each Employee 1,000,000
Disease-Each Policy 1,000,000
Englewood Cliffs Board of Education
Insurance Schedule
June 30, 2018
-110-
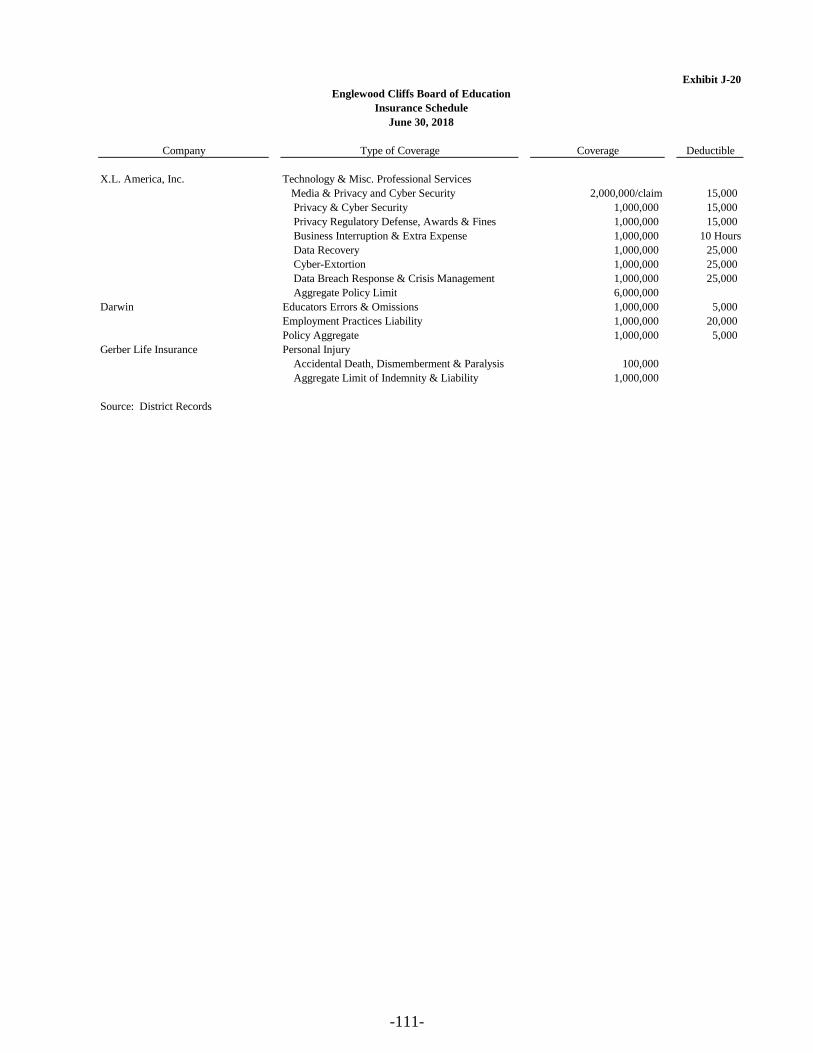
Exhibit J-20
Company Type of Coverage Coverage Deductible
Englewood Cliffs Board of Education
Insurance Schedule
June 30, 2018
X.L. America, Inc. Technology & Misc. Professional Services
Media & Privacy and Cyber Security 2,000,000/claim 15,000
Privacy & Cyber Security 1,000,000 15,000
Privacy Regulatory Defense, Awards & Fines 1,000,000 15,000
Business Interruption & Extra Expense 1,000,000 10 Hours
Data Recovery 1,000,000 25,000
Cyber-Extortion 1,000,000 25,000
Data Breach Response & Crisis Management 1,000,000 25,000
Aggregate Policy Limit 6,000,000
Darwin Educators Errors & Omissions 1,000,000 5,000
Employment Practices Liability 1,000,000 20,000
Policy Aggregate 1,000,000 5,000
Gerber Life Insurance Personal Injury
Accidental Death, Dismemberment & Paralysis 100,000
Aggregate Limit of Indemnity & Liability 1,000,000
Source: District Records
-111-
SINGLE AUDIT SECTION
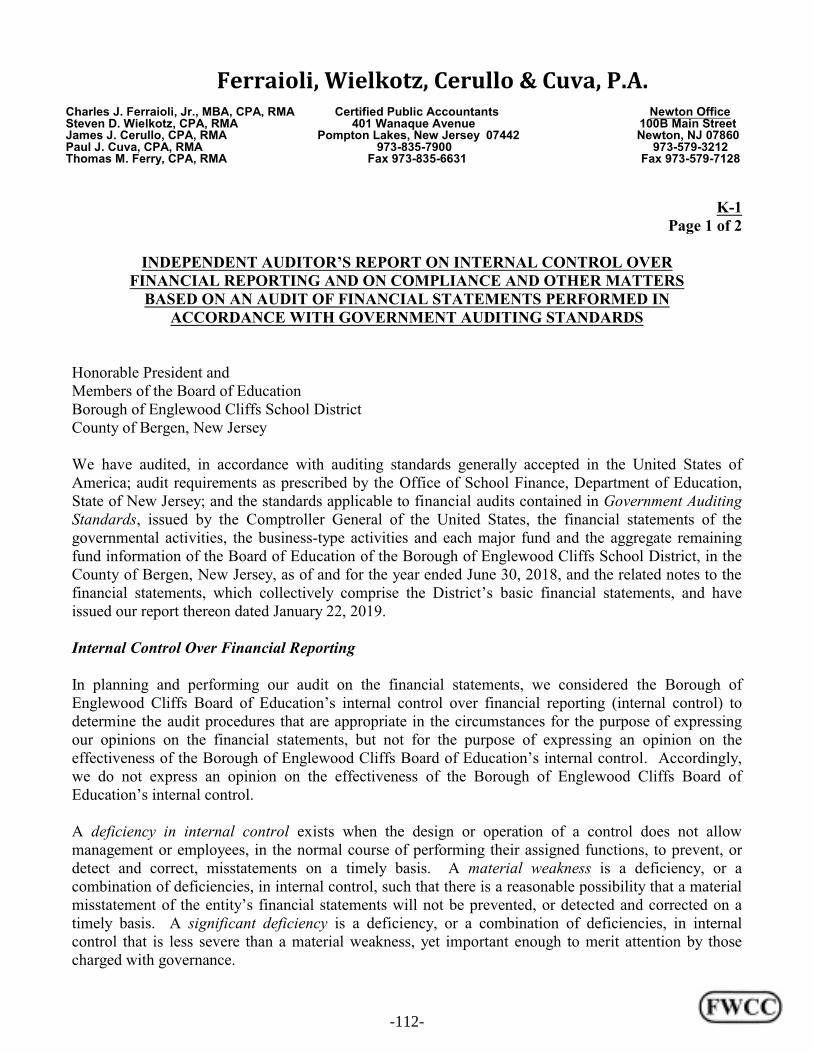
Ferraioli, Wielkotz, Cerullo & Cuva, P.A.Charles J. Ferraioli, Jr., MBA, CPA, RMA Certified Public Accountants Newton Office Steven D. Wielkotz, CPA, RMA 401 Wanaque Avenue 100B Main Street James J. Cerullo, CPA, RMA Pompton Lakes, New Jersey 07442 Newton, NJ 07860Paul J. Cuva, CPA, RMA 973-835-7900 973-579-3212Thomas M. Ferry, CPA, RMA Fax 973-835-6631 Fax 973-579-7128
K-1 Page 1 of 2
INDEPENDENT AUDITOR’S REPORT ON INTERNAL CONTROL OVERFINANCIAL REPORTING AND ON COMPLIANCE AND OTHER MATTERS
BASED ON AN AUDIT OF FINANCIAL STATEMENTS PERFORMED INACCORDANCE WITH GOVERNMENT AUDITING STANDARDS
Honorable President andMembers of the Board of EducationBorough of Englewood Cliffs School DistrictCounty of Bergen, New Jersey
We have audited, in accordance with auditing standards generally accepted in the United States ofAmerica; audit requirements as prescribed by the Office of School Finance, Department of Education,State of New Jersey; and the standards applicable to financial audits contained in Government AuditingStandards, issued by the Comptroller General of the United States, the financial statements of thegovernmental activities, the business-type activities and each major fund and the aggregate remainingfund information of the Board of Education of the Borough of Englewood Cliffs School District, in theCounty of Bergen, New Jersey, as of and for the year ended June 30, 2018, and the related notes to thefinancial statements, which collectively comprise the District’s basic financial statements, and haveissued our report thereon dated January 22, 2019.
Internal Control Over Financial Reporting
In planning and performing our audit on the financial statements, we considered the Borough ofEnglewood Cliffs Board of Education’s internal control over financial reporting (internal control) todetermine the audit procedures that are appropriate in the circumstances for the purpose of expressingour opinions on the financial statements, but not for the purpose of expressing an opinion on theeffectiveness of the Borough of Englewood Cliffs Board of Education’s internal control. Accordingly,we do not express an opinion on the effectiveness of the Borough of Englewood Cliffs Board ofEducation’s internal control.
A deficiency in internal control exists when the design or operation of a control does not allowmanagement or employees, in the normal course of performing their assigned functions, to prevent, ordetect and correct, misstatements on a timely basis. A material weakness is a deficiency, or acombination of deficiencies, in internal control, such that there is a reasonable possibility that a materialmisstatement of the entity’s financial statements will not be prevented, or detected and corrected on atimely basis. A significant deficiency is a deficiency, or a combination of deficiencies, in internalcontrol that is less severe than a material weakness, yet important enough to merit attention by thosecharged with governance.
-112-
Honorable President and K-1Members of the Board of Education Page 2 of 2
Our consideration of internal control was for the limited purpose described in the first paragraph of thissection and was not designed to identify all deficiencies in internal control that might be materialweaknesses or significant deficiencies. Given these limitations, during our audit we did not identify anydeficiencies in internal control that we consider to be material weaknesses. However, materialweaknesses may exist that have not been identified.
Compliance and Other Matters
As part of obtaining reasonable assurance about whether the Borough of Englewood Cliffs Board ofEducation’s financial statements are free of material misstatement, we performed tests of its compliancewith certain provisions of laws, regulations, contracts and grant agreements, noncompliance with whichcould have a direct and material effect on the determination of financial statement amounts. However,providing an opinion on compliance with those provisions was not an objective of our audit and,accordingly, we do not express such an opinion. The results of our tests disclosed no instances ofnoncompliance or other matters that are required to be reported under Government Auditing Standardsor the audit requirements as prescribed by the Office of School Finance, Department of Education, Stateof New Jersey.
We noted certain matters that were required to be reported to the Board of Education of the Borough ofEnglewood Cliffs School District in the separate Auditors’ Management Report on AdministrativeFindings - Financial, Compliance and Performance dated January 22, 2019.
Purpose of this Report
The purpose of this report is solely to describe the scope of our testing of internal control andcompliance and the results of that testing, and not to provide an opinion on the effectiveness of theentity’s internal control or on compliance. This report is an integral part of an audit performed inaccordance with Government Auditing Standards in considering the entity’s internal control andcompliance. Accordingly, this communication is not suitable for any other purpose.
Steven D. Wielkotz, C.P.A.Licensed Public School AccountantNo. 816
FERRAIOLI, WIELKOTZ, CERULLO & CUVA, P.A.Certified Public AccountantsPompton Lakes, New Jersey
January 22, 2019
Ferraioli, Wielkotz, Cerullo & Cuva,P.A.
Steven D. Wielkotz
-113-
Ferraioli, Wielkotz, Cerullo & Cuva, P.A.Charles J. Ferraioli, Jr., MBA, CPA, RMA Certified Public Accountants Newton Office Steven D. Wielkotz, CPA, RMA 401 Wanaque Avenue 100B Main Street James J. Cerullo, CPA, RMA Pompton Lakes, New Jersey 07442 Newton, NJ 07860Paul J. Cuva, CPA, RMA 973-835-7900 973-579-3212Thomas M. Ferry, CPA, RMA Fax 973-835-6631 Fax 973-579-7128
K-2 Page 1 of 3
INDEPENDENT AUDITOR’S REPORT ON COMPLIANCE FOR EACH MAJORPROGRAM AND REPORT ON INTERNAL CONTROL OVER
COMPLIANCE AS REQUIRED BY THE UNIFORM GUIDANCEAND N.J. OMB CIRCULAR 15-08
Honorable President andMembers of the Board of EducationBorough of Englewood Cliffs School DistrictCounty of Bergen, New Jersey
Report on Compliance for Each Major Federal and State Program
We have audited the Board of Education of the Borough of Englewood Cliffs School District in theCounty of Bergen, New Jersey, compliance with the types of compliance requirements described in theOMB Compliance Supplements and the New Jersey State Aid/Grant Compliance Supplement that couldhave a direct and material effect on each of the Borough of Englewood Cliffs Board of Education’smajor federal and state programs for the year ended June 30, 2018. The Borough of Englewood CliffsBoard of Education’s major federal and state programs are identified in the summary of auditor’s resultssection of the accompanying schedule of findings and questioned costs.
Management’s Responsibility
Management is responsible for compliance with the requirements of laws, regulations, contracts, andgrants applicable to its federal and state programs.
Auditor’s Responsibility
Our responsibility is to express opinions on compliance for each of the Borough of Englewood CliffsBoard of Education’s major federal and state programs based on our audit of the types of compliancerequirements referred to above. We conducted our audit of compliance in accordance with auditingstandards generally accepted in the United States of America; the standards applicable to financialaudits contained in Government Auditing Standards, issued by the Comptroller General of the UnitedStates; and Title 2 U.S. Code of Federal Regulations Part 200, Uniform Administrative Requirements,Cost Principles, and Audit Requirements for Federal Awards (Uniform Guidance) and N.J. OMBCircular 15-08. Those standards, the Uniform Guidance and N.J. OMB Circular 15-08 require that we
-114-

Honorable President and K-2Members of the Board of Education Page 2 of 3
plan and perform the audit to obtain reasonable assurance about whether noncompliance with the typesof compliance requirements referred to above that could have a direct and material effect on a majorfederal and state program occurred. An audit includes examining, on a test basis, evidence about theBorough of Englewood Cliffs Board of Education’s compliance with those requirements and performingsuch other procedures as we considered necessary in the circumstances.
We believe that our provides a reasonable basis for our opinion on compliance for each major federaland state program. However, our audit does not provide a legal determination of the Borough ofEnglewood Cliffs Board of Education’s compliance.
Opinion on Each Major Federal and State Program
In our opinion, the Borough of Englewood Cliffs Board of Education complied, in all material respects,with the types of compliance requirements referred to above that could have a direct and material effecton each of its major federal and state programs for the year ended June 30, 2018.
Report on Internal Control Over Compliance
Management of the Borough of Englewood Cliffs Board of Education is responsible for establishing andmaintaining effective internal control over compliance with the types of compliance requirementsreferred to above. In planning and performing our audit of compliance, we considered the Borough ofEnglewood Cliffs Board of Education’s internal control over compliance with the type of requirementsthat could have a direct and material effect on each major federal and state program to determine theauditing procedures that are appropriate in the circumstances for the purpose of expressing an opinionon compliance for each major federal and state program and to test and report on internal control overcompliance in accordance with the Uniform Guidance and N.J. OMB Circular 15-08, but not for thepurpose of expressing an opinion on the effectiveness of internal control over compliance. Accordingly,we do not express an opinion on the effectiveness of Borough of Englewood Cliffs Board of Education’sinternal control over compliance.
A deficiency in internal control over compliance exists when the design or operation of a control overcompliance does not allow management or employees, in the normal course of performing theirassigned functions, to prevent, or detect and correct, noncompliance with a type of compliancerequirement of a federal and state program on a timely basis. A material weakness in internal controlover compliance is a deficiency, or combination of deficiencies, in internal control over compliance,such that there is a reasonable possibility that material noncompliance with a type of compliancerequirement of a federal and state program will not be prevented, or detected and corrected, on a timelybasis. A significant deficiency in internal control over compliance is a deficiency, or a combination ofdeficiencies, in internal control over compliance with a type of compliance requirement of a federal andstate program that is less severe than a material weakness in internal control over compliance, yetimportant enough to merit attention by those charged with governance.
-115-
Honorable President and K-2Members of the Board of Education Page 3 of 3
Our consideration of internal control over compliance was for the limited purpose described in the firstparagraph of this section and was not designed to identify all deficiencies in internal control overcompliance that might be material weaknesses or significant deficiencies. We did not identify anydeficiencies in internal control over compliance that we consider to be material weaknesses orsignificant deficiencies.
The purpose of this report on internal control over compliance is solely to describe the scope of ourtesting of internal control over compliance and the results of that testing based on the requirements ofthe Uniform Guidance and N.J. OMB Circular 15-08. Accordingly, this report is not suitable for anyother purpose.
Steven D. Wielkotz, C.P.A.Licensed Public School AccountantNo. 816
FERRAIOLI, WIELKOTZ, CERULLO & CUVA, P.A.Certified Public AccountantsPompton Lakes, New Jersey
January 22, 2019
Steven D. Wielkotz
Ferraioli, Wielkotz, Cerullo & Cuva,P.A.
-116-
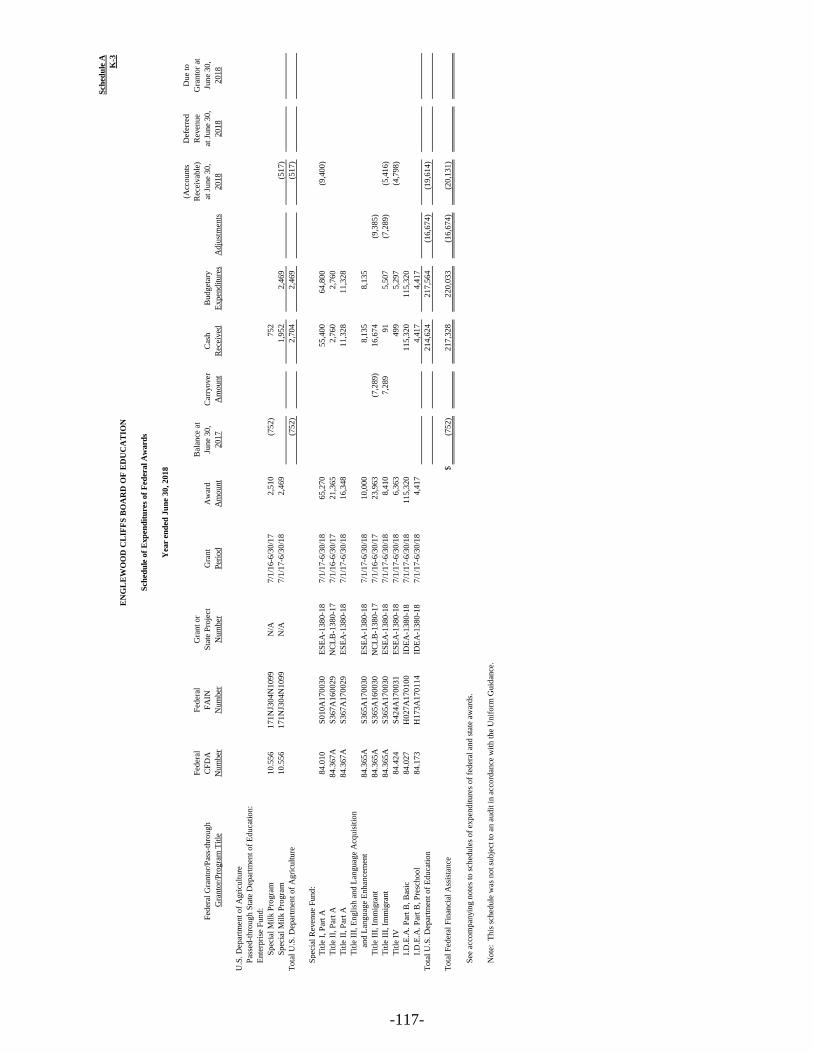
Sch
edu
le A
K-3
(Acc
ounts
Def
erre
dD
ue
to
Fed
eral
Fed
eral
Gra
nt
or
Bal
ance
at
Rec
eivab
le)
Rev
enue
Gra
nto
r at
Fed
eral
Gra
nto
r/P
ass-
thro
ugh
CF
DA
FA
INS
tate
Pro
ject
Gra
nt
Aw
ard
June
30,
Car
ryover
Cas
hB
udget
ary
at J
une
30,
at J
une
30,
June
30,
Gra
nto
r/P
rogra
m T
itle
Num
ber
Num
ber
Num
ber
Per
iod
Am
ount
2017
Am
ount
Rec
eived
Expen
dit
ure
sA
dju
stm
ents
2018
2018
2018
U.S
. D
epar
tmen
t o
f A
gri
cult
ure
Pas
sed
-th
rou
gh
Sta
te D
epar
tmen
t of
Educa
tion:
En
terp
rise
Fu
nd
:
Sp
ecia
l M
ilk
Pro
gra
m10.5
56
171N
J304N
1099
N/A
7/1
/16-6
/30/1
72,5
10
(752)
752
Sp
ecia
l M
ilk
Pro
gra
m10.5
56
171N
J304N
1099
N/A
7/1
/17-6
/30/1
82,4
69
1,9
52
2,4
69
(517)
Tota
l U
.S. D
epar
tmen
t o
f A
gri
cult
ure
(752)
2,7
04
2,4
69
(517)
Sp
ecia
l R
even
ue
Fu
nd
:
Tit
le I
, P
art
A84.0
10
S010
A170030
ES
EA
-1380-1
87/1
/17-6
/30/1
865,2
70
55,4
00
64,8
00
(9,4
00)
Tit
le I
I, P
art
A84.3
67A
S367
A160029
NC
LB
-1380-1
77/1
/16-6
/30/1
721,3
65
2,7
60
2,7
60
Tit
le I
I, P
art
A84.3
67A
S367
A170029
ES
EA
-1380-1
87/1
/17-6
/30/1
816,3
48
11,3
28
11,3
28
Tit
le I
II, E
ng
lish
an
d L
anguag
e A
cquis
itio
n
and
Lan
gu
age
En
han
cem
ent
84.3
65A
S365
A170030
ES
EA
-1380-1
87/1
/17-6
/30/1
810,0
00
8,1
35
8,1
35
Tit
le I
II, Im
mig
ran
t84.3
65A
S365
A160030
NC
LB
-1380-1
77/1
/16-6
/30/1
723,9
63
(7,2
89)
16,6
74
(9,3
85)
Tit
le I
II, Im
mig
ran
t84.3
65A
S365
A170030
ES
EA
-1380-1
87/1
/17-6
/30/1
88,4
10
7,2
89
91
5,5
07
(7,2
89)
(5,4
16)
Tit
le I
V84.4
24
S424
A170031
ES
EA
-1380-1
87/1
/17-6
/30/1
86,3
63
499
5,2
97
(4,7
98)
I.D
.E.A
. P
art
B, B
asic
84.0
27
H02
7A
170100
IDE
A-1
380-1
87/1
/17-6
/30/1
8115,3
20
115,3
20
115,3
20
I.D
.E.A
. P
art
B, P
resc
hool
84.1
73
H17
3A
170114
IDE
A-1
380-1
87/1
/17-6
/30/1
84,4
17
4,4
17
4,4
17
Tota
l U
.S. D
epar
tmen
t o
f E
duca
tion
214,6
24
217,5
64
(16,6
74)
(19,6
14)
Tota
l F
eder
al F
inan
cial
Ass
ista
nce
$(7
52)
217,3
28
220,0
33
(16,6
74)
(20,1
31)
See
acc
om
pan
yin
g n
ote
s to
sch
edule
s of
expen
dit
ure
s of
feder
al a
nd s
tate
aw
ards.
No
te:
Th
is s
ched
ule
was
not
subje
ct t
o a
n a
udit
in a
ccord
ance
wit
h t
he
Unif
orm
Guid
ance
.
EN
GL
EW
OO
D C
LIF
FS
BO
AR
D O
F E
DU
CA
TIO
N
Sch
edu
le o
f E
xp
end
itu
res
of
Fed
eral A
ward
s
Yea
r en
ded
Ju
ne
30, 2018
-117-

EN
GL
EW
OO
D C
LIF
FS
BO
AR
D O
F E
DU
CA
TIO
NS
ched
ule
B
K-4
Sch
edu
le o
f E
xp
end
itu
res
of
Sta
te F
ina
nci
al
Ass
ista
nce
Yea
r en
ded
Ju
ne
30
, 2
01
8
Def
erre
d
R
epay
men
t
Gra
nt
or
Sta
teP
rogra
m
Rev
enue
Car
ryover
/B
udget
ary
of
Pri
or
Cum
ula
tive
Pro
ject
Gra
nt
or
Aw
ard
(Acc
ounts
Due
to
(Wal
kover
)C
ash
Exp
endit
ure
sY
ears
'(A
ccounts
Def
erre
dD
ue
toB
udget
ary
Tota
l
Sta
te G
ranto
r/P
rogra
m T
itle
Num
ber
sP
erio
dA
mount
Rec
eivab
le)
Gra
nto
rA
mount
Rec
eived
Pas
s th
rough F
unds
Bal
ance
sR
ecei
vab
le)
Rev
enue
Gra
nto
rR
ecei
vab
leE
xp
endit
ure
s
Sta
te D
epar
tmen
t of
Educa
tion:
Gen
era
l F
un
d:
Sp
ecia
l E
duca
tion A
id4
95
-03
4-5
12
0-0
89
7/1
/17
-6/3
0/1
8$
26
3,9
65
24
4,4
28
26
3,9
65
*(1
9,5
37
)2
63
,96
5
Tra
nsp
ort
atio
n A
id4
95
-03
4-5
12
0-0
14
7/1
/17
-6/3
0/1
84
2,8
18
39
,64
94
2,8
18
*(3
,16
9)
42
,81
8
Sec
uri
ty A
id4
95
-03
4-5
12
0-0
84
7/1
/17
-6/3
0/1
88
,96
88
,30
48
,96
8*
(66
4)
8,9
68
Per
Pup
il G
row
th A
id4
95
-03
4-5
12
0-0
97
7/1
/17
-6/3
0/1
85
,78
05
,35
25
,78
0*
(42
8)
5,7
80
PA
RC
C R
eadin
ess
Aid
49
5-0
34
-51
20
-09
87
/1/1
7-6
/30
/18
5,7
80
5,3
52
5,7
80
*(4
28
)5
,78
0
Pro
fess
ional
Lea
rnin
g C
om
munit
y A
id4
95
-03
4-5
12
0-1
01
7/1
/17
-6/3
0/1
85
,84
05
,40
85
,84
0*
(43
2)
5,8
40
Rei
mb
urs
ed N
on-P
ub
lic
Tra
nsp
ort
atio
n A
id4
95
-03
4-5
12
0-0
14
7/1
/16
-6/3
0/1
71
6,7
04
(16
,70
4)
16
,70
4*
16
,70
4
Rei
mb
urs
ed N
on-P
ub
lic
Tra
nsp
ort
atio
n A
id4
95
-03
4-5
12
0-0
14
7/1
/17
-6/3
0/1
82
9,9
34
29
,93
4(2
9,9
34
)*
29
,93
4
Extr
aord
inar
y A
id4
95
-03
4-5
12
0-0
44
7/1
/16
-6/3
0/1
73
11
,03
4(3
11
,03
4)
31
1,0
34
*3
11
,03
4
Extr
aord
inar
y A
id4
95
-03
4-5
12
0-0
44
7/1
/17
-6/3
0/1
82
55
,98
22
55
,98
2(2
55
,98
2)
*2
54
,99
1
Lea
d T
esti
ng f
or
Sch
ools
Aid
49
5-0
34
-51
20
-10
47
/1/1
7-6
/30
/18
5,2
97
5,2
97
5,2
97
*5
,29
7
TP
AF
Soci
al S
ecuri
ty4
95
-03
4-5
09
4-0
03
7/1
/16
-6/3
0/1
73
19
,30
8(1
5,4
46
)1
5,4
46
*3
19
,30
8
TP
AF
Soci
al S
ecuri
ty4
95
-03
4-5
09
4-0
03
7/1
/17
-6/3
0/1
83
32
,72
53
16
,63
83
32
,72
5(1
6,0
87
)*
33
2,7
25
On-b
ehal
f T
PA
F P
ost
reti
rem
ent
Med
ical
Cont.
49
5-0
34
-50
94
-00
17
/1/1
7-6
/30
/18
44
1,2
61
44
1,2
61
44
1,2
61
*4
41
,26
1
On-b
ehal
f T
PA
F P
ensi
on
49
5-0
34
-50
94
-00
27
/1/1
7-6
/30
/18
66
7,0
09
66
7,0
09
66
7,0
09
*6
67
,00
9
On-b
ehal
f T
PA
F N
CG
I P
rem
ium
49
5-0
34
-50
94
-00
47
/1/1
7-6
/30
/18
16
,18
71
6,1
87
16
,18
7*
16
,18
7
On-b
ehal
f T
PA
F -
LT
DI
49
5-0
34
-50
94
-00
47
/1/1
7-6
/30
/18
99
09
90
99
0*
99
0
Tota
l G
ener
al F
und
(34
3,1
84
)2
,09
9,0
59
2,0
82
,53
6(3
02
,00
3)
*(2
4,6
58
)2
,72
8,5
91
*
Sp
ecia
l R
even
ue
Fu
nd
:*
N.J
. N
onp
ub
lic
Aid
:*
Sec
uri
ty A
id1
00
-03
4-5
12
0-5
09
7/1
/16
-6/3
0/1
75
,10
03
,85
53
,85
5*
2,7
39
Sec
uri
ty A
id1
00
-03
4-5
12
0-5
09
7/1
/17
-6/3
0/1
87
,65
07
,65
07
,65
0*
Tex
tbook A
id1
00
-03
4-5
12
0-0
64
7/1
/16
-6/3
0/1
74
,32
39
9*
4,3
68
Tex
tbook A
id1
00
-03
4-5
12
0-0
64
7/1
/17
-6/3
0/1
84
,60
24
,60
24
,60
2*
Nurs
ing S
ervic
es1
00
-03
4-5
12
0-0
70
7/1
/17
-6/3
0/1
89
,89
49
,89
49
,89
4*
9,8
94
Tec
hnolo
gy
Aid
10
0-0
34
-51
20
-37
37
/1/1
6-6
/30
/17
1,9
50
1,5
82
1,5
82
*3
68
Tec
hnolo
gy
Aid
10
0-0
34
-51
20
-37
37
/1/1
7-6
/30
/18
3,1
08
3,1
08
2,2
65
84
3*
2,2
65
Tota
l S
pec
ial
Rev
enue
Fund
5,4
46
25
,25
41
2,1
59
5,4
46
13
,09
5*
19
,63
4
*
Deb
t S
erv
ice
Fu
nd
:*
Deb
t S
ervic
e A
id T
ype
II4
95
-03
4-5
12
0-0
17
7/1
/17
-6/3
0/1
89
1,6
11
91
,61
19
1,6
11
*9
1,6
11
91
,61
19
1,6
11
*9
1,6
11
*
Tota
l S
tate
Fin
anci
al A
ssis
tance
(34
3,1
84
)5
,44
62
,21
5,9
24
2,1
86
,30
65
,44
6(3
02
,00
3)
13
,09
5*
(24
,65
8)
2,8
39
,83
6
Les
s: O
n-B
ehal
f T
PA
F P
ensi
on S
yste
m C
ontr
ibuti
ons
1,1
25
,44
7
Tota
l fo
r S
tate
Fin
anci
al A
ssis
tance
-Maj
or
Pro
gra
m D
eter
min
atio
n1
,06
0,8
59
See
acc
om
pan
ying n
ote
s to
sch
edule
s of
exp
endit
ure
s fo
r fe
der
al a
nd s
tate
aw
ards.
Ba
lan
ce a
t J
un
e 3
0,
20
17
Ba
lan
ce a
t J
un
e 3
0,
20
18
ME
MO
-118-
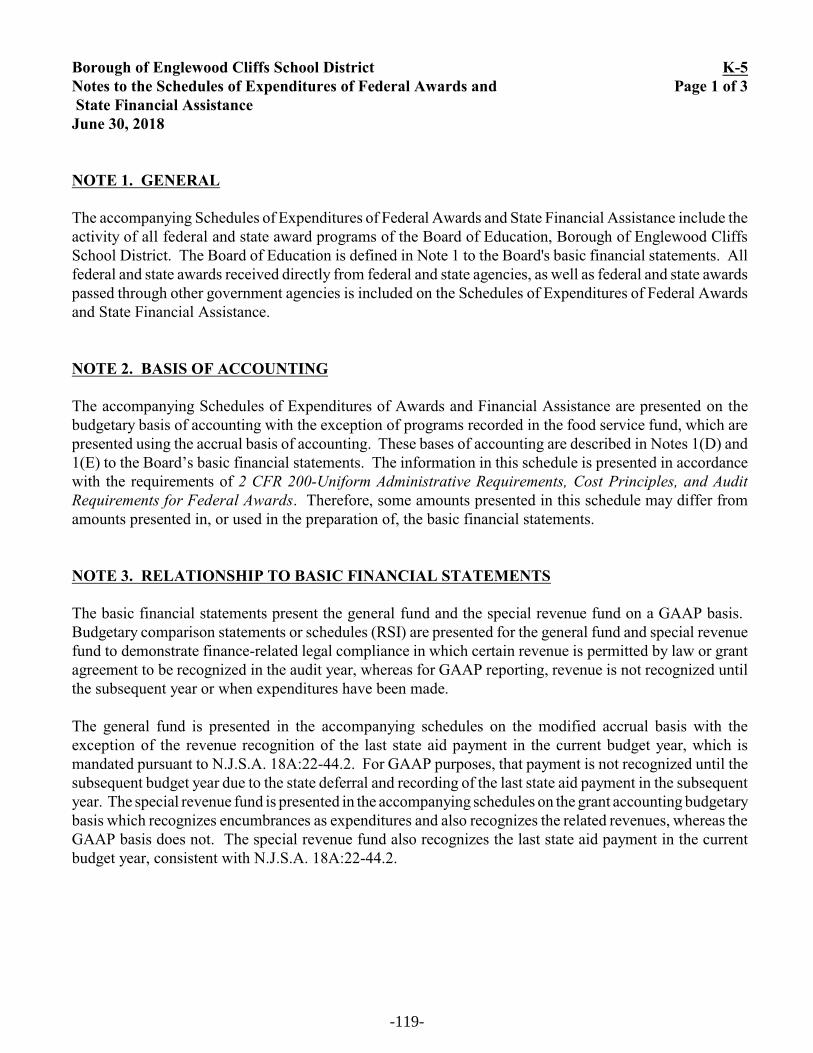
Borough of Englewood Cliffs School District K-5Notes to the Schedules of Expenditures of Federal Awards and Page 1 of 3 State Financial Assistance June 30, 2018
NOTE 1. GENERAL
The accompanying Schedules of Expenditures of Federal Awards and State Financial Assistance include theactivity of all federal and state award programs of the Board of Education, Borough of Englewood CliffsSchool District. The Board of Education is defined in Note 1 to the Board's basic financial statements. Allfederal and state awards received directly from federal and state agencies, as well as federal and state awardspassed through other government agencies is included on the Schedules of Expenditures of Federal Awardsand State Financial Assistance.
NOTE 2. BASIS OF ACCOUNTING
The accompanying Schedules of Expenditures of Awards and Financial Assistance are presented on thebudgetary basis of accounting with the exception of programs recorded in the food service fund, which arepresented using the accrual basis of accounting. These bases of accounting are described in Notes 1(D) and1(E) to the Board’s basic financial statements. The information in this schedule is presented in accordancewith the requirements of 2 CFR 200-Uniform Administrative Requirements, Cost Principles, and AuditRequirements for Federal Awards. Therefore, some amounts presented in this schedule may differ fromamounts presented in, or used in the preparation of, the basic financial statements.
NOTE 3. RELATIONSHIP TO BASIC FINANCIAL STATEMENTS
The basic financial statements present the general fund and the special revenue fund on a GAAP basis. Budgetary comparison statements or schedules (RSI) are presented for the general fund and special revenuefund to demonstrate finance-related legal compliance in which certain revenue is permitted by law or grantagreement to be recognized in the audit year, whereas for GAAP reporting, revenue is not recognized untilthe subsequent year or when expenditures have been made.
The general fund is presented in the accompanying schedules on the modified accrual basis with theexception of the revenue recognition of the last state aid payment in the current budget year, which ismandated pursuant to N.J.S.A. 18A:22-44.2. For GAAP purposes, that payment is not recognized until thesubsequent budget year due to the state deferral and recording of the last state aid payment in the subsequentyear. The special revenue fund is presented in the accompanying schedules on the grant accounting budgetarybasis which recognizes encumbrances as expenditures and also recognizes the related revenues, whereas theGAAP basis does not. The special revenue fund also recognizes the last state aid payment in the currentbudget year, consistent with N.J.S.A. 18A:22-44.2.
-119-
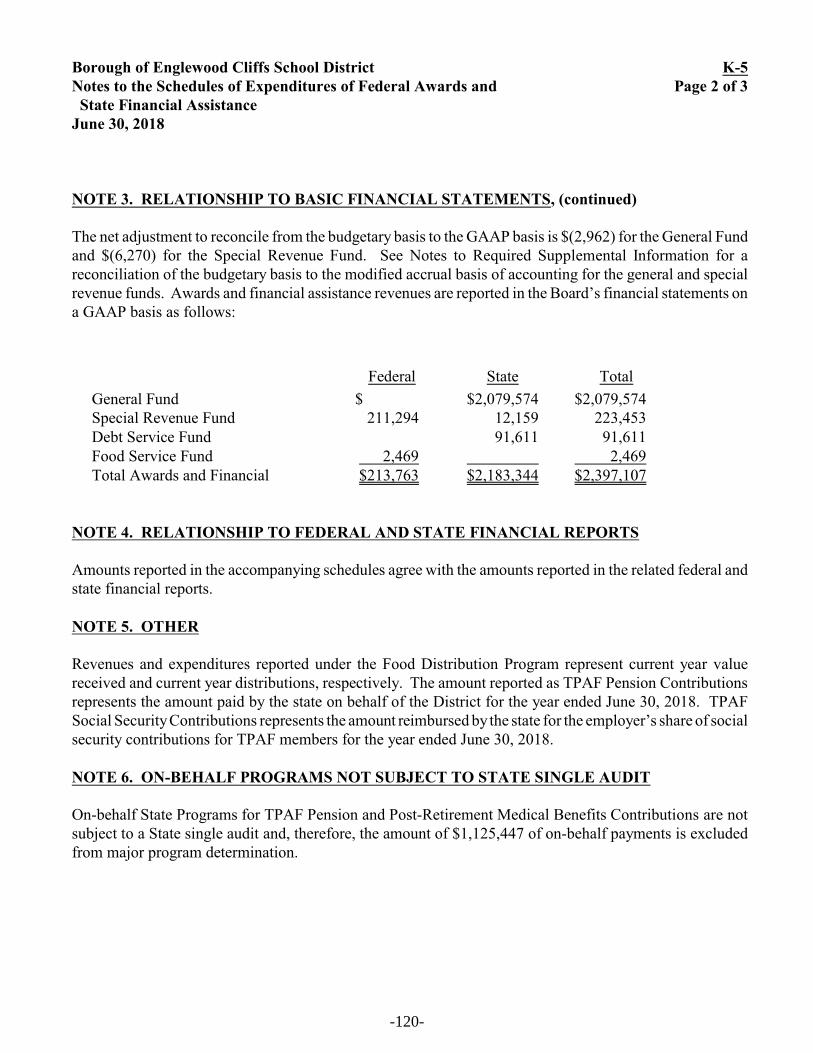
Borough of Englewood Cliffs School District K-5Notes to the Schedules of Expenditures of Federal Awards and Page 2 of 3 State Financial AssistanceJune 30, 2018
NOTE 3. RELATIONSHIP TO BASIC FINANCIAL STATEMENTS, (continued)
The net adjustment to reconcile from the budgetary basis to the GAAP basis is $(2,962) for the General Fundand $(6,270) for the Special Revenue Fund. See Notes to Required Supplemental Information for areconciliation of the budgetary basis to the modified accrual basis of accounting for the general and specialrevenue funds. Awards and financial assistance revenues are reported in the Board’s financial statements ona GAAP basis as follows:
Federal State Total
General Fund $ $2,079,574 $2,079,574Special Revenue Fund 211,294 12,159 223,453Debt Service Fund 91,611 91,611Food Service Fund 2,469 2,469Total Awards and Financial $213,763 $2,183,344 $2,397,107
NOTE 4. RELATIONSHIP TO FEDERAL AND STATE FINANCIAL REPORTS
Amounts reported in the accompanying schedules agree with the amounts reported in the related federal andstate financial reports.
NOTE 5. OTHER
Revenues and expenditures reported under the Food Distribution Program represent current year valuereceived and current year distributions, respectively. The amount reported as TPAF Pension Contributionsrepresents the amount paid by the state on behalf of the District for the year ended June 30, 2018. TPAFSocial Security Contributions represents the amount reimbursed by the state for the employer’s share of socialsecurity contributions for TPAF members for the year ended June 30, 2018.
NOTE 6. ON-BEHALF PROGRAMS NOT SUBJECT TO STATE SINGLE AUDIT
On-behalf State Programs for TPAF Pension and Post-Retirement Medical Benefits Contributions are notsubject to a State single audit and, therefore, the amount of $1,125,447 of on-behalf payments is excludedfrom major program determination.
-120-
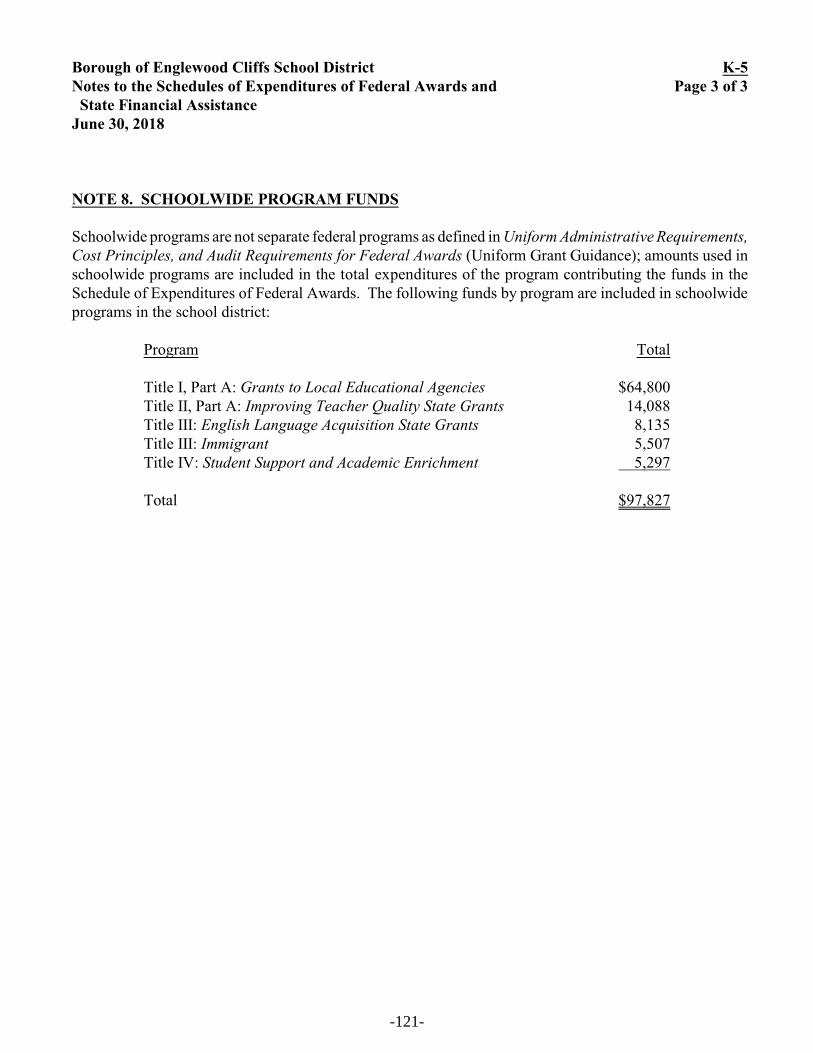
Borough of Englewood Cliffs School District K-5Notes to the Schedules of Expenditures of Federal Awards and Page 3 of 3 State Financial AssistanceJune 30, 2018
NOTE 8. SCHOOLWIDE PROGRAM FUNDS
Schoolwide programs are not separate federal programs as defined in Uniform Administrative Requirements,Cost Principles, and Audit Requirements for Federal Awards (Uniform Grant Guidance); amounts used inschoolwide programs are included in the total expenditures of the program contributing the funds in theSchedule of Expenditures of Federal Awards. The following funds by program are included in schoolwideprograms in the school district:
Program Total
Title I, Part A: Grants to Local Educational Agencies $64,800Title II, Part A: Improving Teacher Quality State Grants 14,088Title III: English Language Acquisition State Grants 8,135Title III: Immigrant 5,507Title IV: Student Support and Academic Enrichment 5,297
Total $97,827
-121-
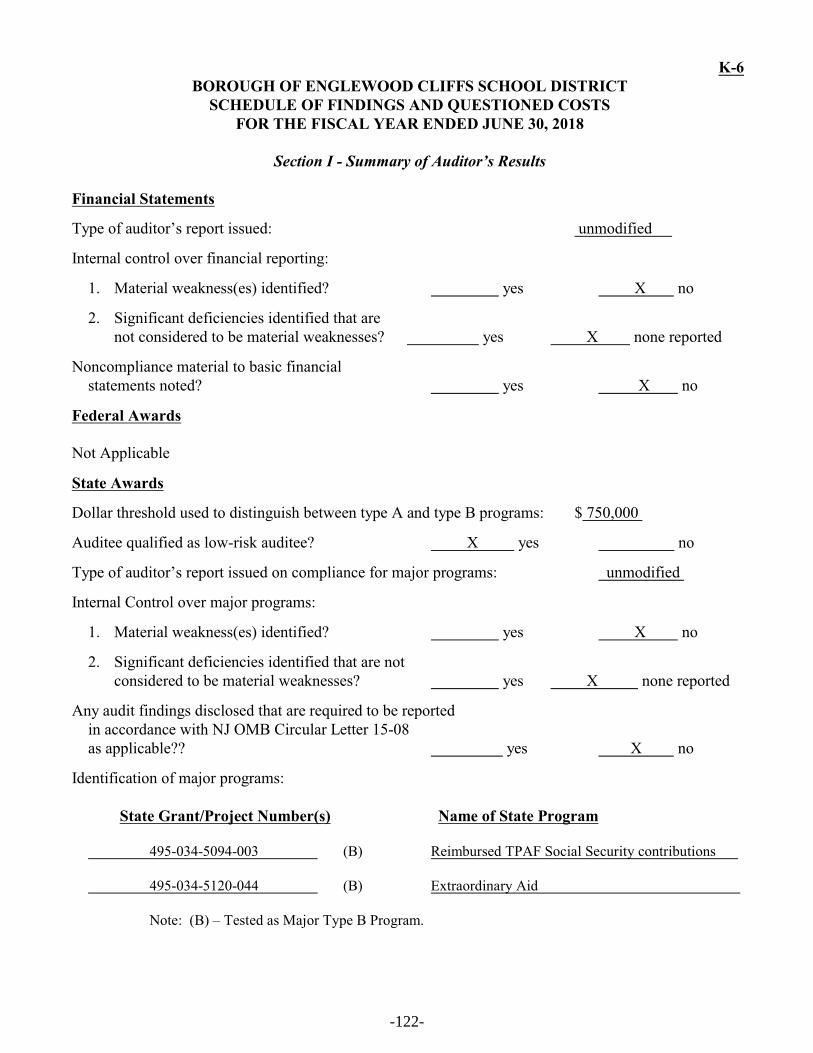
K-6 BOROUGH OF ENGLEWOOD CLIFFS SCHOOL DISTRICT
SCHEDULE OF FINDINGS AND QUESTIONED COSTSFOR THE FISCAL YEAR ENDED JUNE 30, 2018
Section I - Summary of Auditor’s Results
Financial Statements
Type of auditor’s report issued: unmodified
Internal control over financial reporting:
1. Material weakness(es) identified? yes X no
2. Significant deficiencies identified that arenot considered to be material weaknesses? yes X none reported
Noncompliance material to basic financial statements noted? yes X no
Federal Awards
Not Applicable
State Awards
Dollar threshold used to distinguish between type A and type B programs: $ 750,000
Auditee qualified as low-risk auditee? X yes no
Type of auditor’s report issued on compliance for major programs: unmodified
Internal Control over major programs:
1. Material weakness(es) identified? yes X no
2. Significant deficiencies identified that are not considered to be material weaknesses? yes X none reported
Any audit findings disclosed that are required to be reported in accordance with NJ OMB Circular Letter 15-08as applicable?? yes X no
Identification of major programs:
State Grant/Project Number(s) Name of State Program
495-034-5094-003 (B) Reimbursed TPAF Social Security contributions
495-034-5120-044 (B) Extraordinary Aid
Note: (B) – Tested as Major Type B Program.
-122-
K-7
BOROUGH OF ENGLEWOOD CLIFFS SCHOOL DISTRICTSCHEDULE OF FINANCIAL, FEDERAL AND STATE FINDINGS
FOR THE FISCAL YEAR ENDED JUNE 30, 2018(continued)
Section II - Financial Statement Findings
None
Section III - State Financial Assistance Findings and Questioned Costs
None
-123-
K-8
BOROUGH OF ENGLEWOOD CLIFFS SCHOOL DISTRICT
SUMMARY SCHEDULE OF PRIOR AUDIT FINDINGS
FOR THE FISCAL YEAR ENDED JUNE 30, 2018
Status of Prior Year Findings
There were no prior year findings.
-124-