![ホーム - 新宮町ホームページ · 2019. 4. 19. · 40.4 • 63.4 2 Fzkìtg 599 59.8 0 3:5m 3.6m 599 59.8 03.5m 3.6m 44.8 19.731 15]1m 22.8 4)Ø2 : 4 : 2.6 5 .43.7 26.7 3.8](https://static.fdocuments.net/doc/165x107/5fee3e7f53407933697532d9/fff-cfffff-2019-4-19-404-a-634-2-fzktg-599.jpg)
School District of Philadelphia Quarterly School Manager Report · 2017-07-21 · Including...
57
School District of Philadelphia Quarterly School Manager Report FOR THE PERIOD ENDED MARCH 31, 2017 May 15, 2017 The School District of Philadelphia’s Quarterly School Manager Report for the period ended March 31, 2017 represents forward-looking statements and any such statements inherently are subject to a variety of risks and uncertainties that could cause actual results to differ materially from those that have been projected. Such risks and uncertainties which could affect the revenues and obligations of the School District include, among others, reduced governmental allocations, changes in economic conditions, mandates from other governments, and various other events, conditions and circumstances, many of which are beyond the control of the School District. Such forward-looking statements speak only as of the date of this presentation, May 15, 2017. The School District disclaims any obligation or undertaking to release publicly any updates or revisions to any forward-looking statement contained herein to reflect any changes in the School District’s expectations with regard thereto or any change in events, conditions or circumstances on which any such statement is based.
Transcript of School District of Philadelphia Quarterly School Manager Report · 2017-07-21 · Including...

School District of Philadelphia Quarterly School Manager Report
FOR THE PERIOD ENDED MARCH 31, 2017
May 15, 2017
The School District of Philadelphia’s Quarterly School Manager Report for the period ended March 31, 2017 represents forward-looking statements and any such statements inherently are subject to a variety of risks and uncertainties that could cause actual results to differ materially from those that have been projected. Such risks and uncertainties which could affect the revenues and obligations of the School District include, among others, reduced governmental allocations, changes in economic conditions, mandates from other governments, and various other events, conditions and circumstances, many of which are beyond the control of the School District. Such forward-looking statements speak only as of the date of this presentation, May 15, 2017. The School District disclaims any obligation or undertaking to release publicly any updates or revisions to any forward-looking statement contained herein to reflect any changes in the School District’s expectations with regard thereto or any change in events, conditions or circumstances on which any such statement is based.

If you have a disability and the format of any material on our web pages interferes with your ability to access the information or you have a question regarding the School District’s website accessibility, please contact us via any of the following means for assistance: The School District of Philadelphia Office of Family and Community Engagement 440 N. Broad Street, Suite 114 Philadelphia, PA 19130-4015 Email: [email protected] Tel: (215) 400-4000 Fax: (215) 400-4181 To help us respond in a manner most helpful to you, please indicate the nature of the accessibility problem, the web address of the requested material, your preferred format in which you want to receive the material (electronic format (ASCII, etc.), standard print, large print, etc.), and your contact information (name, email, telephone, and physical mailing address).

School District of Philadelphia QUARTERLY SCHOOL MANAGER REPORT
FOR THE PERIOD ENDED MARCH 31, 2017
TABLE OF CONTENTS
Overview of the Quarterly School Manager Report i
Introduction iii
School District Operating Budget Summary vii
Key School Budget Dates ix
Operating Fund Reports
Table OF-1 Operating Funds – Fund Balance Summary 2
Table OF-2 Operating Funds – Revenue Detail 3
Table OF-3 Operating Funds – Functional Expenditure Summary 5
Cash Flow Reports
Table CF-1 Cash Flow – Adopted Cash Flow 9
Table CF-2 Cash Flow – Year-to-date Cash Flow 10
Table CF-3 Cash Flow – Vendor Payments to Date 11
Personnel Reports
Table P-1 Position Summary 23
Table P-2 Vacancy Listing by School 24
Supplementary Materials
SM-1 Debt Service Schedule 32
SM-2a-c Capital Projects 33
SM-3 School Allocation Methodology 36
SM-4a Major Grant Funds Summary 37
SM-4b Major Grant Funds Descriptions 38
SM-5 Title I School-by-School Budget and Spend 40
SM-6 Minority and Women Business Enterprise Participation 44
SM-7 Open Data Initiative 45

Overview of the Quarterly School Manager Report QUARTERLY SCHOOL MANAGER REPORT For the Period Ended March 31, 2017
i
Overview of the Quarterly School Manager Report
The Quarterly School Manager Report is a summary report on the finances and management of the School District of Philadelphia. It is prepared by the Office of Finance.
The purpose of the Quarterly School Manager Report is to provide senior management of the School District of Philadelphia with a summary of the District's progress in implementing the financial and management goals of the current fiscal year on both a "Year-to-date Actual" basis and on a “Forecast for Full Year” basis.
While the Quarterly School Manager Report focuses narrowly on the financial management of the District, it is important to keep in mind the real educational impacts to children and families of the District’s financial status. Many schools lack a full array of resources and educational opportunities. Our financial plans are only effective to the extent that they provide for an adequate education of all public school children in Philadelphia.
The Quarterly School Manager Report contains the following reports and schedules:
Operating Funds: The Quarterly School Manager Report presents a combined presentation of revenues and expenses for the principal operating funds, in addition to detailed revenue categories in the general, intermediate unit, and debt service funds; and expenditure and current budget information divided according to the District’s functional hierarchy.
The principal operating funds of the District consist of a General Fund, Intermediate Unit (IU) Fund, and a Debt Service Fund. The District is required, as a result of its covenants to holders of fixed rate bonds of the School District, to deposit funds into its sinking funds during the current fiscal year to pay some of the debt service due in the next fiscal year.
For all quarters except the fourth quarter, the operating reports present quarterly year-to-date actuals for the current fiscal year and prior two fiscal years; the current full year projection and full year actuals for the prior two years; and the year-to-date actuals as a percentage of the total year. The fourth quarter report presents the current year amended budget, current full year projection, the current year projected budget variance, and full year obligations for the prior two years.
Cash Flow: The Cash Flow section includes year-to-date cash flow and vendor
payment information. The School District’s adopted cash flow is based on the
current fiscal year’s adopted budget. The cash flow projections are updated to
reflect actual year-to-date results and changes to assumptions as to the timing of revenues and the payment of expense which are made as a result of actual
events. The vendor payments report includes the cash payments made to date in
the fiscal year to the District’s vendors. The list contains payments inclusive of operating and grants expenditures.

Overview of the Quarterly School Manager Report QUARTERLY SCHOOL MANAGER REPORT For the Period Ended March 31, 2017
ii
Personnel Reports: The Position Summary Report contains budgeted and projected Full Time Equivalent positions and current On-Board actual employees. Budgeted and projected positions are derived from the Office of Management and Budget personnel projection system reconciled to the Staffing Management System for school-based positions. Current On-Board employees are taken from the District’s Advantage HR Staffing system and include On-Board employees at months-end with status codes 1 (Active), 2 (Acting), 3 (Long-Term Substitutes), and other codes for certain employee groups. There may be instances when the Count (Filled column) is fractional which represents an employee in a part-time position. The Quarterly School Manager Report also includes a Vacancy Report which is a listing of teacher vacancies by school for operating and grant funds.
The Position Report and Vacancy Report may vary due to timing differences, different definitions of what constitutes a vacancy, and different definitions of when a vacancy is considered filled.
Supplementary Materials: This section of the Quarterly School Manager Report contains additional materials related to the operations of the School District.
The Debt Service Schedule is the District’s current fiscal year projected operating debt service budget (net of refunding), which depicts each bond series outstanding broken down by principal and interest due in the current fiscal year. Current year “trapped funds” reserved in the current year are shown separately.
The Capital Projects reports include a listing of the District’s activities related to capital projects, in addition to detailing the monthly year-to-date cash balances for all bond funds held to pay capital projects.
The documentation also includes information regarding the school allocation methodology, major grants funds and corresponding descriptions, school-by-school Title I budgets and spend, a summary of minority and women business enterprise participation, and a listing of the data posted on the District’s website as part of the Open Data Initiative.

School District of Philadelphia QUARTERLY SCHOOL MANAGER REPORT FOR THE PERIOD ENDED MARCH 31, 2017
iii
Introduction Overview The School District of Philadelphia’s Quarterly School Manager Report for the period ended March 31, 2017 represents forward-looking statements and any such statements are subject to a variety of risks and uncertainties that could cause actual results to differ materially from those that have been projected. In FY 2017, the District currently projects operating revenues and sources (excluding refunding) of $2,817.5 million and operating expenditures and uses (excluding refunding) of $2,738.9 million, resulting in an operating surplus of $78.7 million excluding the net impact of refunding sources and uses and transfers from reserve. Including refundings and transfers from reserve, the projected operating surplus for FY 2017 is $59.8 million1. The District is projected to end FY 2017 with a $107.3 million positive fund balance. Overall, this represents a $6.4 million increase over the FY 2017 Adopted operating ending fund balance of $100.9 million. This $6.4 million increase consists of a $13.3 million better than projected performance in FY 2016 (as compared to the FY 2016 Amended budget); a $76.8 million better than projected performance in FY 2017 (as compared to the FY 2017 Adopted budget); and a $83.7M prior period adjustment in FY17 for the proper accounting presentation of the District’s annual severance liability2. As noted in the first quarter report, the District projects that it will continue to have balanced annual operations. Third Quarter Report Revised Projections As of March 31, 2017, the District is now projecting a year end fund balance of $107.3M. This represents a $35.4M reduction from the December 31, 2016 projection. This change in fund balance is due primarily to:
Projected expenditure reductions: o ($31.9) million reduction of charter school expenditures due to lower per
pupil charter rates as certified by the State in the third quarter. o ($27.2) million reduction in District operated school expenditures.
Projected revenue reductions: o ($15.5) million reduction in projected local real estate taxes.
Accounting adjustment: o $83.7M prior period adjustment in FY 2017 for the proper accounting
presentation of the District’s annual severance liability.
1 Specifically, the $78.7 million surplus figure excludes an unfavorable $9.1 million FY 2017 net refunding impact and an unfavorable $9.7 million transfer from reserves related to debt service. 2 As a result of this adjustment, the FY 2016 ending fund balance was restated to $47.5 million.

School District of Philadelphia QUARTERLY SCHOOL MANAGER REPORT FOR THE PERIOD ENDED MARCH 31, 2017
iv
Year Over Year Comparison
Revenues – Year over Year The following table shows a year over year comparison of year-to-date March revenues (excluding refunding) from FY 2015 to FY 2017.
FY17 YTD March 31 Revenues
FY16 YTD March 31 Revenues
FY15 YTD March 31 Revenues
A. Local Tax Revenue 917,850,932 906,234,959 832,997,952
B. Local Non Tax Revenue 3,884,279 39,011,165 39,300,899
C. State Revenue 942,392,417 746,815,429 1,043,661,070
D. Federal Revenue 9,097,905 5,796,538 5,762,380
E. Other Financing Sources(excl. Refunding)
747,095 5,354,714 21,105,713
Total Operating Revenues (excl. Refunding)
1,873,972,628 1,703,212,805 1,942,828,014
The major variances in the year-to-date revenues are primarily driven by:
A. FY 2017 YTD local tax revenue is approximately $10 million higher than FY2016 due to a net increase in all taxes.
B. Local Non Tax year-to-date revenue in FY 2017 is significantly lower than FY2015 and FY 2016. Advances received in FY 2015 and FY 2016 for the CityGrant were not received in FY 2017. Specifically, the City advanced $30.0Min FY 2015 and $35.0M in FY 2016 to the District to help address the District’scash flow concerns.
C. For year-to-date revenues provided by the State, FY 2015 year-to-datereceipts were higher due to $265.0 million of advances received from theState early in the year offset with a repayment of $65.0 million against thirdquarter receipts. In addition, FY 2015 and FY 2017 year-to-date receiptsinclude a February Basic Education subsidy payment that FY 2016 does notinclude due to the State budget impasse.
D. FY 2017 federal revenues include additional year-to-date revenues related toa new qualifying bond issue related to the FY 2017 refinancing.
E. Other Financing Sources varies each year due to the sale of property, whichtotaled $21.1M in FY 2015, $5.4M in FY 2016, and $0.7M in FY 2017.

School District of Philadelphia QUARTERLY SCHOOL MANAGER REPORT FOR THE PERIOD ENDED MARCH 31, 2017
v
Expenditures – Year over Year Year-to-date expenditures (excluding refunding) in FY 2017 are about 7% higher compared to FY 2016 and 8% higher compared to FY 2015.
FY17 YTD March 31
Expenditures
FY16 YTD March 31
Expenditures
FY15 YTD March 31
Expenditures
A. Salaries 531,640,507 520,129,363 530,765,850
B. Benefits 387,192,956 361,841,697 346,020,804
C. Non-Personnel Services 1,013,674,247 930,604,073 920,143,810
Total 1,932,507,711 1,812,575,134 1,796,930,464
A. Salaries – Operating fund salaries declined from FY 2015 to FY 2016 primarily
due to a decrease in District-operated school enrollment, increased teacher and other school-based personnel vacancies, and outsourcing of per diem salaries to a third party in FY 2016. From FY 2016 to FY 2017, expenditures increased due to fewer vacancies.
B. Benefits – From FY 2015 to FY 2016, operating benefits did not see proportional
decreases relative to salaries due primarily to increased retirement costs offsetting unemployment and social security expenditure declines. Similarly, between FY 2016 and FY 2017, continued increases in retirement expenditures were partially offset by decreases in other benefits.
C. Non-Personnel Services (NPS) – The NPS full-year expenditures have been
steadily increasing since FY 2015. However, FY 2016 year-to-date spend is proportionally lower compared to the other years due to timing differences.
Issues and Risks The third quarter report has been adjusted to reflect the three-quarter mark of the fiscal year, incorporating a better depiction of the District’s spend. The fourth quarter report will refine these projections as we end the school year and begin the fiscal year closing process. In addition, the District continues to evaluate the financial impact of the academic calendar change, which the District’s School Reform Commission approved in December 2016. Although the change will not occur until August 2017, there are potential business process, financial, and other implications, which are being addressed in FY 2017.

School District of Philadelphia QUARTERLY SCHOOL MANAGER REPORT FOR THE PERIOD ENDED MARCH 31, 2017
vi
Conclusion
After operating in austerity mode from FY 2012 to FY 2015, the District ended FY 2016 and is projected to end FY 2017 with modest positive ending fund balances. Despite recent progress towards financial stability, the District finds itself one year closer to the FY 2019 fiscal cliff first identified last year. Over the next five years, the District’s projected expenditure growth rate is 4.4 percent, nearly double the projected revenue growth rate of 2.5 percent. The District will need continued support from its funders to ensure additional, recurring funding to maintain current programs and implement necessary investments in future years.
Uri Z. Monson Chief Financial Officer Office of Finance School District of Philadelphia May 15, 2017
kabowers
Stamp

School District of Philadelphia QUARTERLY SCHOOL MANAGER REPORT FOR THE PERIOD ENDED MARCH 31, 2017
vii
FY 2017 Current Projection Summary (as included in the FY 2018 Consolidated Budget Book)
FY 2017 Current Projection The District’s budget consists of multiple funds: Operating, Categorical, Capital, Print, and Food Services. The current projection for the operating budget (excluding refunding) includes a $2.82 billion revenue budget and a $2.74 billion expenditure budget.
Operating Revenues The District does not have the power to authorize taxes directly. Funding is provided by the state, city, federal governments, and other sources.
Approximately 55.7 percent of local revenues are generated from real estate tax. The remaining 44.3 percent of local revenues come from other taxes and fees and a City grant. Approximately 65.7 percent of state revenues are provided through the basic education subsidy. The remaining 34.3 percent of State revenues come from other subsidies and reimbursements.
Source: FY18 Consolidated Budget Book
School District of Philadelphia QUARTERLY SCHOOL MANAGER REPORT FOR THE PERIOD ENDED MARCH 31, 2017
viii
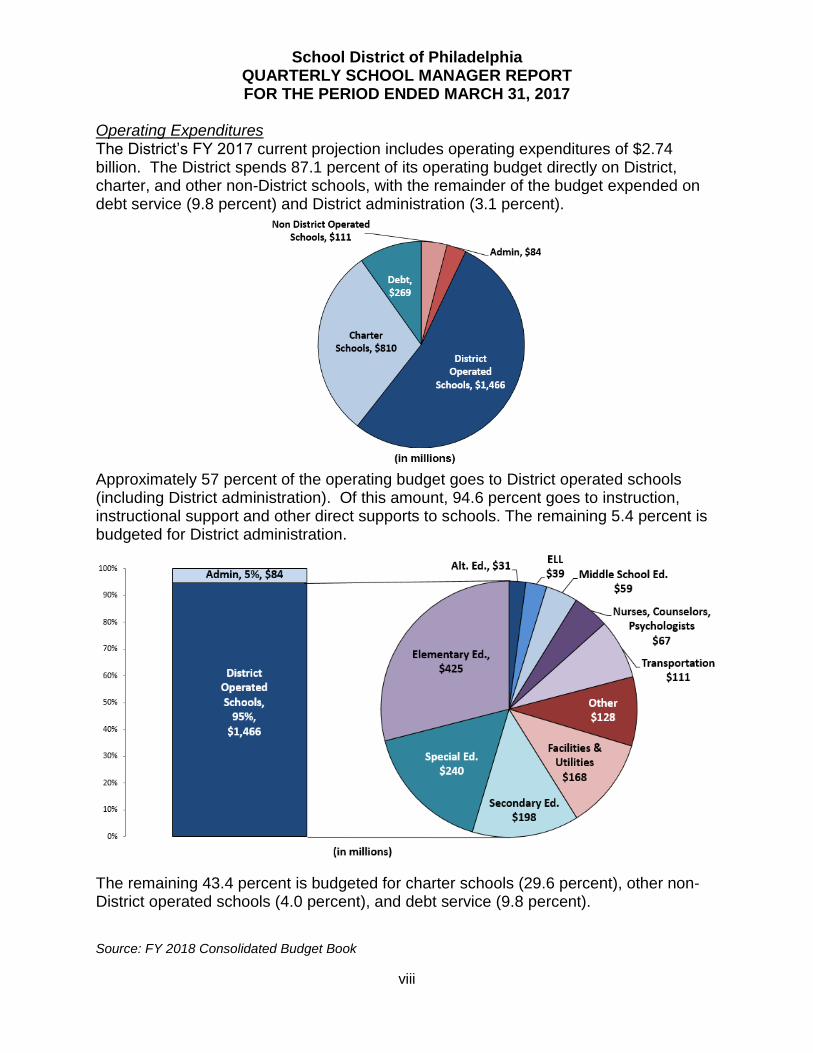
Operating Expenditures The District’s FY 2017 current projection includes operating expenditures of $2.74 billion. The District spends 87.1 percent of its operating budget directly on District, charter, and other non-District schools, with the remainder of the budget expended on debt service (9.8 percent) and District administration (3.1 percent).
Approximately 57 percent of the operating budget goes to District operated schools (including District administration). Of this amount, 94.6 percent goes to instruction, instructional support and other direct supports to schools. The remaining 5.4 percent is budgeted for District administration.
The remaining 43.4 percent is budgeted for charter schools (29.6 percent), other non-District operated schools (4.0 percent), and debt service (9.8 percent).
Source: FY 2018 Consolidated Budget Book

School District of Philadelphia QUARTERLY SCHOOL MANAGER REPORT FOR THE PERIOD ENDED MARCH 31, 2017
ix
FY 2017 Key School Budget Dates
The following table summarizes the key budget dates for FY 2017:
Month District City State
July
● July 1, 2016-SRC Authorizes the issuance andsale of Tax and RevenueAnticipation Notes for FY17
● July 12, 2016-
Enactment of FY17 Statebudget
August ● Aug. 12, 2016-FY16 Q4 Quarterly School ManagerReport released
September
October ● Oct. 17, 2016-FY17 leveling finalized and staff inbuildings
November ● Nov. 14, 2016-FY17 Q1 Quarterly School ManagerReport released
December
January
February ● February 14, 2017-
FY17 Q2 Quarterly School ManagerReport released
● Feb. 7, 2017-
Governor’s FY18 BudgetAddress and proposedbudget
March
● March 23, 2017-SRC approves FY18 Lump SumStatement● March 31, 2017-
School budgets for FY18 submitted
● March 2, 2017-Mayor’s FY18 Budget Addressand proposed budget
April ● April 20, 2017-SRC Budget Hearing for FY18
May
● May 3, 2017-
FY18 Consolidated and SchoolBudget Books published● May 15, 2017-FY17 Q3 Quarterly School ManagerReport released● May 25, 2017-SRC adoption of FY18 Budget andFY17 Amended Budget
● May 10, 2017-City Council School DistrictBudget Hearing for FY18● Late May / Early June 2017-
City Council adoption of FY18Budget
June ● June 30, 2017-
SRC approves authority to levy andassess FY18 taxes
● June 2017 (Date TBD)-
City Council passes bill toauthorize District to levy FY18taxes
● June 2017 (Date TBD)-
Enactment of FY18 Statebudget
* Future dates are subject to change and may be revised in subsequent reports.Source: School District of Philadelphia Finance Staff

OPERATING FUND
REPORTS
School District of Philadelphia
Quarterly School Manager Report
FOR THE PERIOD ENDED MARCH 31, 2017

A B C D E F G H I J K
YTD YTD YTD
Category Adopted YTD As % of Current Full Yr YTD As % of Full Yr YTD As % of
Budget March 31, 2017 Adopted Budget Projection Actual March 31, 2016 Current Proj. Actual March 31, 2015 Full Yr Actuals
REVENUES
1 Local Tax Revenue 1,141,127,000 917,850,932 80.4% 1,138,671,000 1,120,731,344 906,234,959 80.9% 1,063,320,312 832,997,952 78.3%
2 Local Non Tax Revenue 129,513,000 3,884,279 3.0% 131,725,000 143,556,031 39,011,165 27.2% 131,022,708 39,300,899 30.0%
3 State Revenue 1,572,045,000 942,392,417 59.9% 1,532,778,000 1,443,194,347 746,815,429 51.7% 1,386,742,195 1,043,661,070 75.3%
4 Federal Revenue 11,169,000 9,097,905 81.5% 13,054,000 11,386,612 5,796,538 50.9% 11,375,416 5,762,380 50.7%
5 Subtotal Operating Revenues 2,853,854,000 1,873,225,533 65.6% 2,816,228,000 2,718,868,334 1,697,858,091 62.4% 2,592,460,631 1,921,722,301 74.1%
6 Total Other Financing Sources (excluding Refunding) 1,489,000 747,095 50.2% 1,309,000 6,690,640 5,354,714 80.0% 22,776,249 21,105,713 92.7%
7Total Operating Revenues & Other Sources
(excluding Refunding)2,855,343,000 1,873,972,628 65.6% 2,817,537,000 2,725,558,974 1,703,212,805 62.5% 2,615,236,880 1,942,828,014 74.3%
YTD YTD YTD
Category Adopted YTD As % of Current Full Yr YTD As % of Full Yr YTD As % of
Budget March 31, 2017 Adopted Budget Projection Actual March 31, 2016 Current Proj. Actual March 31, 2015 Full Yr Actuals
EXPENDITURES
8 A. District Operated Schools 1,541,115,367 1,026,389,138 66.6% 1,476,671,980 1,484,365,085 974,520,345 65.7% 1,351,493,014 971,513,738 71.9%
9 B. Debt Service 261,618,067 200,338,416 76.6% 269,265,256 260,604,416 195,969,716 75.2% 266,962,226 180,848,779 67.7%
10 C. Charter Schools 830,434,429 602,305,489 72.5% 772,161,000 711,273,846 541,658,949 76.2% 715,428,470 530,334,097 74.1%
11 D. Charter Transportation 36,343,175 23,631,904 65.0% 37,440,216 33,543,964 25,413,200 75.8% 31,044,616 25,303,058 81.5%
12 E. Other Non District Operated Schools 112,364,607 29,375,349 26.1% 110,778,760 107,812,880 28,646,598 26.6% 106,258,172 38,493,604 36.2%
13 F. Administration 86,275,066 51,104,830 59.2% 84,472,091 75,317,212 46,473,788 61.7% 72,435,741 50,691,113 70.0%
14 G. Undistributed Budgetary Adjustments (7,769,060) (637,415) 8.2% (14,629,421) (8,533,503) (140,823) 1.7% (40,462,985) (253,926) 0.6%
15 Subtotal Operating Expenditures 2,860,381,651 1,932,507,711 67.6% 2,736,159,881 2,664,383,902 1,812,541,774 68.0% 2,503,159,253 1,796,930,464 71.8%
16 Other Financing Uses (excluding Refunding) 2,252,349 0 0.0% 2,702,349 1,661,939 33,360 2.0% 1,677,425 0 0.0%
17Total Obligations & Other Uses
(excluding Refunding)2,862,634,000 1,932,507,711 67.5% 2,738,862,230 2,666,045,841 1,812,575,134 68.0% 2,504,836,678 1,796,930,464 71.7%
18 Operating Surplus (Deficit) (7,291,000) 78,674,770 59,513,133 110,400,202
19 Refunding Revenues and Sources 0 1,306,745,344 N/A 1,306,745,000 349,960,000 0 0.0% 295,175,270 0 0.0%
20 Refunding Expenditures and Uses 0 1,315,876,153 N/A 1,315,876,153 349,730,949 0 0.0% 300,439,989 0 0.0%
OPERATIONS IN RESPECT TO
PRIOR FISCAL YEARS
21 Net Impact of Refunding Sources and Uses 0 (9,131,153) 229,051 (5,264,719)
22 Change in Reserves (9,702,000) (9,701,738) (16,561,719) (20,130,103)
23Operating Surplus/(Deficit) including
Refunding & Change in Reserves(16,993,000) 59,841,880 43,180,465 85,005,380
24 Prior Year Fund Balance 117,902,900 131,228,426 88,047,961 (14,821,058)
25 Adjustment of Prior Year Balance 0 (83,743,596) 0 17,863,639
26 Prior Year Fund Balance after Adjustment 117,902,900 47,484,830 88,047,961 3,042,581
27 Year End Fund Balance 100,909,900 107,326,710 131,228,426 88,047,961
Source: School District of Philadelphia Budget System; School District of Philadelphia Finance Staff Estimates
FISCAL YEAR 2017 FISCAL YEAR 2016 FISCAL YEAR 2015
TABLE OF-1
QUARTERLY SCHOOL MANAGER REPORT
FUND BALANCE SUMMARY
OPERATING FUNDS
FOR THE PERIOD ENDED MARCH 31, 2017
FISCAL YEAR 2017 FISCAL YEAR 2016 FISCAL YEAR 2015
Page 2 of 45

A B C D E F G H I J K
YTD YTD YTD
Category Adopted YTD As % of Current Full Yr YTD As % of Full Yr YTD As % of
Budget March 31, 2017 Adopted Budget Projection Actual March 31, 2016 Current Proj. Actual March 31, 2015 Full Yr Actuals
LOCAL TAX REVENUE
GENERAL FUND
1 Real Estate Tax -Current 650,494,000 607,919,276 93.5% 644,495,000 633,998,515 590,846,774 93.2% 604,940,462 551,815,951 91.2%
2 Real Estate Tax -Delinquent 70,740,000 32,114,817 45.4% 63,033,000 63,409,950 39,728,737 62.7% 57,152,743 32,283,174 56.5%
3 Liquor Sales Tax 65,650,000 45,808,522 69.8% 69,400,000 65,830,679 40,432,792 61.4% 61,711,742 38,069,703 61.7%4 School (Non-Business) Income Tax 39,900,000 8,548,072 21.4% 40,250,000 40,344,731 8,849,378 21.9% 40,357,976 10,388,202 25.7%
5 Business Use and Occupancy Tax 139,500,000 100,684,444 72.2% 140,300,000 137,333,346 102,892,216 74.9% 127,808,115 92,831,695 72.6%
6 Cigarette Tax 53,800,000 31,556,899 58.7% 58,000,000 58,766,316 39,041,256 66.4% 50,245,020 29,148,110 58.0%
7 Sales Tax 120,000,000 89,252,265 74.4% 120,000,000 120,000,000 83,395,999 69.5% 120,000,000 77,356,863 64.5%
8 Ridesharing Revenue - 768,974 N/A 2,000,000 - - N/A - - N/A
9 Payments in Lieu of Taxes - 4,619 N/A - 4,619 4,619 100.0% 4,619 4,619 100.0%
10 Public Utility Realty Tax 1,043,000 1,193,044 114.4% 1,193,000 1,043,188 1,043,188 100.0% 1,099,635 1,099,635 100.0%
11 TOTAL OPERATING FUNDS - LOCAL TAX REVENUE 1,141,127,000 917,850,932 80.4% 1,138,671,000 1,120,731,344 906,234,959 80.9% 1,063,320,312 832,997,952 78.3%
LOCAL NON TAX REVENUE
GENERAL FUND
12 Interest on Temp. Investments 500,000 259,151 51.8% 600,000 583,204 355,166 60.9% 330,919 236,557 71.5%13 Grant from City of Philadelphia 104,264,000 - 0.0% 104,264,000 104,184,673 35,000,000 33.6% 99,110,300 30,000,000 30.3%
14 Casino Settlement 1,928,000 - 0.0% 1,928,000 1,928,437 - 0.0% 3,872,158 3,872,158 100.0%
15 Stadium Agreements 2,744,000 1,646,100 60.0% 2,744,000 2,743,500 1,646,100 60.0% 2,754,500 1,652,700 60.0%
16 Voluntary Contribution Program 373,000 63,952 17.1% 440,000 442,492 73,228 16.5% 423,307 123,021 29.1%
17 Parking Authority Contribution 8,000,000 - 0.0% 9,500,000 10,279,437 - 0.0% 11,062,997 - 0.0%
18 Gaming Revenue 5,000,000 575,224 11.5% 5,000,000 4,810,097 385,321 8.0% 5,132,338 517,659 10.1%
19 Reimb. from Other Funds 14,000 - 0.0% 14,000 13,860 - 0.0% 13,860 - 0.0%
20 Miscellaneous Non Tax 5,200,000 1,158,988 22.3% 5,550,000 7,885,729 898,192 11.4% 4,768,398 1,440,786 30.2%
21 TOTAL - LOCAL NON TAX REVENUE 128,023,000 3,703,415 2.9% 130,040,000 132,871,429 38,358,007 28.9% 127,468,777 37,842,881 29.7%
INTERMEDIATE UNIT FUND
22 Special Education Tuition 470,000 6,489 1.4% 470,000 787,506 3,857 0.5% 767,632 - 0.0%
23 Special Education Trans. Interest 3,000 - 0.0% 3,000 - - N/A 2,009 - 0.0%
24 Act 89 - Non-Pub. School Interest 17,000 - 0.0% 17,000 5,684 - 0.0% 17,114 - 0.0%
25 TOTAL - LOCAL NON TAX REVENUE 490,000 6,489 1.3% 490,000 793,190 3,857 0.5% 786,755 - 0.0%
DEBT SERVICE FUND
26 Interest and Investment Earnings 1,000,000 174,375 17.4% 980,000 824,435 504,247 61.2% 936,285 740,508 79.1%
27 Basis Swap - - N/A 215,000 1,921,225 - 0.0% 1,740,411 716,510 41.2%
28 Miscellaneous - - N/A - 7,145,752 145,054 2.0% 90,480 1,000 1.1%
29 TOTAL - LOCAL NON TAX REVENUE 1,000,000 174,375 17.4% 1,195,000 9,891,412 649,301 6.6% 2,767,176 1,458,018 52.7%
30 TOTAL OPERATING FUNDS - LOCAL NON TAX REVENUE 129,513,000 3,884,279 3.0% 131,725,000 143,556,031 39,011,165 27.2% 131,022,708 39,300,899 30.0%
STATE REVENUE
GENERAL FUND
31 Gross Basic Education1 1,107,611,000 586,367,900 52.9% 1,065,688,000 1,019,962,761 422,332,851 41.4% 984,119,966 738,430,684 75.0%
32 Less: Reimb. of Prior Year's
Intermediate Unit Advances (58,256,000) - 0.0% (58,196,000) (53,385,249) - N/A (47,401,666) - 0.0%
33 Net Basic Education1
1,049,355,000 586,367,900 55.9% 1,007,492,000 966,577,512 422,332,851 43.7% 936,718,300 738,430,684 78.8%
34 Debt Service2
12,367,000 12,447,767 100.7% 23,169,000 - - N/A 14,120,800 3,566,550 25.3%
School Health Programs:-
35 Nurse Services2
1,083,000 1,011,234 93.4% 2,248,000 - - N/A 1,131,207 - 0.0%
36 Medical & Dental2
1,862,000 1,714,903 92.1% 3,803,000 - - N/A 1,951,724 - 0.0%
37 Tuition 631,000 - 0.0% 631,000 658,689 - 0.0% 415,386 - 0.0%
38 Vocational Education 5,184,000 3,186,624 61.5% 5,278,000 5,157,398 3,127,967 60.7% 5,285,413 2,900,361 54.9%
39 Transportation 65,767,000 45,940,904 69.9% 67,368,000 65,706,342 46,343,025 70.5% 63,077,448 42,802,869 67.9%
40 Special Education 143,324,000 103,807,610 72.4% 138,748,000 135,435,122 101,889,480 75.2% 131,163,995 98,312,925 75.0%
TABLE OF-2
QUARTERLY SCHOOL MANAGER REPORT
REVENUE DETAIL
OPERATING FUNDS
FOR THE PERIOD ENDED MARCH 31, 2017
FISCAL YEAR 2017 FISCAL YEAR 2016 FISCAL YEAR 2015
Page 3 of 45

A B C D E F G H I J K
YTD YTD YTD
Category Adopted YTD As % of Current Full Yr YTD As % of Full Yr YTD As % of
Budget March 31, 2017 Adopted Budget Projection Actual March 31, 2016 Current Proj. Actual March 31, 2015 Full Yr Actuals
TABLE OF-2
QUARTERLY SCHOOL MANAGER REPORT
REVENUE DETAIL
OPERATING FUNDS
FOR THE PERIOD ENDED MARCH 31, 2017
FISCAL YEAR 2017 FISCAL YEAR 2016 FISCAL YEAR 2015
41 Retirement1
130,748,000 89,316,679 68.3% 126,912,000 115,259,347 58,905,179 51.1% 91,850,911 54,184,816 59.0%
42 Social Security1 33,555,000 18,455,459 55.0% 32,522,000 33,896,566 27,380,678 80.8% 33,637,117 25,815,790 76.7%
43 TOTAL - STATE REVENUE 1,443,876,000 862,249,080 59.7% 1,408,171,000 1,322,690,976 659,979,180 49.9% 1,279,352,301 966,013,995 75.5%
INTERMEDIATE UNIT FUND
44 Special Education Program 4,923,000 5,075,442 103.1% 5,343,000 5,245,101 4,728,956 90.2% 4,922,925 4,676,777 95.0%
45 Special Education Transportation 75,820,000 56,865,000 75.0% 73,370,000 71,360,204 51,523,325 72.2% 66,956,893 46,765,500 69.8%
46 Act 89 - Non-Public School Prog. 14,407,000 14,423,329 100.1% 14,423,000 14,407,334 14,497,334 100.6% 14,226,253 14,226,253 100.0%
47 Retirement 26,188,000 - 0.0% 24,688,000 22,421,172 10,756,817 48.0% 13,902,783 6,509,283 46.8%
48 Social Security 6,831,000 3,779,566 55.3% 6,783,000 7,069,560 5,329,817 75.4% 7,381,040 5,469,262 74.1%
49 TOTAL - STATE REVENUE 128,169,000 80,143,337 62.5% 124,607,000 120,503,371 86,836,249 72.1% 107,389,894 77,647,075 72.3%
50 TOTAL OPERATING FUNDS - STATE REVENUE 1,572,045,000 942,392,417 59.9% 1,532,778,000 1,443,194,347 746,815,429 51.7% 1,386,742,195 1,043,661,070 75.3%
FEDERAL REVENUE
GENERAL FUND
51 Federal Debt Service Subsidy 11,013,000 - 0.0% - 11,158,002 5,593,243 50.1% 11,144,617 5,573,708 50.0%
52 Impacted Area Aid 156,000 257,436 165.0% 257,000 228,610 203,295 88.9% 230,799 188,672 81.7%
53 TOTAL - FEDERAL REVENUE 11,169,000 257,436 2.3% 257,000 11,386,612 5,796,538 50.9% 11,375,416 5,762,380 50.7%
DEBT SERVICE FUND
54 Federal Debt Service Subsidy - 8,840,469 N/A 12,797,000 - - N/A - - N/A
55 TOTAL - FEDERAL REVENUE - 8,840,469 N/A 12,797,000 - - N/A - - N/A
56 TOTAL OPERATING FUNDS - FEDERAL REVENUE 11,169,000 9,097,905 81.5% 13,054,000 11,386,612 5,796,538 50.9% 11,375,416 5,762,380 50.7%
57 SUBTOTAL OPERATING REVENUES 2,853,854,000 1,873,225,533 65.6% 2,816,228,000 2,718,868,334 1,697,858,091 62.4% 2,592,460,631 1,921,722,301 74.1%
58 Total Other Financing Sources (excluding Refunding) 1,489,000 747,095 N/A 1,309,000 6,690,640 5,354,714 80.0% 22,776,249 21,105,713 92.7%
59 TOTAL OPERATING REVENUES (EXCLUDING REFUNDING) 2,855,343,000 1,873,972,628 65.6% 2,817,537,000 2,725,558,974 1,703,212,805 62.5% 2,615,236,880 1,942,828,014 74.3%
Source: School District of Philadelphia Budget System; School District of Philadelphia Finance Staff Estimates
1 The FY 2017 Current Projection includes the amounts in the enacted State Budget, which shifted funds from the operating fund to the Ready to Learn Grant. This included a $40.4 million Gross Basic Education subsidy shift and a resulting shift in associated retirement and social security reimbursements. These shifts
resulted in a $0 net change in the amount given to schools.2 FY 2017 Current Projection includes FY 2016 State revenues received in FY 2017.
Page 4 of 45

A B C D E F G H I J K
YTD YTD YTD
DEPARTMENT Adopted YTD As % of Current Full Yr YTD As % of Full Yr YTD As % of
Budget March 31, 2017 Adopted Budget Projection Actual March 31, 2016 Current Proj. Actual March 31, 2015 Full Yr Actuals
A. District Operated Schools
1 004 - Elementary - K-8 Education1
477,685,547 308,402,166 64.6% 424,711,256 456,571,075 309,779,068 67.8% 402,729,539 298,114,377 74.0%
2 005 - Middle School Education 63,122,790 41,406,407 65.6% 59,085,297 58,721,174 39,517,549 67.3% 58,015,590 40,779,778 70.3%
3 006 - Secondary Education 178,558,187 119,709,145 67.0% 169,717,410 160,529,063 112,612,475 70.2% 159,330,368 114,515,852 71.9%
4 007 - Secondary Education - Career and Technical 28,301,819 18,269,937 64.6% 25,771,288 25,188,659 17,780,842 70.6% 25,233,768 18,186,954 72.1%
5 008 - Special Ed High Incidence 91,981,361 63,672,753 69.2% 89,773,517 91,121,020 64,382,827 70.7% 74,164,446 53,343,349 71.9%6 009 - Special Education -- Low Incidence 147,733,138 103,231,742 69.9% 149,651,430 132,302,157 91,234,485 69.0% 146,438,977 104,627,152 71.4%
7 010 - Special Education -- Gifted Education 1,397,979 23,118 1.7% 841,658 - - N/A - - N/A
8 011 - Turnaround Schools 13,301,175 7,405,159 55.7% 11,436,143 4,867,962 3,261,697 67.0% 5,014,443 3,522,123 70.2%
9 012 - Early Childhood Programs - - N/A - 56,224 109,021 193.9% 665,338 875,712 131.6%
10 014 - Summer Programs 3,615,484 2,124,408 58.8% 3,032,556 2,302,952 440,201 19.1% 289,740 127,473 44.0%
11 015 - English Language Learners - Instruction 35,998,585 26,442,408 73.5% 36,792,285 35,645,752 25,526,373 71.6% 35,662,831 25,946,556 72.8%
12 016 - Per Diem Substitute Service 21,120,959 12,671,464 60.0% 25,488,632 14,596,460 7,822,610 53.6% 14,072,643 8,792,810 62.5%
13 017 - Desegregation - - N/A - - 4,104 N/A - 9,787 N/A
14 018 - Itinerant Instrumental Music 7,530,714 5,363,319 71.2% 7,264,159 7,549,603 5,410,515 71.7% 7,261,319 5,211,264 71.8%
15 019 - Alternative Education - Transition Programs 5,418,461 3,730,829 68.9% 6,680,488 5,256,045 3,017,795 57.4% 5,228,469 3,076,187 58.8%
16 020 - Alternative Education - Multiple Pathways 22,257,619 15,693,087 70.5% 24,312,511 21,050,039 14,115,917 67.1% 21,776,773 14,461,933 66.4%
17 021 - Supplemental Teachers - - N/A - - 3,555 N/A 2,726 2,826 103.7%18 024 - Professional Development 3,648,572 5,602,184 153.5% 7,627,571 3,410,617 2,378,061 69.7% 2,195,864 1,525,423 69.5%
19 026 - Academic Division Offices - - N/A - - - N/A - 9,702 N/A
20 028 - Educational Technology 3,003,340 1,735,892 57.8% 4,770,888 15,653,958 2,658,071 17.0% 3,025,814 2,975,011 98.3%21 030 - Supplementary Principals and Assistant Principals 5,338,412 6,959,772 130.4% 8,008,378 5,407,869 4,842,031 89.5% 6,096,877 5,383,196 88.3%
22 031 - Central Book Allotment 288,132 455,098 157.9% 1,063,179 35,900,489 231,365 0.6% - - N/A
23 032 - Hospital - Homebound Instruction 699,161 330,840 47.3% 641,401 604,288 341,853 56.6% 400,969 224,205 55.9%
24 033 - Other Instructional Support 1,676,036 1,274,988 76.1% 1,902,726 700,436 475 0.1% 841,995 164,478 19.5%
25 036 - Counselors and Related Positions 23,069,401 15,949,576 69.1% 22,063,732 24,109,528 17,190,427 71.3% 22,027,878 15,868,963 72.0%
26 037 - School Health - Nurses 32,978,224 20,138,995 61.1% 29,342,423 23,824,063 16,630,015 69.8% 23,156,417 16,655,397 71.9%
27 039 - Psychologists 15,875,484 11,313,482 71.3% 15,721,484 15,938,961 11,208,770 70.3% 14,975,561 10,794,536 72.1%
28 040 - Athletics - Sports - Health - Safety and Physical Education 7,694,567 5,517,338 71.7% 8,201,074 8,177,954 5,510,349 67.4% 7,896,898 5,656,481 71.6%
29 041 - Librarians 219,100 160,328 73.2% 220,877 212,396 151,200 71.2% 182,877 137,206 75.0%
30 042 - Extra Curricular Activities - Clubs 2,266,454 1,622,332 71.6% 2,889,340 2,059,280 989,464 48.0% 1,539,561 837,834 54.4%
31 043 - English Language Learners -- Support Services 2,362,163 1,405,364 59.5% 2,036,332 1,926,839 1,403,131 72.8% 2,215,457 1,621,480 73.2%
32 047 - Facilities -- Custodians and Building Engineers 89,546,898 59,747,235 66.7% 87,545,315 81,209,642 55,481,106 68.3% 75,775,617 54,714,746 72.2%
33 048 - Facilities -- Maintenance and Repair Services 32,581,331 22,502,840 69.1% 36,711,420 35,016,316 21,315,789 60.9% 28,632,810 20,788,609 72.6%
34 049 - Transportation -- Special Education Services 75,823,000 - 0.0% 73,373,000 70,171,903 - 0.0% 66,958,902 - 0.0%
35 050 - Transportation -- Regular Services 19,031,791 50,283,621 264.2% 21,773,707 20,489,855 50,473,854 246.3% 20,496,110 50,128,524 244.6%
36 051 - Transportation -- Bus Attendants - Special Ed 8,631,973 18,101,228 209.7% 10,408,438 8,224,914 16,473,549 200.3% 8,954,234 17,947,532 200.4%
37 052 - Transportation -- Maintenance 5,571,391 3,317,903 59.6% 4,977,501 7,659,785 3,551,150 46.4% 5,324,833 3,609,736 67.8%
38 054 - Utilities 52,321,308 27,811,345 53.2% 44,030,516 41,765,392 29,190,413 69.9% 52,786,465 34,272,293 64.9%
39 055 - Food Service (3,000,000) - 0.0% (3,150,000) (3,000,000) - 0.0% (2,077,680) 17,360 -0.8%
40 056 - School Safety - School Police 27,628,855 17,982,083 65.1% 25,339,717 24,013,812 17,453,998 72.7% 25,292,598 18,675,425 73.8%
41 057 - School Safety - Mobile Security 3,457,476 2,173,294 62.9% 3,088,636 3,252,346 2,360,110 72.6% 3,177,737 2,289,866 72.1%
42 058 - In School Suspension - - N/A - - - N/A 23,817 21,829 91.7%43 059 - Losses and Judgments 18,013,589 16,936,674 94.0% 21,110,204 30,553,781 12,999,919 42.5% 17,011,312 9,824,346 57.8%
44 060 - Insurance and Self Insurance Reserves 2,591,362 1,636,132 63.1% 2,015,362 2,059,118.43 1,704,026 82.8% 1,921,540 1,832,542 95.4%
45 061 - Postal Services 1,872,012 709,382 37.9% 1,877,612 1,522,431 791,091 52.0% 1,268,503 1,178,830 92.9%
46 063 - Space Rental 3,866,517 2,879,817 74.5% 4,166,517 3,755,140 2,716,142 72.3% 3,628,888 2,596,060 71.5%47 064 - Temporary Borrowing 6,035,000 1,695,455 28.1% 4,356,000 3,985,791 1,454,950 36.5% 1,874,192 168,000 9.0%
48 Sum: 1,541,115,367 1,026,389,138 66.6% 1,476,671,980 1,484,365,085 974,520,345 65.7% 1,351,493,014 971,513,738 71.9%
49 B. Debt Service 261,618,067 200,338,416 76.6% 269,265,256 260,604,416 195,969,716 75.2% 266,962,226 180,848,779 67.7%
50 C. Charter Schools
51 067 - Renaissance Charters 199,491,289 139,776,528 70.1% 184,382,010 169,593,168 129,264,305 76.2% 167,152,892 124,382,082 74.4%
52 068 - All Other Philadelphia Charters 554,307,798 402,924,934 72.7% 509,193,082 471,126,341 359,823,351 76.4% 475,203,576 352,955,621 74.3%
53 069 - Non-Philadelphia Charters - Cyber Charters 76,635,342 59,604,026 77.8% 78,585,908 70,554,337 52,571,293 74.5% 73,072,002 52,996,394 72.5%
54 Sum: 830,434,429 602,305,489 72.5% 772,161,000 711,273,846 541,658,949 76.2% 715,428,470 530,334,097 74.1%
TABLE OF-3
QUARTERLY SCHOOL MANAGER REPORT
FUNCTIONAL EXPENDITURE SUMMARY
OPERATING FUNDS
FISCAL YEAR 2017 FISCAL YEAR 2016 FISCAL YEAR 2015
FOR THE PERIOD ENDED MARCH 31, 2017
Page 5 of 45

A B C D E F G H I J K
YTD YTD YTD
DEPARTMENT Adopted YTD As % of Current Full Yr YTD As % of Full Yr YTD As % of
Budget March 31, 2017 Adopted Budget Projection Actual March 31, 2016 Current Proj. Actual March 31, 2015 Full Yr Actuals
TABLE OF-3
QUARTERLY SCHOOL MANAGER REPORT
FUNCTIONAL EXPENDITURE SUMMARY
OPERATING FUNDS
FISCAL YEAR 2017 FISCAL YEAR 2016 FISCAL YEAR 2015
FOR THE PERIOD ENDED MARCH 31, 2017
55 D. Charter Transportation 36,343,175 23,631,904 65.0% 37,440,216 33,543,964 25,413,200 75.8% 31,044,616 25,303,058 81.5%
56 E. Other Non District Operated Schools
57 071 - Education of Students in Institutional Placements2 75,450,867 7,922,350 10.5% 73,950,867 72,638,237 6,402,276 8.8% 70,318,835 13,863,793 19.7%
58 072 - Services to Non-Public Schools -- Regular 14,144,727 7,544,800 53.3% 14,058,880 14,229,948 7,268,508 51.1% 13,783,885 9,410,961 68.3%
59 073 - Services to Non-Public Schools -- Transportation 22,769,013 13,908,199 61.1% 22,769,013 20,944,695 14,975,814 71.5% 22,155,452 15,218,850 68.7%
60 Sum: 112,364,607 29,375,349 26.1% 110,778,760 107,812,880 28,646,598 26.6% 106,258,172 38,493,604 36.2%
F. Administration
61 077 - Chief Academic Support Office 1,592,461 1,275,855 80.1% 2,016,467 1,314,513 849,348 64.6% 1,079,689 710,337 65.8%
62 078 - Multilingual Curriculum & Programs Office 952,069 658,996 69.2% 910,689 660,934 478,081 72.3% 627,743 478,391 76.2%
63 079 - Curriculum & Assessment Office 1,429,677 1,308,183 91.5% 2,421,648 1,416,981 884,757 62.4% 1,028,875 764,021 74.3%
64 080 - Career & Technical Education Office 714,784 356,881 49.9% 668,744 665,481 316,652 47.6% 642,690 426,677 66.4%
65 081 - Instructional Enrichment & Support Office 1,401,662 701,928 50.1% 1,060,736 1,222,700 869,795 71.1% 1,150,437 808,637 70.3%
66 082 - Specialized Services Office 286,123 260,683 91.1% 310,747 234,130 197,034 84.2% 274,071 181,604 66.3%
67 083 - Early Childhood Education Office 1,305,771 849,401 65.0% 1,251,276 1,090,072 751,854 69.0% 983,917 697,106 70.9%
68 087 - Student Placement & Enrollment 795,829 525,000 66.0% 814,579 646,589 471,213 72.9% 701,482 503,730 71.8%
69 088 - Student Rights & Responsiblities 1,539,909 975,550 63.4% 1,480,918 1,307,551 931,577 71.2% 1,263,986 888,651 70.3%
70 089 - Prevention & Intervention 1,110,146 636,221 57.3% 1,030,005 735,391 459,111 62.4% 571,956 318,630 55.7%
71 091 - Student Records 963,980 411,212 42.7% 671,066 564,695 360,136 63.8% 623,183 409,390 65.7%
72 092 - School Safety, Climate & Culture 101,503 11,259 11.1% 56,977 40,380 46,574 115.3% 2,800 2,800 100.0%
73 094 - Parent & Family Engagement 2,429,393 1,749,575 72.0% 2,515,119 2,344,438 1,616,016 68.9% 3,200,741 2,249,124 70.3%
74 097 - CFO Office 370,143 283,463 76.6% 840,801 129,445 42,802 33.1% 289,138 217,544 75.2%
75 098 - Management and Budget Office 1,895,764 1,179,975 62.2% 1,949,419 1,580,018 963,397 61.0% 1,717,614 1,098,786 64.0%
76 099 - Accounting & Audit Coordination 1,572,820 959,597 61.0% 1,484,949 2,134,769 911,474 42.7% 1,990,822 940,891 47.3%
77 100 - Financial Services 3,638,248 2,152,114 59.2% 3,182,081 2,863,171 2,026,286 70.8% 2,773,068 1,960,918 70.7%
78 101 - Grant Compliance and Fiscal Services 322,273 208,299 64.6% 424,120 1,760,230 172,220 9.8% 1,816,406 262,712 14.5%
79 104 - Procurement Office 1,366,811 714,806 52.3% 1,115,855 1,334,574 947,827 71.0% 1,519,534 1,647,047 108.4%
80 105 - Facilities & Operations 6,420,525 4,119,006 64.2% 6,742,188 5,201,155 3,450,298 66.3% 4,944,814 3,714,835 75.1%
81 107 - Transportation -- Administration 3,318,711 2,735,363 82.4% 4,136,711 2,880,681 1,974,353 68.5% 2,842,726 2,084,506 73.3%
82 108 - Warehouse - Distribution 1,135,970 674,628 59.4% 1,221,494 1,062,369 686,849 64.7% 882,463 593,133 67.2%
83 112 - Office of Chief Talent Officer 1,302,994 1,053,679 80.9% 1,226,742 1,118,175 751,388 67.2% 716,990 520,752 72.6%
84 114 - Educator Effectiveness 1,054,025 395,492 37.5% 711,075 523,633 414,571 79.2% 437,988 358,161 81.8%
85 115 - Organizational Development - - N/A - - 2,950 N/A - - N/A
86 116 - Strategic Placement 2,857,225 2,093,819 73.3% 3,350,263 2,186,187 1,468,417 67.2% 2,032,608 1,443,061 71.0%
87 117 - Employee Relations 624,831 279,266 44.7% 488,457 501,245 373,033 74.4% 563,042 393,515 69.9%
88 118 - Employee Supports 3,078,042 2,010,340 65.3% 2,629,279 2,917,049 2,020,587 69.3% 2,637,697 1,802,461 68.3%
89 122 - Office of Chief IT Officer 384,370 253,717 66.0% 353,416 344,682 246,626 71.6% 336,253 243,747 72.5%
90 123 - Information Systems 4,676,785 3,266,878 69.9% 4,620,799 3,889,724 2,793,329 71.8% 4,485,905 3,800,074 84.7%
91 125 - Technology Services 8,943,842 4,684,658 52.4% 9,642,844 8,537,192 4,198,113 49.2% 8,015,176 6,397,280 79.8%
92 126 - Information Technology - - N/A - - 1,103 N/A - 2,704 N/A
93 127 - IT Help Desk & Tech Support 1,420,464 943,613 66.4% 1,463,532 1,382,132 897,590 64.9% 1,327,325 862,405 65.0%
94 128 - Office of Education Technology 1,112,869 514,137 46.2% 707,858 1,123,302 683,381 60.8% 707,462 511,051 72.2%
95 129 - Research & Evaluation 503,805 517,672 102.8% 502,761 357,812 792,298 221.4% 242,880 602,838 248.2%
96 131 - Office of the Superintendent - CEO 3,288,539 1,834,041 55.8% 3,570,054 2,415,386 1,419,218 58.8% 1,382,135 960,940 69.5%
97 132 - Chief Safety Officer 645,140 307,920 47.7% 517,628 499,056 354,230 71.0% 458,939 329,891 71.9%
98 133 - Strategy Delivery Unit 377,325 180,767 47.9% 271,785 337,146 257,563 76.4% 424,250 295,575 69.7%
99 134 - Strategic Partnerships Office 548,463 304,605 55.5% 387,774 905,763 276,120 30.5% 234,439 235,368 100.4%
100 135 - District Performance Office 1,129,417 628,681 55.7% 1,141,235 734,400 473,362 64.5% 754,918 539,765 71.5%
101 136 - General Counsel's Office 10,653,772 3,798,261 35.7% 7,751,755 9,679,413 5,049,989 52.2% 11,417,978 6,566,765 57.5%
102 140 - School Reform Commission 786,271 449,413 57.2% 729,882 661,934 457,734 69.2% 802,848 549,776 68.5%
103 141 - Auditing Services 350,083 238,088 68.0% 360,351 326,665 234,353 71.7% 406,406 313,226 77.1%
104 142 - Inspector General's Office 843,054 524,003 62.2% 896,536 461,586 278,471 60.3% 366,826 293,180 79.9%
105 143 - Charter Schools Office 1,351,316 754,353 55.8% 1,382,425 1,003,105 695,357 69.3% 839,451 626,370 74.6%
Page 6 of 45

A B C D E F G H I J K
YTD YTD YTD
DEPARTMENT Adopted YTD As % of Current Full Yr YTD As % of Full Yr YTD As % of
Budget March 31, 2017 Adopted Budget Projection Actual March 31, 2016 Current Proj. Actual March 31, 2015 Full Yr Actuals
TABLE OF-3
QUARTERLY SCHOOL MANAGER REPORT
FUNCTIONAL EXPENDITURE SUMMARY
OPERATING FUNDS
FISCAL YEAR 2017 FISCAL YEAR 2016 FISCAL YEAR 2015
FOR THE PERIOD ENDED MARCH 31, 2017
106 151 - Learning Network Schools 2,833,053 1,845,072 65.1% 2,883,916 1,930,945 1,360,206 70.4% 1,563,765 1,117,362 71.5%
107 153 - New School Models - - N/A - - 14,098 N/A 168,627 122,502 72.6%
108 154 - Alternative Education Admin 1,615,117 916,641 56.8% 1,457,993 1,338,745 902,572 67.4% 970,785 719,336 74.1%
109 155 - Chief of Schools Office 1,229,694 561,715 45.7% 1,117,142 951,671 649,478 68.2% 212,892 123,540 58.0%
110 Sum: 86,275,066 51,104,830 59.2% 84,472,091 75,317,212 46,473,788 61.7% 72,435,741 50,691,113 70.0%
111 G. Undistributed Budgetary Adjustments (7,769,060) (637,415) 8.2% (14,629,421) (8,533,503) (140,823) 1.7% (40,462,985) (253,926) 0.6%
112 Total Operating Expenditures 2,860,381,651 1,932,507,711 67.6% 2,736,159,881 2,664,383,902 1,812,541,774 68.0% 2,503,159,253 1,796,930,464 71.8%
113 Other Financing Uses (excluding Refunding) 2,252,349 - 0.0% 2,702,349 1,661,939 33,360 2.0% 1,677,425 - 0.0%
114 Total Obligations & Other Uses (excluding Refunding) 2,862,634,000 1,932,507,711 67.5% 2,738,862,230 2,666,045,841 1,812,575,134 68.0% 2,504,836,678 1,796,930,464 71.7%
Source: School District of Philadelphia Budget System; School District of Philadelphia Finance Staff Estimates
1 The Fiscal Year 2017 Current Projection includes the amounts in the enacted State Budget, which shifted $38.6 million of operating expenditures to the Ready to Learn Grant.
2 Fiscal Year 2016 YTD expenditures are understated primarily due to a ($2.6) million negative accrual made for an anticipated late charge from the State for Private Residential Rehabilitative Institutions (PRRI).
Page 7 of 45

School District of Philadelphia
Quarterly School Manager Report
FOR THE PERIOD ENDED MARCH 31, 2017
CASH FLOW REPORTS
FOR FY 2017

(in thousands)
JUL AUG SEP OCT NOV DEC JAN FEB MAR APR MAY JUN TOTAL
Balance, Beginning of Month 331,846 169,943 180,289 31,294 29,627 (112,417) (108,162) (152,069) 194,986 231,865 279,243 178,395 331,846
Receipts
Gross Commonwealth
Subsidies 21,499 183,460 57,445 175,242 25,231 221,822 24,295 166,699 73,932 166,097 2,796 297,252 1,415,770
Less: Debt Service Withheld 0 (11,143) 0 (24,333) 0 0 0 (11,143) 0 (24,333) 0 0 (70,952)
Net Commonwealth Subsidies 21,499 172,317 57,445 150,909 25,231 221,822 24,295 155,556 73,932 141,764 2,796 297,252 1,344,818
Intermediate Unit 0 41,633 6,724 11,374 2,784 6,846 22,058 2,010 8,048 569 19,524 7,092 128,662
Local Receipts 33,764 35,611 43,625 45,021 41,134 46,623 89,450 388,287 221,145 91,224 60,215 155,573 1,251,672
Categorical Grants 17,556 25,049 34,368 29,240 22,060 36,335 59,910 27,708 28,331 26,051 37,864 38,855 383,327
Other 10,408 2,391 2,944 7,976 10,721 23,722 9,839 9,700 14,503 12,070 10,465 13,997 128,736
Total Receipts 83,227 277,001 145,106 244,520 101,930 335,348 205,552 583,261 345,959 271,678 130,864 512,769 3,237,215
Disbursements
Salaries 102,677 88,288 78,307 84,314 79,306 99,438 92,080 73,597 76,401 73,597 73,597 96,692 1,018,294
Retirement - employer 0 0 65,061 0 0 66,344 0 0 79,056 0 0 66,320 276,781
Debt Service - Deposits 15,233 28,432 17,063 39,451 15,086 23,810 15,542 25,818 18,916 38,986 16,930 18,119 273,386
Debt Service - Withheld 0 (11,143) 0 (24,333) 0 0 0 (11,143) 0 (24,333) 0 0 (70,952)
Accounts Payable 127,220 161,078 133,670 146,755 149,582 141,501 141,837 147,934 134,707 136,050 141,185 135,285 1,696,804
Total Disbursements 245,130 266,655 294,101 246,187 243,974 331,093 249,459 236,206 309,080 224,300 231,712 316,416 3,194,313
Balance, End of Month 169,943 180,289 31,294 29,627 (112,417) (108,162) (152,069) 194,986 231,865 279,243 178,395 374,748 374,748
Notes, outstanding end of month 375,000 375,000 375,000 375,000 375,000 375,000 375,000 375,000 375,000 375,000 375,000 0 0
Sinking Fund Deposits/Principal 0 0 0 0 0 0 0 0 0 0 0 375,000 375,000
Balance, End of Month,
Including Notes 544,943 555,289 406,294 404,627 262,583 266,838 222,931 569,986 606,865 654,243 553,395 374,748 374,748
Source: FY 2017 Adopted Budget with Adjustments By Finance Staff for Timing of Related Revenues and Expenditures, Receivables, Payables, and Non-budgeted Receipt and Disbursement Items
TABLE CF-1
QUARTERLY SCHOOL MANAGER REPORT
ADOPTED CASH FLOW FOR FY 2017
Page 9 of 45

(in thousands) ADOPTED
ACTUAL ACTUAL ACTUAL ACTUAL ACTUAL ACTUAL ACTUAL ACTUAL ACTUAL ACTUAL BUDGET VARIANCE
THRU THRU FAV / (UNFAV)
JUL AUG SEP OCT NOV DEC JAN FEB MAR APR MAY JUN TOTAL March 31, 2017 March 31, 2017 VS. ADOPTED
Balance, Beginning of Month 338,640 186,709 170,466 56,103 (24,151) (118,704) (93,683) (141,955) 120,039 197,305 199,349 88,427 338,640 338,640 331,846 6,794
Receipts
Gross Commonwealth
Subsidies 21,724 152,237 44,299 150,281 49,579 201,704 19,213 157,151 66,790 154,275 8,554 336,815 1,362,622 862,978 949,625 (86,647)
Less: Debt Service Withheld 0 (11,143) 0 (24,340) 0 0 0 (11,143) 0 (36,353) 0 0 (82,979) (46,626) (46,619) (7)
Net Commonwealth Subsidies 21,724 141,094 44,299 125,941 49,579 201,704 19,213 146,008 66,790 117,922 8,554 336,815 1,279,643 816,352 903,006 (86,654)
Intermediate Unit 355 41,163 15,724 0 4,340 6,390 20,493 3,383 7,092 0 18,455 6,320 123,715 98,940 101,477 (2,537)
Local Receipts 34,806 35,899 43,938 29,561 45,864 48,934 94,038 328,052 283,927 77,894 60,532 153,857 1,237,302 945,019 944,660 359
Categorical Grants 18,531 24,396 30,502 30,721 35,613 71,964 43,227 25,602 31,062 30,044 40,101 32,385 414,148 311,618 280,557 31,061
Other 8,775 9,551 3,247 2,045 6,162 18,231 17,037 6,499 19,829 12,304 12,828 24,172 140,680 91,376 92,204 (828)
Total Receipts 84,191 252,103 137,710 188,268 141,558 347,223 194,008 509,544 408,700 238,164 140,470 553,549 3,195,488 2,263,305 2,321,904 (58,599)
Disbursements
Salaries 98,367 94,955 80,836 77,956 80,349 100,903 92,812 76,669 79,325 79,363 78,407 98,288 1,038,230 782,172 774,408 (7,764)
Retirement - Employer 0 0 53,075 0 250 68,528 0 0 75,403 0 0 64,093 261,349 197,256 210,461 13,205
Debt Service - Deposits 14,536 29,173 15,888 40,590 16,209 26,359 19,057 29,065 21,451 54,074 20,511 20,487 307,400 212,328 199,351 (12,977)
Debt Service - Withheld 0 (11,143) 0 (24,340) 0 0 0 (11,143) 0 (36,353) 0 0 (82,979) (46,626) (46,619) 7
Accounts Payable 123,219 155,361 102,274 174,316 139,303 126,412 130,411 152,959 155,255 139,036 152,474 167,421 1,718,441 1,259,510 1,284,284 24,774
Total Disbursements 236,122 268,346 252,073 268,522 236,111 322,202 242,280 247,550 331,434 236,120 251,392 350,289 3,242,441 2,404,640 2,421,885 17,245
Balance, End of Month 186,709 170,466 56,103 (24,151) (118,704) (93,683) (141,955) 120,039 197,305 199,349 88,427 291,687 291,687 197,305 231,865 (34,560)
Notes, outstanding end of month 375,000 375,000 375,000 375,000 375,000 375,000 375,000 375,000 375,000 375,000 375,000 0 0 375,000 375,000 0
Sinking Fund Deposits/Principal 0 0 0 0 0 0 0 0 0 0 0 375,000 375,000 0 0 0
Balance, End of Month,
Including Notes 561,709 545,466 431,103 350,849 256,296 281,317 233,045 495,039 572,305 574,349 463,427 291,687 291,687 572,305 606,865 (34,560)
Source: FY 2017 Adopted Cash Flow; Actual Transactions from District's Financial Systems; Finance Staff Estimates Based on Known and Assumed Changes for Timing and Future Cash Receipts and Disbursement Amounts
TABLE CF-2
QUARTERLY SCHOOL MANAGER REPORT
YEAR TO DATE CASH FLOW
FOR THE PERIOD ENDED MARCH 31, 2017
Page 10 of 45

VENDOR # VENDOR NAME VOUCHER-AMT
0096351 INDEPENDENCE BLUE CROSS 71,871,870
0044603 KEYSTONE HEALTH PLAN EAST INC 55,531,484
0096338 PHILA FEDERATION OF TEACHERS 38,110,686
0080945 SOUTHEASTERN PA TRANSPORTATION 27,881,753
1017489 BUILDING SERVICE 32BJ BENEFIT 21,746,295
C100004 PHILA PERFORMING ARTS CHARTER 20,401,642
1002803 PEARSON EDUCATION INC 20,227,973
C100093 OLNEY CHARTER HIGH SCHOOL 17,634,593
C100061 AGORA CYBER CHARTER SCHOOL 16,586,154
C100025 FIRST PHILADELPHIA CHARTER 16,134,928
0050605 MARAMONT CORP 15,524,350
C100095 MASTERY CHARTER SCHOOLS- GRATZ 15,218,307
1022085 DURHAM SCHOOL SERVICES LP 13,334,960
C100040 COMMONWEALTH CONNECTIONS 12,744,846
1003843 BANK OF AMERICA NA -VOID- 12,643,596
0004529 APPLE COMPUTER 12,460,234
C100008 NUEVA ESPERANZA CHARTER SCH 12,362,138
1023700 KELLY SERVICES INC 11,119,177
C100059 MASTERY CHARTER AT THOMAS 11,065,740
C100009 NEW FOUNDATIONS CHARTER SCH 11,055,867
C024011 COMMUNITY ACADEMY OF PHILA 10,927,218
0038289 HOUGHTON MIFFLIN HARCOURT 10,609,502
C028008 PHILADELPHIA ACADEMY 10,465,268
C028006 MAST MATH SCIENCE & TECHNOLOGY 10,277,747
C028009 MASTERY CHARTER SCHOOL - HARDY 10,116,611
C100003 MARIANA BRACETTI ACADEMY 9,992,136
1011691 PHILLY TRANSPORTATION LLC 9,654,564
0005782 CHESTER COUNTY INTERMEDIATE 9,591,595
1022937 MAT BUS CORP 9,456,801
C100007 FRANKLIN TOWNE CHARTER 9,222,469
C100081 TACONY ACADEMY CHARTER SCHOOL 9,050,568
C028002 FREIRE CHARTER SCHOOL 8,817,539
0015426 CHILDREN'S LITERACY INITIATIVE 8,717,075
C100101 PHILA. CHARTER FOR THE ARTS 8,716,905
C100024 WISSAHICKON CHARTER SCHOOL 8,660,210
C024045 WEST OAK LANE CHARTER SCHOOL 8,362,397
C100067 MASTERY CHARTER- PICKETT 8,177,074
1016134 PMA MANAGEMENT CORPORATION 8,117,983
C100102 MEMPHIS ST ACADEMY CHARTER AT 8,037,487
C100030 KIPP CHARTER SCHOOL 7,697,344
C100088 ASPIRA STETSON CHARTER SCH INC 7,651,044
C100084 MASTERY CHARTER SCHOOL- HARRITY 7,561,939
0000271 COMMONWEALTH OF PENNSYLVANIA 7,186,222
C100073 ANTONIA PANTOJA CHARTER SCHOOL 7,161,831
C100078 FRANKLIN TOWNE ELEMENTARY 7,144,554
1011086 ROBERT GANTER CONTRACTORS INC 7,099,263
C100089 MASTERY CHARTER SCHOOL- F. DOUGLAS 7,086,425
1008008 THE CAMELOT SCHOOLS OF PA 6,941,692
C100063 MASTERY CHARTER SCHOOL- SHOEMAKER 6,823,669
TABLE CF-3
QUARTERLY SCHOOL MANAGER REPORT
VENDOR PAYMENTS YTD IN EXCESS OF $100,000
FOR THE PERIOD ENDED MARCH 31, 2017
CASH ACTIVITY
Page 11 of 45
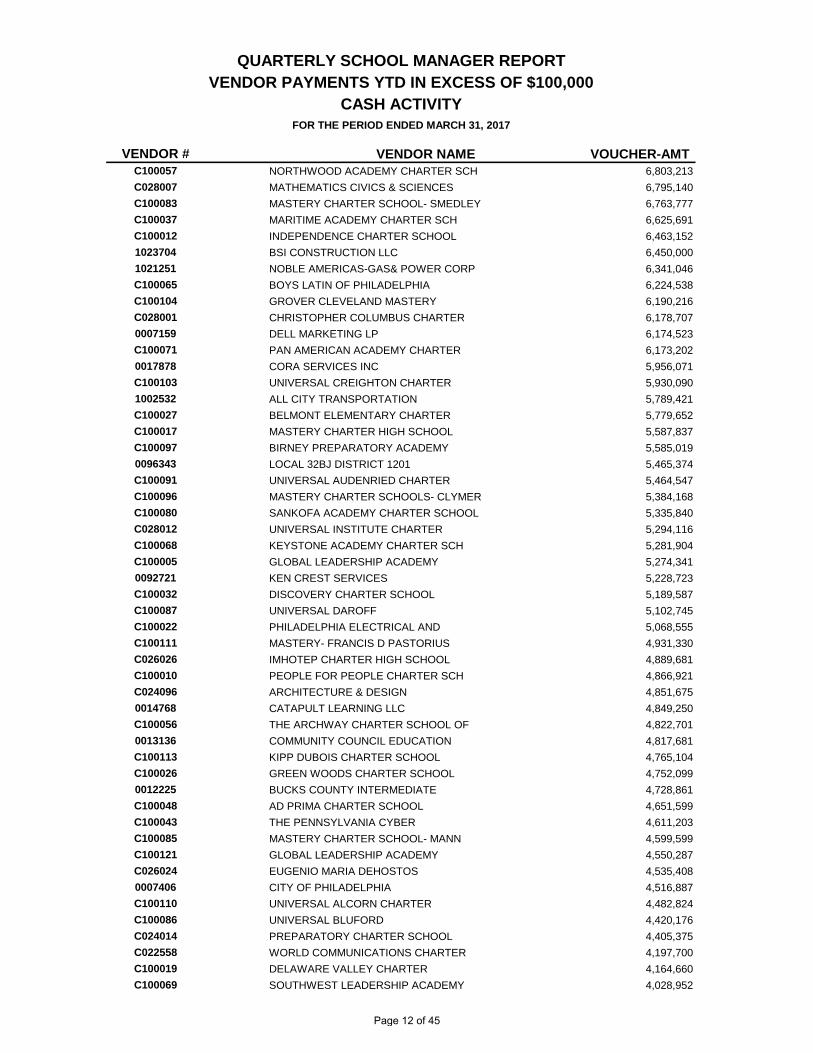
VENDOR # VENDOR NAME VOUCHER-AMT
QUARTERLY SCHOOL MANAGER REPORT
VENDOR PAYMENTS YTD IN EXCESS OF $100,000
FOR THE PERIOD ENDED MARCH 31, 2017
CASH ACTIVITY
C100057 NORTHWOOD ACADEMY CHARTER SCH 6,803,213
C028007 MATHEMATICS CIVICS & SCIENCES 6,795,140
C100083 MASTERY CHARTER SCHOOL- SMEDLEY 6,763,777
C100037 MARITIME ACADEMY CHARTER SCH 6,625,691
C100012 INDEPENDENCE CHARTER SCHOOL 6,463,152
1023704 BSI CONSTRUCTION LLC 6,450,000
1021251 NOBLE AMERICAS-GAS& POWER CORP 6,341,046
C100065 BOYS LATIN OF PHILADELPHIA 6,224,538
C100104 GROVER CLEVELAND MASTERY 6,190,216
C028001 CHRISTOPHER COLUMBUS CHARTER 6,178,707
0007159 DELL MARKETING LP 6,174,523
C100071 PAN AMERICAN ACADEMY CHARTER 6,173,202
0017878 CORA SERVICES INC 5,956,071
C100103 UNIVERSAL CREIGHTON CHARTER 5,930,090
1002532 ALL CITY TRANSPORTATION 5,789,421
C100027 BELMONT ELEMENTARY CHARTER 5,779,652
C100017 MASTERY CHARTER HIGH SCHOOL 5,587,837
C100097 BIRNEY PREPARATORY ACADEMY 5,585,019
0096343 LOCAL 32BJ DISTRICT 1201 5,465,374
C100091 UNIVERSAL AUDENRIED CHARTER 5,464,547
C100096 MASTERY CHARTER SCHOOLS- CLYMER 5,384,168
C100080 SANKOFA ACADEMY CHARTER SCHOOL 5,335,840
C028012 UNIVERSAL INSTITUTE CHARTER 5,294,116
C100068 KEYSTONE ACADEMY CHARTER SCH 5,281,904
C100005 GLOBAL LEADERSHIP ACADEMY 5,274,341
0092721 KEN CREST SERVICES 5,228,723
C100032 DISCOVERY CHARTER SCHOOL 5,189,587
C100087 UNIVERSAL DAROFF 5,102,745
C100022 PHILADELPHIA ELECTRICAL AND 5,068,555
C100111 MASTERY- FRANCIS D PASTORIUS 4,931,330
C026026 IMHOTEP CHARTER HIGH SCHOOL 4,889,681
C100010 PEOPLE FOR PEOPLE CHARTER SCH 4,866,921
C024096 ARCHITECTURE & DESIGN 4,851,675
0014768 CATAPULT LEARNING LLC 4,849,250
C100056 THE ARCHWAY CHARTER SCHOOL OF 4,822,701
0013136 COMMUNITY COUNCIL EDUCATION 4,817,681
C100113 KIPP DUBOIS CHARTER SCHOOL 4,765,104
C100026 GREEN WOODS CHARTER SCHOOL 4,752,099
0012225 BUCKS COUNTY INTERMEDIATE 4,728,861
C100048 AD PRIMA CHARTER SCHOOL 4,651,599
C100043 THE PENNSYLVANIA CYBER 4,611,203
C100085 MASTERY CHARTER SCHOOL- MANN 4,599,599
C100121 GLOBAL LEADERSHIP ACADEMY 4,550,287
C026024 EUGENIO MARIA DEHOSTOS 4,535,408
0007406 CITY OF PHILADELPHIA 4,516,887
C100110 UNIVERSAL ALCORN CHARTER 4,482,824
C100086 UNIVERSAL BLUFORD 4,420,176
C024014 PREPARATORY CHARTER SCHOOL 4,405,375
C022558 WORLD COMMUNICATIONS CHARTER 4,197,700
C100019 DELAWARE VALLEY CHARTER 4,164,660
C100069 SOUTHWEST LEADERSHIP ACADEMY 4,028,952
Page 12 of 45

VENDOR # VENDOR NAME VOUCHER-AMT
QUARTERLY SCHOOL MANAGER REPORT
VENDOR PAYMENTS YTD IN EXCESS OF $100,000
FOR THE PERIOD ENDED MARCH 31, 2017
CASH ACTIVITY
C024094 LABORATORY CHARTER SCHOOL OF 4,026,613
0099509 YELLOWBIRD BUS CO INC 3,952,283
C100120 MASTERY CHARTER SCHOOL 3,882,276
C024001 HARAMBEE INSTITUTE OF SCIENCE 3,849,136
C100018 RUSSELL BYERS CHARTER SCHOOL 3,843,807
C100042 PENNSYLVANIA VIRTUAL CHARTER 3,812,890
C100058 FOLK ARTS CULTURAL TREASURES 3,737,727
1021646 BRIGHTSIDE ACADEMY INC 3,709,750
0026975 CORPORATE NETWORKING INC 3,607,569
1008629 INTERNATIONAL EDUCATION & 3,573,142
0013806 CAD ELECTRIC INC 3,563,541
1017943 HERMAN GOLDNER CO INC 3,552,256
0025456 ELWYN INSTITUTE 3,490,256
C024048 ALLIANCE FOR PROGRESS 3,474,581
0025454 ELWYN INC 3,458,356
0063330 PECO 3,318,293
C100092 UNIVERSAL VARE CHARTER 3,288,560
C100052 PA LEADERSHIP CHARTER SCHOOL 3,272,191
C100046 KHEPERA CHARTER SCHOOL 3,226,659
1017132 TE CONSTRUCTION SERVICES LLC 3,189,660
0092532 VISUAL SOUND INC 3,186,238
C100090 ASPIRA BILINGUAL CYBER CHARTER 3,150,844
1021789 PETROLEUM TRADERS CORP 3,115,123
0020647 MCGRAW-HILL SCHOOL EDUCATION 3,079,727
0081240 SPECIAL PEOPLE IN 3,079,487
C100076 EASTERN UNIVERSITY ACADEMY 3,060,324
C100006 RICHARD ALLEN PREPARATORY 2,987,800
1018170 GCA SERVICES CORP 2,963,752
1007205 EBS HEALTHCARE 2,962,421
0010318 ASOCIACION DE PUERTORRIQUENOS 2,939,915
C100116 MAST COMMUNITY CHARTER 2,914,028
0097357 WORDSWORTH ACADEMY 2,814,320
C100079 KIPP WEST PHILADELPHIA PREP 2,732,471
1023411 OFFICE SOLUTIONS INC 2,729,761
0005215 ASPIRA INC OF PENNSYLVANIA 2,679,447
1023692 PERFORMANCE FOOD GROUP INC DBA 2,607,828
C100023 WEST PHILADELPHIA ACHIEVEMENT 2,560,137
1023204 INFINITE CAMPUS 2,531,358
C100118 TECH FREIRE CHARTER SCHOOL 2,517,330
0013937 NORTHWESTERN WOODHAVEN 2,469,639
1021943 IMPERIAL BAG & PAPER CO LLC 2,445,000
1004991 COMMUNITIES IN SCHOOLS 2,431,281
1007633 SECURITY AND DATA TECHNOLOGIES 2,303,796
1020888 CNE GAS HOLDINGS INC 2,257,684
0039309 HYDE ELECTRIC CORPORATION 2,251,231
C100117 INDEPENDENCE CHARTER 2,208,391
1016018 STRATEGIC PRODUCTS & SERVICES 2,179,944
1024216 CALPINE COPORATION 2,170,909
C024013 MULTI-CULTURAL ACADEM 2,169,068
C028013 YOUNG SCHOLARS CHARTER SCHOOL 2,120,443
1020151 YOUR CHILD'S WORLD LEARNING 2,095,000
Page 13 of 45

VENDOR # VENDOR NAME VOUCHER-AMT
QUARTERLY SCHOOL MANAGER REPORT
VENDOR PAYMENTS YTD IN EXCESS OF $100,000
FOR THE PERIOD ENDED MARCH 31, 2017
CASH ACTIVITY
1023019 RELIANT TRANSPORTATION INC 2,090,174
1016628 WORLDGATE LLC 2,084,141
1013965 MCCAFFERTY FORD SALES INC 2,004,990
C100028 SCHOOL LANE CHARTER SCHOOL 1,989,620
1017506 EMCOR SERVICES-FLUIDICS 1,981,145
1019669 CPC MANAGEMENT INC 1,966,144
0014408 OFFICE DEPOT 1,912,712
1014052 CONNER STRONG & BUCKELEW 1,907,949
C024000 PHILA YOUTH FOR CHANGE CHARTER 1,907,742
0089513 UNITED STATES ROOFING CORP 1,871,292
0022020 DOLAN MECHANICAL INC 1,784,292
C024021 INQUIRY CHARTER SCHOOL 1,716,280
0017869 RICOH USA INC 14742 1,678,367
1004586 CARNEGIE LEARNING INC 1,658,738
1006882 FIVE STAR 1,653,361
1003656 AMERICAN READING COMPANY 1,653,185
C100107 ESPERANZA CYBER CHARTER 1,653,077
1023659 GREAT MINDS 1,635,760
1021709 DENNIS COREN 1,609,972
0026589 NORRIS SQUARECOMMUNITY 1,582,142
1006971 PROGRESSUS THERAPY INC 1,558,596
0027102 KINDER ACADEMY, INC 1,531,625
1017916 SOLID WASTE SERVICES INC DBA 1,526,910
C100047 PHILADELPHIA MONTESSORI 1,509,373
0096290 PHILA FEDERATION OF TEACHERS 1,498,398
0008513 SCHOOL SPECIALTY 1,494,618
1023752 MPC BUS CORP 1,494,618
0007517 BALFORD FARMS 1,448,872
0016807 BANCROFT NEUROHEALTH 1,396,748
0063354 PHILADELPHIA GAS WORKS 1,392,370
0016364 JACK COHEN & CO INC 1,353,323
C100122 REACH CYBER CHARTER SCHOOL 1,353,103
0062530 PENNSYLVANIA SCHOOL FOR 1,323,026
C100108 ACHIEVING COMMUNITY TRANSFORM. 1,316,233
0034487 GROVE CITY AREA SCHOOL DIST 1,314,425
0053922 MULHERN ELECTRIC CO 1,313,470
1015462 ALGEN HOLDING COMPANY DBA 1,286,125
1001261 LEXIA LEARNING SYSTEMS INC 1,280,320
0024052 E J ELECTRIC INC 1,262,882
1013057 GRACE NEIGHBORHOOD DEV CORP 1,248,935
0017200 COMMONWEALTH OF PA 1,236,789
1024198 FLASTER GREENBERG PC 1,232,778
1009298 2114 ARCH STREET ASSOC L P 1,222,398
1016422 BIG PICTURE PHILADELPHIA 1,202,400
0099476 CHILDREN'S VILLAGE DAY CARE 1,200,688
1008910 PORTER'S DAY CARE & EDU CTR 1,199,113
0003976 SCHOLASTIC MAGAZINES INC 1,182,002
1019622 FIRST STUDENT INC 1,175,458
1000182 PA SCDU - VOID 1,170,291
1010681 ELLIOTT-LEWIS CORPORATION 1,133,540
C100053 PENNSYLVANIA DISTANCE 1,117,054
Page 14 of 45

VENDOR # VENDOR NAME VOUCHER-AMT
QUARTERLY SCHOOL MANAGER REPORT
VENDOR PAYMENTS YTD IN EXCESS OF $100,000
FOR THE PERIOD ENDED MARCH 31, 2017
CASH ACTIVITY
1014907 CARING PEOPLE ALLIANCE INC 1,113,700
1016220 PEPPER ENVIRONMENTAL 1,102,175
1022997 S4TEACHERS LLC 1,095,459
1002529 FERGUSON ENTERPRISES INC 1,093,391
0004314 WOODS SERVICES 1,087,490
C100051 ACHIEVEMENT HOUSE CYBER 1,084,733
0012652 LIGHTHOUSE 1,071,750
1023684 ALLSTATES MECHANICAL LTD 1,062,342
0062410 COMMONWEALTH OF PENNA 1,010,661
1000730 BUTLER AREA SCHOOL DISTRICT 1,002,983
1018475 INTERNAL REVENUE SVC- VOID 988,397
1002610 AETNA LIFE INSURANCE CO 977,652
1024137 TEMCO BLDG MAINTENANCE INC 965,995
1021644 TODAY'S CHILD LEARNING CENTERS 950,767
1012006 18 SOUTH SEVENTH ST ASSOC LP 950,539
1023025 SEASHORE FRUIT & PRODUCE CO 927,358
0011149 MCANDREWS LAW OFFICES PC 911,988
1002773 PHOENIX CAPITAL PARTNERS LLP 905,000
1011073 SCHOLARCHIP CARD LLC 900,407
1000750 DIVERSIFIED COMMUNITY SERVICES 886,984
0020207 FOX ROTHSCHILD 882,697
0002261 PEARSON 872,190
0073833 SCHNEIDER RESTORATIONS INC 867,889
0012579 KEM PARTNERS INC 866,444
1022148 BWA ARCHITECTURE + PLANNING PC 857,098
0002703 CLASS 1 BUS COMPANY INC 853,968
1019876 A-1 SCHOOL BUS LLC 853,833
1000395 OPPORTUNITIES INDUSTRIALIZAT'N 842,668
0024118 EASTER SEALS OF 837,020
1002455 TYSON FOODS INC 832,593
1023053 ROBERT MICHAELS & ASSOCIATES 826,794
1023701 BRIGHTLINE CONSTRUCTION INC 819,492
1022004 COMPASSLEARNING.INC 811,373
1005191 WYNCOTE ACADEMY 807,520
1002703 PHILADELPHIA FREEDOM 802,603
1002327 VERIZON 751,638
0010404 FEDERATION DAY CARE SERVICES 744,250
1020150 LITTLE PEOPLE'S VILLAGE 736,250
1022931 PREMIER BUILDING RESTORATION 724,566
1003341 UNITED CONCORDIA LIFE &HEALTH 722,834
0034266 GREEN TREE SCHOOL 715,651
1014910 DSM SERVICES LLC 701,871
0020779 DELAWARE COUNTY INTERMEDIATE 696,824
1019650 DEPENDABILITY COMPANY 693,107
0025591 THALHEIMER & PALUMBO PC 686,212
1010690 ECKERT SEAMANS CHERIN & 684,796
0015684 CITY OF PHILADELPHIA 682,516
1000200 CENGAGE LEARNING 678,272
0003365 FOLLETT SCHOOL SOLUTIONS INC 673,846
C100119 KIPP WEST PHILADELPHIA 667,798
1023712 FIDELITY NATIONAL INFORMATION 659,766
Page 15 of 45

VENDOR # VENDOR NAME VOUCHER-AMT
QUARTERLY SCHOOL MANAGER REPORT
VENDOR PAYMENTS YTD IN EXCESS OF $100,000
FOR THE PERIOD ENDED MARCH 31, 2017
CASH ACTIVITY
1013058 TOTAL CHILDCARE SYSTEMS INC 622,500
0027497 YOUTH EMPOWERMENT SERVICES 621,646
1014051 THE QUAKER SCHOOL AT HORSHAM 617,874
1014138 LABE SALES INC 608,633
0018741 CURRICULUM ASSOCIATES INC 607,309
1004114 NCS PEARSON INC 604,651
1011080 Y.A.L.E. SCHOOL INC 598,119
0074925 KARDON-NORTHEAST BRANCH 587,954
1013839 LAW OFFICE OF DAVID J BERNEY 587,654
C100036 21ST CENTURY CYBER CHARTER 581,076
0022602 FOUNDATIONS INC 576,557
1018555 THE COMPREHENSIVE LEARNING CTR 569,362
0017331 COMMUNITY COLLEGE OF PHILA 563,348
0005738 SCHOOL DIST OF UPPER DUBLIN 561,257
0085632 THERAPEUTIC CENTER 560,148
1005594 JENNIE-O TURKEY STORE INC 537,794
1015446 STRATFORD FRIENDS SCHOOL 536,510
0073081 SAGUE AUTO SERVICE INC 533,327
0016615 AP EXAMS 516,984
1021532 SMITH CONSTRUCTION CO OF 505,800
1022778 ARBITERSPORTS LLC 504,929
1023283 GESSLER CONSTRUCTION CO INC 502,605
1004762 HOUGHTON MIFFLIN HARCOURT 501,100
1013059 T.Y.L. II INC 498,000
1013347 HORIZON SOFTWARE INTL LLC 492,134
0020901 DEL-VAL INTERNATL TRUCKING 488,212
1006677 GEM MECHANICAL SERVICES INC 484,748
1014779 TEAM TUTOR LLC 481,375
1018017 RCM TECHNOLOGIES USA INC 477,934
0010741 PATHWAY SCHOOL 475,590
1003673 COMMUNITY EDUCATION ALLIANCE 465,500
0075379 SHERWIN WILLIAMS CO 465,156
0012623 CITY OF PHILADELPHIA 462,158
0063568 PHILA WAREHOUSING COLD STORAGE 461,573
1021645 CREATIVE LEARNING ENVIRONMENTS 457,188
1008912 TUNY HAVEN INTERNATIONAL 456,813
0061042 PACIFICO FORD INC 449,677
1004369 LEVIN LEGAL GROUP 448,993
0020172 COLONIAL ELECTRIC SUPPLY CO 446,420
0063372 PHILADELPHIA ACADEMIES INC 444,367
1023858 INPROCESS CONSULTING 443,290
1002799 THE SHEWARD PARTNERSHIP 442,332
1022950 HAKS LLC 439,501
0026098 D & H DISTRIBUTING CO INC 437,054
0026868 YOUTH ENRICHMENT PROGRAM INC 435,750
1023932 VISIONQUEST NATIONAL LTD 432,000
1024068 HAINES & ASSOCIATES & 425,000
0010405 CORESTAFF INC 423,634
1008570 ACHIEVE 3000 INC 421,409
1011392 THINK THROUGH LEARNING INC 418,919
1006528 PUBLIC CONSULTING GROUP 412,500
Page 16 of 45

VENDOR # VENDOR NAME VOUCHER-AMT
QUARTERLY SCHOOL MANAGER REPORT
VENDOR PAYMENTS YTD IN EXCESS OF $100,000
FOR THE PERIOD ENDED MARCH 31, 2017
CASH ACTIVITY
1018450 EARLY CHILDHOOD ENVIRONMENTS 409,688
0022294 LOW RISE ELEVATOR CO INC 404,727
1023276 THE FUND FOR THE SCHOOL 400,000
0002023 CDW-G GOVERNMENT INC 399,191
0022987 FINE KAPLAN & BLACK 397,815
0051954 EDWARD J MELONEY INC 393,897
1020182 CHILDSPACE DAYCARE CENTERS INC 391,875
1015662 BUCHANAN INGERSOLL & ROONEY PC 390,341
0014637 JUST CHILDREN N.E. INC 389,775
0083499 SYNERTECH INC 386,224
1008904 JTM FOOD GROUP 384,917
1013879 NAVIANCE INC 379,016
1016219 CRITERION LABORATORIES INC 376,285
1001237 MONTGOMERY EARLY LEARNING 373,500
0026944 GRACE TRINITY UNITED CHURCH 370,500
1021317 SPRINGBOARD COLLABORATIVE 370,147
0074970 US FOODSERVICE INC 369,696
1020210 MONTCO TRANSPORTATION 367,170
0016753 JEWISH FAMILY & CHILDREN'S 365,321
1010884 MERCY NEIGHBORHOOD MINISTRIES 361,000
0004153 AMOROSO'S BAKERY 359,765
1017416 IMAGINE LEARNING INC 357,490
1017580 PRECIOUS ANGELS INC 356,250
1013046 BAMBI DAY CARE CENTER 354,825
1013896 STAR AUTISM SUPPORT LLC 352,735
0012511 DEVINE BROTHERS 350,236
1017884 PLAYWORKS EDUCATION ENERGIZED 344,075
0080037 SINGER EQUIPMENT CO 333,050
1011374 LORENZON BROTHERS COMPANY 331,899
1017430 GRABOYES COMMERCIAL WINDOW CO 330,733
0025208 CGI TECHNOLOGIES & SOLUTIONS 328,178
0025739 TEXAS INSTRUMENTS INC 318,000
0020655 HUNT ENGINEERING CO 310,360
1016740 METIS ASSOCAITES INC 308,334
0007919 BARNES & NOBLE BOOKSELLERS INC 307,863
1024142 ROBERT F KIRSCH 304,389
1020690 VALLEY FORGE EDUCATIONAL 302,306
1013068 PALMER WATERPROOFING INC 301,402
0006461 MARPLE NEWTOWN SCH DIST 298,460
1006515 CARRIER RENTAL SYSTEMS 296,900
0026532 THE NEW TEACHER PROJECT 296,280
0007575 HUDSON CONSTRUCTION CNSLTG 295,759
1008508 SALISBURY TOWNSHIP SCHOO 292,524
1015759 OMBUDSMAN EDUCATIONAL SERVICES 291,486
1023602 TUNSTALL CORPORATION 290,810
1007915 NCS PEARSON INC 285,827
1013005 YOUNG WORLD EARLY LEARNING 283,875
0018434 CONGRESO DE LATINOS UNIDOS INC 282,936
0073966 SCHOOL DISTRICT OF SPRINGFIELD 280,333
0015833 URBAN LEAGUE OF PHILADELPHIA 278,068
0048605 J LORBER CO 268,645
Page 17 of 45

VENDOR # VENDOR NAME VOUCHER-AMT
QUARTERLY SCHOOL MANAGER REPORT
VENDOR PAYMENTS YTD IN EXCESS OF $100,000
FOR THE PERIOD ENDED MARCH 31, 2017
CASH ACTIVITY
1015274 AT&T MOBILITY 267,439
1003642 BARBARA EINHORN 267,120
1023284 BENCARDINO EXCAVATING INC 267,029
0014097 BIMBO FOODS INC 266,362
0022766 AUTOCLEAR LLC 265,200
1008484 DVL INC 264,689
1012085 THE NEXUS SCHOOL 263,700
0007428 B & H PHOTO VIDEO 263,416
1019743 MANSFIELD OIL COMPANY 262,868
1003303 DELTA-T GROUP INC 258,897
1021351 APPLIED DATA SYSTEMS INC 258,714
1021023 PANNULLA CONST. CO. INC 257,968
1006159 INTERNATIONAL BACCALAUREATE 256,746
0026766 MELMARK HOME INC 254,076
1000295 DEVEREUX FOUNDATION 253,930
0013991 PUBLIC INTEREST LAW CENTER 253,804
1014628 HENISE TIRE SERVICE INC 253,797
0041301 INDEPENDENT HARDWARE INC 253,287
1018049 WINDSTREAM CORP DBA PAETEC 251,903
1006830 RAPPING ABOUT PREVENTION INC 251,900
0037754 HERTZ FURNITURE SYS CORP 251,898
0063539 VEOLIA ENERGY PHILADELPHIA INC 251,697
0016776 COLONIAL SCHOOL DISTRICT 248,280
1013045 A STEP AHEAD DAY CARE INC 247,000
1023762 ST JOHN CANTIUS CHURCH 245,596
1023446 TUSTIN WATER SOLUTIONS LLC 244,540
1012321 AMERIFLEX LLC 244,350
0004481 ANIXTER DISTRIBUTION 243,481
1012347 POTENTIAL INC 242,665
0025437 VERIZON BUSINESS 239,959
0025861 BENCHMARK EDUCATION CO LLC 239,409
1014684 GARNET VALLEY SCHOOL DISTRICT 239,335
1010084 FITCH INC 234,000
1014811 SOUND START/UPSTAR CORP 232,200
1006821 METHODIST SERVICES FOR 231,625
0025453 ELWYN INSTITUTE 229,914
0022352 COZEN & OCONNOR 225,000
0009375 WM BETZ JR INC 223,921
0096361 SCHOOL EMPLOYEES LOCAL 214,215
1023821 SEON SYSTEM SALES INC 214,191
1021764 REPUBLIC SVCS OF PA LLC DBA 212,370
0027373 SCHOOL HEALTH CORP 209,086
0059651 OVERBROOK SCHOOL FOR THE BLIND 205,898
0005794 BALLARD SPAHR LLP 205,527
1018760 EDGENUITY INC 203,140
0026725 CASA PROFESSIONAL DEV GROWTH 202,875
1018109 READING SCHOOL DISTRICT 202,829
1001788 GENERAL ASPHALT PAVING CO 202,149
0093990 WHS INC 202,023
0065186 PROMATECH INC 200,089
1000523 ORCHARD FRIENDS SCHOOL 198,500
Page 18 of 45

VENDOR # VENDOR NAME VOUCHER-AMT
QUARTERLY SCHOOL MANAGER REPORT
VENDOR PAYMENTS YTD IN EXCESS OF $100,000
FOR THE PERIOD ENDED MARCH 31, 2017
CASH ACTIVITY
1009275 PITTSTON AREA SCHOOL DISTRICT 197,722
0005781 BUCKS COUNTY SCHOOLS 197,717
0015902 BUTTONWOOD FARMS INC 197,134
1021939 MCKISSACK GROUP INC DBA 196,505
1004371 TRIUMPH LEARNING LLC 196,298
1022722 EDA ROOFING CORPORATION DBA 196,162
0046666 LAKESHORE 194,078
1023212 MEDISCAN INC 190,422
1022542 SMART PARTNERS LLC 187,772
1023640 RIVER VALLEY LANDSCAPES INC 186,493
1019367 EXPERIENCE IN ACTION 184,493
1000220 PITNEY BOWES 183,738
1020968 PARSONS ENVIRONMENT & 183,675
1009017 CHINATOWN LEARNING CENTER 182,125
1023862 MOTT MACDONALD INC 181,466
1004266 CDW GOVERNMENT INC 180,356
0025224 GRAINGER 180,330
1023505 ABBY LYNN POZEFSKY 180,000
0014449 RENAISSANCE LEARNING INC 178,764
1022377 PRATT STREET LEARNING CTR INC 178,125
1011172 ALLEGHENY-CLARION VALLEY 178,038
0021044 SAUL EWING REMICK & SAUL 177,666
1011289 ARCHER & GREINER 176,323
0017607 SILVER SPRINGS-MARTIN LUTHER 175,522
1022481 TRUST FUND FOR PUBLIC LAND 175,000
0025603 HILL TOP PREPARATORY SCHOOL 174,900
1019006 DONALD WILSON CONSULTING GROUP 172,422
1021878 THE MCCLOUD GROUP LLC 171,621
1011711 FINISHING TRADES INSTITUTE OF 170,500
1023018 MAYTAV BUS COMPANY 170,160
0026364 HUNTINGDON VALLEY CHRISTIAN 167,213
0012578 KLEINFELDER EAST INC 167,139
0002423 TEMPLE ORTHOPEDIC 165,445
1012361 ATG LEARNING ACADEMY 164,376
0013029 VITETTA GROUP 164,297
1002676 BLUE BIRD BUS SALES OF 162,066
1005073 SUNESYS INC 160,778
1023713 HAMBURG RUBIN MILLIN MAXWELL 160,000
1017456 PLAZA 70 CLEANERS INC 159,865
1024000 CAPSTONE SCHOOLS LLC 158,333
1018128 ADCON CONSULTANTS INC 158,125
1023540 LAW OFFICE OF 157,500
1023644 GANNETT FLEMING INC 156,985
1010074 SHERPA GOVERNMENT SOLUTIONS 156,811
1023737 WEST INTERACTIVE SERVICES CORP 154,731
1023541 BELMONT BEHAVIORAL HOSPITAL 152,370
0015983 HANGLEY ARONCHICK SEGAL PUDLIN 149,567
1013056 THE PARENT INFANT CENTER 149,500
0014438 OKI DATA AMERICAS INC 149,292
1011921 ENVIRONMENTAL MANAGEMENT 148,994
1023807 VANGUARD MODULAR BUILDING 148,400
Page 19 of 45

VENDOR # VENDOR NAME VOUCHER-AMT
QUARTERLY SCHOOL MANAGER REPORT
VENDOR PAYMENTS YTD IN EXCESS OF $100,000
FOR THE PERIOD ENDED MARCH 31, 2017
CASH ACTIVITY
1018425 YOUNG AUDIENCES 147,016
1023048 DAVE'S CLEANING SVCS INC 146,712
0012939 CHARTER FAIRMOUNT BEHAVIORAL 145,367
0015379 ASSIGNED COUNSEL INC 145,180
1016326 FINEMAN KREKSTEIN & HARRIS 144,245
1021625 INTERBORO PACKAGING CORP 142,982
0026739 DLT SOLUTIONS LLC 142,921
0020161 VALLEY DAY SCHOOL INC 142,480
1022676 A STEP UP ACADEMY INC 142,090
1008246 SUSAN AGARD, ESQ 140,988
1023881 PITTSBURGH STAGE INC 139,980
1011267 NCS PEARSON INC 138,466
1003792 MARIE KATZENBACH SCHOOL 138,040
0027475 PUBLIC HEALTH MGMT CORP 137,896
0012580 USA ENVIRONMENTAL MGMT INC 137,065
1019477 BAZELON LESS & FELDMAN P.C. 133,495
1023833 IN CLASS TODAY INC 132,500
1022869 RELAY GRADUATE SCHOOL OF 132,000
C100016 DR ROBERT KETTERER CHARTER 131,667
1007922 TUCKER LAW GROUP LLC 131,150
1023042 XTEL COMMUNICATIONS INC 130,424
1010192 UHS OF PENNSYLVANIA INC 130,241
1016048 PHOENIX ENERGY GROUP T/A 129,862
1021947 DANIEL B COOPER 129,091
C100114 VISION ACADEMY CHARTER SCHOOL 128,949
1005808 GIORGIO FOODS INC 128,025
1018513 ACCREDITED ENVIRONMENTAL 127,752
0085060 TAGUE LUMBER INC 127,237
0053440 MOODY'S INVESTORS SERVICE 126,145
0069159 RAMOS & ASSOCIATES INC 125,958
1015549 PRICE CONTRACTING LLC 125,709
0029967 FRANKLIN AREA SCHOOL DIST 124,965
1008909 THE CARING CENTER 123,875
1013051 KOREAN COMMUNITY DEVELOPMENT 123,500
1013047 COMMUNITY CONCERN#13 MULTI 123,500
1023797 ANN KIDS INC 123,500
1013055 MOLLY'S CHILD CARE CENTER 123,500
0029983 THE FRANKLIN INSTITUTE 123,212
1018072 PHASE4 LEARNING CENTER INC 122,670
1017517 ARCHDIOCESE OF PHILADELPHIA 122,250
1010405 WELLS FARGO BANK NA - VOID 120,888
0027514 JOSEPH J PETERS INSTITUTE 120,523
1001259 PEARSON EDUCATION 119,367
1023796 CHILDREN'S PLAYHOUSE EARLY 118,750
0014461 PEPPER HAMILTON LLP 118,687
0044613 KEYSTONE INFORMATION 118,624
1024155 NEW HOPE ACADEMY 115,500
1023176 KAREN HOLZWARTH 114,650
0043427 JOHNSON CONTROLS INC 113,419
1001430 CONAGRA FOOD SALES INC 113,116
0073842 SCHNADER HARRISON SEGAL & 112,728
Page 20 of 45

VENDOR # VENDOR NAME VOUCHER-AMT
QUARTERLY SCHOOL MANAGER REPORT
VENDOR PAYMENTS YTD IN EXCESS OF $100,000
FOR THE PERIOD ENDED MARCH 31, 2017
CASH ACTIVITY
1022627 NEW PHILA INVESTMENT LLC 108,437
0022526 HAJOCA CORP 107,409
1000692 GROVE SUPPLY INC 107,389
1008988 REYNOLDS CONSTRUCTION MGMT 106,978
1002936 ADVANCE PIERRE FOODS INC 106,834
0027219 HUNTINGTON LEARNING CORP 106,770
0015915 THE TRUSTEES OF THE UNIVERSITY 106,575
C100049 NEW MEDIA TECHNOLOGY 106,492
0017621 UNITED REFRIGERATION INC 106,180
0073293 SALVATION ARMY 106,162
1023245 RECOVERY EDUCATIONAL SERVICES 105,723
1016720 CITIZEN'S ACTING TOGETHER CAN 105,000
1023379 PARTNERS IN SCHOOL INNOVATION 105,000
1007515 PRINCETON ENGINEERING SERVICES 104,553
0005797 POSITIVE PROMOTIONS 104,114
1021169 CONVERGENT SOLUTIONS GROUP LLC 103,534
0056059 NARDONE BROS BAKING CO INC 103,499
1017392 FAITH B FISHER 103,400
0061447 SPORT SUPPLY GROUP 102,124
1023289 MILESTONE ACADEMY 101,570
1011164 ENVIRONMENTAL TESTING 100,688
1002853 BRINJAC ENGINEERING INC 100,602
0025759 DELTA BJDS INC 100,515
1023049 ROTH MARZ PARTNERSHIP P C 100,364
1021685 NULINX INTERNATIONAL INC 100,000
SUBTOTAL $1,302,394,766
OTHER PAYMENTS TO VENDORS (LESS THAN $100,000 YTD) 25,339,801
GRAND TOTAL $1,327,734,566
Source: School District of Philadelphia Financial System
Page 21 of 45

School District of Philadelphia
Quarterly School Manager Report
FOR THE PERIOD ENDED MARCH 31, 2017
PERSONNEL
REPORTS

Summary by Budget Group - All Funds
A B C D E
Budget GroupAdopted
Budget FTEs
Currently
Projected FTEsFilled FTEs
Difference
(Filled FTEs vs.
Currently Projected FTEs)
District Operated Schools - Instructional and Instructional Support 12,906.1 13,104.4 12,584.0 (520.4)
District Operated Schools - Operational Support 3,411.0 3,424.3 3,098.1 (326.2)
District Operated Schools - Pupil - Family Support 713.6 729.1 685.0 (44.1)
Non-District Operated Schools 17.0 15.0 15.0 0.0
School Budgets including Non-District Operated Schools Total: 17,047.8 17,272.7 16,382.1 (890.6)
Chief Academic Support Officer 174.0 204.3 182.0 (22.3)
Chief Financial Officer 117.0 121.0 113.0 (8.0)
Chief Information Officer 86.4 105.0 91.0 (14.0)
Chief of Schools Officer 40.0 42.5 36.0 (6.5)
Chief Operations Officer 138.5 159.0 134.0 (25.0)
Chief Student Support Services 77.2 88.0 95.0 7.0
Chief Talent Officer 92.0 88.0 75.0 (13.0)
Office of the Superintendent/CEO 63.0 75.0 62.0 (13.0)
School Reform Commission 22.0 30.0 23.0 (7.0)
Administrative Support Operations Total: 810.1 912.8 811.0 (101.8)
School District Total: 17,857.9 18,185.5 17,193.1 (992.4)
Summary by Staffing Group - All Funds
A B C D E
Staffing GroupAdopted
Budget FTEs
Currently
Projected FTEsFilled FTEs
Difference
(Filled FTEs vs.
Currently Projected FTEs)
Teachers1
8,279.3 8,313.4 8,209.0 (104.4)
Principals 326.0 347.0 335.0 (12.0)
School Support 3,878.9 4,004.6 3,623.0 (381.6)
Counselors and Other Social Supports 334.8 347.4 331.0 (16.4)
Secretaries 267.6 271.0 267.0 (4.0)
Nurses and Health-related Services 338.0 332.0 313.0 (19.0)
Facilities 1,478.0 1,513.0 1,359.0 (154.0)
Transportation 779.0 780.3 697.4 (82.9)
Food Service 758.0 736.0 670.7 (65.3)
School Police 386.0 386.0 364.0 (22.0)
Other 1,032.3 1,154.8 1,024.0 (130.8)
School District Total: 17,857.9 18,185.5 17,193.1 (992.4)
Source: School District of Philadelphia Budgeting and Staffing Systems
1 The filled number of teachers includes certain staff that are on leave but are still considered active employees.
School Budgets including Non-District Operated Schools
Administrative Support Operations
TABLE P-1
QUARTERLY SCHOOL MANAGER REPORT
BUDGETED FTE TO ON-BOARD COUNT POSITION REPORT
ALL FUNDS
FOR THE PERIOD ENDED MARCH 31, 2017
Page 23 of 45

TABLE P-2
QUARTERLY SCHOOL MANAGER REPORT
TEACHER VACANCY LISTING BY SCHOOL
OPERATING AND GRANTS FUNDS
FOR THE PERIOD ENDED March 31, 2017
NETWORK SCHOOL NAME CODE GRADE LEVEL HIGH NEEDS VACANCIES NUMBER OF VACANCIES
1 ARTHUR 2480 K - 8 none 0
1 BARTRAM 1010 9 - 12 HIGH NEEDS none 0
1 BREGY 2240 K - 8 HIGH NEEDS Physical Education 1
1 CATHARINE 1250 K - 5 none 0
1 CHILDS 2260 K - 8 none 0
1 COMEGYS 1260 K - 8 HIGH NEEDS none 0
1 FELL 2190 K - 8 none 0
1 GIRARD 2320 K - 4 HIGH NEEDS Learning Support 1
1 JENKS, A.S. 2520 K - 5 none 0
1 KEY 2540 K - 6 none 0
1 LONGSTRETH 1350 K - 8 HIGH NEEDSElementary (2nd), Emotional Support, Learning
Support 3
1 McDANIEL 2370 K - 8 HIGH NEEDS Elementary (K-4) Prep, Art 2
1 MORTON 1380 K - 5 HIGH NEEDS none 0
1 PATTERSON 1400 K - 4 HIGH NEEDS none 0
1 PENROSE 1440 K - 8 HIGH NEEDS none 0
1 SOUTH PHILADELPHIA 2000 9 - 12 HIGH NEEDS none 0
1 SOUTHWARK 2640 K - 8 HIGH NEEDS none 0
1 STANTON, E.M. 2450 K - 8 none 0
1 TILDEN 1130 5 - 8 REDESIGN Physical Education 1
2 ANDERSON 1460 K - 8 HIGH NEEDS none 0
2 BEEBER 4100 8 HIGH NEEDS none 0
2 BLANKENBURG 1490 K - 8 HIGH NEEDS none 0
2 CASSIDY 4240 K - 7 HIGH NEEDS none 0
2 GOMPERS 4280 K - 6 HIGH NEEDS none 0
2 HAMILTON 1290 K - 8 HIGH NEEDS none 0
2 HARRINGTON 1300 K - 8 HIGH NEEDS Elementary (4th) 1
2 HESTON 4300 K - 8 HIGH NEEDS Elementary (1st), .4 Prep, Music 2.4
2 HIGH SCHOOL OF THE FUTURE 1030 9 - 12 HIGH NEEDS none 0
2 LAMBERTON 4320 K - 8 HIGH NEEDS .4 Music 0.4
2 LEA 1340 K - 8 HIGH NEEDS none 0
2 LOCKE 1470 K - 8 HIGH NEEDS Middle Years Math 1
2 OVERBROOK ELEM 4370 K - 6 HIGH NEEDS none 0
2 OVERBROOK HIGH 4020 9 - 12 HIGH NEEDS Spanish, Math (9th), Math(10th-12th) 3
2 PARKWAY WEST 5090 9 - 12 HIGH NEEDS Autistic Support 1
2 PENN ALEXANDER 1280 K - 8 none 0
2 POWEL 1390 K - 4 none 0
Page 24 of 45

TABLE P-2
QUARTERLY SCHOOL MANAGER REPORT
TEACHER VACANCY LISTING BY SCHOOL
OPERATING AND GRANTS FUNDS
FOR THE PERIOD ENDED March 31, 2017
NETWORK SCHOOL NAME CODE GRADE LEVEL HIGH NEEDS VACANCIES NUMBER OF VACANCIES
2 RHOADS, J 1410 K - 8 HIGH NEEDS none 0
2 ROBESON 1050 9 - 12 HIGH NEEDS none 0
2 SAYRE 1100 9 - 12 HIGH NEEDS Learning Support/English (9th Grade) 1
2 WASHINGTON, M 1420 K - 8 HIGH NEEDS Elementary (Prep) 1
3 ADAIRE 5200 K - 8 none 0
3 BACHE-MARTIN 2210 K - 8 HIGH NEEDSnone
0
3 CONSTITUTION HIGH SCHOOL 2670 9 - 12 none 0
3 FRANKLIN HIGH 2010 9 - 12 none 0
3 FURNESS 2160 9 - 12 HIGH NEEDS none 0
3 GREENFIELD 2470 K - 8 none 0
3 JACKSON 2510 K - 8 none 0
3 KEARNY 5480 K - 8 none 0
3 KIRKBRIDE 2580 K - 8 none 0
3 LUDLOW 5340 K - 8 HIGH NEEDS none 0
3 McCALL 2340 K - 8 none 0
3 MEADE 4570 K - 8 HIGH NEEDSMiddle Years Social Studies, Elementary (3rd),
Kindergarten3
3 MEREDITH 2380 K - 8 none 0
3 MOFFET 5370 K - 5 none 0
3 MORRIS 2390 K - 8 HIGH NEEDS .6 Music 0.6
3 NEBINGER 2590 K - 8 none 0
3 PENN TREATY 5160 6 - 12 HIGH NEEDS Biology, Learning Support/Math 2
3 SHARSWOOD 2630 K - 8 HIGH NEEDS .5 ESOL 0.5
3 SPRING GARDEN 5560 K - 8 HIGH NEEDS .4 Elementary 0.4
3 TAGGART 2690 K - 8 HIGH NEEDS none 0
3 VARE-WASHINGTON 2720 K - 8 HIGH NEEDS none 0
3 WARING 2490 K - 8 HIGH NEEDS none 0
4 BETHUNE 7510 K - 8 HIGH NEEDS none 0
4 BLAINE 4220 K - 8 Learning Support 1
4 CAYUGA 5490 K - 5 HIGH NEEDS none 0
4 CRAMP 5470 K - 5 HIGH NEEDS none 0
4 ELKIN 5260 K - 4 HIGH NEEDS Counselor, Elementary (2nd) 2
4 DEBURGOS 5170 K - 8 HIGH NEEDS none 0
4 DICK 4270 K - 8 HIGH NEEDS none 0
4 DOBBINS 4060 9 - 12 none 0
4 DUCKREY 4460 K - 8 HIGH NEEDS none 0
4 GIDEON 4530 K - 8 HIGH NEEDS none 0
Page 25 of 45

TABLE P-2
QUARTERLY SCHOOL MANAGER REPORT
TEACHER VACANCY LISTING BY SCHOOL
OPERATING AND GRANTS FUNDS
FOR THE PERIOD ENDED March 31, 2017
NETWORK SCHOOL NAME CODE GRADE LEVEL HIGH NEEDS VACANCIES NUMBER OF VACANCIES
4 KELLEY, W.D. 4560 K - 8 none 0
4 KENDERTON 4360 K - 8Middle Years Science, Elementary (Kindergarten),
Elementary (3rd)3
4 MASTBAUM 5060 9 - 12 Learning Support/Math 1
4 McCLURE 7380 K - 5 none 0
4 PEIRCE, TM 4380 K - 6 HIGH NEEDS Elementary Prep (PK-4) 1
4 RANDOLPH 6090 9 - 12 none 0
4 SHEPPARD 5410 K - 4 HIGH NEEDS none 0
4 STEEL 6390 K - 8 HIGH NEEDS Learning Support, Music (Vocal) 2
4 TAYLOR 7440 K - 5 HIGH NEEDS .2 Grade Prep 0.2
4 WRIGHT 4470 K - 5 HIGH NEEDS none 0
5 BROWN, H.A. 5210 K - 8 HIGH NEEDS ESOL 1
5 HACKETT 5300 K - 5 none 0
5 HARTRANFT 5320 K - 8 HIGH NEEDS none 0
5 HOPKINSON 7300 K - 8 HIGH NEEDS Elementary (6th) 1
5 HUNTER 5330 K - 8 HIGH NEEDS none 0
5 JUNIATA PARK ACADEMY 7150 K - 8 HIGH NEEDS none 0
5 KENSINGTON CAPA 5520 9 - 12 HIGH NEEDS none 0
5 KENSINGTON HEALTH SCIENCES 5550 9 - 12 HIGH NEEDS none 0
5 KENSINGTON URBAN 5600 9 - 12 none 0
5 MCKINLEY 5350 K - 8 HIGH NEEDS Middle Years English/Middle Years Social Studies 1
5 RICHMOND 5400 K - 5 HIGH NEEDS none 0
5 SHERIDAN 5530 K - 4 HIGH NEEDS none 0
5 WEBSTER 5590 K - 5 HIGH NEEDS none 0
5 WELSH 5420 K - 8 Elementary (4-6) 1
5 WILLARD 5440 K - 4 none 0
6 COOK - WISSAHICKON 6410 K - 8 none 0
6 DAY 6200 K - 8 7-8th grade Science, 6th grade Math/Science 2
6 DOBSON 6450 K - 8 none 0
6 EDMONDS, F.S. 6210 K - 5 none 0
6 EMLEN 6220 K - 5 Kindergarten (sabb) 1
6 HENRY 6250 K - 8 none 0
6 HOUSTON 6260 K - 8 Elementary (5th) (sabb); Music (Vocal) 2
6 JENKS, J.S. 6270 K - 8 none 0
6 KELLY, J.B. 6470 K - 5 HIGH NEEDS none 0
6 LINGELBACH 6440 K - 5 HIGH NEEDS Elementary K-6 2
6 LOGAN 6300 K - 4 HIGH NEEDS none 0
6 McCLOSKEY 6310 K - 8 8th grade Science and Social Studies 1
Page 26 of 45

TABLE P-2
QUARTERLY SCHOOL MANAGER REPORT
TEACHER VACANCY LISTING BY SCHOOL
OPERATING AND GRANTS FUNDS
FOR THE PERIOD ENDED March 31, 2017
NETWORK SCHOOL NAME CODE GRADE LEVEL HIGH NEEDS VACANCIES NUMBER OF VACANCIES
6 MIFFLIN 6320 K - 8 HIGH NEEDS none 0
6 PARKWAY NORTHWEST 5070 9 - 12 none 0
6 PENNYPACKER 6350 K - 5 none 0
6 ROXBOROUGH 6030 9 - 12 HIGH NEEDS Biology, Learning Support/Math 2
6 SHAWMONT 6380 K - 8 Counselor (sabb) 1
6 WASHINGTON, GROVER 7370 5 - 8 HIGH NEEDS none 0
7 BARTON 7200 K - 2 none 0
7 CARNELL 7220 K - 5 Physical Education (sabb) 1
7 ELLWOOD 7260 K - 6 HIGH NEEDS none 0
7 FELS 7120 9 - 12 HIGH NEEDS English 9-12 1
7 FELTONVILLE ARTS & SCI 7500 6 - 8 HIGH NEEDS none 0
7 FELTONVILLE INTERMEDIATE 7310 K - 5 HIGH NEEDS Elementary (5th) 1
7 FINLETTER 7270 K - 8 HIGH NEEDSnone
0
7 FRANKLIN ELEM 7280 K - 8 HIGH NEEDS Music (Vocal) 1
7 HOWE 7320 K - 5 HIGH NEEDS Kindergarten 1
7 LOWELL 7350 K - 4 HIGH NEEDS none 0
7 MARSHALL, T 5500 K - 8 HIGH NEEDSElementary (K-6) Prep
1
7 MORRISON 7390 K - 8 HIGH NEEDS Elementary (4-6) Prep 1
7 OLNEY 7400 K - 8 HIGH NEEDS none 0
7 PENNELL 6340 K - 5 HIGH NEEDS none 0
7 PRINCE HALL 7490 K - 5 HIGH NEEDS none 0
7 ROWEN 7530 K - 5 1st grade 1
7 WAGNER 7130 6 - 8 none 0
8 BALDI 8160 6 - 8 none 0
8 COMLY 8370 K - 5none
0
8 CROSSAN 8230 K - 5 none 0
8 DECATUR 8420 K - 8 none 0
8 FARRELL 8380 K - 8 none 0
8 FITZPATRICK 8390 K - 8 none 0
8 FOX CHASE 8260 K - 5 none 0
8 FRANK, ANNE 8400 K - 5 none 0
8 GREENBERG 8430 K - 8 none 0
8 HANCOCK (DEMO) 8180 K - 8 Demo none 0
8 LOESCHE 8440 K - 5 none 0
8 MOORE 8310 K - 5 HIGH NEEDS none 0
8 NORTHEAST 8020 9 - 12 HIGH NEEDS none 0
Page 27 of 45

TABLE P-2
QUARTERLY SCHOOL MANAGER REPORT
TEACHER VACANCY LISTING BY SCHOOL
OPERATING AND GRANTS FUNDS
FOR THE PERIOD ENDED March 31, 2017
NETWORK SCHOOL NAME CODE GRADE LEVEL HIGH NEEDS VACANCIES NUMBER OF VACANCIES
8 RHAWNHURST 8360 K - 5 HIGH NEEDS none 0
8 SOLIS-COHEN 8340 K - 6 HIGH NEEDS none 0
8 SPRUANCE 8350 K-8 HIGH NEEDS none 0
8 WASHINGTON HIGH 8030 9 - 12 HIGH NEEDS none 0
8 WILSON MIDDLE 8120 6 - 8 HIGH NEEDS Elementary (6th) 1
9 ALLEN, ETHAN 8200 K - 8 HIGH NEEDS none 0
9 BRIDESBURG 7470 K - 5 none 0
9 BROWN, J.H 8210 K - 6 HIGH NEEDS none 0
9 DISSTON 8240 K - 8 HIGH NEEDS Music 1
9 FORREST 8250 K - 6 none 0
9 FRANKFORD 7010 9 - 12 HIGH NEEDSBiology, Learning Support/Math, Multiple Disabilites
Support3
9 HARDING 7110 6 - 8 HIGH NEEDS Science/Math, English 2
9 HOLME 8270 K - 6 none 0
9 LAWTON 7330 K - 5 HIGH NEEDS none 0
9 LINCOLN 8010 9 - 12 HIGH NEEDS none 0
9 MARSHALL, J 7360 K - 5 HIGH NEEDS Counselor 1
9 MAYFAIR 8300 K - 8 .4 Spanish 0.4
9 MEEHAN 8140 7 - 8 HIGH NEEDS none 0
9 POLLOCK 8410 K - 6 .2 Prep 0.2
9 STEARNE 7290 K - 8 HIGH NEEDS Elementary (3rd) 1
9 SULLIVAN 7430 K - 5 HIGH NEEDS Elementary (4th) 1
9 ZIEGLER 7460 K - 8 HIGH NEEDS ESOL 1
Autonomy ACADEMY AT PALUMBO 2620 9 - 12 none 0
Autonomy AMY at J. MARTIN 5430 6 - 8 none 0
Autonomy AMY NORTHWEST 6480 6 - 8 none 0
Autonomy ARTS ACADEMY AT RUSH 8040 9 - 12 none 0
Autonomy BODINE 5150 9 - 12 none 0
Autonomy CENTRAL 6010 9 - 12 none 0
Autonomy CONWELL 5230 5 - 8 none 0
Autonomy CREATIVE & PERFORMING ARTS 2020 9 - 12 Math (sabbatical) 1
Autonomy ENGINEERING AND SCIENCE 4030 9 - 12 none 0
Autonomy FITLER 6230 K - 8 none 0
Autonomy FRANKLIN LEARNING CENTER 2290 9 - 12 none 0
Autonomy GIRARD MUSIC ACADEMIC PROGRAM 2410 5 - 12 Learning Support 1
Autonomy GIRLS 6050 9 - 12 none 0
Autonomy HILL - FREEDMAN 6460 6 - 11 Life Skills Support (LTI), 2-Austistic Support 3
Autonomy LANKENAU 6540 9 - 12 none 0
Page 28 of 45

TABLE P-2
QUARTERLY SCHOOL MANAGER REPORT
TEACHER VACANCY LISTING BY SCHOOL
OPERATING AND GRANTS FUNDS
FOR THE PERIOD ENDED March 31, 2017
NETWORK SCHOOL NAME CODE GRADE LEVEL HIGH NEEDS VACANCIES NUMBER OF VACANCIES
Autonomy MASTERMAN HS/MS(DEMO) 2140 5 - 12 DEMO none 0
Autonomy MIDDLE YEARS ALTERNATIVE 1580 5 - 8 none 0
Autonomy MOTIVATION 1190 9 - 12 none 0
Autonomy OVERBROOK ED CTR 4480 K - 8 none 0
Autonomy PARKWAY CENTER CITY 5080 9 - 12 none 0
Autonomy PHILADELPHIA MILITARY ACADEMY 5050 9 - 12 none 0
Autonomy SAUL 6040 9 - 12 none 0
Autonomy SWENSON 8090 9 - 12 none 0
Autonomy WIDENER MEMORIAL 6400 K - 12 none 0
Innovation BUILDING 21 5610 9 - 11 Biology 1
Innovation PHILADELPHIA VIRTUAL ACADEMY 8780 9 - 10 none 0
Innovation SCIENCE LEADERSHIP ACADEMY 2650 9 - 12 none 0
Innovation SLA MIDDLE 2050 5 none 0
Innovation SLA @ BEEBER 2680 9 - 12 none 0
Innovation THE LINC 5660 9 - 11 General Science 1
Innovation THE WORKSHOP SCHOOL 8560 9 - 12 none 0
Innovation U SCHOOL 5620 9 - 11 none 0
Opportunity CROSSROADS @ HUNTING PARK 3190 1 - 5 HIGH NEEDS none 0
Opportunity CROSSROADS ACCELERATED ACADEMY 8690 8 - 9 HIGH NEEDS none 0
Opportunity PENNYPACK HOUSE 8540 9 - 12 HIGH NEEDS none 0
Opportunity PHILA JUVENILE JUSTICE SERVICES CTR 2530 9 - 12 HIGH NEEDS none 0
Opportunity PHILA LEARNING ACAD- NORTH 8470 9 - 12 HIGH NEEDS Math 1
Opportunity PHILA LEARNING ACAD- SOUTH 8460 7 - 12 HIGH NEEDS none 0
Turnaround ALLEN, ETHEL 4440 K - 8 HIGH NEEDS Middle Level English 1
Turnaround BARRY 1200 K-8 HIGH NEEDS Elementary (k-4) 1
Turnaround BRYANT 1230 K - 8 HIGH NEEDS none 0
Turnaround CLEMENTE 7730 6 - 8 HIGH NEEDS ESOL, Middle Years Math, Physical Education 3
Turnaround COOKE 7100 K - 8 HIGH NEEDS Emotional Support 1
Turnaround DUNBAR 5250 K - 8 HIGH NEEDS none 0
Turnaround EDISON 5020 9 - 12 HIGH NEEDS Emotional Support 1
Turnaround KING 6060 9 - 12 HIGH NEEDS Art, ESOL (sabbatical) (paired with .5 Frankford) 2
Turnaround MARIN 5680 K - 8 HIGH NEEDSElementary (5th), Elementary (6th), Middle Level
Social Studies, Kindergarten4
Turnaround MCMICHAEL 1360 K - 8 HIGH NEEDS Elementary (5th) 1
Turnaround MITCHELL 1370 K - 8 HIGH NEEDS Physical Education, Math 2
Turnaround POTTER THOMAS 5390 K - 8 HIGH NEEDSMiddle Years English, Elementary (4-6), Middle
Level Math3
Turnaround RHODES, EW 4350 K - 8 HIGH NEEDS none 0
Page 29 of 45

TABLE P-2
QUARTERLY SCHOOL MANAGER REPORT
TEACHER VACANCY LISTING BY SCHOOL
OPERATING AND GRANTS FUNDS
FOR THE PERIOD ENDED March 31, 2017
NETWORK SCHOOL NAME CODE GRADE LEVEL HIGH NEEDS VACANCIES NUMBER OF VACANCIES
Turnaround ROOSEVELT 6360 K - 8 HIGH NEEDS none 0
Turnaround STRAWBERRY MANSION 4140 9 - 12 HIGH NEEDSLearning Support/Math, Life Skills Support, Math,
Autistic Support, English5
Turnaround WEST PHILADELPHIA 1020 9 - 12 HIGH NEEDS Math 1
TOTAL VACANCIES 103.1
Notes:
Source: School District of Philadelphia Budget System and Office of Talent Staff Tracking
a. The Position Report and Vacancy Report may vary due to timing differences, different definitions of what constitutes a vacancy, and different definitions of when a vacancy is considered filled.
Page 30 of 45
School District of Philadelphia
Quarterly School Manager Report
FOR THE PERIOD ENDED MARCH 31, 2017
SUPPLEMENTARY MATERIALS

Outstanding Outstanding
Principal Principal
Series 7/1/2016 12/31/2016 Principal Interest Total
SPSBA 2003B 43,505,000 43,505,000 - 2,392,775 2,392,775
2004E 19,335,000 19,335,000 Trapped, see below - -
2005D 12,370,000 12,370,000 2,220,000 680,350 2,900,350
SPSBA 2006A 174,350,000 - - - -
SPSBA 2006B 545,525,000 83,365,000 - 4,168,250 4,168,250
2007A 146,440,000 146,440,000 15,000 7,134,350 7,149,350
2007C 13,510,000 13,510,000 Trapped, see below - -
2007D 28,160,000 28,160,000 Trapped, see below 352,000 352,000
2008E 250,445,000 18,915,000 5,725,000 7,560,938 13,285,938
2008F 101,940,000 30,210,000 10,945,000 3,352,822 14,297,822
2009B 17,955,000 17,955,000 5,695,000 867,450 6,562,450
2010B 220,400,000 220,400,000 5,745,000 14,156,830 19,901,830
2010C 160,820,000 135,755,000 25,065,000 7,401,725 32,466,725
2010D 49,365,000 49,365,000 - 2,316,506 2,316,506
2010E 109,715,000 105,805,000 3,910,000 5,608,150 9,518,150
2011A 144,625,000 144,625,000 Trapped, see below 8,634,898 8,634,898
2011B 10,865,000 9,165,000 1,700,000 277,281 1,977,281
2011C 24,340,000 20,775,000 3,565,000 1,127,875 4,692,875
2011D 11,530,000 9,805,000 1,725,000 421,938 2,146,938
2012A 7,062,513 - 7,062,513 141,250 7,203,763
SPSBA 2012B 241,505,000 241,505,000 10,210,000 12,075,250 22,285,250
SPSBA 2015A 80,000,000 80,000,000 5,000 3,886,700 3,891,700
2015A 46,770,000 45,320,000 1,450,000 2,240,900 3,690,900
2015B 6,875,000 - 6,875,000 171,875 7,046,875
2015C 43,935,000 40,060,000 3,875,000 1,374,225 5,249,225
2015D 128,620,000 112,260,000 16,360,000 6,022,000 22,382,000
2016A 48,520,000 - - - -
2016B 150,720,000 - - 1,189,243 1,189,243
2016C 150,720,000 - - 1,189,243 1,189,243
SPSBA 2016A - 570,010,000 19,650,000 15,437,771 35,087,771
2016D - 92,345,000 - 1,346,698 1,346,698
2016E - 147,245,000 Trapped, see below 2,173,091 2,173,091
2016F - 582,155,000 - 8,489,760 8,489,760
CURRENT DEBT SERVICE PRINCIPAL & INTEREST $2,989,922,513 $3,020,360,000 $131,797,513 $122,192,143 $253,989,655
Other Debt Service Costs1
15,275,600
CURRENT DEBT SERVICE PROJECTION (EXCL. TRAPPED FUNDS ) $269,265,256
Trapped Funds
2004E 1,381,071 1,381,071
2007C 900,667 900,667
2007D 5,000 5,000
2011A 7,415,000 7,415,000
2016E - -
SUBTOTAL TRAPPED FUNDS $9,701,738 $9,701,738
TOTAL DEBT SERVICE PROJECTION (INCL. TRAPPED FUNDS) $2,989,922,513 $3,020,360,000 $141,499,250 $122,192,143 $278,966,993
Source: Phoenix Capital Partners Financial Advisory Firm; School District of Philadelphia Finance Staff
SM-1
1 Other debt service costs include Letter of Credit costs, issuance costs, defeasance costs, and other fees.
FY17
QUARTERLY SCHOOL MANAGER REPORT
SCHEDULE OF BONDS OUTSTANDING AND DEBT SERVICE (EXCLUDING REFUNDING)
FOR THE PERIOD ENDED MARCH 31, 2017
Page 32 of 45

The following summarizes the District's activities related to capital projects from January 1 through January 31, 2017:
● There are 23 active projects under construction at 22 locations, 19 projects remain on schedule.
● Substantial completion was reached on zero (0) projects.
Source: School District of Philadelphia Finance and Capital Programs Staff
As of January 31, 2017, the Office of Capital Programs had an adjusted available balances of $221,285,839.
SM-2a
QUARTERLY SCHOOL MANAGER REPORT
CAPITAL PROJECTS - January 2017
FOR THE PERIOD ENDED MARCH 31, 2017
As of January 31, 2017, the Office of Capital Programs had cash balances of $219,948,501 across all bond funds of
which 100% is committed for design and construction contracts, project contingencies, and staffing.
● Sixteen (16) new proposals executed to begin design phase.
● There are forty six (46) projects in various stages of design; forty two (42) projects are on schedule, (1)
project is ahead of schedule, and (3) projects are behind schedule.
● No Projects were submitted for SRC approval at the January 19, 2017 Public Action Meeting.
The Office of Capital Programs had an outstanding reimbursement amount to the School District of Philadelphia
General Fund of $25,107; which was not offset with the above cash balances. The Office of Capital Programs also had
an outstanding expense credit of $1,362,445; which was not included in the above cash balance.
Page 33 of 45
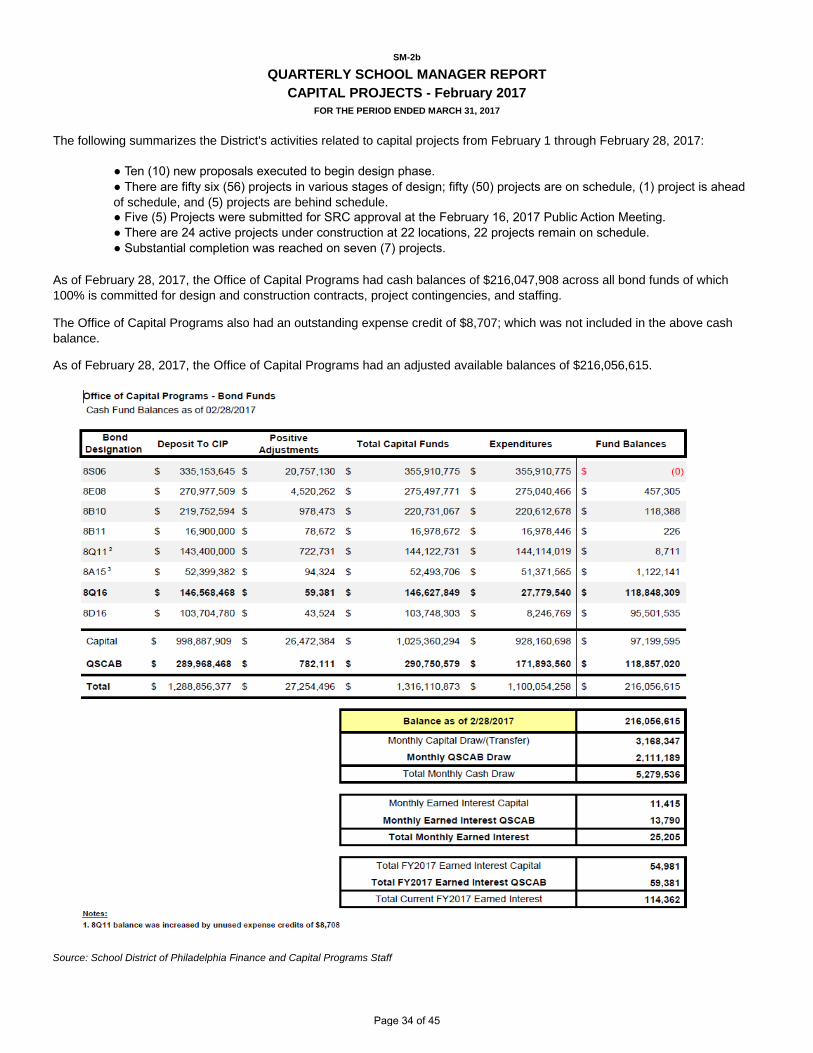
The following summarizes the District's activities related to capital projects from February 1 through February 28, 2017:
● Ten (10) new proposals executed to begin design phase.
● Five (5) Projects were submitted for SRC approval at the February 16, 2017 Public Action Meeting.
● There are 24 active projects under construction at 22 locations, 22 projects remain on schedule.
● Substantial completion was reached on seven (7) projects.
Source: School District of Philadelphia Finance and Capital Programs Staff
As of February 28, 2017, the Office of Capital Programs had an adjusted available balances of $216,056,615.
SM-2b
QUARTERLY SCHOOL MANAGER REPORT
CAPITAL PROJECTS - February 2017
FOR THE PERIOD ENDED MARCH 31, 2017
As of February 28, 2017, the Office of Capital Programs had cash balances of $216,047,908 across all bond funds of which
100% is committed for design and construction contracts, project contingencies, and staffing.
● There are fifty six (56) projects in various stages of design; fifty (50) projects are on schedule, (1) project is ahead
of schedule, and (5) projects are behind schedule.
The Office of Capital Programs also had an outstanding expense credit of $8,707; which was not included in the above cash
balance.
Page 34 of 45

The following summarizes the District's activities related to capital projects from March 1 through March 31, 2017:
● Three (3) new proposals were executed to begin design phase.
● Six (6) Projects were submitted for SRC approval at the March 16, 2017 Public Action Meeting.
● There are 20 active projects under construction at 19 locations, 15 projects remain on schedule.
● Substantial completion was reached on four (4) projects.
Source: School District of Philadelphia Finance and Capital Programs Staff
SM-2c
QUARTERLY SCHOOL MANAGER REPORT
CAPITAL PROJECTS - March 2017
FOR THE PERIOD ENDED MARCH 31, 2017
As of March 31, 2017, the Office of Capital Programs had cash balances of $212,446,900 across all bond funds of
which 100% is committed for design and construction contracts, project contingencies, and staffing.
● There are forty one (41) projects in various stages of design; thirty one (31) projects are on schedule and
ten (10) projects are behind schedule. Design completed on twenty one (21) projects during the month of
March.
Page 35 of 45

The following outlines the allocation methodology used for the School Basic Operating Funds in FY 2017:
Position/
Resource
Teachers
Principal
Assistant
Principals
Counselors
Secretaries
$100 Teacher
Allotment
Discretionary
Funds
School Redesign
Initiative
Special Programs
Source: School District of Philadelphia Finance Staff
SM-3
QUARTERLY SCHOOL MANAGER REPORT
SCHOOL BUDGET ALLOCATION METHODOLOGY
A school's budget consists of school-based allocations and centrally-allocated resources. The school-based
allocations include both operating and grant resources. The operating resources are allocated for administration,
teachers (enrollment driven + prep), school support positions, and discretionary funds. Grant resources are provided
by Title I and Title II, SIG, and other grants. The centrally-allocated resources include positions such as special
education, nurses, ESOL teachers, facilities, and security.
0-1,149 students: One secretary
1,150-2,249 students: Two secretaries
Over 2,249 students: Three secretaries
Allocation Method
Schools are allotted a sufficient number of regular education teachers to meet specified class size limits and to provide
prep time for each teacher. Class size limits are:
Grades K-3: 30 students
Grades 4-12: 33 students
Career and Technical Education Schools: 24 students
Kindergarten teachers are entirely funded by grants.
One principal per school
0-699 students: No assistant principal
700-1,349 students: One assistant principal
1,350-1,999 students: Two assistant principals
2,000-2,649: Three assistant principals
Over 2,649 students: Four assistant principals
Neighborhood high schools are provided one assistant principal to support ninth grade.
All schools are provided at least one counselor
0-949 students: One counselor
950-1,599 students: Two counselors
1,600-2,249 students: Three counselors
Over 2,249 students: Four counselors
$50,000 for each school selected for the School Redesign Initiative
Arts programs: Schools with designated arts programs receive an additional $50,000
International Baccalaureate (IB) programs: Schools with IB programs receive an additional 1.6 teachers
0-299 students: Two SCS
300-449 students: Three SCS
450 -599 students: Four SCS
600-749 students: Five SCS
750-949 students: Six SCS
950-1,249 students: Seven SCS
1,250-1,599 students: Eight SCS
1,600 – 1,999 students: Ten SCS
Over 1,999 students: Twelve SCS
Student Climate
Support (SCS)
3 hour
Additional student climate staff are provided to schools with more than one building:
2 buildings: Two SCS 3 buildings: Four SC
Summer
ReorganizationElementary Schools
10 days for secretaries (daily rate=$249.66)
Middle and High Schools
10 days for secretaries (daily rate=$249.66)
10 days for roster chair (daily rate=$456.17)
$100 per teacher type (teacher, counselor)
Schools must pay staff for a specific number of days of Summer Registration/ Reorganization.
- $140 per student for schools identified as Model or Reinforce according to SDP’s School Progress Report (SPR)
- $165 per student for schools identified as Watch or Intervene according to SDP’s School Progress Report (SPR)
These funds may be used for staff, supplies, textbooks, computers, extra-curricular activities, parent outreach, etc.
Page 36 of 45

Fund # Grant Source FTE $
1 201XL6 Title I Basic Federal Grants 1,606 172,111,866
2 242XL6 IDEA-B Federal Grants 149 45,514,120
3 216XL6 Pre-K Basic Federal Grants 195 41,952,207
4 49AXL6 Ready to Learn1
State Grants 367 42,031,198
5 4E1XL6 Pa Pre-K Counts State Grants 78 28,897,277
6 334XL6 Title II(A) – Investing In Teacher Quality Federal Grants 82 28,543,253
7 4A0XL6 Head Start Supplemental Assist State Grants 70 15,702,667
8 206XL6 Title I School Imprvmt Federal Grants 178 8,331,225
9 401XL6 Access State Grants 31 5,850,183
10 270XL6 Perkins Voc Ed Federal Grants 31 4,975,114
11 237XL6 Title III Lang Instr Lep & Immigrant Stud Federal Grants 34 4,234,009
12 38BXL6 Philadelphia Gear Up Project Federal Grants 15 6,318,355
13 246XL6 JROTC Federal Grants 24 2,775,325
14 267XL6 Nutrition Education Federal Grants 19 3,036,414
15 236XL6 Elect & Tanf Federal Grants 4 3,101,928
16 6ZQXL6 William Penn Foundation - Early Literacy Local / Private Grants 0 2,195,424
17 6G2XL6 University of Penn - Penn Assisted Local / Private Grants 6 1,844,567
18 3G0XL6 SIG - Cohort 4 Federal Grants 7 1,260,116
19 6THXL6 Philadelphia Pre-K Initiative Local / Private Grants 3 1,361,653
20 6ZAXL6 Stormwater Management Incentive Local / Private Grants 0 1,020,635
Federal Grants 25 7,516,043
Local / Private Grants 15 6,337,854
Other Grant Funds State Grants 0 878,228
Grants Clearing Accounts 63 0
3,003 435,789,660
FTE $
2,369 329,669,974
547 93,359,553
24 12,760,133
63 0
3,003 435,789,660
Additional Notes:
Source: Revenue and Expenditure Estimates at the Time of the FY 2018 Consolidated Budget Book
State Grants
Local / Private Grants
Federal Grants
SM-4a
QUARTERLY SCHOOL MANAGER REPORT
SUMMARY OF MAJOR GRANT FUNDS BY CATEGORY
FY2017 ADOPTED
Summary by Category
2017 Amended Budget
Other Grant Funds
Other Grant Funds
Other Grant Funds
Total Grant Funds
Grants Clearing Accounts
Total
b. Grant revenues and related expenditures are not included in the general operating fund.
a. The School Reform Commission does not adopt grant budgets. The SRC does approve the receipt of grant revenues and the expenditure
of grant funds.
c. The FY 2017 budgets represent funds estimated to be spent during the year on a fiscal year basis which may be different than the grant
award which represents resources provided during a grant period. In addition, the budget estimates include reimbursements from the State
for retirement and social security costs for State grants, and retirement costs for Federal grants.
1 At the time of budget adoption, the Ready to Learn Grant was $0. Post-adoption, the enacted State Budget shifted $40.4 million of the
Operating Fund's Gross Basic Education subsidy to the Ready to Learn Grant.
Page 37 of 45

Grant Source Program Description
1 Title I BasicFederal Grants -
Indirect
Title I, Part A – Basic Grant Provides supplementary educational services, especially in reading/language arts and
math, to students who are educationally disadvantaged or at risk of failing to meet state requirements; provides funds
for school-wide projects that create an overall plan for school improvement; and provides resources to strengthen the
core academic program and improve student achievement. Funds are also provided to private schools and the
Archdiocese.
2 IDEA-BFederal Grants -
Indirect IU
IDEA – Individuals with Disabilities Education Act Provides funding to supplement and/or increase the level of
special education and related services provided to students with eligible disabilities ages 5 through 21 who are
enrolled in special education programs. In alignment with the Act, Philadelphia Intermediate Unit 26 focuses IDEA
expenditures on staffing, contractual services, and materials that support supplementary aids and services for
students with disabilities and those who are experiencing barriers to learning.
3 Pre-K BasicFederal Grants -
Direct
Pre-Kindergarten Head Start Basic Grant / Head Start Supplemental Assistance For pre-school education and
family services, medical and dental care, breakfast, lunch and snacks, nutrition and social services, diagnostic and
therapeutic services for children with special needs as well as for parent involvement in decision-making and program
implementation. Also used to support the District’s Head Start program which provides health, education, nutrition,
social and other services to pre-school children and their families. Supplemental funds are used to increase the
availability of Head Start program slots for low-income children and families in high-need neighborhoods through the
School District.
4 Ready to Learn State Grants
Ready to Learn To attain or maintain academic performance targets through such activities as pre-kindergarten, full-
day kindergarten, class-size reduction, tutoring, teacher coaching and professional development, incentives for
teachers in academically challenged schools, and social and health services. These funds are also used to support
full-day kindergarten.
5 Pa Pre-K Counts State Grants
PA Pre-K Counts To provide high-quality preschool programming for children between age three and the entry age
for kindergarten who are at considerable risk of delayed cognitive development and academic underperformance due
to socioeconomic and/or other factors. The District uses this funding to support the delivery of center-based early
childhood educational services designed to promote school readiness in a manner compliant with state and local
standards. This programming is accomplished through close contractual partnerships with well-established
community childcare agencies.
6
Title II(A) –
Investing In
Teacher Quality
Federal Grants -
Indirect
Title II, Part A - Improving Teacher Quality Grant To prepare, train, and recruit high-quality teachers and principals
capable of ensuring increased academic achievement for all students and to provide in-service and retraining for
teacher leaders and support staff through workshops, conferences, higher education credits and professional
development sessions in elementary, middle and high schools in the areas of math and science.
7
Head Start
Supplemental
Assist
State Grants Same as - Pre-Kindergarten Head Start Basic Grant / Head Start Supplemental Assistance (216X)
8Title I School
Imprvmt
Federal Grants -
Indirect
Title I, School Improvement Accountability Grant To improve educational opportunities for students in low-
performing schools and to facilitate compliance with school improvement requirements. Funds used to assist Title I
schools in helping all children reach high standards of learning and help low-performing schools provide high-quality
education for all children. Funds also used to support full and part-time positions including extra curricular and
professional development, textbooks, instructional aids, educational software and other educational supplies at
schools on the school improvement list.
9 Access State Grants
ACCESS – Medical Assistance Grant Partial Reimbursement of the costs incurred by the District for providing
medically related services to eligible special education students and specialized transportation to special education
students who receive medically related services as part of their IEP. Reimbursement is generated when the District
and/or intermediate unit submit health related claims for Chapter 14 Medicaid eligible students and the claims are
processed for these students. Medical Assistance reimbursement for transportation is reimbursed only on dates when
health related services are claimed.
10 Perkins Voc EdFederal Grants -
Indirect
Perkins Vocational Education Grant To upgrade approved Career and Technical Education (CTE) Programs of
Study (POS) and to ensure that the CTE POS are in compliance with both state (Chapter 339) and federal (Perkins
IV) standards and guidelines. The expectation is that students will be better prepared for post-high school education
and careers. The District uses these funds to support Career and Technical Education (CTE) Programs of Study
(POS) that serve high concentrations of special students.
11
Title III Lang Instr
Lep & Immigrant
Stud
Federal Grants -
Indirect
Title III – Language Instruction for Limited English Proficient and Immigrant Students Grant To help students
who have a primary language other than English attain English proficiency and meet the State academic content and
achievement standards, and to develop language instruction educational programs.
12Philadelphia Gear
Up Project
Federal Grants -
Direct
Philadelphia Gear Up Project To improve the chances for post secondary success for a target cohort of students in
some of Philadelphia's highest poverty and at-risk schools. To increase the academic performance and preparation
for post secondary education for GEAR UP students, increase the rate of high school graduation and enrollment in
post secondary education for GEAR UP students, and increase students' and their families' knowledge of post
secondary education options, preparation and financing.
13 JROTCFederal Grants -
Indirect
JROTC To implement Junior Reserve Officer Training Corp (JROTC) programs to promote patriotism, develop
informed and responsible citizens, develop respect for constituted authority and develop a high degree of personal
honor, self respect, individual discipline and leadership. Funds are also used to implement JROTC after school and
summer enrichment programs for at-risk students.
14 Nutrition EducationFederal Grants -
Direct
Nutrition Education Grant To offered nutrition education to eligible schools to increase knowledge of healthy food
choices, improve food selections and eating habits while making healthier dietary choices and developing an
understanding of the nutritional value of the school breakfast and lunch programs. Parents are to receive nutrition
workshops to reinforce concepts taught to the students.
SM-4b
QUARTERLY SCHOOL MANAGER REPORT
SUMMARY OF MAJOR GRANT FUNDS BY CATEGORY
Page 38 of 45

Grant Source Program Description
SM-4b
QUARTERLY SCHOOL MANAGER REPORT
SUMMARY OF MAJOR GRANT FUNDS BY CATEGORY
15 Elect & TanfFederal Grants -
Indirect
Education Leading to Employment and Training (ELECT) and TANF Grant To assist parents of minor children to
return to or remain in school, obtain their high school diplomas or GEDs, develop responsible parenting skills, become
positive role models for their children and become productive members of their communities. The District funds year-
round intensive individualized and group prevention, intervention and sustaining programs and services for pregnant
and parenting teens.
16
William Penn
Foundation - Early
Literacy
Private Grant
William Penn Foundation - Early Literacy To provide training, support, and aligned materials to all early
elementary school teachers and to improve literacy instruction in the early grades with the goal that students are
reading on grade-level by third grade. The funding supports summer training for grades K-3 teachers in evidence-
based literacy instructional practices, teacher coaches, and the purchase and set-up of leveled classroom libraries.
17University of Penn -
Penn Assisted Private Grant
University of Penn - Penn Assisted - Lea & Alexander University of Penn provides funding to the Penn Alexander
School. University of Penn and The School District of Philadelphia have collaboratively initiated the development of a
K-8 neighborhood school. The goals of the partnership are to obtain the highest quality education for West
Philadelphian children and to achieve the mission of providing an instructional program of superior quality and state-of
-thhe-art teacher training opportunities in an urban school district.
18 SIG - Cohort 4Federal Grants -
Indirect
School Improvement Grant To implement an intensive school reform model which includes remediation and
enrichment for students, identification and purchase of instructional materials, and training necessary to implement
new or revised instructional programs and strategies.
19Philadelphia Pre-K
InitiativeLocal Grant
Philadelphia Pre-K Initiative To provide quality Pre-K programs in Philadelphia that have safe, well equiped
classrooms, trained teachers, a challenging proven play-based curriculum, parental engagement and a transition plan
to kindergarten. The purpose is to ensure that all children starting kindergarten are ready to learn. Quality Pre-K has
been linked to increased graduation rates.
20
Stormwater
Management
Incentive
Private
Stormwater Management Incentive Program - To transform large commercial impervious properties that generate
high volumes of stormwater runoff and burden the City's sewer system and waterways into properties that build and
maintain green stormwater management practices. These practices include rain gardens, vegetated infiltration basins,
porous asphalt and green roofs.
Source: School District of Philadelphia Finance Staff
Page 39 of 45

A B C D E F
Org.# School Learning Network Budget Encumbered Expended Balance
%
Obligated
% Bal.
Remaining
2016-17 YTD 3/31/17 YTD 3/31/17 A-B-C (B+C)/A D/A
GRAND TOTAL 12,600,569 2,566,080 4,047,945 5,986,544 52% 48%
5230 Conwell, Russell Autonomy Network 7,393 0 100 7,293 1% 99%
5050 Philadelphia Military Academy Autonomy Network 5,176 0 120 5,056 2% 98%
2620 Academy at Palumbo Autonomy Network 5,400 0 138 5,262 3% 97%
1580 Middle Years Alternative School Autonomy Network 2,698 0 93 2,605 3% 97%
6400 Widener Memorial School Autonomy Network 2,957 0 119 2,838 4% 96%
6230 Fitler, Edwin H. Autonomy Network 2,559 0 124 2,435 5% 95%
6480 Academy for the Middle Years at Northwest Autonomy Network 7,723 0 390 7,333 5% 95%
4480 Overbrook Educational Center Autonomy Network 59,944 5,320 50 54,574 9% 91%
2140 Masterman, Julia R. Autonomy Network 2,724 0 642 2,082 24% 76%
8040 Arts Academy at Benjamin Rush Autonomy Network 18,478 494 4,254 13,731 26% 74%
6010 Central High School Autonomy Network 11,748 0 3,157 8,591 27% 73%
6460 Hill-Freedman World Academy Autonomy Network 17,423 300 7,050 10,073 42% 58%
6050 Philadelphia High School for Girls Autonomy Network 15,753 0 8,085 7,668 51% 49%
6040 Saul, Walter B. Autonomy Network 27,067 0 15,691 11,376 58% 42%
8090 Swenson Arts and Technology High School Autonomy Network 26,059 0 15,312 10,747 59% 41%
2020 Creative and Performing Arts Autonomy Network 56,280 13,636 20,728 21,917 61% 39%
5080 Parkway Center City High School Autonomy Network 65,826 23,000 19,727 23,099 65% 35%
4030 Carver High School of Engineering and Science Autonomy Network 11,842 2,093 6,830 2,919 75% 25%
2290 Franklin Learning Center Autonomy Network 29,698 0 22,457 7,241 76% 24%
1190 Motivation High School Autonomy Network 56,997 6,720 39,262 11,015 81% 19%
2410 Girard Academic Music Program Autonomy Network 12,240 1,179 10,032 1,028 92% 8%
5150 Bodine, William W. Autonomy Network 49,538 2,661 44,157 2,720 95% 5%
5430 Alternative Middle Years at James Martin Autonomy Network 133,366 77 126,578 6,711 95% 5%
6540 Lankenau High School Autonomy Network 15,375 457 14,321 597 96% 4%
Total 644,264 55,937 359,417 228,910 64% 36%
5620 The U School Innovation Network 2,625 0 27 2,598 1% 99%
5610 Building 21 Innovation Network 10,268 0 109 10,159 1% 99%
2650 Science Leadership Academy Innovation Network 4,367 0 305 4,062 7% 93%
2680 Science Leadership Academy at Beeber Innovation Network 2,095 0 768 1,328 37% 63%
8780 Philadelphia Virtual Academy Innovation Network 51,507 0 19,000 32,507 37% 63%
5660 The LINC Innovation Network 4,022 2,145 30 1,847 54% 46%
8560 The Workshop School Innovation Network 2,459 1,315 97 1,047 57% 43%
Total 77,343 3,460 20,335 53,548 31% 69%
2520 Jenks, A.S. Neighborhood Network 1 5,411 0 160 5,251 3% 97%
1350 Longstreth, William Neighborhood Network 1 18,808 0 1,374 17,434 7% 93%
1130 Tilden, William Neighborhood Network 1 25,992 0 3,064 22,928 12% 88%
1400 Patterson, John M. Neighborhood Network 1 9,278 0 1,450 7,828 16% 84%
1010 Bartram, John Neighborhood Network 1 32,577 6,492 3,305 22,780 30% 70%
1260 Comegys, Benjamin B. Neighborhood Network 1 29,898 3,495 8,288 18,115 39% 61%
2540 Key, Francis Scott Neighborhood Network 1 20,176 1,596 7,221 11,359 44% 56%
2480 Arthur, Chester A. Neighborhood Network 1 5,482 0 2,425 3,057 44% 56%
1440 Penrose School Neighborhood Network 1 4,865 2,630 288 1,947 60% 40%
2370 McDaniel, Delaplaine Neighborhood Network 1 35,566 10,642 11,227 13,697 61% 39%
2240 Bregy, F. Amedee Neighborhood Network 1 5,070 3,366 220 1,484 71% 29%
2190 Fell, D. Newlin Neighborhood Network 1 60,715 7,770 36,510 16,435 73% 27%
2450 Stanton, Edwin M. Neighborhood Network 1 67,914 16,792 33,442 17,680 74% 26%
1380 Morton, Thomas G. Neighborhood Network 1 63,832 19,480 31,381 12,971 80% 20%
2000 South Philadelphia High School Neighborhood Network 1 40,540 20,187 12,865 7,488 82% 18%
1250 Catherine, Joseph W. Neighborhood Network 1 58,214 12,357 36,135 9,722 83% 17%
2260 Childs, George W. Neighborhood Network 1 107,334 89,000 4,645 13,689 87% 13%
2320 Girard, Stephen Neighborhood Network 1 59,013 52,760 810 5,443 91% 9%
2640 Southwark School Neighborhood Network 1 82,243 79,496 254 2,493 97% 3%
Total 732,928 326,063 195,064 211,801 71% 29%
FOR THE PERIOD ENDED MARCH 31, 2017
(Excludes Full Time Positions and All Benefits)
The following report details, for each District school in the current school year, a portion of the Title I budget and the amounts encumbered and expended
through March 31, 2017. As of March 31, 2017, Title I full-time positions at schools were budgeted at $64.2 million and year-to-date spend was $39.6 million;
Title I benefits for all school positions were budgeted at $44.7 million and year-to-date spend was $29.1 million. There is a proactive effort to assist schools in
purchasing on an on-going basis. Further, as the year progresses, Finance staff identify those schools that are slow to spend their funds and contact them to
identify roadblocks and assist in the spending process consistent with their Schoolwide Plan.
SM-5
QUARTERLY SCHOOL MANAGER REPORT
TITLE I: SCHOOL BY SCHOOL BUDGET TO ACTUAL OBLIGATIONS TO DATE
Page 40 of 45

A B C D E F
Org.# School Learning Network Budget Encumbered Expended Balance
%
Obligated
% Bal.
Remaining
2016-17 YTD 3/31/17 YTD 3/31/17 A-B-C (B+C)/A D/A
1340 Lea, Henry C. Neighborhood Network 2 52,188 0 400 51,788 1% 99%
1390 Powel, Samuel Neighborhood Network 2 5,857 0 50 5,807 1% 99%
1490 Blankenburg, Rudolph Neighborhood Network 2 15,658 0 245 15,413 2% 98%
1420 Washington, Martha Neighborhood Network 2 6,887 0 240 6,647 3% 97%
1030 High School of the Future Neighborhood Network 2 4,330 0 177 4,153 4% 96%
1470 Locke, Alain Neighborhood Network 2 12,322 0 550 11,772 4% 96%
4100 Beeber, Dimner Neighborhood Network 2 1,716 0 95 1,621 6% 94%
4020 Overbrook High School Neighborhood Network 2 6,172 0 342 5,830 6% 94%
4320 Lamberton, Robert Neighborhood Network 2 13,433 0 1,586 11,847 12% 88%
4240 Cassidy, Lewis C. Neighborhood Network 2 5,805 0 1,643 4,162 28% 72%
4300 Heston, Edward Neighborhood Network 2 13,134 3,547 400 9,187 30% 70%
4370 Overbrook Elementary Neighborhood Network 2 8,850 700 2,957 5,193 41% 59%
1410 Rhoads, James Neighborhood Network 2 13,112 0 6,252 6,860 48% 52%
1460 Anderson, Add B. Neighborhood Network 2 7,357 0 4,187 3,170 57% 43%
1100 Sayre, William L. Neighborhood Network 2 137,921 61,042 36,001 40,878 70% 30%
4280 Gompers, Samuel Neighborhood Network 2 29,995 0 21,416 8,579 71% 29%
5090 Parkway West High School Neighborhood Network 2 19,282 2,550 11,770 4,962 74% 26%
1050 Robeson, Paul Neighborhood Network 2 51,760 122 42,681 8,957 83% 17%
1300 Harrington, Avery D. Neighborhood Network 2 6,343 4,908 447 988 84% 16%
1280 Penn Alexander School Neighborhood Network 2 57,950 49,046 150 8,754 85% 15%
1290 Hamilton, Andrew Neighborhood Network 2 40,721 0 35,381 5,340 87% 13%
Total 510,793 121,915 166,970 221,909 57% 43%
2340 McCall, General George Neighborhood Network 3 3,477 0 250 3,227 7% 93%
2380 Meredith, William M. Neighborhood Network 3 1,854 0 150 1,704 8% 92%
2470 Greenfield, Albert M. Neighborhood Network 3 1,309 0 150 1,159 11% 89%
5160 Penn Treaty High School Neighborhood Network 3 24,880 10 3,241 21,629 13% 87%
4570 Meade, General George G. Neighborhood Network 3 8,216 625 1,007 6,584 20% 80%
2670 Constitution High School Neighborhood Network 3 21,041 0 4,211 16,830 20% 80%
5200 Adaire, Alexander Neighborhood Network 3 1,304 0 267 1,037 20% 80%
2390 Morris, Robert Neighborhood Network 3 9,379 0 1,928 7,451 21% 79%
2160 Furness, Horace Neighborhood Network 3 17,407 0 3,655 13,752 21% 79%
2720 Vare-Washington School Neighborhood Network 3 3,872 0 1,199 2,673 31% 69%
2210 Bache-Martin School Neighborhood Network 3 50,799 0 16,407 34,392 32% 68%
2580 Kirkbride, Elizabeth Neighborhood Network 3 61,206 0 21,246 39,960 35% 65%
2010 Franklin, Benjamin Neighborhood Network 3 72,048 28,044 320 43,684 39% 61%
2690 Taggart, John H. Neighborhood Network 3 24,563 9,417 792 14,353 42% 58%
2490 Waring, Laura W. Neighborhood Network 3 11,643 5,050 480 6,113 47% 53%
5480 Kearny, General Phillip Neighborhood Network 3 14,791 7,710 220 6,861 54% 46%
5340 Ludlow, James R. Neighborhood Network 3 70,543 26,354 15,339 28,850 59% 41%
2630 Sharswood, George W. Neighborhood Network 3 29,264 11,020 7,773 10,471 64% 36%
5370 Moffet, John Neighborhood Network 3 28,052 20,088 255 7,709 73% 27%
2590 Nebinger, George W. Neighborhood Network 3 6,885 1,987 3,683 1,216 82% 18%
2510 Jackson, Andrew Neighborhood Network 3 58,824 47,138 2,957 8,730 85% 15%
5560 Spring Garden School Neighborhood Network 3 21,782 19,369 463 1,950 91% 9%
Total 543,139 176,813 85,992 280,334 48% 52%
4270 Dick, William Neighborhood Network 4 26,657 0 430 26,227 2% 98%
4360 Kenderton Neighborhood Network 4 114,028 0 2,634 111,394 2% 98%
6390 Steel, Edward Neighborhood Network 4 95,964 0 2,519 93,445 3% 97%
6090 Randolph, A. Phillip Neighborhood Network 4 5,429 0 380 5,049 7% 93%
5260 Elkin, Lewis Neighborhood Network 4 30,053 1,460 986 27,607 8% 92%
4470 Wright, Richard R. Neighborhood Network 4 6,411 0 692 5,719 11% 89%
5170 de Burgos, Julia Neighborhood Network 4 28,539 1,166 4,719 22,654 21% 79%
7510 Bethune, Mary M. Neighborhood Network 4 11,054 0 2,805 8,249 25% 75%
4380 Peirce, Thomas M. Neighborhood Network 4 25,918 1,228 7,475 17,216 34% 66%
5060 Mastbaum, Jules E. Neighborhood Network 4 17,502 7,435 1,043 9,024 48% 52%
5490 Cayuga School Neighborhood Network 4 38,681 9,529 10,411 18,741 52% 48%
7440 Taylor, Bayard Neighborhood Network 4 1,837 356 750 731 60% 40%
5410 Sheppard, Isaac Neighborhood Network 4 9,183 3,500 3,140 2,543 72% 28%
4060 Dobbins, Murrell Neighborhood Network 4 9,101 575 6,335 2,191 76% 24%
4560 Kelley, William D. Neighborhood Network 4 27,511 20,000 1,860 5,651 79% 21%
4220 Blaine, James G. Neighborhood Network 4 8,005 3,499 2,928 1,578 80% 20%
5470 Cramp, William Neighborhood Network 4 21,006 14,240 4,663 2,103 90% 10%
4530 Gideon, Edward Neighborhood Network 4 127,486 89,025 33,032 5,429 96% 4%
7380 McClure, Alexander Neighborhood Network 4 100,110 86,730 11,187 2,193 98% 2%
4460 Duckrey, Tanner Neighborhood Network 4 141,470 132,336 6,582 2,552 98% 2%
Total 845,945 371,078 104,571 370,296 56% 44%
Page 41 of 45

A B C D E F
Org.# School Learning Network Budget Encumbered Expended Balance
%
Obligated
% Bal.
Remaining
2016-17 YTD 3/31/17 YTD 3/31/17 A-B-C (B+C)/A D/A
5420 Welsh, John Neighborhood Network 5 15,065 0 568 14,497 4% 96%
5700 Kensington High School Neighborhood Network 5 25,093 3,253 651 21,189 16% 84%
5350 McKinley, William Neighborhood Network 5 48,560 14,723 1,030 32,807 32% 68%
5520 Kensington High School for Creative and Performing ArtsNeighborhood Network 5 15,463 5,272 1,026 9,165 41% 59%
5440 Willard, Frances Neighborhood Network 5 16,185 5,000 2,177 9,008 44% 56%
7150 Juniata Park Academy Neighborhood Network 5 43,284 6,799 13,363 23,121 47% 53%
5330 Hunter, William H. Neighborhood Network 5 9,209 285 4,395 4,529 51% 49%
5590 Webster, John Neighborhood Network 5 17,997 0 12,505 5,492 69% 31%
5300 Hackett, Horatio B. Neighborhood Network 5 39,210 6,696 20,934 11,580 70% 30%
5400 Richmond School Neighborhood Network 5 41,222 0 32,350 8,872 78% 22%
5550 Kensington Health Sciences Academy Neighborhood Network 5 182,138 150,000 380 31,758 83% 17%
5530 Sheridan, Philip Neighborhood Network 5 20,167 6,976 10,160 3,031 85% 15%
5320 Hartfranft, John F. Neighborhood Network 5 13,627 754 11,584 1,289 91% 9%
7300 Hopkinson, Francis Neighborhood Network 5 7,327 0 6,827 500 93% 7%
5210 Brown, Henry A. Neighborhood Network 5 25,086 2,763 22,510 (186) 100% 0%
Total 519,633 202,521 140,460 176,653 66% 34%
5070 Parkway Northwest High School Neighborhood Network 6 4,969 0 40 4,929 1% 99%
6410 Cook-Wissahickon School Neighborhood Network 6 2,134 0 220 1,914 10% 90%
6450 Dobson, James Neighborhood Network 6 18,430 0 2,690 15,740 15% 85%
6260 Houston, Henry Neighborhood Network 6 44,292 7,494 250 36,548 17% 83%
6470 Kelly, John B. Neighborhood Network 6 58,664 740 9,651 48,273 18% 82%
6320 Mifflin, Thomas Neighborhood Network 6 41,510 4,560 8,623 28,328 32% 68%
6440 Lingelbach, Anna L. Neighborhood Network 6 16,311 0 6,142 10,169 38% 62%
6270 Jenks Academy for Arts and Sciences Neighborhood Network 6 44,389 4,650 16,000 23,739 47% 53%
6200 Day, Anna B. Neighborhood Network 6 95,741 31,511 14,651 49,580 48% 52%
6350 Pennypacker, Samuel Neighborhood Network 6 5,346 2,447 160 2,739 49% 51%
6210 Edmonds, Frankin Neighborhood Network 6 13,210 7,073 250 5,887 55% 45%
6220 Emlen, Eleanor Neighborhood Network 6 13,634 1,524 8,017 4,092 70% 30%
6250 Henry, Charles W. Neighborhood Network 6 30,230 0 21,250 8,980 70% 30%
6030 Roxborough High School Neighborhood Network 6 80,880 48,731 11,194 20,955 74% 26%
6300 Logan, James Neighborhood Network 6 12,332 8,250 925 3,157 74% 26%
6310 McCloskey, John F. Neighborhood Network 6 10,824 7,944 184 2,696 75% 25%
6380 Shawmont School Neighborhood Network 6 26,257 2,825 19,619 3,813 85% 15%
Total 519,153 127,748 119,865 271,540 48% 52%
7130 Wagner, General Louis Neighborhood Network 7 13,336 0 5,695 7,641 43% 57%
7320 Howe, Julia W. Neighborhood Network 7 6,406 1,966 864 3,576 44% 56%
7260 Ellwood School Neighborhood Network 7 5,485 1,243 1,628 2,614 52% 48%
7120 Fels, Samuel Neighborhood Network 7 37,125 9,343 10,717 17,065 54% 46%
6340 Pennell, Joseph Neighborhood Network 7 25,637 229 13,658 11,750 54% 46%
7390 Morrison, Andrew J. Neighborhood Network 7 25,146 5,736 9,734 9,675 62% 38%
7200 Barton, Clara Neighborhood Network 7 28,035 2,600 15,724 9,711 65% 35%
7490 Prince Hall School Neighborhood Network 7 31,407 7,896 13,049 10,462 67% 33%
7280 Franklin, Benjamin (elementary) Neighborhood Network 7 53,815 7,591 28,392 17,832 67% 33%
7370 Washington Jr., Grover Neighborhood Network 7 60,518 13,957 27,135 19,425 68% 32%
7530 Rowen, William Neighborhood Network 7 40,197 2,289 28,175 9,733 76% 24%
7220 Carnell, Laura H. Neighborhood Network 7 130,091 68,173 37,060 24,858 81% 19%
7400 Olney School Neighborhood Network 7 7,786 4,230 2,517 1,039 87% 13%
7350 Lowell, James R. Neighborhood Network 7 31,708 2,976 24,660 4,072 87% 13%
7310 Feltonville Intermediate School Neighborhood Network 7 116,094 56,132 48,393 11,570 90% 10%
5500 Marshall, Thurgood Neighborhood Network 7 154,392 136,630 10,730 7,031 95% 5%
7270 Finletter, Thomas K. Neighborhood Network 7 89,839 835 88,467 537 99% 1%
7500 Feltonville School of Arts and Sciences Neighborhood Network 7 74,625 2,851 71,733 41 100% 0%
Total 931,642 324,679 438,332 168,631 82% 18%
8020 Northeast High School Neighborhood Network 8 37,792 0 14,309 23,483 38% 62%
8230 Crossan, Kennedy C. Neighborhood Network 8 16,181 3,766 2,656 9,759 40% 60%
8390 Fitzpatrick, Aloysius L. Neighborhood Network 8 8,723 3,517 320 4,886 44% 56%
8400 Frank, Anne Neighborhood Network 8 21,809 2,394 9,106 10,309 53% 47%
8350 Spruance, Gilbert Neighborhood Network 8 99,220 9,624 48,643 40,953 59% 41%
8360 Rhawnhurst School Neighborhood Network 8 21,997 6,205 7,010 8,782 60% 40%
8430 Greenberg, Joseph Neighborhood Network 8 70,880 13,699 30,929 26,252 63% 37%
8770 Hancock, John Neighborhood Network 8 26,188 10,306 8,185 7,697 71% 29%
8370 Comly, Watson Neighborhood Network 8 7,710 1,425 4,177 2,107 73% 27%
8030 Washington, George Neighborhood Network 8 159,221 74,538 45,059 39,623 75% 25%
8160 Baldi School Neighborhood Network 8 93,998 24,500 54,061 15,437 84% 16%
8420 Decatur, Stephen Neighborhood Network 8 11,268 3,980 5,745 1,543 86% 14%
8440 Loesche, William H. Neighborhood Network 8 24,892 10,957 10,647 3,288 87% 13%
8260 Fox Chase School Neighborhood Network 8 3,382 1,120 2,011 251 93% 7%
8380 Farrell, Louis H. Neighborhood Network 8 251,760 8,354 235,022 8,384 97% 3%
8120 Wilson, Woodrow Neighborhood Network 8 13,198 0 12,947 251 98% 2%
8340 Solis-Cohen, Solomon Neighborhood Network 8 28,637 15,924 12,533 180 99% 1%
8310 Moore, J. Hampton Neighborhood Network 8 84,359 10,668 73,319 372 100% 0%
Total 981,215 200,979 576,680 203,556 79% 21%
Page 42 of 45

A B C D E F
Org.# School Learning Network Budget Encumbered Expended Balance
%
Obligated
% Bal.
Remaining
2016-17 YTD 3/31/17 YTD 3/31/17 A-B-C (B+C)/A D/A
7330 Lawton, Henry W. Neighborhood Network 9 3,291 0 250 3,041 8% 92%
7010 Frankford High School Neighborhood Network 9 115,139 9,250 10,309 95,580 17% 83%
8240 Disston, Hamilton Neighborhood Network 9 38,248 5,040 1,635 31,573 17% 83%
8200 Allen, Ethan Neighborhood Network 9 53,054 4,132 9,331 39,591 25% 75%
8210 Brown, Joseph H. Neighborhood Network 9 27,936 4,395 4,585 18,956 32% 68%
8300 Mayfair School Neighborhood Network 9 16,413 0 5,678 10,735 35% 65%
7460 Ziegler, William H. Neighborhood Network 9 54,084 8,632 10,888 34,564 36% 64%
8010 Lincoln, Abraham Neighborhood Network 9 86,291 21,949 23,213 41,129 52% 48%
7360 Marshall, John Neighborhood Network 9 45,521 5,805 18,996 20,720 54% 46%
7430 Sullivan, James J. Neighborhood Network 9 71,320 16,915 24,775 29,630 58% 42%
8250 Forrest, Edwin Neighborhood Network 9 121,326 28,786 42,921 49,619 59% 41%
7470 Bridesburg School Neighborhood Network 9 13,134 8,748 250 4,136 69% 31%
8270 Holme, Thomas Neighborhood Network 9 18,265 0 14,123 4,142 77% 23%
8410 Pollock, Robert B. Neighborhood Network 9 38,951 6,547 24,175 8,229 79% 21%
8140 Meehan, Austin Neighborhood Network 9 26,215 8,364 12,536 5,315 80% 20%
7290 Stearne, Allen M. Neighborhood Network 9 20,963 6,546 11,266 3,151 85% 15%
7110 Harding, Warren G. Neighborhood Network 9 111,107 75,647 27,762 7,698 93% 7%
Total 861,258 210,756 242,695 407,808 53% 47%
8460 Phila. Learning Academy South Opportunity Network 19,106 0 0 19,106 0% 100%
8470 Phila. Learning Academy North Opportunity Network 104,669 0 0 104,669 0% 100%
2530 Phila. Juv. Justice Services Ctr. Opportunity Network 141,689 29,300 51,632 60,757 57% 43%
8540 Pennypack House School Opportunity Network 142,596 15,232 71,664 55,700 61% 39%
Total 408,060 44,532 123,296 240,232 41% 59%
4140 Strawberry Mansion High School Turnaround Network 201,353 0 23,514 177,839 12% 88%
7730 Clemente, Roberto Turnaround Network 221,404 0 51,679 169,725 23% 77%
1200 Barry, John Turnaround Network 384,293 1,650 89,017 293,626 24% 76%
1370 Mitchell, S. Weir Turnaround Network 399,450 0 99,127 300,323 25% 75%
1360 McMichael, Morton Turnaround Network 241,907 0 61,872 180,035 26% 74%
7100 Cooke, Jay Turnaround Network 270,199 0 69,337 200,862 26% 74%
6060 King, Martin Luther Turnaround Network 469,569 0 127,512 342,057 27% 73%
1020 West Philadelphia High School Turnaround Network 267,411 0 88,194 179,217 33% 67%
4350 Rhodes, E. Washington Turnaround Network 379,334 33,974 107,687 237,673 37% 63%
5390 Potter-Thomas School Turnaround Network 288,751 0 113,455 175,296 39% 61%
5020 Edison, Thomas A. Turnaround Network 627,240 92,113 183,895 351,232 44% 56%
6360 Roosevelt, Theodore Turnaround Network 252,146 0 112,884 139,262 45% 55%
4440 Allen, Ethel Turnaround Network 207,643 0 95,680 111,964 46% 54%
5680 Munoz-Marin, Luis Turnaround Network 452,432 166,039 101,237 185,157 59% 41%
5250 Dunbar, Paul L. Turnaround Network 140,859 944 84,890 55,024 61% 39%
1230 Bryant, William Turnaround Network 221,205 104,880 64,291 52,034 76% 24%
Total 5,025,196 399,600 1,474,270 3,151,326 37% 63%
Source: Point-in-time Data from the District's Accounting System for Budget and Expenditures
Page 43 of 45

OVERALL AWARDS
Summary2014-15
Full Year
2015-16
Full Year
2016-17
YTD Dec. 31, 2016
Total Awards 442 505 220
Total Dollars $441.6 M $430.6 M $68.7 M
Dollars to MWBE $177.1 M $154.9 M $24.0 M
% of Dollars to MWBE 40% 36% 35%
Total MWBE Vendors 387 369 153
DESIGN AND CONSTRUCTION CONTRACT AWARDS
Summary2014-15
Full Year
2015-16
Full Year
2016-17
YTD Dec. 31, 2016
Total Awards 97 144 68
Total Dollars $58.1 M $71.0 M $20.1 M
Dollars to MWBE $41.0 M $34.1 M $8.0 M
% of Dollars to MWBE 70% 48% 40%
Total MWBE Vendors 163 168 87
PROFESSIONAL SERVICES CONTRACT AWARDS
Summary2014-15
Full Year
2015-16
Full Year
2016-17
YTD Dec. 31, 2016
Total Awards 278 238 121
Total Dollars $336.4 M $175.1 M $27.6 M
Dollars to MWBE $125.2 M $91.5 M $13.5 M
% of Dollars to MWBE 37% 52% 49%
Total MWBE Vendors 190 149 57
PURCHASING SERVICES CONTRACT AWARDS
Summary2014-15
Full Year
2015-16
Full Year
2016-17
YTD Dec. 31, 2016
Total Awards 67 123 31
Total Dollars $47.0 M $184.4 M $21.0 M
Dollars to MWBE $10.7 M $29.1 M $2.5 M
% of Dollars to MWBE 22% 15% 12%
Total MWBE Vendors 34 52 9
Additional Notes:
Source: School District of Philadelphia Office of Procurement Services
b. The above numbers do not include City, State or Government Contracts; Proprietary Licenses/Sole Sources; Educational Partnerships or
Cooperative Agreements.
c. Percentages within charts and total dollar amounts in the Overall Summary may not match due to rounding.
In FY 2017 as of December 31, 20161, the District awarded a total of 220 contracts. The following tables
summarize the District's Minority and Women Business Enterprise (MWBE) participation by year and
category:
SM-6
QUARTERLY SCHOOL MANAGER REPORT
MINORITY AND WOMEN BUSINESS ENTERPRISE PARTICIPATION
FOR THE PERIOD ENDED DECEMBER 31, 20161
a. The MWBE expenditure and participation values shown here are from the monthly School Reform Commission Public Action/Approval Meetings.
The dollar values are based upon an approved not to exceed amount. The final dollar value may be lower than the amount approved on the School
Reform Commission Resolution.
1 FY17 Quarter 3 MWBE data (January 1 - March 31, 2017) has not been finalized, and therefore the 2016-17 information included in this report is as
of December 31, 2016.
Page 44 of 45
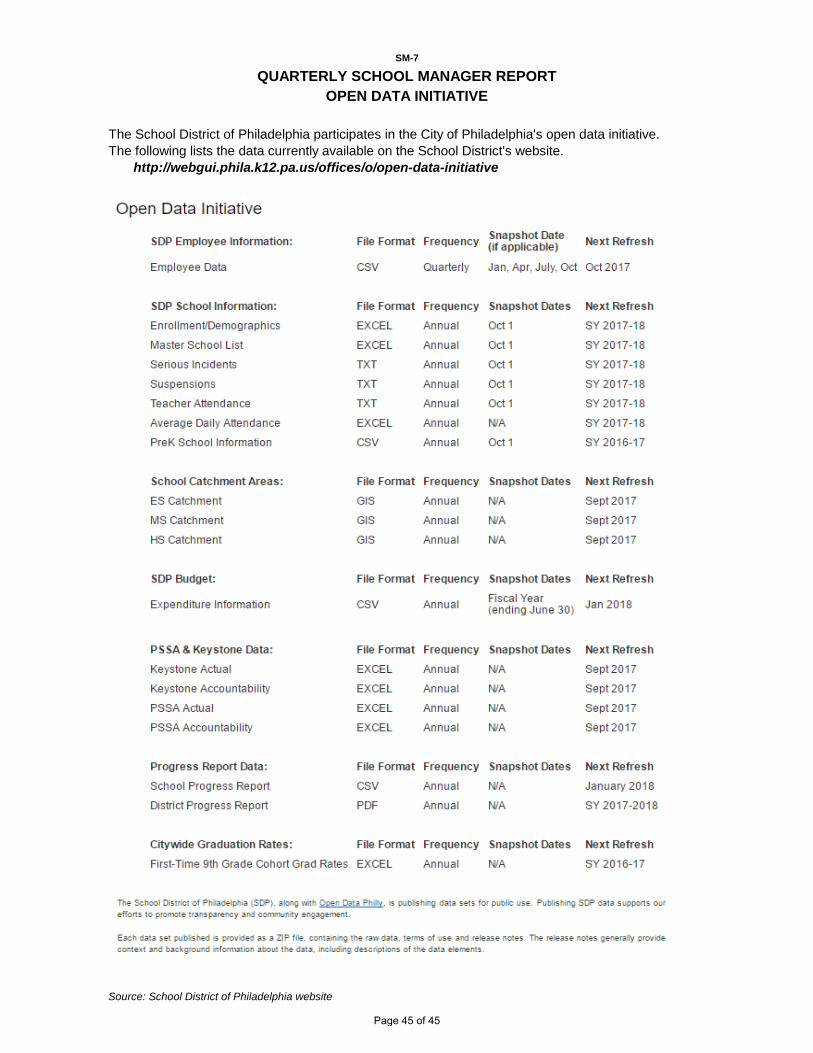
The School District of Philadelphia participates in the City of Philadelphia's open data initiative.
The following lists the data currently available on the School District's website.
http://webgui.phila.k12.pa.us/offices/o/open-data-initiative
Source: School District of Philadelphia website
SM-7
QUARTERLY SCHOOL MANAGER REPORT
OPEN DATA INITIATIVE
Page 45 of 45