SCHOOL COUNSELORS’ PERSPECTIVE ON HIGH-STAKES TESTING: EXPLORING...
206
SCHOOL COUNSELORS’ PERSPECTIVE ON HIGH-STAKES TESTING: EXPLORING THE IMPACT OF HIGH-STAKES TESTING ON STUDENTS AND COUNSELORS by Joseph J. Fraas Bachelor of Arts, Westminster College, 2002 Master of Science, Chatham University, 2006 Submitted to the Graduate Faculty of The School of Education in partial fulfillment of the requirements for the degree of Doctor of Education University of Pittsburgh 2014
Transcript of SCHOOL COUNSELORS’ PERSPECTIVE ON HIGH-STAKES TESTING: EXPLORING...

SCHOOL COUNSELORS’ PERSPECTIVE ON HIGH-STAKES TESTING:
EXPLORING THE IMPACT OF HIGH-STAKES TESTING ON STUDENTS AND
COUNSELORS
by
Joseph J. Fraas
Bachelor of Arts, Westminster College, 2002
Master of Science, Chatham University, 2006
Submitted to the Graduate Faculty of
The School of Education in partial fulfillment
of the requirements for the degree of
Doctor of Education
University of Pittsburgh
2014

ii
UNIVERSITY OF PITTSBURGH
SCHOOL OF EDUCATION
This dissertation was presented
by
Joseph J. Fraas
It was defended on
April 15, 2014
and approved by
Dr. Michael Gunzenhauser, Associate Professor, Administrative and Policy Studies
Dr. W. James Jacob, Associate Professor, Administrative and Policy Studies
Dr. R. Gerard Longo, Associate Professor, Administrative and Policy Studies
Dissertation Advisor: Dr. Cynthia Tananis, Associate Professor, Administrative and Policy
Studies

iii
Copyright © by Joseph J. Fraas
2014

iv
SCHOOL COUNSELORS’ PERSPECTIVE ON HIGH-STAKES TESTING:
EXPLORING THE IMPACT OF HIGH-STAKES TESTING ON STUDENTS AND
COUNSELORS
Joseph J. Fraas
University of Pittsburgh, 2014
Reliance on standardized testing has increased over the past 50 years. As a tool to measure
student and school performance, high-stakes tests are a focal point of accountability systems in
place through state reform and federal legislation. This study explored Allegheny County
Counselor Association (ACCA) members’ perceptions on the impact high-stakes testing has on
the psychological and emotional well-being (motivation, stress, and test anxiety) of students, as
well as their perceptions of how high-stakes testing has impacted the role and work environment
of professional school counselors. Current ACCA members completed a survey consisting of
open and closed-ended questions. Although the results from this study show the impact on the
school counselor’s role and work environment have not changed dramatically; it appears students
are experiencing higher levels of stress and test anxiety associated with the use of high-stakes
tests. School counselors stated there is less time available to spend with students due to changes
to their role, such as acting as the test coordinator or proctor for high-stakes tests, but high-stakes
testing has not impacted the amount of time counselors spend conducting classroom lessons,
small group lessons, and individual counseling sessions in the areas of test preparation skills,
college and career readiness, personal and social skills, and academic goals that are not test
preparation based. Data show the accountability system in place seems to impact student
motivation positively, but has increased the amount of stress and test anxiety students’
experience, along with negatively impacting student morale. Differences observed among the
subgroups studied, Education-Challenge and AYP-Status, may be significant since research has

v
shown high-stakes testing widens the educational gap between whites and minorities, and
affluent and impoverished. Further exploration may find the differences that exist between the
subgroups may negatively impact student performance and play a role in widening the existing
educational gap. Although the sample size is relatively small and the findings cannot be
generalized, data from this study may provide insight to school counselors, teachers,
administrators, and policymakers when considering any future changes to high-stakes testing
programs.

vi
TABLE OF CONTENTS
1.0 INTRODUCTION ........................................................................................................ 1
1.1 VIGNETTE .......................................................................................................... 4
1.2 PERTINENT DEFINITIONS............................................................................. 5
1.2.1 High-stakes tests ............................................................................................ 5
1.2.2 Psychological and emotional well-being...................................................... 6
1.2.3 Stress .............................................................................................................. 6
1.2.4 Test anxiety .................................................................................................... 6
1.2.5 Motivation ...................................................................................................... 7
1.2.6 Education-Challenge ..................................................................................... 7
1.3 STATEMENT OF PROBLEM .......................................................................... 7
1.4 RESEARCH QUESTIONS ................................................................................. 9
2.0 REVIEW OF LITERATURE ................................................................................... 11
2.1 POSSIBLE REASONS FOR NCLB AND HIGH-STAKES TESTING ....... 11
2.2 HISTORY OF HIGH-STAKES TESTING..................................................... 13
2.2.1 The early years ............................................................................................ 13
2.2.2 The 1960s and 1970s ................................................................................... 14
2.2.3 The 1980s ..................................................................................................... 15
2.2.4 The 1990s ..................................................................................................... 16
vii
2.2.5 Presidents G.W. Bush and Obama ............................................................ 17
2.3 SCHOOL COUNSELOR’S ROLE AND WORK ENVIRONMENT .......... 19
2.3.1 Impact of high-stakes testing on the school counselor’s role .................. 23
2.3.1.1 Positive impact of high-stakes testing according to school counselors... 27
2.3.1.2 Negative impact of high-stakes testing according to school counselors . 28
2.3.2 Impact of high-stakes testing on the school counselor’s work
environment ................................................................................................................ 29
2.4 STUDENT ENGAGEMENT AND PERSISTENCE ...................................... 31
2.5 LEARNING AND SCORES ............................................................................. 31
2.5.1 Negative impact on learning ...................................................................... 35
2.5.2 Positive impact on learning ........................................................................ 38
2.5.3 Minority and socio-economic status .......................................................... 40
2.6 PSYCHOLOGICAL AND EMOTIONAL WELL-BEING........................... 43
2.6.1 Stress and test anxiety ................................................................................ 43
2.6.2 Motivation .................................................................................................... 47
3.0 METHODOLOGY ..................................................................................................... 52
3.1 STATEMENT OF THE PROBLEM ............................................................... 53
3.2 RESEARCH QUESTIONS ............................................................................... 54
3.3 DATA COLLECTION ...................................................................................... 55
3.3.1 Survey development .................................................................................... 56
3.3.2 Survey........................................................................................................... 59
3.3.3 Participants .................................................................................................. 61
3.4 DATA ANALYSIS ............................................................................................. 64

viii
3.5 LIMITATIONS .................................................................................................. 65
3.6 CONCLUSION OF METHODS SECTION ................................................... 67
4.0 DEOMOGRAPHIC AND OPEN-ENDED QUESTION RESULTS ..................... 68
4.1 DEMOGRAPHIC DATA .................................................................................. 69
4.2 OPEN-ENDED QUESTIONS........................................................................... 72
5.0 RESEARCH QUESTION 1: RESULTS AND DISCUSSION ...................... 76
5.1 INVOLVEMENT IN COUNSELING ACTIVITIES: RESULTS AND
DISCUSSION ...................................................................................................................... 77
5.2 CLASSROOM LESSONS: RESULTS AND DISCUSSION ......................... 90
5.2.1 Classroom lessons: Results ......................................................................... 90
5.2.2 Classroom lessons: Discussion ................................................................... 93
5.3 SMALL GROUP LESSONS: RESULTS AND DISCUSSION ..................... 95
5.3.1 Small group lessons: Results ...................................................................... 95
5.3.2 Small group lessons: Discussion .............................................................. 100
5.4 INDIVIDUAL COUNSELING: RESULTS AND DISCUSSION ............... 102
5.4.1 Individual counseling: Results ................................................................. 102
5.4.2 Individual counseling: Discussion ........................................................... 107
5.5 OPEN-ENDED QUESTION REGARDING COUNSELOR’S ROLE ....... 108
5.6 RESEARCH QUESTION 1: CONCLUSION............................................... 110
6.0 RESEARCH QUESTION 2: RESULTS AND DISCUSSION .................... 113
6.1 RESEARCH QUESTION 2: RESULTS ....................................................... 113
6.2 RESEARCH QUESTION 2: DISCUSSION ................................................. 121
7.0 RESEARCH QUESTION 3: RESULTS AND DISCUSSION .................... 125

ix
7.1 RESEARCH QUESTION 3: RESULTS ....................................................... 125
7.2 STRESS AND TEST ANXIETY: DISCUSSION ......................................... 138
7.3 MOTIVATION: DISCUSSION ..................................................................... 139
7.4 RESEARCH QUESTION 3: CONCLUSION............................................... 143
8.0 RECOMMENDATIONS, FUTURE RESEARCH, AND CONCLUSION ........ 145
8.1 RECOMMENDATIONS FOR POLICY MAKERS AND PLANNERS .... 145
8.2 RECOMMENDATIONS FOR SCHOOL COUNSELORS ........................ 147
8.3 FUTURE RESEARCH .................................................................................... 149
8.4 CONCLUSION ................................................................................................ 152
APPENDIX A MATRIX OF METHODOLOGY .................................................................. 162
APPENDIX B PARTICIPATION LETTER ......................................................................... 164
APPENDIX C MATRIX OF SURVEY QUESTIONS .......................................................... 165
APPENDIX D SURVEY........................................................................................................... 166
APPENDIX E CHANGE IN COUNSELOR’S ROLE DIRECTLY INVOLVING
STUDENTS ............................................................................................................................... 174
APPENDIX F INTERACTING WITH SCHOOL ADMINISTRATORS REGARDING
STUDENT IMPROVEMENT ................................................................................................. 175
APPENDIX G STUDENT ENGAGEMENT DURING HIGH-STAKES TESTING ........ 176
APPENDIX H STUDENTS’ FEELINGS REGARDING HIGH-STAKES TESTS ........... 177
APPENDIX I STRESS RELATED TO HIGH-STAKES TESTS ........................................ 178
APPENDIX J STUDENT DISCUSSIONS WITH COUNSELORS REGARDING HIGH-
STAKES TEST RESULTS ...................................................................................................... 179

x
APPENDIX K OPEN-ENDED QUESTION: COUNSELOR PERCEPTIONS OF STRESS
LEVELS IN STUDENTS ......................................................................................................... 180
APPENDIX L OPEN-ENDED QUESTION: COUNSELOR PERCEPTIONS OF
MOTIVATION ......................................................................................................................... 181
APPENDIX M OPEN-ENDED QUESTION: AREAS OF THE MOST CHANGE .......... 182
APPENDIX N OPEN-ENDED QUESTION: HIGH-STAKES TESTING ENCOURAGING
POSITIVE CHANGE ............................................................................................................... 183
BIBLIOGRAPHY ..................................................................................................................... 184

xi
LIST OF TABLES
Table 1. PSSA math results .......................................................................................................... 33
Table 2. PSSA reading results ...................................................................................................... 34
Table 3. SAT results ..................................................................................................................... 34
Table 4. Involvement in counseling related activities .................................................................. 78
Table 5. Reviewing student assessment results ............................................................................ 80
Table 6. Talking with parents about high-stakes testing ............................................................... 81
Table 7. Meeting with building administrators to plan for school improvement ......................... 83
Table 8. Acting as test coordinator ............................................................................................... 84
Table 9. Offering after school assistance ...................................................................................... 86
Table 10. Revising the counseling curriculum ............................................................................. 87
Table 11. Counselor’s role involving students ............................................................................. 88
Table 12. Time engaged and change experienced in classroom guidance lessons ....................... 90
Table 13. Cross-tabulations of time engaged and change experienced in classroom lessons ....... 92
Table 14. Time engaged and change experienced in small group lessons .................................... 96
Table 15. Cross-tabulations of time engaged and change experienced in small group lessons
.......................................................................................................................................... 98'''''''''''''''''''
Table 16. Time engaged and change experienced in individual counseling ............................... 103
Table 17. Cross-tabulations of time engaged and change experienced in individual counseling105
xii
Table 18. Cross-tabulations of interactions with school administrators ..................................... 114
Table 19. Change in work environment ...................................................................................... 115
Table 20. Cross-tabulation of work environment: relationships ................................................. 117
Table 21. Cross-tabulation of work environment: discipline and attendance…………………..120
Table 22. Cross-tabulation of student engagement ..................................................................... 127
Table 23. Cross-tabulation of feelings regarding high-stakes tests ............................................ 129
Table 24. Cross-tabulation of stress and high-stakes tests .......................................................... 131
Table 25. Cross-tabulation of student discussions ...................................................................... 132
Table 26. Counselor perception of the change in student morale, motivation, stress, and test
anxiety ......................................................................................................................................... 134
Table 27. Morale, motivation, stress, and test anxiety ................................................................ 135

1
1.0 INTRODUCTION
Reliance on high-stakes tests has increased over the past 50 years. Only a handful of states
required students take high-stakes tests prior to 1980, but by 2000, high-stakes tests were a
requirement in nearly every state (Hoffman, Assaf, & Paris, 2001). The increase in high-stakes
testing stems from national legislation emphasizing state-level accountability in an attempt to
improve academic performance (Gunzenhauser, 2007). As a tool to measure student and school
improvement, assessments are a focal point of state reforms and federal legislation, emphasizing
school accountability and improved student outcomes (Katsiyannis, Zhang, Ryan, & Jones,
2007). The role of high-stakes testing is greater than ever, due to the increased levels of
accountability on schools, students, and educators (Amrein & Berliner 2003; Ananda &
Rabinowitz, 2000; Gunzenhauser, 2006). It is important to understand the impact high-stakes
testing and the current accountability system has on public education because “the very survival
of a political democracy depends on a participating and educated citizenry” (Sirotnik, 2002, p.
664).
Research shows benefits exist with the implementation of high-stakes testing; however,
much of the research shows the negative effects associated with high-stakes testing are negating
any benefits. Benefits, such as improved academic performance and a more focused approach on
student achievement by educators may not outweigh the negative impact observed, such as
higher dropout and retention rates (Katsiyannis, 2007; Nichols, 2007). Jones and Egley (2004)

2
believe the policies enacted by the federal government to hold schools accountable are
counterproductive. These policies call for greater school accountability in an effort to help
increase student learning; however, instead of “leaving no child behind, current policies, if
continued, are bound to increase existing inequities, trivialize schooling, and mislead the public
about the quality and promise of public education” (Jones & Egley, 2004, p. 1). Educators have
issues with the use of these tests, because these tests are oversimplifying and undermining the
teaching profession, which negatively impacts students (Jones & Egley, 2004).
Researchers have uncovered potential problems by relying solely on standardized tests,
which some states now do, to make decisions affecting so many people. Problems include a
negative impact on students, a disproportionately high impact on minority students, negative
changes to curricula, and corruption within the educational system. Schools relying solely on the
results of high-stakes tests can lead to problems because of factors other than student
achievement affecting test scores (Gunzenhauser, 2003). The educational reform efforts
occurring have led to unintended consequences that minimize the intended, positive outcomes
(Horn, C., 2003).
Some researchers and educators see positive results with the implementation of
accountability systems and high-stakes testing. Since the start of the No Child Left Behind Act of
2001 (NCLB), educators believe parents are more concerned with their children’s education and
the atmosphere of schools seem more focused on learning (Dollarhide & Lemberger, 2006).
Special education programs and English Language Learners receive more attention and increased
funding (Coltrane, 2002). Some school counselors notice a more rigid curriculum with an
increased focus on academic goals, all of which may help students succeed in school and
beyond; however, there is a give and take when it comes to accountability systems and high-

3
stakes testing. Teachers are confronted with “the ideological commitment and the practical
effects of testing” (Horn, C., 2003, p. 247). Although the policies have raised standards, and
some educators see an increase in student learning, they are also aware of the increased stress
and anxiety felt by students, as well as increases in grade retention and dropout rates among
students (Katsiyannis et al., 2007; Nichols, 2007). As more importance is placed on the results of
high-stakes tests to increase accountability, schools curricula may narrow because test and test
taking strategies become the focal point for educators. The policies are designed to improve
ineffective teaching, and to replace teachers unable, or unwilling to improve, but it also may
prevent good teachers from teaching effectively by eliminating their creativity and spontaneity
(Horn, C., 2003).
In many schools, counselors have a role during testing. School counselors may administer
and coordinate high-stakes tests, complete make-up tests, and score completed tests (Brown,
Galassi, & Akos, 2004). Elementary counseling programs may improve academic achievement,
behaviors, and can contribute to a positive learning environment (Sink & Stroh, 2003). Students
may seek the expertise of counselors to discuss their thoughts and feelings in personal, social,
academic, and career areas. Teachers and administrators may also seek the advice of school
counselors, asking their professional opinion on student issues. Due to the knowledge counselors
possess of the social and emotional needs of students they can provide insight into the impact
testing has on students’ psychological and emotional well-being. They can also provide insight
into how testing has impacted their role and work environment; however, few research studies
have explored these areas from the school counselor’s perspective.

4
1.1 VIGNETTE
This vignette is about a fourth grade student diagnosed with a learning disability and emotional
disturbance, who was required to take the math and reading portions of the Pennsylvania System
of School Assessments (PSSA) individually with the school counselor. This student was a fourth
grader reading and completing math at a beginning of second grade level. When the exam was
given to the student, he asked the counselor why he had to take the test. He then dropped to the
floor; rolled around and whined that he did not want to take the test. He then got up off the floor
sat down and said “why don’t the teachers have to take these tests, so they can see how hard they
are?” After being told that his teachers have taken similar tests, and even harder tests, he stated
again that he did not want to take the test. He said if he sat there all day, and did not take the test,
he would be able to get on the bus and go home. He was told that the school would keep him
until he was done and then drive him home. He said he would just stay there all night. Then he
asked what would happen if he threw the test outside, while people waited outside ready to shoot
at the person that came to pick the test up, would the counselor still go get the test and make him
do it? When he was told yes, he asked what if aliens were attacking the school and we all had to
run away so we were not attacked, would he still need to take the test? When he was told yes, he
asked if he would have to take it if he were in heaven. At this point, he began to complete some
of the test. He completed three questions, and said to himself that he wished he were dead, so he
did not have to take the test.
This particular student had to take eight different sections that were similar to this section
of the test, spread out over four days. A similar response to the account described above, was
witnessed the three other days he participated in testing. Due to his reaction to testing the
previous year, the counselor administered the test to him individually each day. For most

5
students, each section of the test took one hour or less, he took over two and a half hours for each
section, because he would continually get frustrated and have a “melt-down”. These “melt-
downs” consisted of him repeatedly throwing a pencil, rolling on the floor, screaming loudly,
trying to do other things to avoid testing (such as organize books in the room, or pick lint out of
the carpet), purposely breaking the pencil point, and asking for bathroom and drink breaks
repeatedly. This action was repeated throughout the four days of testing. I was the counselor
administering these tests to this student, and so began my interest in the impact high-stakes
testing has on students.
As the counselor for this student, I was torn by what to do. It is normally my job to help
students through difficult situations, to help them cope with stress and anxiety, and here I was
administering a test that was causing this student to experience an extreme amount of stress and
anxiety for the better part of a week, multiple times per year. I never had the same relationship
with this particular student again. After this experience, I often wondered if other counselors
have similar experiences, or if mine was a unique experience.
1.2 PERTINENT DEFINITIONS
1.2.1 High-Stakes Testing
A test is considered high-stakes when results are used as criteria to determine important factors
impacting students, staff, schools, administrators, and school districts. Factors affecting
individual students may include high school graduation, promotion to the next grade level,
entrance into college, placement into gifted programs, and scholarship opportunities. Student test

6
scores can affect teacher evaluations, pay increases, bonuses, placement into a different school
within the district, and possibly termination of employment. For individual schools and districts,
monetary incentives and sanctions, school ratings, and closures or state takeovers exist as
possible rewards or punishments (Frase-Blunt, n.d.; Gunzenhauser, 2003; Jones & Egley, 2004;
U.S. Department of Education: Office for Civil Rights, 2000).
1.2.2 Psychological and Emotional Well-Being
The use of psychological and emotional well-being in this study refers to student motivation,
stress, and test anxiety.
1.2.3 Stress
For the purpose of this study, stress is defined as a person’s response to a change, or stimulus, in
the environment. This change can be physical and/ or emotional (Burchfield, 1979; Hobfoll,
1989). For example, a bee sting may cause instant swelling and pain and future sightings of bees
could lead to fear.
1.2.4 Test Anxiety
For the purpose of this study, test anxiety is defined as an emotion, or the cognitive and
behavioral reactions of fear, apprehension, and nervousness to the outcomes of a test (Zeidner,
1998).

7
1.2.5 Motivation
For the purpose of this study, motivation is defined as the forces (internal and/ or external) “that
lead to the initiation, direction, intensity, and persistence of behavior” (Vallerand & Losier,
1999, p. 428).
1.2.6 Education-Challenge
Education-Challenge is a phrase used for one of the created subgroups; for the purpose of this
study, Education-Challenge refers to the construct created for analysis by combining two
variables, socio-economic status determined by enrollment in the National School Lunch
Program and the racial and ethnic minority population of the school. Respondents were separated
into one of two categories, either low-education-challenge-group or high-education-challenge-
group. The low-education-challenge-group is defined as a school having 30% or fewer of the
school’s students enrolled in the National School Lunch Program and 30% or fewer identified as
a racial or ethnic minority. The high-education-challenge-group is defined as a school having
30% or more of the school’s population enrolled in the National School Lunch Program and
identified as a racial or ethnic minority.
1.3 STATEMENT OF PROBLEM
President George Bush’s proposal and eventual signing into law, the legislation known as the No
Child Left Behind Act (NCLB) of 2001 brought about a change in the way schools and students

8
are held accountable for their academic performance. High-stakes tests are now used more
frequently to make important decisions directly affecting students. This may mean students today
face more stress to perform well on tests than ever before. With the implementation of NCLB,
the use of assessments increased (Amrein & Berliner 2002; Ananda & Rabinowitz, 2000;
Gunzenhauser, 2006). As discussed in more detail in the review of literature, researchers,
educators, parents, and students have varying opinions and perceptions of the impact of this
legislation, more specifically, the high-stakes tests used to measure student performance to
ensure schools are held accountable. Some think student learning has improved; others believe
learning has not improved. Some have acknowledged an improvement in scores, but have noted
a commonly held belief that testing is creating an environment in which students experience
increased levels of stress and test anxiety and decreased levels of motivation “all attributed to the
administration of these examinations” (Mulvenon, Stegman, & Ritter, 2005, p. 37). An issue that
exists with the current accountability system in place, and the emphasis placed on high-stakes
tests, is the heightened concern of the impact testing has on students and other stakeholders,
since testing may conflict with the social and emotional well-being of students, impacting school
performance (Ruff, 2011). This study explored the impact of accountability policies in place,
specifically those mandating high-stakes tests used to measure student achievement from the
school counselors perspective.
There were multiple purposes of this study. The first was to explore if professional school
counselors perceived any changes in student psychological and emotional well-being (i.e.
motivation, stress, and test-anxiety); second, to explore if school counselors perceive changes
occurred in their work environment; third, to examine if school counselors perceive the role of
the counselor changed with the use of high-stakes testing. Each of the three purposes were

9
analyzed to determine if any differences exist in school counselor perceptions based on a
school’s Education-Challenge, annual yearly progress (AYP) status, and the number of years the
participants worked as a school counselor. Education-Challenge was determined by combining
the variables of socio-economic status (measured by enrollment in the National School Lunch
Program) and the percentage of ethnic and racial minorities in the school for which the counselor
works.
Data in this study were collected using a survey that included open and closed-ended
questions. The survey, developed from a review of the literature, was given to current
professional school counselors who are members of Allegheny County Counselors Association.
The survey was designed to measure counselor perceptions of changes in student psychological
and emotional well-being, changes in the counselor’s work environment, and role in the school
since the inception of high-stakes assessments.
1.4 RESEARCH QUESTIONS
The research questions used in this study focus on counselor perception data. The questions seek
to explore counselor perceptions of student psychological and emotional well-being, the
counselor’s work environment, and the counselor’s role with the use of high-stakes tests.
1. How do school counselors perceive the impact of high-stakes testing on their role?
2. How has school counselors’ perceptions about their work environment changed since the
inception of high-stakes testing?

10
3. What are school counselors’ perceptions of student psychological and emotional well-
being (i.e. motivation, stress, and test-anxiety) in school since the inception of high-stakes
testing?
Based on the perceptions of professional school counselors the exploration of these
research questions aim to bring a better understanding of the impact high-stakes testing has on
students and counselors. Educators and policymakers may use results of this study when making
decisions on accountability standards and the use of high-stakes tests to measure student
performance to ensure these standards are met. An online survey consisting of open and closed-
ended questions was e-mailed to ACCA members asking perception questions to explore the
effect high-stakes testing is having on students and school counselors. Exploring these questions
can help school counselors better serve students and make them more aware of potential changes
occurring in their role and/or work environment.

11
2.0 REVIEW OF LITERATURE
This chapter contains the review of literature. Although many scholarly articles exist in this
review, not all research was reviewed or included. The review begins with the possible reasons
for the No Child Left Behind Act of 2001, a history of high-stakes testing and school
accountability, moves to the impact testing has on school counselors, and ends with a review of
the literature on the impact testing has on students.
2.1 POSSIBLE REASONS FOR NCLB AND HIGH-STAKES TESTING
American students’ poor performance on national and international assessments is viewed as a
“national problem appropriate for federal intervention” (Sloane & Kelly, 2003, p. 12) leading to
federal education accountability reform such as the No Child Left Behind Act (Brown, 2010).
Under NCLB, for a school to demonstrate Annual Yearly Progress (AYP) it must have at least
95% of all students participate in testing, students must score proficient on AYP targets
established by the state, and all students must meet AYP targets set for graduation and/or
attendance (Katsiyannis et al., 2007). This is part of a new American mission that is maintained
by national pride and is part of an education crusade to establish standards and accountability
measures to increase student knowledge (Horn, J., 2003). The driving force behind NCLB may
be the thought that all children can learn at a high level. With this belief, changing educational

12
practices and policies will hopefully motivate students to work harder and have teachers use the
most effective teaching practices available (Stecher, 2002).
The politicians and policy makers responsible for the creation of NCLB, and the
subsequent accountability systems implemented at the state and federal level, created this system
in the belief that they could improve the United States’ educational system; because, they believe
education can improve by attaching consequences and making sure students have access to
clearly defined, and challenging, content (Nichols, & Berliner, 2005). Some proponents of high-
stakes testing believe schools should model themselves after companies in the business world;
claiming high educational standards are needed in today’s economy and the high-stakes exams
are the incentive districts need to succeed (Urbina, 2010).
Proponents of high-stakes testing assume it is effective because states may use results
from the tests to hold teachers accountable, which proponents think can motivate them to use
data from the tests to provide better instruction for individual students. Teachers can use results
to determine what they should teach and what students should learn. Based on test results,
administrators may get a better understanding of the needs of the students and teachers and may
provide professional development experiences for the teachers directly related to the deficits
shown by the test results. The curriculum taught in schools might improve by aligning it to state
standards and state assessments, which should test students on the information that is most
needed to be successful members of society (Nichols, 2007).
Even some opponents to the current system agree with the idea of using high-stakes tests
to measure student learning and to hold students, teachers, and schools accountable. Many
simply disagree with how the tests are used, such as basing important decisions (graduation,
grade promotion, teacher raises, school funding) on the results of a single test (American
13
Psychological Association, 2001). When students have access to equal educational opportunities,
opponents suggest using tests, along with other established criteria, to measure student
performance, but recommend to not use the test as the sole instrument to measure student
academic performance, which can have unintended consequences (American Psychological
Association, 2001).
The following sections provide a brief history of the American education system’s move
to an accountability system that uses the results of state assessments to hold students, teachers,
and schools accountable; trying to explain how the Unites States moved to rely so heavily on
these high-stakes assessments.
2.2 HISTORY OF HIGH-STAKES TESTING
2.2.1 The Early Years
The use of testing to make high-stakes decisions have been around for centuries. The United
States tested immigrants as soon as they set foot on Ellis Island to determine which immigrants
could enter the country (Amrein & Berliner, 2002). Large scale standardized testing on school-
aged children is not new either. This type of testing began in the 1920s when schools started
using the Stanford Achievement Test to assess the abilities of large groups of children
(Mulvenon et al., 2005).
The United States Constitution does not specifically mention education, and before the
1950s, federal policymakers primarily left education decisions to the state and local
governments. It was not until the Supreme Court’s ruling on Brown v. Board of Education, 347

14
U.S. 483 (1954) that education began to play a more prominent role in federal politics. In 1958,
in response to competition with the Soviet Union’s space program, President Dwight D.
Eisenhower enacted the National Defense Education Act (NDEA) of 1958 to promote the
advancement of education in science, math, and modern foreign languages. Schools used money
from this act to initiate or expand elementary and secondary school counseling programs, which
helped develop them into the counseling programs present in schools today (Perkins & Wellman,
2008). The creation of the NDEA ushered in increased involvement of the federal government in
education, by relying on accountability and national achievement testing to assess student
learning (Amrein & Berliner, 2002).
2.2.2 The 1960s and 1970s
After the election of 1964, President Lyndon B. Johnson fought for an education bill, which
helped create the Elementary Secondary Education Act (ESEA) of 1965; beginning a new era of
federal involvement in public education that promoted more equal access to schools. Designed to
enhance student learning and teacher development ESEA allocated federal money to help
improve educational services and educational innovations to poor children (McGuinn, 2006).
ESEA did not have the impact expected on helping poor children, because it did not hold schools
accountable for how money received from the act was spent. One of the act’s unintended
consequences moved power and control for education policy making from the state and local
level to the federal government (McGuinn, 2006).
Politicians thought American schools were falling behind because of a lowering of
expectations and academic standards evident in a steady decline in SAT scores in the 1970s
(Amrein & Berliner, 2002). The result was the “back to basics” movement and implementation

15
of minimum competency testing for graduation. In an effort to increase student performance and
teacher quality, and ensure students were gaining basic skills in math and reading, some states
required students take an exit exam starting in the 1970s with the minimum competency testing
movement, (Jacob, 2001; O’Neill, 2001). There was one state using a testing program in 1972
(Horn, C., 2003). By 1983 the number of states using minimum competency testing increased to
34 states (Linn, 2000), although minimum competency testing is a far cry from the assessments
in place today to hold schools accountable.
2.2.3 The 1980s
In 1983, The National Commission on Excellence in Education published A Nation at Risk: The
Imperative for Educational Reform, which warned of decreasing standards, highlighted the
educational problems in the United States, linked economic competition with academic
achievement, and called for the implementation of high-stakes testing (Amrein & Berliner, 2002;
Suchak, n.d.; Ravitch, 2010; Thorn & Mulvenon, 2002). The Commission encouraged states to
strengthen curricula, improve standards, and increase teachers’ preparation and pay all in an
effort to improve schools by having funding come from the federal government (McGuinn, 2006;
Ravitch, 2010).
In A Nation at Risk student performance was compared internationally. American
students were last in seven of 19 assessments. Thirteen percent of 17-year-old students tested
were functionally illiterate (Margheim, 2001). This led to national concern about the nation’s
educational system, particularly student achievement. Eventually, this led to further
accountability standards and an increased emphasis on assessments, with a minimum
competency test mandated by 33 states by the mid 1980’s (Perkins & Wellman, 2008). The

16
National Commission on Education (1983) hoped the implementation of high-stakes testing
would raise the nation’s standards of achievement, by ensuring children made academic progress
through more rigorous testing (Amrein & Berliner, 2002). States spent more on schools and
established curriculums and standards for school districts to follow (McGuinn, 2006).
2.2.4 The 1990s
When President Bill Clinton entered office, he continued to push for accountability measures and
for the federal government to have a role in education reform. President Clinton insisted on using
the federal government to improve schools and increase student achievement through
accountability, assessments, standards, and additional spending.
In 1994, President Bill Clinton signed into law The Goals 2000: Educate America Act,
which was designed to improve student learning and teaching through the establishment of
national goals. Goals 2000 was designed to provide grant money to states if they developed
content and performance standards to improve student knowledge in core content areas. The state
developed plans included strategies to improve teaching and learning and “must include a
process for setting statewide student performance standards, and, importantly, for assessing
achievement on those standards” (O’Neill, 2001, p. 193).
The focus of Goals 2000 was on state and local reform (Thorn & Mulvenon, 2002). State
governments implemented standards designed to change and improve public education. Under
Goals 2000, students needed to show competency with these new standards in order to graduate.
After enacting Goals 2000, governors from every state met with 44 CEOs from the country’s top
corporations for a national education summit. During this summit, the group developed strategies
to start a national examination (Suchak, n.d.).

17
2.2.5 Presidents G.W. Bush and Obama
In 2000, Louisiana mandated all fourth and eighth grade students pass both the math and
language arts sections of the state assessment to move to the next grade level; becoming the first
state to mandate students pass a test for grade promotion (Horn, J., 2003). In 2001, President
George W. Bush enacted the No Child Left Behind Act, which was a reauthorization of the
Elementary and Secondary Education Act of 1965. The act focused on closing the achievement
gap between whites and minorities and affluent and economically disadvantaged students by
requiring all students meet proficiency standards by 2014 and all schools make adequate yearly
progress (AYP) (Katsiyannis, et al., 2007). When discussing the NCLB Act President George W.
Bush once said,
When we raise academic standards, children raise their academic sights. When children
are regularly tested, teachers know where and how to improve. When parents know
scores, parents are empowered to push for change. When accountability for our schools is
real, the results for our children are real (Isaacs, 2003, p. 288).
The No Child Left Behind Act holds schools accountable for student learning by
requiring states to establish standards in math and reading, having students in grades three
through eight tested yearly, and students in grades nine through twelve, tested once. Schools are
then issued a report on whether or not they made AYP based on state standards (Jones, 2007).
Federal funding for states is contingent on schools meeting AYP, as determined by school-wide
performance on high-stakes tests (U.S. Department of Education: Office for Civil Rights, 2000).
Schools are held accountable through corrective measures when they fail to make adequate
yearly progress toward state developed proficiency goals. States use punishments three times
more often than rewards (Amrein & Berliner, 2002). A majority of states have state-mandated

18
tests in place as the sole or significant criteria for promotion to the next grade level and/ or
graduation (Horn, C., 2003). Based on the results of the tests, consequences can include cuts in
funding, mandates for increased academic support services, grade promotion, graduation
contingent on exam performance, replacing staff, restructuring, and/or state takeover (Ananda &
Rabinowitz, 2000; Braun, 2004; Langenfield, Thurlow & Scott, 1997). NCLB’s goals are
simplistic and grand. The goals aim to improve performance by holding schools accountable by
having students complete assessments on a yearly basis in an attempt to leave no child behind or
run the risk of facing severe sanctions; however, improving test scores are the focal point of the
reform movement instead of the content that is taught (Ravitch, 2010; Tyre, 2006).
When running for office, President Barack Obama wanted to reform NCLB because of
what he thought were fundamental flaws in the act. He planned to improve the accountability
system so that schools needing improvement would receive the most support, instead of
receiving the harshest punishments (Shear, 2011) In early 2010, President Obama called for an
overhaul of NCLB, by ending the naming of schools as failing, instead focusing on the lowest
ranking schools and developing a new system to evaluate teachers and principals. His goal is for
states to set new and higher academic standards, which prepare students for post-secondary
options, instead of the current goal of having every student meet proficiency guidelines by 2014.
Instead of following the current policy, which measures student and school proficiency on math
and reading, he wants the focus to move to academic growth from one year to the next and
control given to local and state governments (Shear, 2011).

19
2.3 SCHOOL COUNSELOR’S ROLE AND WORK ENVIRONMENT
School Counseling began from the social reform efforts occurring during the late 1800s, initially
focusing solely on career services. Counseling programs have changed throughout the years
based on the social and political issues facing schools and the children taught within those
schools (Paisley & McMahon, 2001). The needs of the school and/ or district administrators will
often change the counselor’s role. Borders (2002) asks, “has any other profession had such an
ongoing difficulty defining who they are and what they do” (p. 181)? The confusion over the role
of the school counselor is not new, it has caused confusion since as early as the 1950s, possibly
due to responsibilities that are not clearly defined, disagreement between key stakeholders, and
differing student needs from school to school (Monteiro-Leitner et al., 2006). The following
section will describe the changing role, and detail how high-stakes testing has impacted the
professional school counselor’s role.
Robert Myrick was instrumental in developing the American School Counselor
Association (ASCA) National Model. The ASCA National Model is a standardized framework
followed by counseling programs across the country. Dr. Myrick described the counselor’s
changing role by describing how school district’s guidance programs evolved differently, with
counselors assigned many different job functions, often based on what administrators think the
counselor should do. The challenges and demands of the school counselor’s role change based
on the political and economic conditions of the school, community, and era in which the
counselor works.
The role of the counselor has changed over the last one hundred years. The school
counselor was originally tasked to prepare children for the world of work. During the 1920s and
1930s, school counseling was primarily focused on vocational guidance (Sink & MacDonald,

20
1998). The National Defense Education Act of 1958 provided funds to help train counselors,
with the main purpose of these counselors to identify and counsel talented, college bound
students (American School Counselor Association, 2005; Gysbers, 2001). In 1965, The
Elementary and Secondary Education Act provided grant money for the establishment or
expansion of counseling programs in elementary schools and played a significant part in
increasing the importance of the school counselor’s role (Thorn & Mulvenon, 2002). In the
1960’s, school principals saw the counselor’s primary responsibilities as providing counseling to
students in need of services and to school administrators. This view leads to many in the school
counseling field with a role that is hard to define and too broad in nature that, many times, went
against the standards set by national counseling organizations (Zalaquett, 2005).
Herman et al. (1971) found the role of the school counselor is dependent on the
administrator’s view of that function, stemming from the counselors inability to define their role.
In the 1970s, counselors were expected to help students schedule for classes, determine personal
interests and aptitudes to help students make appropriate post-secondary choices, resolve
conflicts between students and teachers, and work with students to help them cope with personal
issues (Walen, 1977).
In an effort to unify the profession, comprehensive guidance programs emerged in the
1970s and 1980s. A comprehensive school counseling program focuses on meeting the needs of
all students in the areas of academic, career, and personal and social development. Counselors
should develop a program that is proactive and preventative in nature and meets the needs of all
students. The program should support the school’s academic mission and be comprehensive in
scope, preventative in design, and developmental in nature. School counseling programs are
designed to ensure that every student receives the program benefits (American School Counselor

21
Association, 2005, p. 13). By the mid to late 1990s, over half of the states had a comprehensive
guidance and counseling model developed (Sink and MacDonald, 1998). A comprehensive
model should be an independent education program that is purposeful and guided by outcomes,
integral to the educational mission of the school and designed to serve all students in an unbiased
way. The goal of most comprehensive counseling programs is to take a proactive approach to
counseling, running classroom and small group guidance lessons, and individual counseling
sessions to equip students with the necessary tools to handle difficult situations as they arise,
instead of a reactive approach of waiting in the counseling office for a crisis to occur. Creating
comprehensive counseling programs attempts to eliminate the counselor’s old thought process;
“if things are worked out satisfactorily the counselor retreats into grateful anonymity and leaves
people wandering what a counselor does” (Walen, 1977, p. 95).
In an effort to participate in the national reform occurring in education, ASCA published
national standards for counselors to follow in 1997. ASCA set standards for academic, career,
and personal and social development in an effort to develop counseling guidelines to help create
a more efficient role (American School Counselor Association, 2005). Creating a standardized
role for counselors across the country is critical, since a “fully integrated, implemented, and
functioning school counseling program may help to enhance student performance and
preparation for the future, promote a more positive and safe learning environment, and better
student-parent-teacher understanding” (Monteiro-Leitner et al., 2006, p. 248).
Building level principals have a positive perception of their counselor(s) and indicate the
counselor(s) have a positive influence on student behavior, academic performance, and mental
health, as well as work effectively with other staff, families, and administrators to maintain a
positive school environment (Zalaquett, 2005). Current research shows counselors believe they

22
have too many duties that are administrative in nature (i.e. handling discipline issues and
scheduling students) (Zalaquett, 2005). This may stem from school counselors allowing school
administrators to have too much power when deciding the role the counselor takes in a school
(Paisley & McMahon, 2001). One quarter of principals considered the primary role of the school
counselor is as an administrative team member (i.e. building level principal); asking counselors
to complete any and all administrative duties they were asked to complete (Amatea & Clark,
2005). As stated throughout this section, the counselor’s position is evolving. “As the internal
and external demands of their position increased significantly over time, school counselors
became primarily crisis-oriented, reactive, focused on remediation over prevention, and
overburdened with non-guidance-related clerical and administrative tasks” (Sink & MacDonald,
1998, p. 88). Currently, the demands placed on the position are increasing with students
encountering such issues as cyber bullying and Internet safety; concerns that did not exist ten or
fifteen years ago, along with new issues arising from divorce, new academic standards, and
testing.
Norman Gysbers was another instrumental member in forming the ASCA National
Model. His counseling goals were for comprehensive guidance and counseling programs to exist
in every district, serving all students with counselors who are capable of working effectively
with teachers, administrators, and parents. Having a fully implemented guidance program
“places school counselors conceptually and structurally in the center of education, making it
possible for them to contribute directly, and substantially, to their local school districts’
educational goals” (American School Counselor Association, 2005, p. 4). The goal should be for
the program to act as an integral part of the school and not a supplemental activity. This
approach ensures all students and parents receive the benefits from the services provided by an

23
accountable program (American School Counselor Association, 2005). An effective
comprehensive school counseling program takes the needs of the school and community into
consideration when implementing the ASCA National Model (American School Counselor
Association, 2005).
2.3.1 Impact of High-Stakes Testing on the School Counselor’s Role
The school counselor’s role changed after the implementation of the NCLB Act. Many
counselors are given the responsibility of coordinating and administering tests, which left less
time for performing roles for which counselors are trained (Gysbers & Henderson, 2001).
Gysbers (2001) indicates throughout the history of guidance, the role of the counselor depends
on the nation. It is appropriate to pay attention to the impact of high-stakes testing; however, it is
important for counselors to “not lose sight of the full role, unique skills, and varied contributions
that school counselors bring to the schools” (Borders, 2002, p. 182), especially since, 78% of
counselors think testing is the sole reason for unwanted changes occurring in their job
responsibilities (Ruff, 2011).
Through a personal journal written about her return to the role of school counselor, after
spending six years teaching at the collegiate level, the biggest change that occurred to the role is
due to high-stakes testing (Davis, 2006). Davis (2006) noticed teachers are not willing to give-up
class time for guidance lessons or allow students out of class for small group or individual
counseling. She thinks counselors should work with students when it will not disrupt the test
preparation process and provide lessons to help contribute to increased test scores.
If the counselor’s role is forever changing, and high-stakes testing is here to stay, what
can a counselor do? Since counselors are involved in testing, from test administration to

24
interpretation of data, they can share their knowledge of the validity and reliability of the
assessments used and ensure students are the teacher’s top priority when approaching testing
(Gentry, 2006). They can also work with parents to interpret data and explain the intentions of
exams (Ruff, 2011).
Increasingly, school counselors are asked to show how their work is contributing to
student academic achievement and how what they do is making a difference with students. This
accountability among school counselors is not a new phenomenon, even though it is more
intense under No Child Left Behind. Evidence in research studies shows discussion of
accountability as early as the 1920s. When counselors were required to show how their work
with students, teachers, parents, and administrators led to lower dropout rates, better all-around
school life, fewer student failures, fewer disciplinary cases, and less absences (Gysbers, 2004).
The No Child Left Behind Act requires a quantitative measure of such things as academic
achievement, attendance rates, graduation rates, and school safety and contains implications for
school counselors. This reliance on quantitative data, and focus on accountability and academic
performance, requires counselors to show what they do is helping the school meet the mandates
established by the act, all while performing additional duties outside the scope of school
counseling. This may come at the expense of students’ emotional and social needs (Sabens &
Zyromski, 2009). Based on these requirements, it seems necessary for counselors to show they
impact student achievement, help to close the achievement gap, improve attendance and
graduation rates, and decrease disciplinary issues. The ASCA National Model helps counselors
make this possible. The ASCA National Model states that school counseling programs should
focus on academic achievement, operate from a position connected to the district’s mission, use a

25
formal set of objectives that are based on measurable student learning outcomes, and are data-
driven (McGannon, Carey, & Dimmitt, n.d.).
School counselors may play a significant role in the school system, especially in the
scheme of high-stakes testing. School counselors are an essential part of the school system
capable of improving the psychological and emotional well-being of students, helping them
succeed academically (Thorn & Mulvenon, 2002). Many counselors act as the test coordinator,
by preparing tests prior to and after testing, and creating testing schedules. Eighty percent of
school counselors spent time organizing high-stakes tests (Thorn & Mulvenon, 2002). Many help
with administration, by testing small groups of students with special needs and/ or completing
the make-up tests for students that missed part of the test. Counselors may be responsible for
scoring tests and interpreting the meaning of the test scores to teachers, parents, and students
(Zalaquett, 2005). Principals in Florida schools were asked about their perceptions of the school
counselors’ role, especially in state testing. The principals said 41% of the counselors in their
schools act as test coordinators and 75% were involved in test administration. The principals in
this study reported testing hindered a counselor’s ability to respond to school needs, with
approximately one quarter saying it abundantly affected a counselor’s performance (Zalaquett,
2005).
School counselors work with students individually, in small groups, and in the classroom
setting to help eliminate barriers to learning and academically prepare students for post-
secondary success. Counselors are also available to counsel students who may struggle with
stress or test anxiety, which may help students attending schools with a comprehensive school
counseling program to close the achievement gap at a higher rate than schools that do not have a
comprehensive school counseling program (Sink & Stroh, 2003). In their study, they identified

26
150 elementary schools and examined the impact a comprehensive school counseling program
had on student academic achievement. They found students attending schools that did not have a
comprehensive program have significantly lower academic achievement, and believe counselors
working in an established comprehensive program can contribute to positive academic
development (Sink & Stroh, 2003). Vail (2005) found similar results; students with counseling
programs academically outperform those who do not have access to counseling programs.
Moreover, the more the counselor knows and understands about standardized testing, the better
they can address the psychological impact of high-stakes testing; however, results show many
counselors do not integrate this into practice (Thorn & Mulvenon, 2002). Ultimately, counselors
can meet the challenges facing schools today by aligning their role and program goals with the
goals of the accountability system currently in place to help improve students emotionally,
socially, and academically (Sabens & Zyromski, 2009).
Several articles discussed research conducted with school counselors. The researchers
assessed the counselor’s opinions on how high-stakes testing impacts students, counselors and/or
the schools in which the counselors work. Three articles found the counselors studied had
positive opinions regarding high-stakes testing’s impact on the school system (Dollarhide &
Lemberger, 2006; Mulvenon et al., 2005; Thorn & Mulvenon, 2002). Six of the studies examined
found counselors to have a negative view of high-stakes testing’s impact on the school setting
(Brigman & Campbell, 2003; Brown et al., 2004; Mertler, 2011; Ruff, 2011; Thorn & Mulvenon,
2002; Vail, 2005). The following two sections will delve deeper into the findings of this
research.

27
2.3.1.1 Positive Impact of High-Stakes Testing According to School Counselors
Mulvenon, et al. (2005) allege a lack of research exists on parents, teachers, principals, and
counselors’ perceptions of high-stakes testing, so they designed a survey to measure counselor’s
impressions on how testing impacted students, teachers, parents, and counselors. The counselors
in the study reported high-stakes testing is stressful on the teachers involved. Even with
increased stress, the counselors thought high-stakes testing is important to the education of the
students (Mulvenon et al., 2005). Little support exists to suggest school counselors think high-
stakes testing is a negative experience. Although 26% of the counselors surveyed support
standardized testing, they believe more accurate measures are needed to assess student
knowledge (Thorn & Mulvenon, 2002).
According to school counselors, high-stakes testing has created more, and better,
awareness among key stakeholders of the school. Counselors believe more information is
available to school personnel that may be used to help improve the school (Dollarhide &
Lemberger, 2006). This information can help educators develop appropriate interventions, drive
instruction in the right direction, and raise awareness of the specific needs of the student; helping
school counselors identify who needs the most help and in what areas. Parent awareness about
what was occurring in school, and how their child was doing in school also increased after the
implementation of high-stakes testing. Finally, by examining the results of the high-stakes
assessments students took, counselors were more aware of the weaknesses of students and were
able to take a more proactive approach to identify and work with these students (Dollarhide &
Lemberger, 2006). To help improve study and test taking skills counselors can use the results of
high-stakes tests to identify students that may benefit from academic interventions, such as small
group or individual counseling. Counselors can also use the results of the exams to work with

28
teachers to develop classroom lessons that target areas of weakness in an attempt to increase
student performance.
2.3.1.2 Negative Impact of High-Stakes Testing According to School Counselors
Testing detracts from the school counselor’s professional effectiveness by negatively impacting
how they interact with students and teachers. Moreover, additional counseling services are
needed because of the impact of high-stakes testing; however, counselors have less time to work
with students because of changing job responsibilities due to high-stakes testing (Ruff, 2011).
With the emphasis put on testing, counselors think too much time is dedicated to testing, and
students and teachers are now under a greater amount of stress with increased pressure to do well
on the exams. With high-stakes testing, counselors take large amounts of time, up to a month, out
of their schedule to act as test administrators and coordinators, which includes filling in bubble
sheets with student data, and counting tests and pencils (Vail, 2005). In School Counselors’
Perceptions of the Impact of High-Stakes Testing (2004) researchers found counselors feel
involvement in testing negatively influenced their ability to deliver counseling services and
interferes with their ability to implement a comprehensive guidance program, which may impact
student development negatively since these services have a positive impact on student behavior
and improve academic achievement (Brigman & Campbell, 2003; Ruff, 2011). This is significant
since 82% of the counselors in the study reported they function as the test coordinator (Brown et
al., 2004).
Acting as a test coordinator can alienate the counselor from teachers and students, who
may think the counselor is in favor of the amount of testing that occurs, or is one of the reasons
for the amount of testing. School counselors report high-stakes testing has strained their
relationships with students and teachers and has placed them in a role others view negatively

29
(Brown et al., 2004). Another possible reason for this strain in relationships exists because
school counselors stated teachers are not using the results of the assessments to help improve
student learning (Thorn & Mulvenon, 2002). Finally, the counselors studied feel stronger than
teachers do “in their ability to affect the motivation and attitudes of students” (Thorn &
Mulvenon, 2002, p. 203). This can have adverse effects on the relationship between teachers and
counselors, since poor test scores and school performance is a reflection on everyone in the
school system. The negative relationships that may develop from the increased use in testing
may lead to negatively impacting the work environment for school counselors. Sixty percent of
teachers surveyed believe NCLB negatively impacts the work setting by negatively impacting
teacher morale and performance and by taking time away from important classroom issues that
may improve teaching (Mertler, 2011). However, even though testing has negatively impacted
school counselors, a positive school environment is still possible when a school is dedicated to
excellence, which may minimize these negative effects (Ruff, 2011).
2.3.2 Impact of High-Stakes Testing on the School Counselor’s Work Environment
The ASCA National Model states that 80% of a counselor’s day should involve direct student
services. This may lead to school counselors having higher job satisfaction rates and a stronger
commitment to their job when the duties they complete align with the duties established by the
ASCA National Model (Ruff, 2011). These counselors attend colleges and universities preparing
them for counseling duties and responsibilities that are aligned with the model; however, when
they begin working in a school and have duties that are different then expected, due to high-
stakes testing demands on counselors, it can cause lower job satisfaction rates.

30
Few studies examined the impact testing has on the school counselor’s work
environment; however, studies did examine the impact on the teachers work environment. Since
teachers and counselors work so closely together, the results of these studies are discussed. High-
stakes testing may cause teachers to feel stressed, disempowered, frustrated, and overwhelmed
by the pressures associated with high-stakes testing (Wright, 2002). Teachers studied noticed
they formed better relationships with their administrators due to high-stakes testing and are
displaying a desire to use teamwork to help improve test scores. All of the participants noted an
increase in stress, but also noted an increase in the sharing of ideas (Horn, J., 2003). Teachers
had negative responses towards high-stakes testing; stating they are feeling pressure from the
test, which drives instruction (Faulkner & Cook, 2006). Vallie and Buese (2007) found similar
results. In their study, teachers thought any new initiative, policy, or procedure used in the school
was only in response to meeting AYP standards. These constant changes impacted the teachers’
pedagogies, relationships with students, and in some instances, their love of teaching.
High-stakes testing is negatively impacting pre-service teachers experience as well
(Flores & Clark, 2003). Pre-service teachers are in the process of earning a teaching degree.
Several themes emerged in interviews with pre-service teachers and teachers. Participants were
not against being held accountable for their performance. If designed well, they are proponents
for assessments to help inform instructional practices, but they are seeing an unbalanced
curriculum, with inappropriate instructional decisions occurring due to testing, with added
pressure in tested grade levels. It is causing them to change the way they teach, and in their
opinion, they are now using test and instructional practices that are not developmentally
appropriate. All of these factors are causing pre-service teachers to think twice before entering
the education field (Flores & Clark, 2003).

31
Other researchers found negative effects on teachers’ perceptions about their jobs and
how high-stakes testing influences their profession (Fielding, 2004; Horn, J., 2003; Wright,
2002). Inner city teachers working in Chicago are not upset by testing but are upset by the
amount of emphasis placed on testing. These teachers feel the pressure associated with testing is
changing the relationship they have with students (Wright, 2002). Similarly, principals feel their
teachers are edgier, with other teachers, administrators, and students (Horn, J., 2003). Fielding
(2004) found the effects of testing put a strain on the relationship between teachers and other
staff members.
2.4 STUDENT ENGAGEMENT AND PERSISTENCE
An important factor to consider when discussing high-stakes testing is the impact such policies
have on students. Student engagement and persistence entails how testing has impacted student
learning and psychological and emotional well-being – specifically motivation, stress and test-
anxiety, and the effect testing has on students based on their socio-economic and racial and
ethnic status.
2.5 LEARNING AND SCORES
When discussing the impact high-stakes testing has on students, it is important to consider the
effects testing has on learning. Improvements in student learning should contain more variables

32
than results on high-stakes exams. The following sections provide evidence, both positive and
negative, found in the literature on the impact testing has on student learning and test scores.
“As a result of the pressures of educational reform and high-stakes assessment, some
schools run the risk of foregoing active, student-centered learning activities for building test-
taking skills and the memorization of discrete facts” (Faulkner & Cook, 2006, p 1). The pressure
to do well on the test may cause teachers to neglect subjects that are not part of the testing
program; this is known as narrowing of the curriculum. Teachers may spend more time on tested
subject areas then non-tested subject areas. Since test content defines curriculum, and only easily
testable standards are included on high-stakes tests, valuable information needed for the post-
secondary careers and education is not taught (Horn, C., 2003). Some teachers neglect untested
areas, like solving higher-order problems, creative thinking projects, and authentic writing. This
idea of only teaching tested subjects is negatively referred to as teaching to the test (Nichols &
Berliner, 2005; Westchester Institute for Human Services Research, 2003), which can lead to a
lack of creativity in the classroom both from the teachers and students (Brown et al, 2004).
Mathison and Freeman (2003) confirmed teaching to the test did occur, which can be perceived
as a double edged sword; in one sense it is positive, because teachers taught more writing and
focused more attention on problem solving, conversely, the writing lacked creativity and
discussion. If the assessments were designed well, teaching to the test would not necessarily be
negative, since the content taught for the test would be developmentally appropriate and
designed to engage students.
Studies should analyze existing data, known as secondary data, to take advantage of
information already collected (Rea & Parker, 2005). The secondary data gathered for this study
utilizes a dataset of SAT and PSSA test results from school districts located within Allegheny

33
County of the Southwestern region of Pennsylvania to explore the impact of No Child Left
Behind on student achievement. The dataset used covers a ten year period, from 2001, when
NCLB was enacted, to 2012.
The Pennsylvania Department of Education (PDE) compiles and analyzes a wide variety
of data on individual schools and school districts. Included in the information that PDE collects
are data on SAT and PSSA scores on all of the districts in the Commonwealth. PDE currently
has a database of SAT and PSSA test scores for the schools in Allegheny County dating back to
2001. PDE takes this information and creates a spreadsheet listing all of the districts in the state.
This information is then posted on their website for use by the general population. The PSSA and
SAT scores are shown in Table 1, Table 2, and Table 3.
Table 1. PSSA Math Results
Advanced Math
Proficient Math
BasicMath
Below BasicMath
2000-2001 20.74 30.80 22.74 25.73
2001-2002 24.11 30.80 20.99 24.10
2002-2003 25.11 30.49 21.41 22.99
2003-2004 32.04 28.39 18.44 21.13
2004-2005 42.30 27.48 15.54 14.68
2005-2006 43.08 28.48 14.18 14.26
2006-2007 41.19 30.96 14.28 13.57
2007-2008 46.33 29.32 12.26 12.10
2008-2009 46.54 29.42 13.06 10.98
2009-2010 50.35 27.65 11.57 10.42
2010-2011 50.00 28.40 11.44 10.14
2011-2012 49.27 28.18 12.39 10.17

34
Table 2. PSSA Reading Results
Advanced Reading
Proficient Reading
BasicReading
Below Basic Reading
2000-2001 18.18 41.67 19.44 20.70
2001-2002 20.47 41.89 20.46 17.18
2002-2003 26.66 37.43 18.63 17.29
2003-2004 34.81 33.74 16.22 15.22
2004-2005 35.09 35.01 13.83 16.09
2005-2006 35.93 34.85 14.99 14.24
2006-2007 33.77 36.99 14.94 14.29
2007-2008 37.27 36.56 13.64 12.54
2008-2009 39.09 34.66 13.48 12.78
2009-2010 38.82 35.32 13.12 12.74
2010-2011 40.09 35.04 13.29 11.58
2011-2012 39.09 35.03 13.77 12.12
Table 3. SAT Results
Number of Students Tested
Verbal Average Score
Math Average Score
Writing Average Score
2000-2001 8,203 465 461 Not Tested2001-2002 8,449 478 478 Not Tested2002-2003 8,846 483 483 Not Tested2003-2004 8,863 486 488 Not Tested2004-2005 8,550 487 492 Not Tested2005-2006 8,312 480 488 467
2006-2007 8,816 476 484 464
2007-2008 8,416 480 490 469
2008-2009 7,582 478 489 470
2009-2010 7,785 468 477 459
2010-2011 8,012 476 486 459
2011-2012 7,863 479 488 466
Results from the PSSAs show an increase in student performance, based on improved
scores. The percent of students scoring advanced has consistently increased each year, while the
percent of students scoring basic or below basic has consistently decreased each year in both the
math and reading sections of the PSSAs. The SAT scores, on the other hand, have stayed

35
relatively stagnate during the same time period in the verbal, math, and writing portions of the
test.
2.5.1 Negative Impact on Learning
Opponents of testing are concerned with the negative effects testing has on students, believing
the negative effects outweigh any gains made because of testing. Due to the pressure placed on
students, teachers, and administrators the focus of school seems to have shifted, with an
increased value placed on scores (Gunzenhauser, 2003). Expanding on this thought, the current
system may eliminate student learning discussed in terms of cognitive, intellectual, social and
emotional development, and discovering a student’s critical thinking and higher-order reasoning
skills (Causey-Bush, 2005; McNeil, 2000).
Student’s test scores are increasing without a corresponding increase in their knowledge
of the subject, possibly due to repeated testing, using the same test format, and teachers’
knowledge of the test. Therefore, students are better prepared, and more aware, of how to take
the test without a real transfer of knowledge occurring (Westchester Institute for Human Services
Research, 2003). The repeated use of similar tests forms may impact the validity of the tests,
“reliance on a single test for repeated testing can distort instruction and lead to inflated and non-
generalizable estimates of student gains in achievement” (Linn, 2000, p. 6). Florida was one of
the first states to implement a testing program, and had success early on in increasing
achievement of low performing students. The success of this program was short lived though.
Results for all students increased rapidly during the first three years of implementation, but
scores leveled off and even dropped in the following twelve years. A quick rise in performance
during the initial years, with a leveling off or decline in the remaining years of the program is

36
common in other testing programs as well. Another phenomenon seen with testing is an increase
in scores during the use of old test forms and then a significant drop when a new test form is
published. A new assessment should be used each year; otherwise, results can be distorted (Linn,
2000).
When discussing the effects of testing on education, three social principles apply
(Madaus & Clarke, 2001). First, when such high-stakes are placed on tests the teachers will
teach to the test, because of the value placed on the rewards or sanctions used that are based on
test performance. Second, previous tests will define the curriculum because teachers will see the
intellectual activity needed for success on the test and prepare students for that activity. Finally,
teachers will focus on the form of the test, not just the content, and focus their instruction to that
form in spite of other skills that should be taught. The design of the exam limits the amount of
content and knowledge that is tested, “and they place test takers in a passive, reactive role, rather
than engage their capacities to structure tasks, generate ideas, and solve problems” (Darling-
Hammond, 1991, p. 220).
The higher number of students that are identified as needing special education services,
which may make them exempt from testing, allow them to take a modified test, or allow their
scores to count differently may account for some of the rising high-stakes test scores (Fielding,
2004). Schools scoring the highest on the Texas Assessment of Academic Skills (TAAS) have a
higher than average population of special education students (Fielding, 2004). Using the results
of the ACT, SAT, NAEP, and AP tests of 18 states that administer exit exams; a transfer of
learning is not evident, even when scores on state assessments increased. In fact, in all but one
state, student learning remained at the same level or decreased after implementing high-stakes
testing (Amrein & Berliner, 2002; 2003). Since the implementation of exit exams in these 18

37
states, participation on the ACT and SAT tests decreased. The scores on both the ACT and SAT
also decreased in all 18 states (Amrein & Berliner, 2002).
A lack of evidence exists showing a transfer of knowledge and skills occurs, because of
this, high-stakes tests may not be valid indicators of genuine learning. If scores on high-stakes
tests increase, without similar increases seen on low-stakes tests, factors other than increased
knowledge are causing the increase (Amrein & Berliner, 2002). Low-stakes tests are
standardized tests not used for accountability reasons. These factors could include teacher,
student, and/or administrator cheating (Amrein & Berliner, 2002). The focus and attention high-
stakes testing receives may cause an increase in scores. Any number of factors may cause such
increases, but the results of the high-stakes tests should come into question unless similar
increases occur on low-stakes tests.
Tyre (2006) considered the effect testing has on children of a young age. Due to the
amount of testing, and the pressure associated with testing, students are not able to develop at
their own pace. Teachers must force students to learn the prescribed material at the prescribed
time. If students are not able to comprehend the information at that time, teachers may refer them
to learning support, place them in remedial classes, or make them repeat the grade (Tyre, 2006).
Because of this, Tyre (2006) wonders if we are eliminating the creativity and potential from
slower paced learners. Since other countries are outperforming the United States on international
exams, the United States implemented accountability standards; however, some high performing
countries have banned high-stakes testing or cut back on originally implemented testing. Andrew
Hargreaves, an expert on international education reform, says some countries realized too much
testing, early in a student’s school career, was sucking the soul and spirit out of the experience
(Tyre, 2006). Some early-childhood developmental experts are questioning the amount of testing

38
that occurs. They believe social and emotional development of five and seven year olds is just as
important as learning how to read and write (Tyre, 2006).
Students seem to focus on the competencies measured on the test (Horn, C., 2003),
therefore, focus less effort on other subject areas not tested. The un-tested areas still have a
significant impact on what students need to know to successfully transition into post-secondary
education. However, students and teachers are not as concerned with these areas since they do
not directly affect promotion to the next grade level, graduation from high school, and/ or a
teacher’s pay raise for the following year, among other possible consequences. “NCLB is, in
effect, creating a climate of controlled learning and sending a message” that the school’s job is
done when students meet the standards (Gentry, 2006, p. 73).
2.5.2 Positive Impact on Learning
Braun (2004) examined the results from Amrein and Berliner’s (2002) research, and disagrees
with their findings. According to Braun, Amrein and Berliner skewed their analysis, and using a
different method of analysis shows increases on both high and low-stakes tests in all 18 states.
“If one accepts cross-sectional analyses as the coin of the realm, then it appears that high-stakes
testing is strongly associated with larger gains over the period 1992 to 2000” (Braun, 2004, p.
35). Both high and low-stakes standardized test scores are increasing, which possibly means
students are learning more. In Massachusetts, policy makers believe increases in student learning
occur because high-stakes tests have students use critical thinking skills (Wheelock, Bebell, &
Haney, 2000).
Braun (2004) is not the only researcher to find high-stakes testing has helped improve
student learning. In a global study conducted by the International Association for Evaluation of

39
Educational Achievement, over a four-year time frame math and reading scores increased for
fourth graders in the United States. They are also performing better than average in comparison
to other countries (Lederman, 2012). Greene, Winters and Forster (2003) conducted a study in
two states and numerous school districts across the country, comparing results on high-stakes
tests to low-stakes tests. They believe, since there are only low-stakes attached to the tests,
schools have very little reason to manipulate the results of the test. When low-stakes scores
closely match high-stakes scores the similarity in improvement represents a real improvement in
student learning (Braun, 2004; Green et al., 2003). Basing teaching off of the materials covered
in high-stakes tests, students gain a useful general knowledge, demonstrated by increases on low-
stakes test scores (Greene et al., 2003). The researchers suggest that based on Florida’s test
results, the states test, and testing program, is an accurate measure of the effects schools have on
student learning. Florida made impressive gains between 1998 and 2007, going from below the
national average to well above the national average (Simon, 2012). Florida’s reading scores are
second only to Hong Kong when compared globally (Lederman, 2012). The researchers believe
this shows a properly designed testing program can improve student learning and the
consequences attached to high-stakes tests are not distorting outcomes and scores reflect positive
student achievement (Greene et al., 2003).
Researchers found legitimate reasons why test scores are increasing. Brown et al. (2004)
found that some school counselors feel students benefited from testing, because of greater
teacher consistency, with more of an emphasis on helping at-risk students. NCLB has possibly
risen awareness of English Language Learners’ (ELL) that may help improve academic
performance (Coltrane, 2002). This attention helped ELL programs secure more funding for
better programs, with which they can implement interventions to help these students perform

40
better academically. Other positive results from the implementation of high-stakes testing
include schools having a common goal, parents contacted more frequently, and curriculums are
standardized. (Brown et al., 2004).
Yeh (2005) interviewed 61 teachers and administrators in four Minnesota school districts.
Of those interviewed, 67% feel the state designed the Minnesota mandated tests well, aligned
them with the curriculum, met teachers’ goals, and emphasized critical thinking skills. Based on
Yeh’s (2005) findings, a well-designed test may lead to higher teacher and administrator
satisfaction and less unwanted consequences of high-stakes testing, such as a narrowing of the
curriculum. Yeh (2005) also found one third of respondents feel the Minnesota state tests have a
positive impact on student learning, by improving the quality of the curriculum, prompting more
collaboration between teachers and administrators, and helping to recognize students who are
below grade level. In addition, the teachers are more accountable, which leads to better
instruction through the implementation of enhanced professional development and a more
focused and goal oriented faculty. Respondents saw an improvement in student attitudes and
effort and saw students more engaged in the education process as well (Yeh, 2005).
2.5.3 Minority and Socio-Economic Status
Dissatisfaction with academic achievement, particularly within the minority populations, is a
major reason for an accountability push. An important area for exploration is the educational
achievement gap that exists among white and minority students, as well as affluent and
impoverished. An educational gap exists between white and minority students; seen in
graduation rates, academic performance, and enrollment numbers entering higher education
(Isaacs, 2003). Amrein and Berliner (2002), Ananda and Rabinowitz (2000), and Faulkner and

41
Cook (2006) have shown high-stakes testing widens the educational gap between whites and
minorities, and affluent and impoverished. Amrein and Berliner (2002) found states with a
higher percentage of minority students and rates of poverty are more likely to implement the use
of a graduation exam and have a more pressured accountability system in place.
Frase-Blunt (n.d.) noticed an increase in dropout rates among all minority groups, and a
major urban school district in Texas had 60% of minority students drop out between 1995 and
2002 (McNeil, Coppola, Radigan, & Vasquez-Heilig, 2008). Paulson and Marchant (2009)
observed differences in test results directly corresponded with demographic information. Even at
a state level, predicting test results is possible when the demographic information of the state is
known (Paulson, & Marchant, 2009). Considering this statistic, holding the teachers accountable
for a single test score may not be fair, since a student’s prior knowledge, family background, and
experiences greatly impact the test scores. Since test results may affect the money available for
schools, and data show schools with higher percentages of minorities have lower test scores,
minority students may be disproportionately negatively impacted. Giving more money to higher
performing schools may start a never-ending cycle that negatively impacts minority students.
The Florida Department of Education recently passed legislation attempting to adjust the
states standards based on a student’s race. By 2018, it expects 90% of Asian students, 86% of
white students, 80% of Hispanic students, and 74% of black students to meet proficiency
standards. Changing these standards is an attempt to comply with a waiver Florida received from
NCLB, and acknowledges different racial groups are achieving at different rates. Testing data
from the 2011 - 2012 school year show 69% of white students scored proficient on reading,
while less than 40% of black students scored proficient (Lawrence, n.d.).

42
Ananda and Rabinowitz (2000) found a relationship exists between high-stakes testing
and increases in dropout rates, especially for students already at-risk. In North Carolina and
Massachusetts non-white, non-Asian students are most affected by high-stakes testing; half of all
minority students may not graduate in these two states (Horn, C., 2003). Since there is a
noticeable difference in test results, and a disproportionately high failure rate among underserved
populations tying grade promotion to test scores could increase racial disparities in retention
rates (Ananda & Rabinowitz, 2000; Westchester Institute for Human Services Research, 2003).
Many states rely on test results to decide grade promotion. Horn, C. (2003) found
minorities are retained four times more often than non-minority students. Texas measures quality
education by scores on standardized tests. In low-performing schools, predominantly low-income
schools with a majority of the students identifying as non-white, teachers use test-prep
techniques, which can reduce the valuable learning experiences students experience (McNeil,
2000). This may be partly to blame for the fact that fewer then 60% of minorities in Texas who
begin ninth grade ever graduate (McNeill, 2000). Howard (2003) found 50% of black students
failed to reach proficiency in core subjects (history, math, reading, and science) on the National
Assessment for Educational Progress each year from 1992 to 2002. Similarly bleak statistics
exist for those scoring in the advanced range on the NAEP. Less than five percent of black
students scored advanced in these core subjects over that same time period (Howard, 2003).
Fewer than 33% of students in most states score proficient on the NAEP assessment, with
only 12% of black students scoring proficient on the reading portion of the 2000 NAEP
assessment. In 2001, The Trends in International Math and Science Study (TIMSS) showed
white students in the U.S. scoring 13th
in math and sixth in science out of 39 and scored 38 and
59 points higher in math and science, respectively, then the international average. In the same

43
study, black students in the U.S. scored 43 and 50 points lower in math and science, respectively,
then the international average and ranked 32nd
in each category out of 39 (Bracey, 2001). The
disparities seen in test scores may mean NCLB is not having the intended effects it strived to
achieve by leaving no child left behind. It seems as though more minority students and students
in a lower socio-economic class are falling behind and suffering more severe consequences than
white students and/or those in a higher socio-economic class.
2.6 PSYCHOLOGICAL AND EMOTIONAL WELL-BEING
When studying the impact of high-stakes testing on students, some researchers examined the
psychological and emotional toll testing takes on some students. Ruff (2011) wondered if the
emphasis on accountability is exacerbating the socio-emotional issues students face. For the
purpose of this study, psychological and emotional well-being refers to student motivation,
stress, and test-anxiety.
2.6.1 Stress and Test Anxiety
In recent years, few areas of psychology received more attention than stress and anxiety
(Burchfield, 1979). Even with the amount of attention stress receives in recent years in the field
of psychology, it is still poorly defined, with definitions focusing on either the stimulus or a
person’s response to a stimulus (Burchfield, 1979). One definition for stress defines it as the
relationship between a person, and their surroundings that the person finds taxing. When looking
at stress from the person’s response, stress is determined after the outcome. Another way is to

44
look at the stimulus and not the response. For example, a bee buzzing around is a stressor even
though some people would not pay any attention to the bee and not be stressed in the least by the
bee’s presence (Burchfield, 1979; Hobfoll, 1989). The fact that people respond differently to
similar stressors makes defining, and studying, stress difficult.
Some psychologists believe student anxiety is higher than ever before (Zeidner, 1998).
This fact is significant since test anxiety can impair performance on assessments, increase stress,
and decrease motivation (Segool, Carlson, Goforth, Von Der Embse, & Barterian, 2013). The
model to define and understand test anxiety has changed throughout the years. Test anxiety is a
“unique construct comprised of worry and emotionality associated specifically with testing” The
expression of test anxiety is seen through behavioral, cognitive, and physiological symptoms.
Prior experiences can affect test anxiety with negative experiences possibly leading to test
anxiety (Segool et al., 2013). “Test anxiety, broadly speaking, refers to the set of cognitive,
affective, and behavioral reactions that accompany concern over possible negative consequences
contingent upon performance in a test or evaluative situation” (Zeidner, 1998, p. 25). In addition
to tests currently in place for students (i.e. mid-term and final exams, weekly quizzes, and
chapter tests), students must also take these high-stakes tests (Ananda & Rabinowitz, 2000). For
example, fourth graders, in one Pennsylvania district, take 13 standardized tests per year (some
of which take a week to complete). This is in addition to the math, reading, spelling, social
studies, and science tests they currently take. Zeidner (1998) feels it should not come as a
surprise that based on the amount of testing that occurs in school that testing causes anxiety in
many people. Feelings of stress and anxiety are understandable considering the profound impact
these tests can have on determining the path people take in life.

45
For the purpose of this study, stress is defined as a person’s response to a change, or
stimulus, in the environment. This change can be physical and/ or emotional (Burchfield, 1979;
Hobfoll, 1989). A bee sting may cause swelling and pain and future sightings of bees could lead
to fear. Test anxiety is defined as an emotion, or the cognitive and behavioral reactions of fear,
apprehension, and nervousness to the outcomes of a test (Zeidner, 1998).
Frase-Blunt (n.d.) claim the psychological toll of testing on students is causing increased
levels of anxiety, some of which are higher than ever before. Brown et al. (2004) and Fleege,
Charlesworth, Burts and Hart (n.d.) agree that tests cause increased levels of anxiety in students,
even students as young as kindergarten. Teachers described a highly stressful testing
environment for teachers and students. This was especially apparent when the test was too hard
for a student, with some witnessing students crying from the stress related to high-stakes tests,
which these teachers feel are not developmentally appropriate (Mabry, Poole, Redmond, &
Schultz, 2003). Former Secretary of Education, Richard Riley, has said states must review their
testing programs to ensure students are not under excessive stress, so students are challenged and
not traumatized (O’Neill, 2001). Interviews conducted with school counselors showed they see
more students with anxiety-related problems after the implementation of testing. Anxiety related
problems include sleep issues, drug and alcohol use, misbehavior, and avoidance problems.
Students suffering from test anxiety may be easily distracted during a test, have difficulty
recalling relevant information, express concern of embarrassment at their likely failure, and may
suffer from poor mental health (Zeidner, 1998).
The impact test anxiety has on students is important to consider, because elementary
students that experience test anxiety are, on average, a full academic year behind other students
on nationally standardized tests, while the least anxious students in the class are a full academic

46
year ahead of the national average on standardized tests (Zeidner, 1998). Malpass, O’Neil and
Hocevar (1996) and Segool et al. (2013) claim a correlation exists between high levels of anxiety
and low cognitive performance. Segool et al. (2013) found Caucasians exhibited lower anxiety
levels than African Americans prior to testing. Rates of test anxiety may range from 10 to 30%
and as high as 40% for minority students expressing anxiety (Segool et al., 2013). A relationship
also seems to exist between socio-economic status and test anxiety. Students with higher levels
of SES had lower rates of test anxiety (Segool et al., 2013). These findings are significant, since
the higher the anxiety levels, the worse the students performed on the test.
Segool et al. (2013) conducted a study examining the differences between students’ test
anxiety between classroom tests and NCLB mandated tests. The researchers had students take an
anxiety assessment after taking classroom tests and NCLB tests. Students in the study
experienced significantly higher rates of anxiety on NCLB tests in comparison to classroom
tests, which may lower test performance, reduce motivation, and increase stress levels (Segool et
al., 2013).
Mulvenon et al. (2005) found conflicting data with other research previously discussed,
in which students reported feeling anxious and stressed during testing. In their study, they found
75% of students report liking test week. The question in their study asked students if they
enjoyed test week because they received less homework and less instructional time (Mulvenon et
al., 2005). What is unclear regarding this study is whether students truly enjoy testing week or
simply enjoy testing week because they did not receive homework during the week. Forty-two
percent of students reported feeling pressure from their teachers and 43% report feeling pressure
from their parents. Mulvenon et al. (2005) did not find an increase in anxiety among students,
even with feeling pressure from teachers and parents. When increases in anxiety did occur, there

47
was a greater increase among high performing students than low-performing students. The
results showed test anxiety did not affect the test results, and most students value the test
(Mulvenon, et al., 2005).
Horn, J. (2003) found testing alters motivation and induces higher levels of stress, finding
students are more stressed since testing began, with some students getting physically ill from the
stress. Texas was one of the first states to require students take a minimum basic skills test and
has expanded their accountability system to one of the strictest in the country. Teachers reported
many students experience headaches and stomachaches while taking the state assessment and
report students are irritable and aggressive during testing (Hoffman et al, 2001).
As stated earlier, researchers report other psychological and emotional tolls when they
study the impact testing has on students. Some educators allege the results of testing are part of a
self-fulfilling prophecy, where students may receive a label, based on test scores that can
negatively impact their confidence, motivation, and future school performance (Sloane & Kelly,
2003). Horn, C. (2003) found the effects of testing lead to more incidents of students acting out
in negative and inappropriate ways.
2.6.2 Motivation
A component in determining an individual’s success in school is motivation, although other
factors may affect performance such as lack of knowledge or outside sources. Poor academic
performance does not always indicate a lack of motivation, because motivation does not always
“influence performance in a direct and simple manner” (Maehr & Archer, 1985, p. 8). Original
theories on motivation identify two types of motivation, intrinsic and extrinsic. Intrinsic is
motivation felt from the inside. Outside factors, such as pay raises or grades, drive extrinsic

48
motivation. Newer theories on motivation identify many more factors that play a role in
determining motivation levels than just stating whether or not a person is intrinsically and/ or
extrinsically motivated, making motivation a difficult concept to study, “motivation is a complex
concept, embracing several aspects that relate to learning, such as self-esteem, self-regulation,
interest, effort, self-efficacy, and a person’s sense of themselves as a learner” (Harlen, 2005, p
210). Wheelock et al., (2000, p. 2) add, “student motivation depends on a complex mix of
beliefs, attitudes, and feelings that students develop in the context of classroom experiences,
personal relationships, and school routines”.
Newer theorists identify three types of motivation, intrinsic, extrinsic, and amotivation.
Intrinsic motivation is doing something simply for the pleasure of doing it. Extrinsic motivation
is doing something as a means to an end, to gain an external reward, for example, studying for a
test to get an A. Amotivation is “the absence of intent or drive to pursue an activity due to one’s
failure to establish contingencies between their behavior and the activity” (Fairchild, Horst,
Finney, & Barron, 2005, p. 335). Theorists believe intrinsic motivation has three subscales:
motivation to know, gaining enjoyment from the process of learning, motivation to accomplish,
gaining satisfaction by accomplishing something, and motivation to experience stimulation,
gaining satisfaction from the sensory stimulation experienced while performing that activity
(Fairchild et al., 2005). For the purpose of this study motivation is defined as the forces (internal
and/ or external) “that lead to the initiation, direction, intensity, and persistence of behavior”
(Vallerand & Losier, 1999, p 428).
Tuan, Chin and Shieh (2005) conducted a study to develop a questionnaire to determine
student motivation levels. In their research, they discovered a variety of factors play a role in
determining motivation. The factors emerging in the research include perception of ability,

49
performance and achievement goals, level of effort, learning values, self-efficacy, goal and task
orientation, active learning strategies, and test anxiety. Many of these factors play a part in a
student’s willingness to try to understand new and difficult concepts. The researchers believe that
if a student finds value in the task, and assumes they are capable of learning the task, they will be
more willing to make a sustained effort to learn the material.
Testing policies are created with the belief that students may take schoolwork more
seriously, may understand the importance of academics, and may motivate the individual into
achieving academically when consequences are attached to test scores (Wheelock et al., 2000).
Policymakers may assume placing rewards and sanctions on tests can help increase student
motivation levels pertaining to learning, believing students may try harder to gain rewards or
avoid sanctions (Gunzenhauser, 2007; Madaus & Clarke, 2001). This belief may be flawed since
Vallerand and Losier (1999) found multiple studies that show intrinsic motivation decreases
when rewards are used for participation in an activity. These findings may hurt NCLB’s focus,
which “contradicts empirically supported motivation theory, in which students need to feel
empowered, efficacious, and able to self-regulate to be able to learn effectively and with
confidence and motivation,” (Gentry, 2006, p. 76).
Harlen (2005) takes a much more cynical approach when discussing the effects of high-
stakes testing on student motivation, believing testing has a detrimental effect on students’
enjoyment of school and learning, and their willingness to become lifelong learners. This is
especially important, considering the policy makers that believe motivation would increase due
to the implementation of high-stakes testing, probably did not consider the complexity of
motivation, the cultural and social networks that exist within the school, and the individual

50
differences that exist among students (e.g. grade level, family circumstances, and expectations)
(Madaus & Clarke, 2001).
In order for students to strive for rewards, students should see the attainment of the
reward as realistic. Some students may dismiss the award because they feel it is unobtainable,
others may dismiss the award because they do not see the importance of the exam or award. If
they do not connect the passing of the exam resulting directly in getting into college, finding a
job, or moving to the next grade level, they may dismiss its importance (Madaus & Clarke,
2001). When students do not perform as well as expected stakeholders often attribute the poor
performance to a lack of motivation, which can threaten the meaning of the scores (Sundre,
2000). External rewards do not translate into better effort or improved student learning (Amrein
& Berliner, 2003; Jones, 2007; Wheelock et al., 2000). Intrinsic motivation decrease in students
when rewards and sanctions are attached, especially when they are perceived as controlling
(Amrein & Berliner, 2003; Jones, 2007). In fact, long term enjoyment decreases, even though
short term motivation increases (Jones, 2007). Wheelock et al. (2000) studied student drawings
to determine the effects of high-stakes testing, observing patterns related to motivation and
effort. They observed a range of responses that question whether a single test can motivate a
student to learn and try harder (Wheelock et al., 2000).
In an Ohio school district, 83% of elementary students and 45% of secondary students
said testing motivated them to study (Jones, 2007). Flores and Clark’s (2003) findings support
Jones (2007) and some policy makers’ claims that testing would increase student motivation,
finding students are concerned about their test performance and motivated to demonstrate their
knowledge. Ruff (2011) interviewed 20 counselors and school psychologists and found
accountability has students better focused on learning and school performance. It is important to

51
realize student motivation is not independent of other factors, including the relationship they
have with teachers and families, involvement in school, and social activities in and out of school
(Sloane & Kelly, 2003).

52
3.0 METHODOLOGY
The review of literature discussed in chapter two addresses the positive and negative effects of
the high-stakes tests used to ensure schools are meeting the accountability standards established
by the state and federal government. In the review of literature, the studies that focused on the
impact testing has on students were examined, specifically; the effects testing has on learning as
measured by state and national assessments, motivation, stress, and test anxiety, and testing’s
impact based on socio-economic and racial classifications of students. Along with the impact on
students, the review examined the impact of high-stakes testing on the school counselors’ role
and work environment. As school districts continue to try to meet the accountability standards
established by the state and federal governments, determining the impact high-stakes tests have
on students and school counselors is an important factor to consider. Of particular interest is
testing’s impact on students and school counselors as perceived by professional school
counselors working in southwestern Pennsylvania. This chapter addresses the method used to
explore the perceived changes that occurred in students and school counselors working and
attending schools in Allegheny County, Pennsylvania since the implementation of NCLB in
2001.
Data in this study were collected using a survey that included open and closed-ended
questions. The survey, developed from a review of the literature, was given to current
professional school counselors. The survey was designed to measure counselor perceptions of

53
changes in student psychological and emotional well-being (i.e. motivation, stress, and test
anxiety), changes in the counselor’s work environment, and possible changes in the counselor’s
role in the school since the inception of high-stakes testing.
3.1 STATEMENT OF THE PROBLEM
The No Child Left Behind Act (NCLB) of 2001 brought about a change in the way schools and
students are held accountable for their academic performance. High-stakes tests are now used
more frequently to make important decisions directly impacting students. This may mean
students today are facing more pressure to perform well on tests than ever before. With the
implementation of the No Child Left Behind Act the use of assessments increased (Amrein &
Berliner 2003; Ananda & Rabinowitz, 2000; Gunzenhauser, 2006). As was discussed in more
detail in the review of literature, stakeholders involved in schools (e.g. researchers, educators,
parents, and students) have varying opinions on the impact of this legislation, more specifically,
the high-stakes tests that are used to ensure schools are held accountable. Some believe test
scores have improved, showing students are improving academically and learning more; others
say scores have not increased. Some have acknowledged an improvement in scores, but have
noted a commonly held belief that testing is creating an environment in which students are
experiencing increased levels of stress and test anxiety and decreased levels of motivation “all
attributed to the administration of these examinations” (Mulvenon et al., 2005, p. 37). An issue
that exists with the current accountability system in place is the heightened concern of the effect
testing has on students, teachers, and school counselors.

54
There were multiple purposes to this study. The first was to explore if professional
school counselors perceived any changes in student psychological and emotional well-being;
second, to explore if school counselors perceive changes occurred in their work environment;
third, to examine if school counselors perceive the role of the counselor changed with the use of
high-stakes testing. Each of the three purposes were analyzed to determine if any differences
exist in school counselor perceptions based on a school’s socio-economic status and ethnic
diversity of the school (Education-Challenge), and the 2012-2013 AYP status for the school for
which the counselor worked, as well as the number of years the participant worked as a school
counselor in the school.
3.2 RESEARCH QUESTIONS
The research questions used in this study focused on counselor perception data. The questions
explored counselor perceptions of student psychological and emotional well-being, the
counselor’s work environment, and the counselor’s role with the use of high-stakes testing.
1. How do school counselors perceive the impact of high-stakes testing on their role?
2. How has school counselors’ perceptions about their work environment changed since the
inception of high-stakes testing?
3. What are school counselors’ perceptions of student psychological and emotional well-
being (i.e. motivation, stress, and test-anxiety) in school since the inception of high-stakes
testing?
The exploration of these research questions aim to bring a better understanding of the
impact high-stakes testing has on students and counselors based on the perceptions of

55
professional school counselors. The questions were also explored by separating the participants
into subgroups based on Education-Challenge, AYP-Status, and Years-Working.
3.3 DATA COLLECTION
Counselor perception data were collected using a survey from a sample determined by non-
probability sampling. In non-probability sampling, participants are selected deliberately based on
the knowledge of a certain group with some units of the target population having no chance of
being selected; it is commonly used when collecting qualitative data, and is typically used for
exploratory work (Kelley, Clark, Brown, & Setzia, 2003).
The non-probability sample consisted of members of the Allegheny County Counselors
Association (ACCA) working with students in Allegheny County Schools. Membership to the
organization is voluntary and although this organization consists of a large portion of school
counselors working in the county, not all school counselors working in the county join this
organization. All school counselors who work in any of the county schools, including public,
private, and charter have the option to join this organization by registering and paying a small
yearly fee. Counselors working in Allegheny County who are not members of this organization
or counselors who work outside of the county had no chance of selection for this study.
Even though ACCA members were the only counselors selected for participation, using
this sample still provided rich data from the information collected. One hundred seventy-six
counselors were sent a link to an online survey because of the valuable role they play within a
school and the knowledge they possess. This sample was also selected because it represents a

56
fairly large and diverse geographic region of Pennsylvania and ACCA members work in schools
that represent a good cross-section of sizes, ethnic diversity, and socio-economic areas.
One hundred seventy-six ACCA members were contacted via the e-mail addresses they
provided to the organization at the beginning of the 2013-2014 school year. After members
provide the organization with an updated e-mail address the organization sends out a directory
providing the work contact information for all members. The e-mail address provided by the
ACCA members was used to contact them about participating in the online survey using Survey
Monkey, an online survey software tool.
3.3.1 Survey Development
The original survey was created through discussions with four other school counselors, which led
to a lengthy survey that could have taken over an hour to complete. To narrow the focus of the
survey and create one that could be completed in a reasonable amount of time, a new survey was
developed. This survey was developed using questions from several different surveys used in
previous studies and by extracting themes found in the literature when a specific question was
not available. The survey was intended to determine if counselors perceived changes in student
psychological and emotional well-being with the use of high-stakes testing. The survey also
intended to determine if the counselors perceived any changes in their work environment and
their role as a counselor. Several demographic questions in the survey were used to provide data
based on the socio-economic status, ethnic diversity, and AYP-Status of the school for which the
counselor worked.
The survey asked school counselors their opinions and perceptions regarding high-stakes
testing and the potential impacts on students and school counselors. The survey asked counselors

57
questions regarding their opinions on student motivation, stress, and test anxiety. In order to
develop a survey that measured these three constructs, it was necessary to define them. A
definition of the constructs was also necessary so the participants had the same understanding of
the meaning of a question as the researcher, and this definition was provided at the beginning of
the survey.
Based on the review of the literature the following definitions were used for the purpose
of this study. Stress was defined as a person’s response to a change or stimulus in the
environment. This change can be physical and/ or emotional (Burchfield, 1979; Hobfoll, 1989).
Test anxiety was defined as an emotion, or the cognitive and behavioral reactions of fear,
apprehension, and nervousness to the outcomes of a test (Zeidner, 1998). Since stress and test
anxiety were so similar, both being a person experiencing a change due to a stressor, the two
constructs were combined in the survey. For the purpose of this study, motivation was defined as
the forces (internal and/ or external) “that lead to the initiation, direction, intensity, and
persistence of behavior” (Vallerand & Losier, 1999, p 428).
Based on the literature reviewed, surveys developed to measure motivation are rare and
many surveys developed are designed for a first person account of his or her beliefs. One of the
surveys researched and modified for use in this study is The Motivation Scale, Student Opinion
Scale (SOS). SOS is a questionnaire that measures student perception of total motivation,
importance, and effort (Sundre, 2000). Questions regarding student motivation also came from
surveys generated by Brown et al. (2004), Fitzgerald (2008), Jones and Egley (2004), Mertler
(2011), Pintrich and DeGroot (1990), Sabol (2010), and Sundre (2000), Tuan, et al. (2005).
Questions for the stress and test-anxiety construct were generated by using information gathered
from research completed by Brown, et al. (2004), Hoffman et al. (2001), Jones (2007), Mertler
58
(2011), Thorn and Mulvenon (2002), and Zeidner (1998). Questions regarding the counselor’s
work environment and role came from Fitzgerald (2008), Hamilton, Stecher, Marsh, McCombs,
et al. (2007), Mertler (2011), and Sabol (2010). Information from studies conducted by these
researchers is described in more detail in chapter two. Questions in the survey not specifically
pulled from surveys previously used by other researchers were generated by the review of the
literature and personal experience working as a school counselor.
According to Tuan et al. (2005), researchers should address construct, content, and
criterion validity when developing surveys. According to Tuan et al. (2005), using surveys used
in previous studies, along with piloting the survey helps to ensure these three types of validity
are met. Many of the questions in the survey were taken from survey questions used by previous
researchers, helping to ensure the survey’s validity. Piloting the survey with professional school
counselors and doctoral study group members minimized the risk of poor survey design to help
avoid participants speeding through the survey, randomly responding to questions, and/ or not
completing the survey due to survey length. The survey was originally piloted with eight school
counselors. The counselors provided feedback regarding question construction to ensure the
appropriateness for the constructs studied, as well as to ensure the validity of the survey. From
the feedback on the piloted surveys, several questions were eliminated or reworded. A new
survey was created and sent to members of a doctoral study group for further evaluation and
critique. Approximately ten members of the group provided feedback through several rewrites of
the survey. These members provided feedback regarding the wording of questions, trying to
eliminate any biased wording used in the question or answer choices. They also helped identify
questions that were difficult to understand or were interpreted differently than intended
(Krosnick, 1999). To ensure the survey met content, construct, and criterion validity, and to

59
ensure the survey worked properly on the website, eight professional school counselors and ten
members of a doctoral study group pilot tested the final survey available on Survey Monkey.
Pilot testing the survey on Survey Monkey showed the need to make three changes for the final
survey. First, two questions were eliminated. Three questions were separated from one large
question and answer choice to two separate question and answer choices each, turning these
three questions into six questions. Finally, page breaks were inserted in the online format to
eliminate participants needing to scroll down the page to read the next question.
Downes-LeGuin, Baker, Mechling and Ruyle (2012) found that the length of the survey
is important to consider because surveys that are too lengthy can cause participants to be less
motivated to respond, skip questions, and/ or put less effort into answering questions honestly.
They refer to this as “respondent burden” which is a combination of four factors, survey length,
effort required to complete the survey, the emotional stress a respondent may feel from the
questions in the survey, and the frequency in which they are asked to participate in research
studies (Downes-Le Guin et al., 2012). How frequently counselors are asked to participate in
research studies cannot be controlled; however, the other three factors were considered to
minimize the amount of burden felt by the participants in this study.
3.3.2 Survey
The survey consisted of two sections. The first section consisted of general demographic
information questions, the second section contained questions intended to identify the
perceptions of counselors. Section one of the survey was the general information section and
consisted of eight questions. Four of these questions solicited demographic information about the
counselors, such as the number of years working as a counselor, the grade level(s) in which they

60
work, and the number of students on the counselor’s caseload. In addition, the survey consisted
of two demographic questions about the school in which they work, which were the school’s
socio-economic make-up and racial and ethnic diversity. The socio-economic make-up was
determined by using the percentage of students in the district who were enrolled in the National
School Lunch Program as reported by the respondent. One question pertained to the school’s
AYP status from the 2012-2013 school year. Two questions asked counselors about the testing
process at their school, and their involvement in the process.
The second section of the survey was designed to determine how testing impacted student
psychological and emotional well-being, the counselors work environment, and how testing
impacted their role as a school counselor in the school. The second section consisted of 34
closed-ended questions and six open-ended questions. The six open-ended questions asked
respondents to explain how they felt testing impacted student motivation, stress and test anxiety,
why they thought changes occurred in their role, and to provide examples of these changes.
Of the 34 closed-ended questions, five were on a five or six point Likert Scale asking to
rate their level of agreement with the question. Eleven questions asked respondents to answer if
an item has changed for the worse, changed for the better, or did not change. Examples, of these
eleven closed-ended questions included their relationship with parents, teachers, students, and
principals, as well as student morale, student motivation, and focus on student achievement.
Eighteen questions asked respondents to choose the amount of time they spent on certain
activities and whether the amount of time was less time, more time, or about the same amount of
time as when they began working as a school counselor. Of these 18 questions, six asked about
tasks related to high-stakes testing, such as acting as test coordinator, reviewing student
assessment results, or meeting with school administrators to plan for school improvement. The

61
other 12 from this 18 asked respondents about the amount of time they spent on classroom
lessons, small group lessons, or individual counseling sessions involving: test preparation skills,
college and career readiness, personal and social skills, and academic goals that were not test
preparation based. Each of these questions asked counselors the amount of time they spent in a
typical week on the activities and whether that was less time, more time, or about the same
amount of time than at the beginning of their career as a school counselor.
The survey was uploaded to Survey Monkey and participants were e-mailed a link that
connected participants to the survey. A web-based survey was used for several reasons. Strengths
of web-based surveys include the efficiency in data collection, convenience – for both the
researcher and the participant, low administration cost, ease of follow-up, and respondents often
provide longer, more candid responses in web-based surveys than other types of surveys (Evans
& Mathur, 2005; Sax, Gilmartin, & Bryant, 2003; Sheehan, 2001). The two major colloquies of
web-based surveys are the possibility of the participation e-mail request being viewed as junk
mail and deleted before it is read and low response rates (Evans & Mathur, 2005). Response rates
with any type of survey is lower than in any previous year, with one study examining response
rates for various survey methods to be as low as 20% (Sax et al., 2003). In Sheehan’s 2001 study,
a review of 31 different studies using web-based surveys showed an average response rate of
37%.
3.3.3 Participants
ACCA is a professional organization serving professional school counselors working for the 43
school districts, 196 private schools, and 26 charter schools located in Allegheny County.
According to the Pennsylvania Department of Education 154,276 students are enrolled in public
62
schools, including charter schools, and 24,130 students are enrolled in private schools serving
Allegheny County. This student population equals approximately nine percent of the state’s total
school enrollment. The target population for the study represented a fairly diverse geographic
region and included semi-rural, suburban, and urban schools that consisted of an array of socio-
economic areas.
Members of ACCA attending a quarterly conference were made aware of an e-mail being
sent asking for their participation in the online survey. One hundred seventy-six members were
sent an introductory e-mail asking them to participate in the research study. Along with the link
to the survey, participants were e-mailed an information form containing a short description of
the purpose and importance of the study. In addition, the form described any risks and benefits of
participating in the study, the value of their responses, how they were selected for participation,
and how the information they provide would be confidential. Since the surveys were collected
anonymously, participants gave implied consent by completing the survey. See Appendix B for
the e-mail sent to potential participants. Since the counselors’ anonymity was ensured, there
were no inherent risks to participants of the study.
The initial e-mail was sent with a link to the survey to 176 active members of ACCA on
Monday, November 25, 2013. With the initial delivery, a response stating that eleven of the e-
mails were undeliverable was received, giving a total of 165 possible participants. A follow-up e-
mail was sent on Thursday, December 5, 2013 to the 165 valid e-mail addresses. This e-mail
thanked those who already participated in the survey, and encouraged those who had not yet
participated to complete the survey. On Friday, December 13, 2013, ACCA held another
quarterly conference with approximately 100 members in attendance. Those in attendance were
made aware that the survey was still available on Survey Monkey and asked any one who had

63
not participated to please consider participating. On Monday, December 16, 2013 a third e-mail
was sent.
The survey was closed on January 12, 2014. A total of 68 professional school counselors
completed the survey, giving a final response rate of 41.2%, based on the 165 valid e-mail
addresses used. Twenty-eight other ACCA members began the survey but for various reasons
chose not to complete the survey. A final e-mail was sent asking those who submitted an
incomplete survey their reasoning for stopping the survey. Thirteen participants responded to this
request giving their reason for not completing the survey.
Of the thirteen participants who responded, three stated they work in buildings that do not
give tests and stopped the survey when they realized the survey did not pertain to them, six did
not complete the survey when an issue arose that they needed to attend to, one experienced
technical difficulties, and three said it was due to survey length. Survey Monkey keeps track of
the amount of time each person takes to complete the survey. By analyzing the individual time
kept for each of the 96 participants, the following information was gathered. Of the 68
participants who completed the survey the average amount of time taken to complete the survey
was 19 minutes 50 seconds, with 15 minutes being the most commonly occurring time length. Of
the 28 participants who began, but did not complete the survey, the average amount of time spent
on the survey was six minutes 40 seconds, with 1 minute being the most commonly occurring
time length.

64
3.4 DATA ANALYSIS
Information from the 68 completed surveys were input into an Excel spreadsheet giving a
number code for responses to each question. This information was then uploaded into, and
examined by, using the Statistical Package for the Social Sciences (SPSS) software. Using SPSS
software for the statistical analysis generated descriptive statistics based on the answers from the
survey. Descriptive statistics generated included frequency distributions and cross-tabulated
contingency tables. Gathered data are presented in the following chapter using tables and
descriptive narratives to help describe frequency distribution data of respondents’ perceptions on
high-stakes testing’s impact on students and school counselors based on the data gathered from
the surveys. Analysis of the data also included separating respondents into three unique
categories based on the demographic information provided by the respondent. Respondents were
grouped into a low-education-challenge-group and a high-education-challenge-group based on
the percentage of students enrolled in the National School Lunch Program and the percentage of
students identified as an ethnic or racial minority in the school. The second category respondents
were grouped into was made-AYP-group or did-not-make-AYP-group based on their school’s
performance on the state assessment and the school’s AYP status for the 2012-2013 school year.
The third category grouped respondents into two categories based on the number of years spent
working as a school counselor, prior-to-NCLB or after-NCLB.
Using the open-ended questions in the survey allowed participants to provide answers
with more personal meaning with a more in-depth description of their experiences. Using
conventional qualitative content analysis, open-ended questions were collected, examined,
categorized, and coded to identify common themes based on the data gathered (Hsieh &
Shannon, 2005). The open-ended questions were analyzed from data emerging from counselors’

65
perceptions on testing’s impact on students and school counselors. The themes that emerged
were coded and examined with the SPSS software using frequency distributions and cross-
tabulated contingency tables to report the data. Descriptive narratives of the open-ended
questions, including direct quotations if appropriate, are used in the following chapters to
provide readers with a more personal feeling for the impact of testing on student motivation,
stress, and test anxiety, the work environment, and the school counselor’s role through the
perceptions of individual professional school counselor responses.
3.5 LIMITATIONS
There are several limitations inherent in this study. The first is that many of the effects,
particularly motivation, are hard to measure, and those that can be measured, are not measured
using a common metric (Stecher, 2002). The survey is also based on school counselor perception
data, and findings are solely based on survey results asking school counselors their perspectives
on the impact of high-stakes testing. A second limitation that exists includes making
generalizations based on the findings. The number of school counselors responding to the survey
was relatively small, with an even smaller number actually completing the entire survey. The
people who chose to participate, and especially those that completed the entire survey, may not
reflect the views of all school counselors. The sample size was chosen from school counselors
who are members of the Allegheny County Counselors Association. Because of their affiliation
in this association, these members may have different perspectives and different attitudes
towards their career, their district, and students, than counselors that have chosen to not be
members of this association. The sample was taken from one county in Pennsylvania. To

66
facilitate generalization, future studies could examine how counselors from across the country
perceive testing’s impact on students (Zalaquett, 2005).
The respondents in this study may have an extreme view (either negative or positive) on
this topic. People that have a more neutral stance on high-stakes testing may have chosen not to
participate. There are several limitations to using a self-report instrument for research, one of
which is participants may answer the questions in line with how they think the researcher wants
them to answer the question (Zalaquett, 2005). A frequently reported concern that may affect the
reliability of the results is known as social desirability responding. Socially desirable responses
cause participants to respond in ways that make them look good based on cultural norms.
Counselors may have responded in less than truthful ways because they did not want to run the
risk of being unfavorably viewed by others (Amrein-Beardsley et al., 2010). Ensuring
participants the anonymity and confidentiality of the survey, by coding and storing results on a
password protected device may have minimized this effect. Self-reported counselors’ perceptions
are subjective, relying on the judgment of counselors. The survey was designed to gauge the
counselors’ feelings toward high-stakes testing’s impact on students. It is possible that the school
counselors surveyed misjudged the impact testing has on students. For example, the counselor
may think students feel stressed, when in reality the students were not feeling any stress. The
judgment of the counselors may be skewed because of their own personal beliefs. If a counselor
disagrees with testing, and is stressed out during testing, the school counselor may believe others
are feeling stress about testing as well. Although the survey was designed with questions
attempting to minimize these limitations, completely eliminating these limitations is not possible.
Despite the limitations that may exist, valuable information was obtained from surveying the
school counselors who were asked to participate in the study.

67
3.6 CONCLUSION OF METHODS SECTION
Sixty-eight school counselors completed an online survey available through Survey Monkey,
giving a response rate of 42.1%. The survey was developed through a review of the literature and
was pilot tested by professional school counselors and members of a doctoral study group. The
survey consisted of six open-ended questions and 42 closed-ended questions designed to explore
ACCA members’ perceptions on how high-stakes testing has affected students and school
counselors. Once all of the surveys were collected, the data were examined using SPSS software.
Descriptive statistics that included frequency distributions and cross-tabulated contingency tables
were used to analyze the data emerging from the closed-ended questions. Open-ended questions
were explored using conventional qualitative content analysis examining, and coding themes that
emerged from the participant’s responses. The questions were also explored by separating the
participants into subgroups based on Education-Challenge, AYP-Status, and Years-Working.
The exploration of these research questions aim to bring a better understanding of the impact
high-stakes testing has on students and counselors based on the perceptions of professional
school counselors.

68
4.0 DEMOGRAPHIC AND OPEN-ENDED QUESTION RESULTS
This chapter includes an analysis of the data collected from surveying professional school
counselors who are currently members of Allegheny County Counselors Association. The first
section of this chapter contains information explaining the data collected on the demographic
information of the participants. Subsequent sections contain information addressing the three
research questions:
1. How do school counselors perceive the impact of high-stakes testing on their role?
2. How has school counselors’ perceptions about their work environment changed since the
inception of high-stakes testing?
3. What are school counselors’ perceptions of student psychological and emotional well-
being (i.e. motivation, stress, and test-anxiety) in school since the inception of high-stakes
testing?
Information for each of these questions is provided for the entire sample, as well as separated
into categories based on the racial and ethnic minority population of the school and socio-
economic status, identified as Education-Challenge, the school’s academic performance
identified as AYP-Status, Years-Working (the number of years spent working as a school
counselor).

69
4.1 DEMOGRAPHIC DATA
The first section of this chapter contains the analysis of the demographic information provided
by participants. A total of 96 school counselors began the survey. Of these 96, 28 did not
complete the survey. Sixty-eight participants completed the survey for a response rate of 41.2%.
The information from these 68 completed surveys was used to complete the analysis. Of the 68
participants, one half (50.0%, n=34) worked at the high school level, which included grades nine
through twelve, one quarter (25.0%, n=17) worked at a middle school level that included grades
five through eight, and the remainder (25.0%, n=17) worked at the elementary level that included
prekindergarten through fourth grade.
Approximately forty-one percent (41.2%, n=28) of the participants had between six and
ten years of counseling experience in their current district. Approximately one-third of the
participants (35.3%, n=24) had 11 or more years of experience in their current district. The
remainder of the participants (23.5%, n=16) had between one and five years of experience
working as a counselor in their current district. A majority of the participants (61.8%, n=42) did
not work in any other district prior to their current district. Most of the counselors (91.2%, n=62)
only had experience working as a school counselor, while six (8.8%) of the participants worked
as a teacher prior to starting work as a school counselor. Twenty-three (33.8%) participants
started working as a counselor prior to the implementation of NCLB. Forty-five (66.2%)
participants started working as a counselor after NCLB.
A large range existed in the number of students assigned to the individual counselors.
One counselor had only 15 students that he or she was responsible for, while another counselor
had 1,200 students. The average number of students each counselor was responsible for was just

70
over 400 students. The 68 participants were responsible for a total of approximately 27,400
students attending school in Allegheny County.
The participants were asked if their school had a dedicated test coordinator for the state
assessments. A majority of the participants (69.1%, n=47) answered that their school had a
dedicated test coordinator. Eighteen participants (26.5%) responded that they did not have a
dedicated test coordinator in their school. Three participants (4.4%) did not respond to this
question.
The participants then answered a question asking what percent of students in their school
are considered a racial or ethnic minority. They were given the following options, 0-10%, 11-
20%, 21-30%, 31-40%, 41-50%, 51-60%, 61-70%, 71-80%, 81-90%, 91-100%. Approximately
two thirds (61.8%, n=42) of the participants work in a school that has less than 30% of the
population identified as a racial or ethnic minority. Twelve (17.6%) respondents work in schools
that have 31 to 60% of the student population identified as a racial or ethnic minority. Ten
(14.6%) participants responded that 61 to 100% of students were a racial or ethnic minority. Four
(5.9%) participants did not respond to this question.
The participants were then asked approximately what percent of students in their school
are enrolled in the National School Lunch Program. They were given the following options, 0-
10%, 11-20%, 21-30%, 31-40%, 41-50%, 51-60%, 61-70%, 71-80%, 81-90%, 91-100%. The
majority (54.4%, n=37) of participants responded that less than 40% of their school was enrolled
in the National School Lunch Program. Fifteen (22.1%) respondents answered that 41 to 70% of
the student population of the school is enrolled in the National School Lunch Program. Just over
16% of participants (16.2%, n=11) stated 71 to 100% of the students are enrolled in the program.
Five (7.4%) participants did not respond to this question.

71
For the purpose of this study, the preceding two questions were combined to create a new
construct, Education-Challenge, for analysis. Education-Challenge includes the percent of
students identified as a racial or ethnic minority, along with the percent of students enrolled in
the National School Lunch Program. Due to the sample size, the participants were separated into
two categories of either low-education-challenge-group or high-education-challenge-group.
Low-education-challenge-group includes counselors working in schools that have less than 30%
of their population identified as ethnic or racial minority AND enrolled in the National School
Lunch Program. A high-education-challenge-group includes school counselors working in
schools with over 30% identified in these two categories. With the participants separated into
these two categories, approximately one half of the participants fell into each category, with
45.6% (n=31) in the low-education-challenge-group and the rest (48.5%, n=33) in the high-
education-challenge-group. Four (5.9%) participants did not respond to this question.
A second construct used for analysis in this chapter is based on the school’s academic
performance. Participants were asked to identify whether or not their school made Annual Yearly
Progress (AYP) for the 2012-2013 school year. This construct was separated into two categories
as well, made-AYP-group or did-not-make-AYP-group. Eleven participants (16.2%) did not
answer this question. Of those who did answer 32 (47.1%) answered that their school made AYP
for the 2012-2013 school year, while the rest (36.8%, n=25) said their school did not make AYP.

72
4.2 OPEN ENDED QUESTIONS
Respondents were asked a series of open-ended questions to end the survey in an attempt to
allow participants a chance to provide further insight into their perceptions. Open-ended
questions were designed in a way to hopefully provide participants with the opportunity to share
their feelings and personal experiences regarding high-stakes testing. This would give them the
opportunity to expand on information asked in close-ended questions, or provide responses that
were unique based on perceptions counselors have on the effects of high-stakes testing.
Respondents were asked to consider the areas of principal, teacher, student, and parent
relationships; focus on student achievement, motivation, available time to meet with students,
morale, discipline referrals, attendance, and counseling time spent on students dealing with
stress and test anxiety. The table in Appendix M shows the frequency of the responses, after the
responses were coded. Responses were coded to identify common themes based on the data
gathered using conventional qualitative content analysis (Hsieh & Shannon, 2005). Almost one-
third (32.4%, n=22) of the participants did not answer this question. Six negative themes
emerged in the open-ended responses. Twenty-two percent (n=15) of participants stated testing
time makes it harder to counsel students when there is an issue. Four (5.9%) respondents
reported more students experience stress and test anxiety, seven (10.3%) stated personal
relationships and building morale declined, two (2.9%) stated focus on student achievement
negatively impacts the school environment, two (2.9%) stated teachers are more stressed
because of high-stakes testing. Finally, two (2.9%) reported teachers are reluctant to allow
students to leave their classroom to receive counseling services due to the pressure on the
teacher to prepare their students for high-stakes testing. Three positive themes emerged in the
written responses to this question. Two participants (2.9%) reported student attendance

73
improves during testing time, two (2.9%) reported student achievement is easier to monitor
because of the high-stakes tests administered, and one (1.5%) respondent wrote that focus on
student achievement positively impacts student knowledge and performance.
Several counselor responses either did not fit into a theme, or wrote a response that
warrants further exploration. Two positive responses given by counselors focused on making
improvements for the school. One counselor perceived spending more time working with
minority students and trying to improve their test scores in an effort to improve academic
performance. Another counselor felt the relationship with the principal improved drastically
because of the amount of time spent together as a team to try and improve test results. Even
though the question asked to provide how testing had made positive changes, one counselor
used the open space of this question to provide a negative view of testing. The counselor stated,
“we’ve seen a drastic increase in social and emotional needs over the last five years; increased
anxiety, depression, drug, and alcohol concerns. All of which impact high-stakes exams and
post-secondary opportunities.”
One of the final questions on the survey was an open-ended question asking participants
what was the most positive change that occurred because of high-stakes testing. Responses were
coded with several themes emerging; a table containing the information is located in Appendix
N. Thirty-five (51.5%) participants did not respond to the question. The three most common
responses for positive changes that occurred, provided by a total of 16 (23.5%) counselors
taking the survey, was student motivation increased (8.8%, n=6), testing helps put the focus on
student achievement (8.8%, n=6), and attendance and student effort increased due to high-stakes
testing (5.9%, n=4). Although the question asked for positive changes from high-stakes testing 7
(10.3%) participants gave a way to try to improve testing, indicating they think testing is

74
negative in nature. Two (2.9%) wrote students should get more information about the impact
one single test has on their future, two (2.9%) answered the government should eliminate the
importance the tests carry, and two (2.9%) others answered that teachers and administrators
should have more input when developing the tests used.
Although all responses were coded and put into a category based on a theme, several
responses were unique enough they were not categorized. One counselor remarked “progress and
improvement needs to be recognized more than just numbers and benchmarks.” Another
answered, “teachers and administrators should have more input in testing decisions. And,
counselors should work on changing the counseling curriculum to promote skills needed for
testing, specifically at the high school level.”
The final survey question was an open-ended question that asked participants if there was
anything they wanted to add that was not covered in the survey. Several participants responded
with insightful information. One respondent thought it was important to conduct assessments to
assess knowledge acquisition; however, putting a premium on one time exams created unrealistic
expectations and projections for the future of the test-taker. “Research has shown that one test on
any given day is not a definitive indicator of success but, rather, one source of data to consider.
In addition to the information gathered in this survey, it might be interesting to determine how
much teaching time and tax money is consumed when administering these exams.”
A second respondent concurred with this thought believing that testing is important, but
wished there was a way to test all of the different types of learning, visual, auditory, and
kinesthetic. “The tests used are only one form of assessment and I wish there were other ways
students can show what they have learned.” Two other counselors took a much more cynical
look at testing. One of the counselors wrote the focus on this one type of assessment is hurting

75
education because “education is not educating the whole child due to the emphasis on teaching to
the test.” Another stated the tests used are biased and not a good indicator of future performance
and the only thing they are good for is telling school administrators if a student can obtain a
diploma, and make money “for the companies who write, print, and score the tests.” A final
respondent was concerned about the impact testing has on counselors, stating that caseloads are
much too large and contact and rapport with students suffers because of the demands testing puts
on non-counseling activities.

76
5.0 RESEARCH QUESTION 1: RESULTS AND DISCUSSION
The following data represent questions in the survey designed to address research question one,
how do school counselors perceive the impact of high-stakes testing on their role?
In an open-ended question on the survey, only seven (10.2%) of the 68 participants said
they were not involved in the testing process. Several survey questions asked respondents to
estimate the amount of time they spend on certain counseling activities and if this time is a
change from when they began working as a counselor. Almost half of the participants said they
spend more time working with school administrators now than when they began working as a
counselor to plan for school improvement. They estimate spending between one and five hours
per week in these meetings. A difference occurred between the high-education-challenge-group
and low-education-challenge-group in this question, with more high-education-challenge-group
participants stating they do not meet with school administrators to plan for school improvement.
A difference existed between the low-education-challenge-group and high-education-challenge-
group with the number of respondents who do not spend any time talking with parents about
high-stakes tests; more respondents in the high-education-challenge-group said they do not talk
to parents about testing than those in the low-education-challenge-group. Two-thirds (64.7%) of
the respondents reported the time available to meet with students changed for the worse, and
their responsibilities as a counselor have changed, due to testing during their career.

77
Survey questions asked counselors to estimate the amount of time spent on classroom
and small group lessons and individual counseling sessions that focus on test preparation skills,
college and career readiness goals, personal and social skills, or academic goals. A difference
existed in the AYP-Status groups for small group lessons focusing on either academic goals, or
test preparation skills. One quarter of the respondents in the did-not-make-AYP-group said they
do not conduct small group lessons focusing on test preparation skills, as well as small group
lessons focusing on academic goals that are not test preparation based. In comparison, the
majority of respondents in the made-AYP-group stated they spend more time.
Participants were asked to describe their role in the testing process at their school. This
was an open-ended question. Responses were coded into three general categories. More than half
(52.9%, n=36) of the participants identified themselves as the testing coordinator for their school.
Approximately one-third (36.8%, n=25) identified himself or herself as someone who assists the
test coordinator and proctors the assessments. Only seven of the 68 participants said they had no
involvement in the testing process.
5.1 INVOLVEMENT IN COUNSELING ACTIVITIES: RESULTS AND
DISCUSSION
The participants were asked about their involvement in a variety of different counseling
activities. The questions were broken into two parts. The first part asked the participants the
amount of time spent on each activity during a typical week. The options were: I don’t engage in
this activity, 1 hour or less, 1 to 5 hours, 6 to 20 hours, and 21 hours or more. The second part of
the question asked participants to indicate whether the amount of time spent on the activity

78
changed from when they began working as a school counselor to now. The options were: I don’t
engage in this activity, less time now, about the same amount of time, and more time now.
Table 4. Involvement in counseling related activities
I don't engage
in this activity 1 hour or less 1 to 5 hours 6 to 20 hours
21 hours or
more Less time now
About the
same amount
of time More time now
n % n % n % n % n % n % n % n %
Reviewing student
assessment results 7 10.3 41 60.3 16 23.5 2 2.9 1 1.5 4 6.7 27 45.0 29 48.3
Talking with
parents about high-
stakes tests 12 17.6 41 60.3 12 17.6 2 2.9 0 0 4 7.3 25 45.5 26 47.2
Meeting with
adminstrators to
plan for school
improvement 12 17.6 25 36.8 28 41.2 1 1.5 0 0 4 7.4 22 40.7 28 51.9
Acting as test
coordinator/proctor 12 17.6 20 29.4 18 26.5 8 11.8 8 11.8 8 14.8 20 37.0 26 48.1
Offering assistance
outside of school
hours 53 77.9 8 11.9 4 5.9 1 1.5 1 1.5 3 21.4 8 57.1 3 21.4
Revising the
counseling
curriculum due to
high-stakes testing 28 41.2 26 38.2 12 17.6 1 0 0 0 3 7.7 20 51.3 16 41.0Gray scale shading in table denotes the greatest frequency of respondents for a particular category.
The most participants indicated they spent one hour or less during a typical week
reviewing student assessment results (60.3%, n=41), talking with parents about high-stakes tests
(60.3%, n=41), and acting as a test coordinator/proctor (29.4%, n=20). Almost half (41.2%,
n=28) of the participants said they meet with school administrators to plan for school
improvement between one and five hours each week, while the majority (77.9%, n=53) said they
do not offer assistance outside of school hours for students who are not proficient on state
assessments. Just under half (41.2%, n=28) of the participants said they do not spend any time
revising the counseling curriculum due to high-stakes testing (See Table 4).

79
The most participants responded that they are spending more time now than when they
started working as a school counselor reviewing assessment results with students (48.3%, n=29),
talking with parents about high-stakes testing (47.2%, n=26), meeting with school administrators
to plan for school improvement (51.9%, n=28), and acting as test coordinator or proctor (48.1%,
n=26). Just over one half of the participants who offered assistance outside of school hours
(57.1%, n=8) and revised the counseling curriculum (51.3%, n=20) said they spent the same
amount of time on these activities now as when they started working as a counselor.
Cross-tabulations were conducted on the general counseling activities that counselors
complete. The data were cross-tabulated based on the three created constructs of Education-
Challenge (the racial and ethnic minority population of the school with the percent of students
enrolled in the National School Lunch Program), academic performance based on whether the
school made AYP or not, and the number of years working as a school counselor. The data were
cross-tabulated to represent low-education-challenge-group and high-education-challenge-
group, for the made-AYP-group and the did-not-make-AYP-group, and for prior-to-NCLB-group
and after-NCLB-group. Answer choices for the activities asking how the amount of time spent
completing each activity has changed since the beginning of the respondents career as a school
counselor were: do not engage, spend less time now, about the same amount of time, and more
time now.

80
Table 5. Reviewing student assessment results
Reviewing Student Assessment Results
Do Not Engage Less Time Now
About the Same
Amount of Time More Time Now
n % n % n % n %
Low Education Challenge 1 3.2 2 6.4 10 32.3 18 58.1
High Education Challenge 4 12.1 2 6.1 16 48.5 11 33.3
Made AYP 1 3.1 2 6.3 14 43.4 15 46.9
Did Not Make AYP 1 4.0 2 8.0 10 40.0 12 48.0
Prior to NCLB 0 0.0 2 9.1 5 2.3 15 68.2
After NCLB 2 4.4 4 8.9 23 51.1 15 33.3Gray scale shading in table denotes the greatest frequency of respondents for a particular category.
In table 5, Cross-tabulation results show that over one half (58.1%, n=18) of the
respondents in the low-education-challenge-group spent more time reviewing student assessment
results now than when respondents began their career, while a similar number of participants
(48.5%, n=16) in the high-education-challenge-group spent about the same amount of time as
before on this activity. Both the respondents from the made-AYP-group (46.9%, n=15) and those
from the did-not-make-AYP-group (48.0%, n=12) said they spent more time reviewing student
assessment results now than when they began their career. A majority of respondents in the
prior-to-NCLB-group (68.2%, n=15) stated they are spending more time now than at the
beginning of their career, whereas only 33.3% (n=15) of the respondents in the after-NCLB-
group stated they are spending more time now. A majority of the respondents (51.1%, n=23)
stated they are spending about the same amount of time reviewing student assessment results. Of
those in the prior-to-NCLB-group, only 10% of the respondents are spending less time or about
the same time reviewing student assessment results. This change may indicate a shifting in duties

81
for school counselors, with more emphasis placed on the assessment results. An exploration into
how the school counselors are using these results once they review them could be worth
exploring. Since more time is spent reviewing results, hopefully the counselors are able to use
the results to implement programs that are beneficial for students.
Table 6. Talking with parents about high-stakes testing
Talking with Parents About High-Stakes Testing
Do Not Engage Less Time Now
About the Same
Amount of Time More Time Now
n % n % n % n %
Low Education Challenge 1 3.3 2 6.7 13 43.3 14 46.7
High Education Challenge 6 18.8 2 6.3 12 37.5 12 37.5
Made AYP 3 9.7 2 6.4 13 41.9 13 41.9
Did Not Make AYP 1 4.0 2 8.0 11 44.0 11 44.0
Prior to NCLB 0 0.0 2 9.1 9 40.9 11 50.0
After NCLB 7 15.6 4 8.9 18 40.0 16 35.6Gray scale shading denotes significant information found within the table.
In table 6 a difference was observed in the amount of time counselors in the low-
education-challenge-group spent talking with parents about high-stakes testing compared to
those in the high-education-challenge-group. There was only one respondent (3.3%) in the low-
education-challenge-group who said he or she did not engage in this activity, whereas almost
20% (18.8%, n=6) of respondents in the high-education-challenge-group said they do not
participate in this activity. Almost half (46.7%, n=14) of the respondents in the low-education-
challenge-group stated they are spending more time now talking with parents about high-stakes
testing. The most respondents in both categories of AYP-Status stated they spent either the same
amount of time or more time now talking with parents about testing than at the beginning of their
school counseling career. The made-AYP-group had 13 (41.9%) respondents and the did-not-

82
make-AYP-group had 11 (44.0%) participants state they spent about the same amount of time or
more time now. Exactly half of the participants in the prior-to-NCLB-group (50.0%, n=11) said
they spent more time talking with parents about high-stakes testing than when they began their
career. This change can be expected in this group since they began their career prior to NCLB
being enacted, when there was not as much importance placed on the results of testing. Most
groups, especially the prior-to-NCLB-group, experiencing an increase in time spent talking with
parents coincides with previous research that showed one way school counselors may help
benefit students is by working with parents to interpret data and explain the intentions of the
high-stakes exams (Ruff, 2011).
An interesting difference to note existed between the Education-Challenge and Years-
Working groups. Of the respondents in the low-education-challenge-group only 3.3% did not
talk with parents regarding high-stakes testing; whereas, 18.8% of respondents in the high-
education-challenge-group said they do not talk to parents regarding high-stakes testing. All of
the participants in the prior-to-NCLB-group state they do not engage in talking to parents about
high-stakes testing, whereas almost 16% of the after-NCLB-group do not engage in this activity.
It may be interesting to explore the reasons behind this difference in the Education-Challenge
group. Some possibilities for exploration could be whether these counselors in the high-
education-challenge-group do not engage in this activity because they are unwilling to talk to the
parents or because the parents are unwilling to talk to the counselors. Do the counselors attempt
to contact the parents, but do not have a reliable way (changing phone numbers, phones
disconnected, blocked numbers) or are parents avoiding attempts from the school counselors?
Are the counselors at these schools busy working in other areas so they do not have time to
contact the parents? If they do make contact, do they discuss high-stakes tests results or do they

83
discuss other concerns. Due to the differences observed between the education-challenge groups
further exploration could taking a deeper look into these differences.
Table 7. Meeting with school administrators to plan for school improvement
Meeting with Administration to Plan for School Improvement
Do Not Engage Less Time Now
About the Same
Amount of Time More Time Now
n % n % n % n %
Low Education Challenge 2 6.7 2 6.7 12 40.0 14 46.7
High Education Challenge 7 22.1 3 9.4 9 28.1 13 40.6
Made AYP 2 6.3 2 6.3 16 50.0 12 37.5
Did Not Make AYP 5 20.8 2 6.3 3 12.5 14 58.3
Prior to NCLB 2 9.1 3 13.6 6 27.3 11 50.0
After NCLB 7 16.3 2 4.4 17 39.5 17 39.5Gray scale shading denotes significant information found within the table.
The most respondents for both Education-Challenge groups, at almost one half (46.7%,
n=14: 40.6%, n=13) of the responses, say they spent more time meeting with school
administrators to plan for school improvement now then at the beginning of their career.
However, only two respondents (6.7%) in the low-education-challenge-group said they did not
engage in this activity in comparison to seven (22.1%) respondents in the high-education-
challenge-group. Exactly one half of the total respondents (50.0%, n=16) in the made-AYP-
group said they spent the same amount of time meeting with school administrators; whereas,
over half (58.3%, n=14) of the respondents in the did-not-make-AYP-group, said they spent more
time meeting with school administrators to plan for school improvement now (See Table 7). Half
(n=11) of the respondents who began working prior to NCLB stated they spend more time now
meeting with school administrators than at the beginning of their career. The highest number of

84
respondents (39.5%, n-17) in the After-NCLB-group stated they spend more time now, or spend
the same amount of time now.
Differences existed in the subgroups of Education-Challenge and AYP-Status for the
amount of time spent meeting with school administrators to plan for school improvement.
Although a similar number of respondents in both Education-Challenge groups spend more time
meeting with administrators now than at the beginning of their career, a difference existed
between the low-education-challenge-group and the high-education-challenge-group in the
number of counselors who do not meet with administrators to plan for school improvement. Only
6.7% of respondents in the low-education-challenge-group said they do not meet with
administrators, but 22.1% of the respondents in the high-education-challenge-group stated they
do not meet with administrators to plan for school improvement. A similar difference exists
between the AYP-Status groups as well, with more counselors stating they do not engage in
meeting with administrators to plan for school improvement. To what extent do these meetings
factor into differences into high-stakes test results?
Table 8. Acting as test coordinator
Acting as Test Coordinator
Do Not Engage Less Time Now
About the Same
Amount of Time More Time Now
n % n % n % n %
Low Education Challenge 3 10.3 3 10.3 10 34.5 13 40.6
High Education Challenge 4 12.5 5 15.6 10 31.3 13 40.6
Made AYP 2 6.3 4 12.5 14 43.8 12 37.5
Did Not Make AYP 2 8.3 3 12.5 6 25.0 13 54.2
Prior to NCLB 0 0.0 4 18.2 6 27.3 12 54.5
After NCLB 8 18.6 5 11.6 15 34.9 15 34.9Gray scale shading in table denotes the greatest frequency of respondents for a particular category.

85
In table 8, a cross-tabulation was conducted on those acting as the test coordinator in their
school with the Education-Challenge, AYP-Status, and Years-Working groups. Exactly the same
number of respondents in both the low-education-challenge-group and high-education-
challenge-group, at approximately two fifths (40.6%, n=13), responded they spent more time
acting as a test coordinator now than when they began working as a school counselor. Thirteen
respondents (54.2%) in the did-not-make-AYP-group answered they spent more time acting as a
test coordinator now than when they began working as a school counselor. A similar percentage
(43.8%, n=14) in the made-AYP-group stated they spend the same amount of time acting as test
coordinator as at the beginning of their career. Over half (54.5%, n=12) of the prior-to-NCLB-
group stated they are spending more time now. Fifteen (34.9%) of participants in the after-
NCLB-group stated they are spending about the same amount of time, or more time acting as test
coordinator.
The increase in time spent acting, as test coordinator should not be surprising, since the
reliance on high-stakes testing has increased (Amrein & Berliner 2003; Ananda & Rabinowitz,
2000; Hoffman, et al., 2001; Katsiyannis, et al., 2007). The role of the test coordinator may
become the counselor’s responsibility because of the difficulty the counselors have defining their
role (Border, 2002; Monteiro-Leitner et al., 2006). Since school counselors are not responsible
for overseeing students at all times, like a classroom teacher, new responsibilities, or
responsibilities that do not have a specific person assigned to be in charge, often fall to the
counselor. That is why ASCA created the national model, in an attempt to define the school
counselor’s role, so they do not get random responsibilities added to their day (American School
Counselor Association, 2005). An interesting difference to note existed in the Years-Working
group, with zero participants in the prior-to-NCLB-group stating they act as test coordinator,

86
whereas 18.6% of the after-NCLB-group does not engage. This may signal the importance
administrators place on the role of test coordinator. When a school counselor has been in the
position for an extended amount of time they are trusted with the responsibilities of test
coordinator. When the counselor is newer to the position they are not given the responsibility;
the responsibility may be given to a longer tenured counselor or the administrator may decide to
assume the responsibility.
Table 9. Offering after school assistance
Offering Assistance After School for Low Achieving Students
Do Not Engage Less Time Now
About the Same
Amount of Time More Time Now
n % n % n % n %
Low Education Challenge 23 74.2 1 3.2 5 16.1 2 6.5
High Education Challenge 26 81.2 2 6.3 3 9.4 1 3.1
Made AYP 25 78.1 0 0.0 5 15.6 2 6.3
Did Not Make AYP 18 72.0 3 12.0 3 12.0 1 7.8
Prior to NCLB 14 63.6 2 9.1 5 22.7 1 4.5
After NCLB 31 68.9 1 2.2 11 24.4 2 4.4Gray scale shading in table denotes the greatest frequency of respondents for a particular category.
Table 9 reports the cross-tabulation data for the change in the amount of time counselors
spent offering assistance outside of school for low achieving students. A majority of the
respondents in all six groups (74.2%, n=23) in the low-education-challenge-group, (81.2%,
n=26) in the high-education-challenge-group, (78.1%, n=25) in the made-AYP-group, (72.0%,
n=18) in the did-not-make-AYP-group, (63.6%, n=14) in the prior-to-NCLB-group, and (68.9%,
n=31) in the after-NCLB-group did not engage in this activity.
The results of the cross-tabulation analysis for the question asking counselors how
revising the counseling curriculum due to high-stakes testing has changed from when they began

87
working as a counselor are reported in table 10. The largest number of participants in the
Education-Challenge groups, the made-AYP-group, and the after-NCLB-group responded that
they spent about the same amount of time now as when they began their career. Ten respondents
in the low-education-challenge-group (35.7%) and high-education-challenge-group (34.5%)
responded that the time spent is the same. Fourteen (46.7%) respondents in the made-AYP-group
and 17 (38.6%) in the after-NCLB-group stated they spent the same amount of time revising the
counseling curriculum now as when they began their career. The did-not-make-AYP-group
(33.3%, n=8) and the prior-to-NCLB-group (42.9%, n=9) stated they spent more time now
revising the curriculum due to high-stakes testing than when they began their career.
Table 10. Revising the counseling curriculum
Revising Curriculum due to High-Stakes Testing
Do Not Engage Less Time Now
About the Same
Amount of Time More Time Now
n % n % n % n %
Low Education Challenge 9 32.1 1 35.7 10 35.7 8 28.6
High Education Challenge 9 31.0 2 10.5 10 34.5 8 27.6
Made AYP 8 26.7 0 0.0 14 46.7 8 26.7
Did Not Make AYP 6 25.0 2 82.8 6 25.0 8 33.3
Prior to NCLB 4 19.0 1 4.8 7 33.3 9 42.9
After NCLB 14 31.8 2 4.5 17 38.6 11 25.0 Gray scale shading in table denotes the greatest frequency of respondents for a particular category.
In appendix E is a table, which contains information on frequency results of two survey
questions asking participants about changes seen in their role with the use of high-stakes testing.
Both questions asked respondents to rate if the item changed for the worse, did not change, or
changed for the better. Results for how the focus on student achievement changed since the
beginning of their career, shows that just over one half (52.9%, n=36) of the respondents

88
reported a change did not occur in the amount of focus given to student achievement in their
school, almost one-third (29.4%, n= 20) stated it changed for the better, and twelve (17.6%)
stated it changed for the worse. A majority (64.7%, n=44) of respondents stated the time
available to meet with students changed for the worse since they began working as a school
counselor, while one-third (33.8%, n=23) stated it did not change, and one (1.5%) stated it
changed for the better.
Table 11. Counselor’s role involving students
Focus on Student Achievement
Changed for the
Worse Did Not Change
Changed for the
Better
n % n % n %
Low Education Challenge 5 16.1 18 58.1 8 25.8
High Education Challenge 5 15.2 16 48.5 12 36.4
Made AYP 6 18.8 16 50.0 10 31.3
Did Not Make AYP 4 16.0 13 52.0 8 32.0
Prior to NCLB 1 4.3 15 65.2 7 28.9
After NCLB 11 24.4 21 46.7 13 30.4
Time Available to Counsel Students
Low Education Challenge 22 71.0 8 25.8 1 3.2
High Education Challenge 19 57.6 14 42.4 0 0.0
Made AYP 23 71.9 9 28.1 0 0.0
Did Not Make AYP 17 68.0 8 32.0 0 0.0
Prior to NCLB 18 78.3 4 17.4 1 4.3
After NCLB 26 57.8 19 42.2 0 0.0Gray scale shading in table denotes the greatest frequency of respondents for a particular category.
Completing a cross-tabulation on the variables of focus on student achievement and time
available to counsel students, and comparing both to the three groups in Education-Challenge,
AYP-Status, and Years-Working revealed similar findings for the groups (See Table 11). All six
groups had the most respondents answer that the focus on student achievement did not change.
The majority of respondents stated there was no change in the focus on student achievement in

89
the low-education-challenge-group (58.1%, n=18), the made-AYP-group (50.0%, n=16), the did-
not-make-AYP-group (52.0%, n=13), and the prior-to-NCLB-group (65.2%, n=15), while almost
one half of the respondents in the high-education-challenge-group (48.5%, n=16) and after-
NCLB-group (46.7%, n=21) stated the focus on student achievement did not change. The
majority of respondents in all six groups perceived the time available to counsel students
changed for the worse since the beginning of their career. The low-education-challenge-group
(71.0%, n=22), the high-education-challenge-group (57.6%, n=19), the made-AYP-group
(71.9%, n=23), the did-not-make-AYP-group (68.0%, n=17), the prior-to-NCLB-group (78.3%,
n=18), and after-NCLB-group (57.8%, n=26) stated they have less time to counsel students.
None of the participants in the high-education-challenge-group, made-AYP-group, did-
not-make-AYP-group, and after-NCLB-group, and only one participant in the low-education-
challenge-group and prior-to-NCLB-group stated the time available to counsel students changed
for the better. It may be of interest to explore the reasons behind why counselors stated time
available to counsel students has changed for the worse. What impact did high-stakes testing
play on the time available to counsel students? Has this lack of time to counsel students affected
the personal and emotional development of students in a negative way? This change may
indicate an erosion in the school counselor’s role, and possibly the value placed in the position. If
a counselor’s primary responsibility is to work with students, and the available time to meet with
students is changing for the worse, this may bring about a change in how the counselor’s role and
responsibilities are defined, especially if there are no plans to change NCLB or the high-stakes
tests used to measure accountability. School counseling training programs, the ASCA National
Model, and current school counselors may need to shift what they define as their primary
purpose.

90
5.2 CLASSROOM LESSONS: RESULTS AND DISCUSSION
5.2.1 Classroom Lessons: Results
The following section describes the analysis of four research questions asking respondents the
amount of time spent (I don’t engage, 1 hour or less, 1 to 5 hours, 6 to 20 hours, and 21 hours or
more), along with the change experienced (less time now, about the same amount of time, more
time now) in four different areas of classroom guidance lessons school counselors may normally
conduct. The four lesson areas involved: test preparation skills, college and career readiness
goals, personal/social skills, and academic goals that are not test preparation based.
Table 12. Time engaged and change experienced in classroom guidance lessons
I don't engage
in this activity 1 hour or less 1 to 5 hours 6 to 20 hours
21 hours or
more Less time now
About the
same amount
of time
More time
now
n % n % n % n % n % n % n % n %
Classroom lessons
involving test
preparation skills 27 39.7 26 38.2 12 17.6 1 1.5 1 1.5 4 10.0 26 65.0 10 25.0
Classroom lessons
involving college
and career
readiness goals 16 23.5 21 30.9 26 38.2 3 4.4 0 0.0 7 13.5 25 48.1 20 38.5
Classroom lessons
involving
personal/social
skills 10 14.7 19 27.9 26 38.2 10 14.7 1 1.5 7 12.5 35 62.5 14 25.0
Classroom lessons
involving
academic goals
that are not test
preparation based 16 23.5 19 27.9 25 36.7 6 8.8 0 0.0 5 10.0 30 60.0 15 30.0
Gray scale shading denotes significant information found within the table.
Table 12 contains frequency distribution data for the four lesson types. The most
counselors reported spending between 1 to 5 hours in a typical week conducting: classroom
lessons involving college and career readiness goals (38.2%, n=26), classroom lessons involving
personal and social skills (38.2%, n=26), and classroom lessons involving academic goals that

91
are not test preparation based (36.7%, n=25). For classroom lessons involving test preparation
skills 26 (38.2%) counselors responded that they spent one hour or less in a typical week on this
activity. Respondents stated they spend the same amount of time on all four-classroom guidance
lessons (65.0%, n=26 – test preparation skills; 48.1%, n=25 – college and career readiness;
62.5%, n=35 – personal/social skills; 60.0%, n=30 – academic goals that are not test preparation
based) throughout their career.
Cross-tabulation analysis was conducted for the four classroom lessons with the two
Education-Challenge groups, two AYP-Status groups, and two Years-Working groups. The cross-
tabulated table (See Table 13) shows similar trends for all four groups. Each group, the low-
education-challenge-group, high-education-challenge-group, made-AYP-group, did-not-make-
AYP-group, prior-to-NCLB-group, and after-NCLB-group reported the amount of time spent on
all four classroom guidance lessons is about the same amount of time now as when they began
their career.

92
Table 13. Cross-tabulations of time engaged and change experienced in classroom guidance lessons
Classroom Lessons Involving Test Preparation
Do Not Engage Less Time Now
About the Same
Amount of Time More Time Now
n % n % n % n %
Low Education Challenge 9 30.0 2 6.7 13 43.3 6 20.0
High Education Challenge 11 36.7 2 6.7 13 43.3 4 13.3
Made AYP 9 28.1 1 3.1 16 50.0 6 18.8
Did Not Make AYP 8 32.0 3 12.0 10 40.0 4 16.0
Prior to NCLB 7 31.8 1 4.5 9 40.9 5 22.7
After NCLB 14 31.8 4 9.1 19 43.2 7 15.9
Classroom Lessons Involving Career and College Preparedness
Do Not Engage Less Time Now
About the Same
Amount of Time More Time Now
n % n % n % n %
Low Education Challenge 9 29.0 3 9.7 12 38.7 7 22.6
High Education Challenge 5 15.2 3 9.1 13 39.4 12 36.4
Made AYP 5 16.7 2 6.7 13 43.3 10 33.3
Did Not Make AYP 5 20.0 3 12.0 10 40.0 7 28.0
Prior to NCLB 3 13.6 1 4.5 11 50.0 7 31.8
After NCLB 8 17.8 3 6.7 19 42.2 15 33.3
Classroom Lessons Involving Personal/Social Skills
Do Not Engage Less Time Now
About the Same
Amount of Time More Time Now
n % n % n % n %
Low Education Challenge 5 16.1 2 6.5 17 54.8 7 22.6
High Education Challenge 3 9.3 5 15.6 17 53.1 7 21.9
Made AYP 4 12.5 3 9.4 18 56.3 7 21.9
Did Not Make AYP 3 12.0 4 16.0 14 56.0 4 16.0
Prior to NCLB 2 9.1 3 13.6 12 54.4 5 22.7
After NCLB 7 15.9 5 11.4 23 52.3 9 20.5
Classroom Lessons Involving Academic Goals
Do Not Engage Less Time Now
About the Same
Amount of Time More Time Now
n % n % n % n %
Low Education Challenge 7 22.6 1 3.2 17 54.8 6 19.4
High Education Challenge 7 22.6 4 12.9 13 41.9 7 22.6
Made AYP 6 18.8 2 6.3 17 53.1 7 21.9
Did Not Make AYP 7 29.2 3 12.5 10 41.7 4 16.7
Prior to NCLB 5 22.7 1 4.5 10 45.5 6 24.2
After NCLB 10 23.3 4 9.3 20 46.5 9 20.9
Gray scale shading in table denotes the greatest frequency of respondents for a particular category.

93
5.2.2 Classroom Lessons: Discussion
The goal of most comprehensive school counseling programs that follow ASCA standards is to
take a proactive approach to counseling, running classroom guidance lessons, small group
lessons, and individual counseling sessions to equip students with the necessary skills to help
eliminate barriers to learning and socially, emotionally, and academically prepare students for
post-secondary success (American School Counselor Association, 2005). As stated earlier in the
chapter, school counselors in this study stated the biggest change they noticed with the use of
high-stakes testing was the amount of time available to meet with students. With two-thirds
(64.7%) of the counselors stating time available to meet with students has changed for the worse
since the beginning of their career, there may be a noticeable difference in the time counselors
spend conducting classroom lessons, small group lessons, or individual counseling sessions;
however, this was not the case in most areas studied. School counselors in this study spend about
the same amount of time now as at the beginning of their career to conduct classroom and small
group lessons and individual counseling sessions in the four areas explored (test preparation
skills, college and career readiness goals, personal and social skills, and academic goals). If the
counselors surveyed have less time to meet with students, the lost time does not appear to have
come from any of these areas.
Previous research found there were fewer opportunities to conduct classroom and small
group lessons and individual counseling sessions because teachers were not willing to give up
class time for guidance lessons or allow students out of class for small group or individual
counseling (Davis, 2006). Other studies found counselors believe high-stakes testing negatively
influences their ability to implement a comprehensive guidance program and deliver appropriate
counseling services to students (Brigman & Campbell, 2003; Ruff, 2011). This is an important

94
area to consider since these services provided by counselors have a positive impact on student
behavior and academic performance (Brigman & Campbell, 2003; Ruff, 2011).
The survey was designed to explore the amount of time the counselors spend conducting
lessons on test preparation skills, college and career readiness goals, personal and social skills,
and academic goals that are not test preparation based, as well as if the time spent is different
than when they began working as a counselor. Based on the literature, a complaint by detractors
of high-stakes testing is a narrowing of the curriculum that occurs with the use of high-stakes
testing; basically, believing that teachers focus their lessons on tested subjects, specifically on
the content in the assessments (Nichols & Berliner, 2005; Yeh, 2005). Teachers may spend more
time on tested subject areas than non-tested subject areas. If testing has narrowed the focus for
counselors, as Nichols and Berliner (2005), and Yeh (2005) show that it does for teachers, the
school counselors in this study might consider focusing most of their counseling lessons on test
preparation skills, and spend less time in the other areas of general academic goals, personal and
social skills, and college and career readiness goals. However, this was not the case. Results
from this study suggest high-stakes testing does not change the way counselors conduct
classroom lessons. In fact, counselors actually spend less time during a typical week conducting
classroom lessons centered on test preparation skills than in the other three areas. Over one-third
of the counselors spend between 1 to 5 hours in a typical week conducting classroom lessons
involving college and career readiness goals (38.2%), personal and social skills (38.2%), and
academic goals that are not test preparation based (36.7%). Whereas, over one-third stated they
spend one hour or less conducting classroom lessons involving test preparation skills (38.2%).
This difference shows the school counselors surveyed are not spending as much time on lessons
involving test preparation skills; instead they focus the time spent in the classroom in other areas.
95
It may be interesting to explore why this difference exists. Since high-stakes testing has been in
place for so long, the use of tests, and the use of test taking strategies may be the new normal for
the education system. The school counselor may not need to conduct a special classroom lesson
to teach students the best way to take a standardized (normally multiple choice with bubbled in
choices) test. Classroom teachers may now use test preparation skills as part of their daily
lessons, therefore they do not need the school counselor to teach a special lesson on test
preparation skills. Another consideration may be the length of time that high-stakes testing has
been in place. With the creation of the No Child Left Behind Act all current school students have
spent their entire schooling having to take high-stakes tests. Are the counselors not focusing on
these lessons because the students they counsel are so versed in taking the high-stakes tests that
they feel the students do not need test preparation skills taught to them? At the very least,
students are now proficient at taking multiple-choice tests, and are highly skilled at bubbling in
answer choices.
When separated into the different subgroups, the time spent on all four-classroom
guidance lessons is similar to when they began working as a school counselor. There were no
noticeable differences observed in the subgroups of Education-Challenge, AYP-Status, or Years-
Working; the most participants in each group stated they spend the same amount of time on all
four areas of counseling now as to when they began working as a counselor.

96
5.3 SMALL GROUP LESSONS: RESULTS AND DISCUSSION
5.3.1 Small Group Lessons: Results
The following section describes the analysis of four research questions asking respondents the
amount of time spent (I don’t engage, 1 hour or less, 1 to 5 hours, 6 to 20 hours, and 21 hours or
more), along with the change experienced (less time now, about the same amount of time, more
time now), in four different areas of small group counseling lessons school counselors may
normally conduct. The four lesson areas involve: test preparation skills, college and career
readiness goals, personal and social skills, and academic goals that are not test preparation based.
Table 14. Time engaged and change experienced in small group lessons
I don't engage
in this activity 1 hour or less 1 to 5 hours 6 to 20 hours
21 hours or
more Less time now
About the
same amount
of time
More time
now
n % n % n % n % n % n % n % n %
Small group
lessons involving
test preparation
skills 38 55.9 14 20.6 12 17.6 3 4.4 0 0.0 2 6.9 21 72.4 6 20.7
Small group
lessons involving
college and career
readiness goals 34 50.0 19 27.9 8 11.8 6 8.8 0 0 2 6.1 21 63.6 10 30.3
Small group
lessons involving
personal/social
skills 17 25.0 18 26.5 12 17.6 19 27.9 1 1.5 10 20.0 23 46.0 17 34.0
Small group
lessons involving
academic goals
that are not test
preparation based 26 38.2 19 27.9 12 17.6 9 13.2 1 1.5 5 12.2 29 70.7 7 17.1
Gray scale shading in table denotes the greatest frequency of respondents for a particular category.
At least one half of all respondents stated they do not engage in small group lessons
involving test preparation skills (55.9%, n=38) or college and career readiness goals (50.0%,

97
n=34) as reported in table 14. Of the respondents who did complete these two different small
group lessons, most answered they spend about the same amount of time on the activities as
when they began working as a counselor. Twenty one respondents stated the time spent is similar
for test preparation lessons (72.4%) and college and career readiness goals (63.6%). Although
not as high of a percentage as the previous two examples, the largest number of respondents
(38.2%, n=26) stated they do not engage in small group lessons involving academic goals that
are not test preparation based. Of the respondents who did conduct this small group lesson, a
large majority (70.7%, n=29) perceive they spend the same amount of time now as when they
began working as a counselor. Small group lessons pertaining to personal and social skills is the
only small group lesson of the four different lessons participants responded to that did not have
the largest group of respondents fall in the do not engage category. Nineteen (27.9%) counselors
responded they conducted between six to 20 hours of small group lessons focusing on personal
and social skills during a typical work week, with 23 respondents (46.0%) believing they spent
about the same amount of time in this area as when they began working as a school counselor.
Table 15 contains information from the cross-tabulation analysis conducted on the four
different small group activities that counselors may conduct, separated by Education-Challenge
and AYP-Status.

98
Table 15. Cross-tabulations of time engaged and change experienced in small group lessons
Group Lessons Involving Test Preparation Skills
Do Not Engage Less Time Now
About the Same
Amount of Time More Time Now
n % n % n % n %
Low Education Challenge 15 48.4 1 3.2 11 35.5 4 12.9
High Education Challenge 19 59.4 1 3.1 10 31.3 2 6.3
Made AYP 14 43.8 1 3.1 12 37.5 5 15.6
Did Not Make AYP 14 56.0 1 4.0 9 36.0 1 4.0
Prior to NCLB 10 45.5 1 4.5 7 31.8 4 18.2
After NCLB 22 50.0 2 4.5 16 36.4 4 9.1
Group Lessons Involving College and Career Readiness Goals
Do Not Engage Less Time Now
About the Same
Amount of Time More Time Now
n % n % n % n %
Low Education Challenge 15 48.4 1 3.2 10 32.3 5 16.1
High Education Challenge 15 46.9 1 3.1 11 34.3 5 15.6
Made AYP 12 37.5 1 3.1 14 43.8 5 15.6
Did Not Make AYP 15 60.0 1 4.0 5 20.0 4 16.0
Prior to NCLB 9 40.9 2 9.1 8 36.4 3 13.6
After NCLB 18 40.9 2 4.5 15 34.1 9 20.1
Group Lessons Involving Personal/Social Skills
Do Not Engage Less Time Now
About the Same
Amount of Time More Time Now
n % n % n % n %
Low Education Challenge 7 22.6 3 9.7 10 32.2 11 35.5
High Education Challenge 7 21.2 7 21.2 13 39.4 6 18.2
Made AYP 6 18.8 2 6.3 14 43.8 10 31.3
Did Not Make AYP 5 20.0 8 32.0 8 32.0 4 16.0
Prior to NCLB 4 18.2 3 17.8 8 36.4 7 31.8
After NCLB 10 22.2 8 13.6 16 35.6 11 24.4
Group Lessons Involving Academic Goals
Do Not Engage Less Time Now
About the Same
Amount of Time More Time Now
n % n % n % n %
Low Education Challenge 11 35.5 2 6.5 14 45.2 4 12.9
High Education Challenge 11 34.4 3 9.4 15 46.9 3 9.4
Made AYP 7 21.9 2 6.3 19 59.4 4 12.5
Did Not Make AYP 11 44.0 3 12.0 10 40.0 1 4.0
Prior to NCLB 9 40.9 2 9.1 9 40.9 2 9.1
After NCLB 12 27.3 4 9.1 22 50.0 6 13.6
Gray scale shading in table denotes the greatest frequency of respondents for a particular category.

99
Few differences exist between the groups in several of the different small group lessons
conducted by counselors; however, a difference did not exist in the largest number of
respondents in the Education-Challenge groups, the AYP-Status groups, or Years-Working
groups for small group lessons focusing on test preparation skills. Both the low-education-
challenge-group (48.4%, n=15) and the high-education-challenge-group (59.4%, n=19) had the
highest number of respondents state they do not engage in groups involving test preparation
skills. Both the made-AYP-group (43.8%, n=14) and did-not-make-AYP-group (56.0%, n=14)
had the highest number of respondents state they do not engage in groups involving test
preparation skills. Both the prior-to-NCLB-group (45.5%, n=10) and the after-NCLB-group
(50.0%, n=22) had the highest number of respondents state that they do not engage in groups
involving test preparation skills.
A difference did not exist in the highest number of responses given for college and career
readiness goals between the low-education-challenge-group (48.4%, n=15), high-education-
challenge-group (46.9%, n=15), prior-to-NCLB-group (40.9%, n=9), and after-NCLB-group
(40.9%, n=18) who said they did not engage in this activity. A difference existed for the AYP-
Status groups, where the made-AYP-group had the highest number (43.8%, n=14) of respondents
state they spend about the same amount of time now as at the beginning of their career, in
comparison to 15 (60.0%) of those in the did-not-make-AYP-group who stated they do not
engage in the counseling activity.
When respondents were asked about the change in the time spent on small group
counseling activities pertaining to personal and social skills the high-education-challenge-group
(39.4%, n=13), made-AYP-group (43.8%, n=14), prior-to-NCLB-group (36.4%,n = 9), and after-
NCLB-group (50.0%, n=22) had the most respondents state they spend about the same amount of

100
time now as at the beginning of their career. Only one group, the low-education-challenge-group
had the most respondents, with eleven (35.5%), state they spent more time conducting these
lessons now than when they began their career as a school counselor. The did-not-make-AYP-
group’s results were more evenly spread across the four options than any of the other categories.
Sixteen (64.0%) respondents were evenly split on either having less time now or about the same
amount of time now.
When respondents were asked about the change in the time spent on small group
counseling activities pertaining to academic goals that are not test preparation based, four of the
six groups: low-education-challenge-group (45.2%, n=15), high-education-challenge-group
(46.9%, n=15), made-AYP-group (59.4%, n=19), and after-NCLB-group (50.0%, n=22) had the
most respondents state they spent about the same amount of time now as at the beginning of their
career. Only one group, the did-not-make-AYP-group had the most respondents, with eleven
(44.0%), state they did not engage in small group lessons pertaining to teaching academic goals
that are not test preparation based. The prior-to-NCLB-group’s results were more evenly spread
across the four options than any of the other categories. Eighteen (81.8%) respondents were
evenly split on either having less time now or about the same amount of time now.
5.3.2 Small Group Lessons: Discussion
Similar results were seen for the small group lessons that counselors conduct with their students
when compared to the classroom lessons previously reported. In fact, more than half (55.9%) of
the counselors surveyed stated they do not engage in small group lessons focusing on test
preparation skills. On the other hand, the largest number of respondents, at almost one-third
(27.9%), stated they spend between six and 20 hours per week conducting small group lessons

101
focusing on personal and social skills. This focus on personal and social skills, in comparison to
what seems to be a lack of focus on test preparation skills, contradicts some of the research that
found high-stakes testing is occurring to the detriment of the emotional and psychological
development of the students since these lessons may focus on developing personal and social
skills (Brown et al., 2004; Harlen, 2005; Zeidner, 1998). At the very least, these counseling
activities may offset some of the negative effects high-stakes testing has, based on research that
found students are negatively impacted emotionally by high-stakes testing (Brown et al., 2004;
Frase-Blunt, n.d.; Fleege et al., n.d.; Zeidner, 1998). Most of the counselors that did conduct
small group lessons focusing on test preparation skills (72.4%) and personal and social skills
(46.0%) stated they spend about the same amount of time on the activities now as when they
began working as a counselor.
Few differences exists between the subgroups when exploring the change in time spent
conducting small group lessons when looking at the largest number of respondents in each
category; however some differences exists between the groups when looking at other areas.
Although the largest number of respondents stated they do not engage in small group lessons
focusing on test preparation skills in the subgroups, a difference does exists in the number of
respondents stating they are spending more time now than when they began their career. More
respondents are spending an increased amount of time conducting test preparation, personal and
social skills, and academic goals lessons in the low-education-challenge-group and made-AYP-
group than the high-education-challenge-group and did-not-make-AYP-group. It may be
interesting to explore why these differences exists between the subgroups and if the differences
in the AYP-Status groups played a factor in the test scores for these schools.

102
5.4 INDIVIDUAL COUNSELING: RESULTS AND DISCUSSION
5.4.1 Individual Counseling: Results
The following section describes the analysis of four research questions asking respondents the
amount of time they spend (I don’t engage, 1 hour or less, 1 to 5 hours, 6 to 20 hours, and 21
hours or more), along with the change experienced (less time now, about the same amount of
time, more time now) in four different areas of individual counseling activities school counselors
may normally conduct. The four individual counseling areas involve: test preparation skills,
college and career readiness goals, personal and social skills, and academic goals that are not test
preparation based.
Table 16 shows the frequency distribution of the four counseling areas along with the
change experienced by the respondents.

103
Table 16. Time engaged and change experienced in individual counseling
I don't engage
in this activity 1 hour or less 1 to 5 hours 6 to 20 hours
21 hours or
more Less time now
About the
same amount
of time
More time
now
n % n % n % n % n % n % n % n %
Individual
counseling
involving test
preparation skills 11 16.2 32 47.1 16 23.5 5 7.4 1 1.5 2 3.7 37 69.8 15 28.3
Individual
counseling
involving college
and career
readiness goals 14 20.6 12 17.6 20 29.4 18 26.5 1 1.5 4 7.8 32 62.7 15 29.4
Individual
counseling
involving
personal/social
skills 1 1.5 7 10.3 18 26.5 34 50.0 5 7.4 8 12.5 40 62.5 16 25.0
Individual
counseling
involving
academic goals
that are not test
preparation based 6 8.8 14 20.6 23 33.8 21 30.9 1 1.5 5 8.5 39 66.1 15 25.4 Gray scale shading in table denotes the greatest frequency of respondents for a particular category.
Nearly half of all respondents (47.1%, n=32) stated they spend approximately one hour or
less during a typical week conducting individual counseling sessions involving test preparation
skills. Of the respondents who completed test preparation skill individual counseling, most
(69.8%, n=37) stated they spend about the same amount of time on the activity as when they
began working as a counselor. A majority of all respondents said they spent between one to 20
hours during a typical week conducting individual counseling sessions pertaining to college and
career readiness goals (55.9%, n=38), personal and social skills (76.5%, n=52), and academic

104
goals that are not test perparation based (64.7%, n=44). Over 60% of the respondents who
conducted these counseling sessions said the time spent on the session was about the same
amount of time now as it was when they began working as a counselor.
Table 17 contains information from the cross-tabulation analysis conducted on the four
different individual counseling activities that counselors may conduct, separated by Education-
Challenge and AYP-Status.

105
Table 17. Cross-tabulations of time engaged and change experienced in individual counseling
Individual Counseling Involving Test Preparation Skills
Do Not Engage Less Time Now
About the Same
Amount of Time More Time Now
n % n % n % n %
Low Education Challenge 4 13.3 0 0.0 18 60.0 8 26.7
High Education Challenge 6 19.4 2 6.5 16 51.6 7 22.6
Made AYP 3 9.4 0 0.0 21 65.6 8 25.0
Did Not Make AYP 5 20.8 2 8.3 13 54.2 4 16.7
Prior to NCLB 3 13.6 0 0.0 12 54.5 7 31.8
After NCLB 6 14.3 3 7.1 25 59.5 8 19.0
Individual Counseling Involving College and Career Preparedness Goals
Do Not Engage Less Time Now
About the Same
Amount of Time More Time Now
n % n % n % n %
Low Education Challenge 8 27.6 1 3.4 13 44.8 7 24.1
High Education Challenge 5 16.1 1 3.2 17 54.9 8 25.8
Made AYP 7 22.6 0 0.0 18 58.1 6 19.4
Did Not Make AYP 5 20.8 2 8.3 12 50.0 5 20.8
Prior to NCLB 4 18.2 0 0.0 12 54.5 6 27.3
After NCLB 10 24.4 2 4.9 20 48.8 9 22.0
Individual Counseling Involving Personal/Social Skills
Do Not Engage Less Time Now
About the Same
Amount of Time More Time Now
n % n % n % n %
Low Education Challenge 0 0.0 3 10.0 15 50.0 12 40.0
High Education Challenge 1 3.3 4 13.3 23 76.7 3 10.0
Made AYP 0 0.0 4 12.5 16 50.0 12 37.5
Did Not Make AYP 1 4.2 2 8.3 19 79.2 2 8.3
Prior to NCLB 0 0.0 2 9.1 11 50.0 9 40.9
After NCLB 1 2.3 5 11.9 29 69.0 7 16.7
Individual Counseling Involving Academic Goals
Do Not Engage Less Time Now
About the Same
Amount of Time More Time Now
n % n % n % n %
Low Education Challenge 3 10.0 0 0.0 19 63.3 8 26.7
High Education Challenge 1 3.3 5 16.7 18 60.0 6 20.0
Made AYP 2 6.3 1 3.1 21 65.6 8 25.0
Did Not Make AYP 2 8.7 3 13.0 13 56.5 5 21.7
Prior to NCLB 1 4.5 1 4.5 13 59.1 7 31.8
After NCLB 3 7.3 4 9.8 26 63.4 8 19.5
Gray scale shading in table denotes the greatest frequency of respondents for a particular category.

106
Few differences existed between the Education-Challenge group, the AYP-Status group,
and the Years-Working group in any of the four different types of individual counseling sessions.
Of the respondents who conducted individual counseling sessions in the four areas, which most
counselors did, each of the groups had the highest number of respondents state the time spent on
the individual counseling activities is about the same amount of time now as when they began
working as a school counselor. The Low-education-challenge-group had 18 respondents
(60.0%), and the high-education-challenge-group had 16 respondents (51.6%); while the prior-
to-NCLB-group had 12 respondents (55.40%), and the after-NCLB-group had 20 respondents
(48.8%), say the time spent on test preparation individual counseling is about the same amount
of time as when they began working as a counselor. A larger percentage of counselors in the
made-AYP-group (65.6%, n=21) stated the time spent is the same in comparison to the did-not-
make-AYP-group (54.2%, n=13), but this category had the largest number of respondents for
both groups.
Similar trends were observed in the other three individual counseling activities as well.
Thirteen respondents (44.8%) in the low-education-challenge-group, 17 respondents (54.9%) in
the high-education-challenge-group, 18 respondents (58.1%) in the made-AYP-group, 12
respondents (50.0%) in the did-not-make-AYP-group, 12 respondents (54.5%) in the prior-to-
NCLB-group, and 20 respondents (48.8%) in the after-NCLB-group stated they spend about the
same amount of time conducting individual counseling on college and career preparedness goals
as to when they began working as a counselor. The majority of respondents in the low-education-
challenge-group (50.0%, n=15), in the high-education-challenge-group (76.7%, n=23), in the
made-AYP-group (50.0%, n=16), in the did-not-make-AYP-group (79.2%, n=19), in the prior-to-
NCLB-group (50.0%, n=11), and in the after-NCLB-group (69.0%, n=29) stated they spend

107
about the same amount of time conducting individual counseling on personal and social skills as
to when they began working as a counselor. Finally, for individual counseling sessions focusing
on academic goals that are not test preparation based, a majority of respondents stated the
amount of time spent on this activity is about the same regardless of the group: low-education-
challenge-group (63.3%, n=19), high-education-challenge-group (60.0%, n=18), made-AYP-
group (65.6%, n=21), did-not-make-AYP-group (56.5%, n=13), prior-to-NCLB-group (59.1%,
n=13), and after-NCLB-group (63.4%, n=26).
5.4.2 Individual Counseling: Discussion
A trend similar to the previous two types of counseling lessons (classroom and small group
lessons) was observed in individual counseling activities, with a difference seen in the amount of
time spent on individual counseling with students on test preparation skills. Nearly half (47.1%)
of all respondents spent approximately one hour or less during a typical week conducting
individual counseling sessions involving test preparation skills, which is similar to when they
started working as a school counselor. In comparison, the majority of respondents typically spent
between one to 20 hours per week conducting individual counseling sessions on lessons
pertaining to college and career readiness goals (55.9%), personal and social skills (76.5%), and
academic goals that are not test perparation based (64.7%). Counselors stated this is the same
amount of time now as to when they began their career working as a school counselor. No
diffference existed between the subgroups in any of the four different types of individual
counseling sessions when looking at the category with the most respondents, each group stated
they spent about the same amount of time now as when they began their career. A difference
existed in all three groups in individual counseling sessions pertaining to personal and social

108
skills. More respondents in the low-education-challenge-group, made-AYP-group, and prior-to-
NCLB-group stated they were spending more time now than when they began their career in
comparison to the high-education-challenge-group, did-not-make-AYP-group, and after-NCLB-
group. It would be interesting to further explore why these differences exists between the groups.
5.5 OPEN-ENDED QUESTION REGARDING COUNSELORS ROLE
One open-ended question in the survey asked the respondents to explain if changes had occurred
in one of the following activities: reviewing student assessment results, talking with parents
about high-stakes tests, meeting with administrators to plan for school improvement, acting as
test coordinator, offering assistance outside of school hours for students who are not proficient
on the state tests, or revising the counseling curriculum due to high-stakes testing and to please
explain why they believe a change occurred.
Almost one half of the respondents (42.6%, n=29) chose not to respond to this open-
ended question. Of those who did respond, a total of 12 respondents (17.6%) wrote about
increased pressure or expectations for stakeholders. Of those twelve respondents, seven
participants (10.3%) reported that there are higher expectations for all key stakeholders of
success for all students, three (4.4%) stated there is more pressure on everyone to meet state
standards, and two (2.9%) reported the pressure from parents increased significantly since they
began their career as a school counselor. Fourteen respondents commented on the direct impact
high-stakes testing has on school counselors. Eight (11.8%) of these 14 respondents stated the
responsibilities of the school counselor changed the most due to high-stakes testing, five (7.4%)

109
stated there is less time to complete counseling related activities during testing time, and one
(1.5%) believes testing is now driving the guidance curriculum.
Three of the counselor responses were insightful enough to include a more in depth
discussion in this analysis. One counselor indicated the focus on student achievement is a “top-
down directive”. Changes occur in the district “if the superintendent is not happy with test
results, he initiates ways to improve them.” When changes are needed the counselor believes it is
part of their responsibility to “work closely with the principal to try to help make the changes
happen.” The other two responses given by counselors provided insight from two different sides
of the high-stakes testing spectrum. One counselor perceives high-stakes testing has a positive
impact and the other perceives testing has a negative impact. The counselor who thought high-
stakes testing has a positive impact on some area of school, felt the data collected from the high-
stakes tests helped to improve schools and stated “at the secondary level, having access to more
data provides an opportunity for more review time and more discussion with parents about that
data. The data itself does help me feel more informed about a student’s performance.” From the
negative viewpoint, the counselor thought testing was negatively impacting schools and stated
The increased time on the areas above is due to the state's demands on school districts -
the philosophy that these high-stakes tests are a valid tool for determining if our students
are ready for life after high school. Sadly, our students are just test scores for the state.
Time that could be spent advising students for post-secondary options, planning and
delivering guidance curriculum, and meeting the personal and social needs of our
students is negatively impacted due to the large amount of time devoted to high-stakes
testing.

110
So, this counselor thought testing not only negatively impacts the schools, but also
specifically negatively impacts students and counselors. Based on the answer to the open-ended
question, it appears counselors believe the two biggest changes occurring in the school are
increased pressure and expectations for all stakeholders and changes to their responsibilities as a
school counselor.
5.6 RESEARCH QUESTION 1: CONCLUSION
Results from the study showed several noticeable changes occurred to the counselor’s role. The
most notable change is in the amount of time counselors have available for students, due to
changes in their responsibilities. It appears school counselors have less time available to meet
with students. Almost two-thirds (64.7%) of participants stated the time available to meet with
students decreased since the beginning of their careers, with only one (1.5%) responding the time
available improved during his or her career. Even with less time available to meet with students,
the counselors perceived the focus on student achievement changed for the better. Another factor
to consider is that over one-fifth (22.1%) of respondents said in an open-ended question that
there is more pressure to perform for all stakeholders in the school with the use of high-stakes
testing. The respondents did not indicate whether this pressure was negative (students and
teachers being more anxious and stressed), or positive (an increased focus on academic
performance with all stakeholders giving their best effort to help increase academic
performance).
Seeing a change in the amount of time school counselors have available to meet with
students is not surprising, since the role of the counselor changes based on what administrators
111
think a counselor should do, or on the political forces impacting the school, centered on meeting
the accountability standards established by the federal government with the creation of NCLB in
2001 (American School Counselor Association, 2005). Similar to the results seen in this study,
testing impacted the role the counselor played in the school (Ruff, 2011; & Davis, 2006).
Similar to other research reviewed (Brown et al., 2004; Thorn & Mulvenon, 2002;
Zalaquett, 2005), a large portion (52.9%) of the school counselors act as test coordinators, or
spend time involved in high-stakes testing by proctoring tests or counting tests for distribution
(36.8%). Only seven (10.3%) of the participants stated they have no involvement in any aspect of
the testing process. These results are similar to other researchers who found 75% to 80% of
school counselors had some involvement in the testing process (Thorn & Mulvenon, 2002;
Zalaquett, 2005). In Brown et al.’s (2004) research, they found as many as 82% of school
counselors studied functioned as the test coordinator for their school.
Sixty-four percent of the participants stated they have less time available to meet with
students, spending more time reviewing assessment results, talking to parents about high-stakes
tests, acting as test coordinator, and meeting with administrators to plan for school improvement.
With two-thirds of the respondents stating they have less time to meet with students, it may be
expected that counselors would state they have less time available to conduct classroom, small
group, and/or individual counseling sessions; however, this was not the case. Results from the
survey showed that counselors do not perceive high-stakes testing as impacting the way they
conduct classroom lessons, small group lessons, and individual counseling sessions or the
amount of time available to conduct these activities. Counselors stated they are spending about
the same amount of time in these areas as when they began their career. So, if the counselors
have less time to meet with students, the time lost is not coming from any of the areas explored

112
in this study. With the participants of this study, it may be worth exploring in more detail how
they are spending their time.

113
6.0 RESEARCH QUESTION 2: RESULTS AND DISCUSSION
6.1 RESEARCH QUESTION 2: RESULTS
The following analysis of data represents questions in the survey designed to address research
question two, which is how has school counselors’ perceptions about their work
environment changed since the inception of high-stakes testing?
The major results for research question two include; one third of participants reported
they are under an appropriate amount of pressure when they interact with school administrators
regarding high-stakes tests. Also, a majority of respondents reported the relationship with the
principal (77.9%, n=53), relationship with the teachers (72.1%, n=49), relationship with the
students (85.3%, n=58), relationship with the parents (83.8%, n=57), the number of discipline
referrals during testing time (76.5%, n=52), and student attendance during testing time (66.2%,
n=45) did not change from when they began working as a school counselor to now.
Almost two thirds of the participants (64.7%, n=44) stated when they interact with school
administrators, such as the building principal; they feel an appropriate level of pressure. Seven
respondents (10.3%) feel either highly pressured (2.9%, n=2) or enough pressure to experience a
level of discomfort (7.4%, n=5); conversely, 14 (20.6%) respondents did not feel any pressure
from building level administrators when interacting with school administrators regarding student
improvement. One respondent (1.5%) did not respond. A table of this information is available in

114
Appendix F. Two counselors (2.9%) responded other to the question and provided a written
response to the question. The one school counselor believed the administrators feel the same
amount of pressure as the counselors do. The other stated “I don’t think they feel I can help
improve student performance, I only feel pressured from them to maintain test security.”
Table 18. Cross-tabulation of interactions with school administrators
Interactions with School Administration
Do Not Feel Pressure
Feel an Appropriate
Amount of Pressure
Feel Pressured to Point of
Discomfort Feel Highly Pressured Other
n % n % n % n % n %
Low Education Challenge 7 22.6 20 64.5 3 9.7 0 0.0 1 3.2
High Education Challenge 7 21.2 21 63.6 2 6.1 2 6.1 1 3.0
Made AYP 6 18.8 22 68.8 3 9.4 0 0.0 1 3.1
Did Not Make AYP 5 20.0 16 64.0 2 8.0 1 4.0 1 4.0
Prior to NCLB 6 27.3 13 59.1 1 4.5 1 4.5 1 4.5
After NCLB 8 17.8 31 68.9 4 8.9 1 2.2 1 2.2 Gray scale shading in table denotes the greatest frequency of respondents for a particular category.
A cross-tabulation analysis was conducted for the pressure counselors feel from school
administrators regarding student achievement with the Education-Challenge group, AYP-Status
group, and Years-Working group. All subgroups had the majority of respondents, in the feel an
appropriate amount of pressure category. The low-education-challenge-group (64.5%, n=20)
and the high-education-challenge-group (63.6%, n=21) had nearly the same number of
respondents state the pressure they feel is appropriate. Twenty-two (68.8%) respondents in the
made-AYP-group and 16 in the did-not-make-AYP-group (64.0%) reported they feel an
appropriate amount of pressure. The prior-to-NCLB-group (59/1%) and the after-NCLB-group
(68.9%) also had the majority of respondents state they feel an appropriate amount of pressure
when interacting with school administrators (See Table 18).

115
The next set of survey questions designed to address the second research question asked
the respondents to mark how a list of items has changed (changed for the worse, did not change,
changed for the better) since they started working as a school counselor. Questions asked
counselors to mark how their relationship with the principal, relationship with teachers,
relationship with students, relationship with parents, discipline referrals during testing time, and
student attendance during testing time has changed.
Table 19. Change in work environment
Changed for
the worse Did not change
Changed for the
better
n % n % n %
Relationship with
principals 8 11.8 53 77.9 6 8.8
Relationship with
teachers 12 17.6 49 72.1 6 8.8
Relationship with
students 5 7.4 58 85.3 4 5.9
Relationship with
parents 5 7.4 57 83.8 6 8.8
Discipline referrals
during testing time 14 20.6 52 76.5 2 2.9
Student attendance
during testing time 8 11.8 45 66.2 15 22.1 Gray scale shading in table denotes the greatest frequency of respondents for a particular category.
A frequency distribution analysis was conducted on the various questions with data
presented in table 19. The vast majority for each question had the most respondents answer that
things have not changed for each item since beginning work as a school counselor. Over three
quarters of all participants (77.9%, n=53) and (76.5%, n=52) said their relationship with the

116
building principal and discipline referrals during testing time, respectively did not change. An
even higher percentage (85.3%, n=58) and (83.8%, n=57) said their relationship with students,
and parents, respectively did not change. Forty-nine participants (72.1%) stated their
relationship with teachers did not change, while 45 respondents (66.2%) said student attendance
during testing time did not change.

117
Table 20. Cross-tabulation of work environment: relationships
Relationship with Principal
Changed for the Worse Did Not Change Changed for the Better
n % n % n %
Low Education Challenge 4 12.9 22 71.0 5 16.1
High Education Challenge 4 12.1 28 84.8 1 3.0
Made AYP 3 9.4 27 84.4 2 6.3
Did Not Make AYP 4 16.0 18 72.0 3 12.0
Prior to NCLB 6 27.3 12 54.5 4 18.2
After NCLB 2 4.4 41 91.1 2 4.4
Relationship with Teachers
Low Education Challenge 8 25.8 19 61.3 4 12.9
High Education Challenge 4 12.1 27 81.2 2 6.1
Made AYP 6 18.8 23 71.9 3 9.4
Did Not Make AYP 5 25.0 19 76.0 1 1.8
Prior to NCLB 3 13.6 16 72.7 3 13.6
After NCLB 9 20.0 33 73.3 3 6.7
Relationship with Students
Low Education Challenge 3 9.7 25 80.6 3 9.7
High Education Challenge 2 6.1 30 90.9 1 3.0
Made AYP 2 6.3 29 90.6 1 3.1
Did Not Make AYP 3 12.0 20 80.0 2 8.0
Prior to NCLB 1 4.5 19 86.4 2 9.1
After NCLB 4 8.9 39 86.7 2 4.4
Relationship with Parents
Low Education Challenge 1 3.2 26 83.9 4 12.9
High Education Challenge 4 12.1 28 84.8 1 3.0
Made AYP 1 3.1 29 90.6 2 6.3
Did Not Make AYP 4 16.0 20 80.0 1 4.0
Prior to NCLB 1 4.3 18 78.3 4 17.4
After NCLB 4 8.9 39 86.7 2 4.4 Gray scale shading in table denotes the greatest frequency of respondents for a particular category.

118
Table 20 contains information from the cross-tabulation analysis conducted on the six
items listed in the chart, and discussed previously, separated by Education-Challenge, AYP-
Status, and Years-Working. Few differences existed between the Education-Challenge group, the
AYP-Status group, and the Years-Working group on any of the items listed. Each of the items had
a majority of respondents state their relationship with principals, teachers, students, and parents
did not change. The Low-education-challenge-group had 22 respondents (71.0%); while the
high-education-challenge-group had 28 respondents (84.8%) state their relationship with the
principal did not change. A larger percentage of counselors in the made-AYP-group (84.4%,
n=27) stated the relationship did not change in comparison to the did-not-make-AYP-group
(72.0%, n=18), but this category had the largest number of respondents for both groups.
Similar trends were observed in the other four items reported. Nineteen respondents
(61.3%) in the low-education-challenge-group, 27 respondents (81.2%) in the high-education-
challenge-group, 23 respondents (71.9%) in the made-AYP-group, 19 respondents (76.0%) in the
did-not-make-AYP-group, 16 respondents (72.7%) in the prior-to-NCLB-group, and 33
respondents (73.3%) in the after-NCLB-group stated their relationship with teachers did not
change since they began working as a counselor to now. A majority of respondents in the low-
education-challenge-group (80.6%, n=25), in the high-education-challenge-group (90.9%,
n=30), in the made-AYP-group (90.6%, n=29), in the did-not-make-AYP-group (80.0%, n=20), in
the prior-to-NCLB-group (86.4%, n=19), and in the after-NCLB-group (86.7%, n=39) stated
their relationship with students did not change since they began working as a counselor. Again,
similar trends were seen when responding to the question about the relationship with parents, as
the other questions about relationships with the highest number of respondents stating their
relationship did not change. A large majority of respondents reported the relationship did not

119
change in the low-education-challenge-group (83.9%, n=26), in the high-education-challenge-
group (84.8%, n=28), in the made-AYP-group (90.6%, n=29), in the did-not-make-AYP-group
(80.0%, n=20), in the prior-to-NCLB-group (78.3%, n=18), and in the after-NCLB-group
(86.7%, n=39).
Even though the majority of respondents in the Years-Working group stated their
relationship with their principal did not change, the percentage of respondents varied widely
between the two groups. Slightly more than one half (54.5%, n=12) of the participants in the
prior-to-NCLB-group stated their relationship did not change in comparison to almost every
participant (91.1%, n=41) in the after-NCLB-group. Differences also existed with more than one
quarter (27.3%, n=6) of the prior-to-NCLB-group participants stating their relationship with their
principal changed for the worse compared to only 4.4% of the after-NCLB-group. Although a
majority of the participants in all subgroups stated their relationship with the teachers did not
change, nearly one quarter of the participants stated their relationship with the teachers changed
for the worse in the low-education-challenge-group (25.8%, n=8), the did-not-make-AYP-group
(25.0%, n=5), and the after-NCLB-group (20.0%, n=9).

120
Table 21. Cross-tabulation of work environment: discipline and attendance
Discipline Referrals During High-Stakes Testing
Low Education Challenge 6 19.4 25 80.6 0 0.0
High Education Challenge 6 19.4 25 80.6 2 6.5
Made AYP 6 18.8 25 78.1 1 3.1
Did Not Make AYP 5 20.0 20 80.0 0 0.0
Prior to NCLB 6 26.1 16 69.6 1 4.3
After NCLB 8 17.8 36 80.0 1 2.2
Attendance During High-Stakes Testing
Low Education Challenge 6 19.4 25 80.6 0 0.0
High Education Challenge 6 19.4 25 80.6 2 6.5
Made AYP 6 18.8 25 78.1 1 3.1
Did Not Make AYP 5 20.0 20 80.0 0 0.0
Prior to NCLB 3 13.0 12 52.2 8 34.8
After NCLB 5 11.1 33 73.3 7 15.6 Gray scale shading in table denotes the greatest frequency of respondents for a particular category.
Twenty-five respondents (80.6%) in both the low-education-challenge-group and high-
education-challenge-group, 20 respondents (80.0%) in the did-not-make-AYP-group, 25
respondents (78.1%) in the made-AYP-group, 16 respondents (69.6%) in the prior-to-NCLB-
group, and 36 respondents (80.0%) in the after-NCLB-group stated the number of discipline
referrals did not change since they began working as a counselor to now. Finally, the question
asking about student attendance during high-stakes testing time had the highest number of
respondents state student attendance was about the same regardless of the group: low-education-
challenge-group (80.6%, n=25), high-education-challenge-group (80.6%, n=25), made-AYP-
group (78.1%, n=25), did-not-make-AYP-group (80.0%, n=20), prior-to-NCLB-group (52.2%,
n=12), or after-NCLB-group (73.3%, n=33).
121
6.2 RESEARCH QUESTION 2: DISCUSSION
The survey asked respondents questions specifically looking at the relationships counselors have
with building principals, students, parents, and teachers, as well as student attendance and
discipline referrals during high-stakes testing time. Changes did not occur in any of these areas
during the school counselors’ careers. The results from this study support the findings by Thorn
and Mulvenon (2002), who found little support that suggests the school counselors believe
testing is a negative experience. Results from the current study show that although the school
counselor’s role has changed slightly from responsibilities related to high-stakes testing, such as
working as a test coordinator, which provides less time for interacting with students, most school
counselors studied have not experienced a change in their work environment since the beginning
of their career. Although a limited number of studies exist that explore the impact of high-stakes
testing on the school counselor’s role, several studies explored the impact testing has on teachers.
Many of the previous research results are different than the results in the current study. Sixty
percent of the teachers surveyed stated NCLB negatively impacts the work setting by negatively
impacting teacher morale and taking valuable time away from important classroom issues
(Mertler, 2011). Other studies showed testing negatively affect the relationships of stakeholders
in the school (Brown et al., 2004; Fielding, 2004; Ruff, 2011; Wright, 2002).
The amount of pressure school counselors feel from school administrators was explored.
Almost two-thirds (64.7%) of the participants stated their interactions with school administrators,
such as the building principal, have an appropriate level of pressure. Differences did not exist
between the subgroups in this area. All subgroups studied feel an appropriate amount of pressure
when interacting with administrators. The school counselors also stated there was no change in
their relationship with school administrators with the use of high-stakes testing. Results from the

122
current study support findings from other research that surveyed teachers. Teachers said they
form better relationships with their administrators since the implementation of high-stakes
testing and are working better together to help improve student performance (Horn, J., 2003). It
may be interesting to explore the feelings of teachers and school counselors working in the same
building to see if differences exist in the perceived pressure when teachers and school counselors
have the same building administrators.
School counselors in the current study did not report any changes in their relationship
with students, teachers, or parents. Over three quarters of all respondents stated their relationship
with students (85.3%) and parents (83.8%) did not change since they began working as a school
counselor. More than two-thirds of the school counselors participating in the study did not notice
a change in their relationship with teachers (72.1%), which contradicts Brown et al. (2004) and
Ruff (2011). These researchers found testing negatively impacted the way school counselors
interacted with students and teachers, along with the relationships they had with students and
teachers. Teachers in other studies reported the pressure associated with high-stakes testing is
straining their relationships with students and other staff members (Fielding, 2004; Wright,
2002). Results in this study may show different results from these studies because of the amount
of time that has passed since Brown et al. (2004), Fielding (2004), and Wright (2002). This may
indicate all involved parties are more comfortable with the high-stakes testing process. As time
has passed since these studies were completed the use of high-stakes testing may have become
the new normal for all stakeholders.
Changes in student attendance and discipline referrals during high-stakes testing time did
not change. Over two-thirds (66.2%) of the school counselors stated student attendance during
testing time did not change in comparison to other times of the school year. This may show

123
students are not missing school to avoid having to take the high-stakes exams. In part, this could
stem from the fact that students may realize that even if they miss school on a day a high-stakes
exam is given, they will be required to take the test when they return to school. Over three
quarters (76.5%) of the counselors stated discipline referrals during testing time are similar to
other points during the year, which contradicts previous research that found the effects of testing
led to principals reporting more incidents of students acting out in negative and inappropriate
ways during testing time (Horn, C., 2003). So, even though findings in the current study show
student morale has decreased and students are feeling more stress and test anxiety from the high-
stakes tests in place, the school counselors did not observe students acting out in negative ways
during testing time.
Only a few differences exist in the subgroups for changes in relationships with principals,
teachers, students, or parents, as well as discipline referrals and student attendance. Even though
the majority of respondents in the Years-Working group stated their relationship with their
principal did not change, the percentage of respondents varied widely between the two groups.
Fifty-four percent of the participants in the prior-to-NCLB-group stated their relationship did not
change in comparison to 91.1% of the participants in the after-NCLB-group. Differences also
existed with the percentage stating their relationship changed for the worse with their principal.
One quarter (27.3%) of the prior-to-NCLB-group participants stated their relationship with their
principal changed for the worse compared to only 4.4% of the after-NCLB-group. There may be
many factors that play a part in this difference that are not related to testing. One prominent
factor may be a change in administrators during the prior-to-NCLB-group tenure. All of the
participants in this group have worked for 13 years or more as a school counselor. Most of these
participants are probably working for new/different administrators than when they started

124
working, which may lead to changes occurring in the relationship they have with administrators.
A second factor, which may lead to further exploration may be the role high-stakes testing
played in the change in relationship. Are the counselors or administrators experiencing pressure
from high-stakes testing that has caused a change in the way they interact? Have the dynamics
between the two positions changed because of the new role the school counselors have since the
implementation of high-stakes testing? This difference may be an area that is worth exploring in
more detail in future research.
Based on the results from the survey questions designed to address research question two,
it does not appear high-stakes testing is impacting the work environment for school counselors.
Since differences were not observed in relationships, attendance, or discipline referrals, this may
suggest high-stakes testing has become the new normal for all stakeholders involved in the
school. Teachers, students, administrators, and counselors may realize high-stakes testing is here
to stay, so instead of letting the test negatively impact the school environment they have made
the best of what previous research has shown was a bad situation (Brown, et al., 2004; Fielding,
2004; Horn, C., 2003; Wright, 2002). This may also explain why differences exist between
previous research conducted by Brown et al. (2004), Fielding (2004), Horn, C. (2003), and
Wright (2002) and the current study. At least ten years has passed from the previous research to
this study, during that time, students, administrators, teachers, and school counselors may have
come to accept the role high-stakes testing has in the school. If a level of acceptance exists
among stakeholders, than they should not experience a change in the relationship they have with
each other, there also should not be changes in discipline referrals or student attendance during
high-stakes testing.

125
7.0 RESEARCH QUESTION 3: RESULTS AND DISCUSSION
7.1 RESEARCH QUESTION 3: RESULTS
The following analysis of data represents questions in the survey designed to address research
question three, which states what are school counselor’s perceptions of student psychological
and emotional well-being (i.e. motivation, stress and test-anxiety) in school since the
inception of high-stakes testing?
Question three specifically addressed student motivation, stress, and test anxiety. Some of
the major findings in this section included, one third of respondents reported students are
engaged in the test; however, differences existed between the various groups. The low-
education-challenge-group had almost one quarter more participants state students are engaged
to do their best work. A similar difference existed between the made-AYP-group and the did-not-
make-AYP-group as well; with 21% more respondents in the made-AYP-group answering
students are engaged to do their best work. A difference appears to exist between low-education-
challenge-group and high-education-challenge-group, where twice as many respondents in the
high-education-challenge-group (15.6%, n=10) stated students are indifferent about their results
when they discuss high-stakes test results with their counselor.
School counselors were asked to give their perception on how students feel regarding
high-stakes testing, the majority of counselors perceived students feel testing is either very

126
important or somewhat important. Four respondents in the high-education-challenge-group
reported students feel testing is a complete waste of time in comparison to zero respondents in
the low-education-challenge-group. Approximately one half of the respondents reported student
morale and motivation changed for the worse and testing is either causing enough stress to
impact student performance or cause physical distress.
The frequency distribution results for the question asking counselors about student
engagement during high-stakes testing are reported in a table in Appendix G. Forty-four
respondents (64.8%) out of 68 stated students are either engaged to do their best work or
somewhat engaged during high-stakes testing time. More than 19% (19.1%, n=13) of
respondents reported students are somewhat disengaged, while three respondents (4.4%) reported
students are either totally disengaged and apathetic or disengaged to the point of impacting
performance. Two (2.9%) respondents did not respond. Six of the respondents (8.8%) chose
other for their answer choice and provided a written response to the question. The one counselor
believed a majority of students are fully engaged, but a small minority existed who are totally
disengaged. One counselor shared that “the students I have are high risk and testing is definitely
not a top priority.” Finally, several counselors shared similar feelings, stating that engagement
levels really depend on the student.

127
Table 22. Cross-tabulation of student engagement
Student Engagement with High-Stakes Testing
Engaged to do Their
Best Somewhat Engaged Somewhat Disengaged
Disengaged to the Point
of Impacting
Performance Totally Disengaged Other
n % n % n % n % n % n %
Low Education Challenge 17 54.8 9 29.0 3 9.7 0 0.0 0 0.0 2 6.5
High Education Challenge 4 12.5 12 37.5 10 31.3 2 6.3 1 3.1 3 9.4
Made AYP 17 53.1 5 15.6 5 15.6 1 3.1 1 3.1 3 9.4
Did Not Make AYP 5 20.0 11 44.0 7 28.0 1 4.0 0 0.0 1 4.0
Prior to NCLB 9 40.9 9 40.9 3 13.6 0 0.0 0 0.0 1 4.5
After NCLB 13 29.5 13 29.5 10 22.7 2 4.5 1 2.3 5 11.4
Gray scale shading denotes significant information found within the table.
A cross-tabulation analysis was conducted for student engagement during high-stakes
testing with the Education-Challenge group, AYP-Status group, and Years-Working group (See
Table 21). All subgroups had the highest number of respondents state that students where either
engaged to do their best work or somewhat engaged. The low-education-challenge-group
(54.8%, n=17), the high-education-challenge-group (12.5%, n=4), the made-AYP-group (53.1%,
n=17), the did-not-make-AYP-group (20.0%, n=5), the prior-to-NCLB-group (40.9%, n=9), and
the after-NCLB-group (29.5%, n=13) reported students are engaged to do their best work. The
low-education-challenge-group (29.0%, n=9), the high-education-challenge-group (37.5%,
n=12), the made-AYP-group (15.6%, n=5), the did-not-make-AYP-group (44.0%, n=11), the
prior-to-NCLB-group (40.9%, n=9), and the after-NCLB-group (29.5%, n=13) reported students
are somewhat engaged. Differences existed in the number of respondents who reported students
are engaged to do their best work. The low-education-challenge-group had almost one half more
participants (54.8% compared to 12.5%) state students are engaged to do their best work. A
similar difference existed between the made-AYP-group and the did-not-make-AYP-group as

128
well; with 33.1% more respondents (53.1% compared to 20.0%) state students are engaged to do
their best work in the made-AYP-group.
School counselors were asked to give their perception on how students feel regarding
high-stakes testing, which is reported in a table located in Appendix H. Respondents selected
choices on a five point Likert scale regarding student feelings. Choices included that students
feel high-stakes testing is very important, somewhat important, somewhat unimportant,
considerably unimportant, or a total waste of time. The majority of counselors (58.8%, n=40)
stated students feel testing is either very important (19.1%, n=13) or somewhat important
(39.7%, n=27). Twenty-one respondents (30.9%) reported students feel testing is somewhat
unimportant (13.2%, n=9), considerably unimportant (10.3%, n=7), or a total waste of time
(7.4%, n=5). One (1.5%) participant did not respond to this question. Six counselors (8.8%)
chose other and provided a written response to this question. The one counselor provided the
same response to this question as in the previous question, testing in not a priority for high-risk
students. Several counselors responded similarly as the previous question, stating that it depends
on the student and that some students feel the tests are important but a majority of students do
not. One counselor wrote, with the implementation of the Keystone Exams, with graduation
implications attached, students think the tests are now very important.
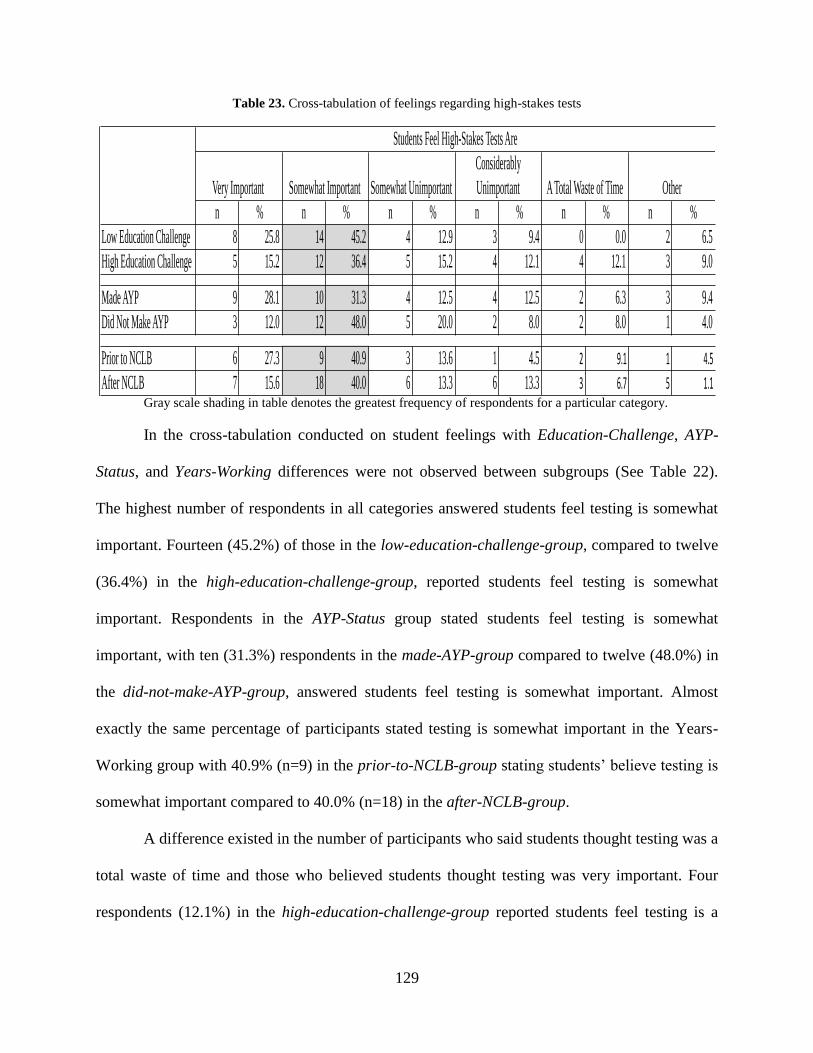
129
Table 23. Cross-tabulation of feelings regarding high-stakes tests
Students Feel High-Stakes Tests Are
Very Important Somewhat Important Somewhat Unimportant
Considerably
Unimportant A Total Waste of Time Other
n % n % n % n % n % n %
Low Education Challenge 8 25.8 14 45.2 4 12.9 3 9.4 0 0.0 2 6.5
High Education Challenge 5 15.2 12 36.4 5 15.2 4 12.1 4 12.1 3 9.0
Made AYP 9 28.1 10 31.3 4 12.5 4 12.5 2 6.3 3 9.4
Did Not Make AYP 3 12.0 12 48.0 5 20.0 2 8.0 2 8.0 1 4.0
Prior to NCLB 6 27.3 9 40.9 3 13.6 1 4.5 2 9.1 1 4.5
After NCLB 7 15.6 18 40.0 6 13.3 6 13.3 3 6.7 5 1.1
Gray scale shading in table denotes the greatest frequency of respondents for a particular category.
In the cross-tabulation conducted on student feelings with Education-Challenge, AYP-
Status, and Years-Working differences were not observed between subgroups (See Table 22).
The highest number of respondents in all categories answered students feel testing is somewhat
important. Fourteen (45.2%) of those in the low-education-challenge-group, compared to twelve
(36.4%) in the high-education-challenge-group, reported students feel testing is somewhat
important. Respondents in the AYP-Status group stated students feel testing is somewhat
important, with ten (31.3%) respondents in the made-AYP-group compared to twelve (48.0%) in
the did-not-make-AYP-group, answered students feel testing is somewhat important. Almost
exactly the same percentage of participants stated testing is somewhat important in the Years-
Working group with 40.9% (n=9) in the prior-to-NCLB-group stating students’ believe testing is
somewhat important compared to 40.0% (n=18) in the after-NCLB-group.
A difference existed in the number of participants who said students thought testing was a
total waste of time and those who believed students thought testing was very important. Four
respondents (12.1%) in the high-education-challenge-group reported students feel testing is a

130
complete waste of time in comparison to zero respondents in the low-education-challenge-group.
Eight (25.8%) of participants in the low-education-challenge-group stated students’ believe
testing is very important compared to five (15.2%) in the high-education-challenge group.
Respondents in the AYP-Status group stated students feel testing is very important, with nine
(28.1%) respondents in the made-AYP-group compared to three (12.0%) in the did-not-make-
AYP-group, answered students feel testing is very important. A difference also existed in the
percentage of participants stating testing is very important in the Years-Working group with
27.3% (n=6) in the prior-to-NCLB-group stating students’ believe testing is very important
compared to 15.6% (n=7) in the after-NCLB-group.
School counselors were then asked to rate the amount of stress students experienced
related to high-stakes testing. Choices for respondents were: no stress, a bit of stress, enough
stress to impact performance, and enough stress to experience physical distress. Information is
located in a table in Appendix I. None of the participants reported students experience no stress
related to high-stakes tests. Just over half of the participants (53.0%, n=36) reported high-stakes
testing is either causing enough stress to impact performance or students are experiencing
physical distress. Thirty-two (47.1%) respondents reported students experience enough stress to
impact performance and four (5.9%) stated testing causes physical distress. The remainder of the
counselors (41.2%, n=28) reported testing causes a bit of stress for students or did not respond
(1.5%, n=1). Three participants chose other and provided a written response. The written
responses for this question were similar to the previous two, with respondents writing the amount
of stress depends on the student and students experience more stress now that Keystone Exams
are used.

131
Table 24. Cross-tabulation of stress of high-stakes tests
High-Stakes Tests Cause
No Stress A Bit of Stress
Enough Stress to
Impact Performance
Enough Stress to Cause
Physical Distress Other
n % n % n % n % n %
Low Education Challenge 0 0.0 11 35.5 16 51.6 2 6.5 2 6.5
High Education Challenge 0 0.0 15 45.5 15 45.5 2 6.1 1 3.0
Made AYP 0 0.0 12 37.5 16 50.0 2 6.3 2 6.3
Did Not Make AYP 0 0.0 10 40.0 12 48.0 2 8.0 1 4.0
Prior to NCLB 11 50.0 11 50.0 0 0.0 0 0.0 0 0.0
After NCLB 17 37.8 21 46.7 4 8.9 3 6.7 0 0.0
Gray scale shading in table denotes the greatest frequency of respondents for a particular category.
The cross-tabulation conducted on student stress levels with Education-Challenge, AYP-
Status, and Years-Working is reported in table 23. The highest number of respondents in three of
the categories (low-education-challenge-group, made-AYP-group, and did-not-make-AYP-group)
reported students experience enough stress to impact performance. Sixteen (51.6%) of those in
the low-education-challenge-group compared to 15 (45.5%) in the high-education-challenge-
group reported testing is stressful enough to impact performance. High-education-challenge-
group also had 15 respondents (45.5%) state testing causes a bit of stress. The highest number of
respondents in the AYP-Status groups stated testing causes enough stress to impact performance.
Sixteen respondents (50.0%) in the made-AYP-group, and twelve respondents (48.0%) in the
did-not-make-AYP-group, stated stress from high-stakes testing impacts student performance.
Those in the Years-Working group had far fewer participants state testing was causing enough
stress to impact performance. The prior-to-NCLB-group had half of the respondents state testing
did not cause students stress (50.0%, n=11) and the other half stated testing cause students a bit

132
of stress (50.0%, n=11). The highest number of respondents in the after-NCLB-group (46.7%,
n=21) stated students felt a bit of stress due to high-stakes testing.
Frequency distribution analysis was conducted for a survey question asking participants
about how concerned students were when they talked with the school counselor regarding high-
stakes test results. The information is presented in a table located in Appendix J. Just over one
half of the participants (55.8%, n=38) answered that students are either substantially concerned
(17.6%, n=12) or mildly concerned (38.2%, n=26) about their results. Only five respondents
(7.4%) answered that students are satisfied with their results. Fifteen respondents (22.1%)
reported that students are indifferent about their results when discussing test results. Eight
participants (11.8%) provided written responses for this question and included similar responses
as the previous questions. Counselors believed stress levels really depend on the student. Other
counselors stated students are too young to care, or too young to understand the results of the
test.
Table 25. Cross-tabulation of student discussions
After Receiving High-Stakes Results Students Are
Substantially
Concerned Mildy Concerned Satisfied Indifferent Other
n % n % n % n % n %
Low Education Challenge 8 25.8 12 38.7 3 9.7 5 16.1 3 9.7
High Education Challenge 3 9.1 13 39.4 2 6.1 10 30.3 5 15.2
Made AYP 5 15.6 12 37.5 4 12.5 6 18.8 5 15.6
Did Not Make AYP 4 16.0 11 44.0 1 4.0 7 28.0 2 8.0
Prior to NCLB 4 18.2 9 40.9 4 18.2 2 9.1 3 13.6
After NCLB 8 18.2 17 38.6 1 2.2 13 28.9 5 11.4
Gray scale shading in table denotes the greatest frequency of respondents for a particular category.

133
Cross-tabulation calculations were similar to the previous questions (See Table 24). The
highest number of respondents in each group reported students are mildly concerned when
discussing results. Twelve respondents in both the low-education-challenge-group (38.7%) and
the made-AYP-group (37.5%) stated students are mildly concerned, while 13 (39.4%)
respondents in high-education-challenge-group and eleven (44.0%) respondents in the did-not-
make-AYP-group reported students are mildly concerned. A similar percentage existed in the
prior-to-NCLB-group (40.9%, n=9) and the after-NCLB-group (38.6%, n=17) as well. Although,
a difference appears to exist between the Education-Challenge groups and the Years-Working
groups, where almost twice as many respondents in the high-education-challenge-group (30.3%,
n=10) answered students are indifferent about their results when discussing high-stakes test
results with their school counselor, in comparison to the low-education-challenge-group (16.1%,
n=5). The respondents in the after-NCLB-group had 28.9% (n=13) respondents state students are
indifferent to about their results compared to only 9.1% (n=2) in the prior-to-NCLB-group.
Table 25 shows the results of the frequency distribution analysis that was conducted on
three different items asking respondents if changes occurred with student morale, student
motivation, and the number of students they counseled during testing time due to stress and test
anxiety.

134
Table 26. Counselor perception of the change in student morale, motivation, and stress and test anxiety
Changed for
the worse Did not change
Changed for the
better Missing Data
n % n % n % n %
Student morale 32 47.1 33 48.5 3 4.4 0 0
Student motivation 24 35.3 39 57.4 5 7.4 0 0
Students counseled
during testing time
due to stress/anxiety 31 45.6 36 52.9 1 1.5 0 0
Gray scale shading in table denotes the greatest frequency of respondents for a particular category.
Nearly all of the participants (95.6%) answered student morale changed for the worse
(47.1%, n=32), or did not change (48.5%, n=33). A similarly high percentage (92.7%) stated
student motivation changed for the worse (35.3%, n=24), or did not change (57.4%, n=39).
Almost every participant (98.5%) indicated the number of students they counseled during testing
time, due to stress and test anxiety changed for the worse (45.6%, n=31), or did not change
(52.9%, n=36).
Cross-tabulation analysis was completed on the three variables described in the previous
paragraph with Education-Challenge, AYP-Status, and Years-Working.

135
Table 27. Morale, motivation, and stress and test anxiety
Student Morale
Changed for the Worse Did Not Change Changed for the Better
n % n % n %
Low Education Challenge 13 41.9 16 51.6 2 6.5
High Education Challenge 16 48.5 16 48.5 1 3.0
Made AYP 16 50.0 15 46.9 1 3.1
Did Not Make AYP 14 56.0 10 40.0 1 4.0
Prior to NCLB 9 39.1 13 56.5 1 4.3
After NCLB 23 51.1 20 44.4 2 4.4
Student Motivation
Low Education Challenge 8 25.8 19 61.3 4 12.9
High Education Challenge 13 39.4 19 57.6 1 3.0
Made AYP 10 31.3 17 53.1 5 15.6
Did Not Make AYP 12 48.0 13 52.0 0 0.0
Prior to NCLB 9 39.1 11 47.8 3 13.0
After NCLB 15 33.3 28 62.2 2 4.4
Students Counseled due to Stress/Test Anxiety
Low Education Challenge 12 38.7 19 61.3 0 0.0
High Education Challenge 16 48.5 16 48.5 1 3.0
Made AYP 16 50.0 16 50.0 0 0.0
Did Not Make AYP 10 40.0 15 60.0 0 0.0
Prior to NCLB 10 43.5 13 56.5 0 0.0
After NCLB 21 46.7 23 51.1 1 2.2 Gray scale shading in table denotes the greatest frequency of respondents for a particular category.
Similar results were seen between groups in all three categories looking at student
morale, motivation, and students counseled due to stress and test anxiety (See table 26). The
most participants in all four groups reported student morale changed for the worse or did not
change. Approximately One half of the participants in the low-education-challenge-group
(51.6%, n=16), high-education-challenge-groups (48.5%, n=16), and prior-to-NCLB-group
(56.5%, n=13) stated student morale did not change. One half of the participants in the made-

136
AYP-group (50.0%, n=16), the did-not-make-AYP-group (56.0%, n=14), and after-NCLB-group
(51.1%, n=23) stated student morale changed for the worse. Nineteen respondents in the low-
education-challenge-group (61.3%) and high-education-challenge-group (57.6%) reported
student motivation did not change with high-stakes testing. Similarly, the highest number of
respondents in the AYP-Status and Years-Working groups reported student motivation did not
change with 17 (53.1%) in the made-AYP-group, 13 (52.0%) in the did-not-make-AYP-group, 11
(47.8%) in the prior-to-NCLB-group, and 28 (62.2%) in the after-NCLB-group. The most
respondents in the low-education-challenge-group (61.3%, n=19), did-not-make-AYP-group
(50.0%, n=15), prior-to-NCLB-group (56.5%, n=13), and after-NCLB-group (51.1%, n=23)
reported the number of students they counsel during testing time, due to stress and test anxiety,
did not change. Sixteen respondents in the high-education-challenge-group (48.5%) and made-
AYP-group (50.0%) indicated counseling time either changed for the worse or did not change.
Appendix K contains information provided from another open-ended question in the
survey. This question asked counselors to provide an explanation of how high-stakes testing
impacted student stress and test anxiety. The answers were coded and different themes emerged
based on the responses given by the school counselors. Many different answers were given for
this open-ended question. Just over one quarter (26.5%, n=18) of the participants did not respond
to this question. Of the respondents who did complete the open-ended question, eleven (16.2%)
responded that students did not experience stress and test anxiety because of high-stakes testing.
Twenty-nine percent of the participants (n=20) stated stress levels increased significantly in all
students (16.2%, n=11) with high-stakes testing or stress levels rose significantly specifically for
high achieving students (13.2%, n=9). The remaining 16.6% (n=12) indicated testing impacts
stress and test anxiety in various ways. Of these twelve respondents, seven (10.3%) thought if the

137
student was not proficient to meet graduation requirements the student experiences higher levels
of stress, one (1.5%) answered students avoid school during testing, two (2.9%) reported teacher
anxiety causes an increase in student test anxiety, and two (2.9%) stated testing is stressful for
low performing students due to repeated testing.
Three counselors provided more detail about the stress and test anxiety students
experienced, and how it impacted students in negative ways. One counselor reported students
dread high-stakes tests and “low performing students often act out because tests are too
difficult.” One respondent wrote testing sent the wrong message to students who “are already
dealing with enough stress in their daily academic and personal lives.” Instead of teaching a
balanced curriculum “high-stakes tests communicate to students that their performance on that
one test is more important than most of their learning, and is just an extra source of stress.”
Another counselor stated students understand the importance of high-stakes tests at a young age,
as early as fourth grade, and they “understand that their performance impacts the programs they
will take in the future” This counselor believed this level of understanding leads to more stress
for students who already deal with a lot of stress and says “I see many more students in my
office suffering from anxiety (on meds, in therapy, etc.) and think it is directly related to testing.”
Appendix L contains information provided from another open-ended question on the
survey. This question asked counselors in what ways (positive and negative) had testing
impacted student motivation. The answers were coded and different themes emerged based on
the responses given by the school counselors. A total of nine different themes emerged from the
responses, with a total of 37 (54.4%) school counselors providing a response that fit into one of
these nine coded themes. Sixteen (23.5%) participants did not respond to this question. Of the
coded responses, 15 (22.1%) respondents stated students are less motivated now than when they

138
began their career, with seven (10.3%) stating that students are tested so frequently they are less
motivated, because it is “just another day, just another test”, another seven (10.3%) reported low
performing students are less motivated, and one (1.5%) reported motivation decreased in all
students. Six (8.8%) respondents reported that motivation levels did not change. The remainder
(23.5%, n=16) stated students are more motivated for one reason or another due to high-stakes
testing. Six (8.8%) respondents reported students are more motivated to show what they know,
maintain a successful school, and do their best. The remaining respondents identified high
achieving students as being more motivated (2.9%, n=2), that students are more engaged in the
material (4.4%, n=3), and more motivated to make sure they passed the test (7.4%, n=5). Two of
the responses stated motivation in students increased, but felt it increased in a negative way, or
because of a negative reason. The one counselor stated “I saw a lot of tears when a higher level
7th grader did not pass the Algebra Keystone exam and had to take Algebra again in 8th grade. I
imagine if that story gets around, students should be motivated to do their best on all high-stakes
testing.” Another counselor wrote students need to make a connection between high-stakes test
results and future success, but they are not and “high-stakes testing has motivated students to do
well, but in the wrong ways. Students now think their entire education matriculation is governed
by a single test.”
7.2 STRESS AND TEST ANXIETY: DISCUSSION
Previous research shows students are experiencing higher levels of stress and test anxiety than
ever before, possibly from the toll of high-stakes testing (Brown et al. 2004; Fleege et al., n.d.;
Frase-Blunt, n.d.; Segool et al., 2013; Zeidner, 1998). Results from the current study support the

139
results of previous research that testing may play a role in observed increases in student stress
and test-anxiety levels. These findings may be significant since previous research shows test
anxiety can impair performance on assessments (Segool et al., 2013). Unfortunately, the highest
percent of participants stated student morale (47.1%) and the number of students counseled
during testing time due to stress and test anxiety (52.9%) changed for the worse since the
beginning of their career.
Participants perceived high-stakes testing to cause some students to experience at least
some levels of stress with 53% stating testing causes enough stress to impact performance
(47.1%) or causes students to experience physical distress (5.9%). The open-ended question
asked counselors to provide an explanation of how high-stakes testing affected student stress and
test anxiety; participants stated stress levels increased significantly in all students with high-
stakes testing. A similar number of respondents stated that both low and high achieving students
experience significant increases in stress and test anxiety, which is different than what Mulvenon
et al. (2005) found in their study, where a greater increase in anxiety occurs in high-performing
students than in low-performing students. In the current study, school counselors observed that
high-stakes testing seems to impact students in a similar fashion regardless of their level of
academic performance.
7.3 MOTIVATION: DISCUSSION
As discussed in other research, motivation is a difficult construct to study because of the many
factors that play a role in determining motivation (Harlen, 2005; Wheelock et al., 2000). The
results of this study appear to be no different. Unlike previously discussed results of the open-

140
ended question asking school counselors about student stress and test anxiety levels the data
from the open-ended question addressing motivation contradicts the closed-ended question
asking about motivation. When specifically asked in a closed-ended question about student
motivation, the school counselors perceived their students’ motivation levels to have changed for
the worse; however, when specifically asked about motivation levels in the open-ended question,
there were more positive responses about how motivation changed in students than negative
responses. The open-ended question matched the results of the other closed-ended questions that
pertained to motivation, but did not specifically ask about student motivation (i.e. student
engagement during testing, feelings about the high-stakes tests, and student concern over test
results). It appears counselors perceive an increase in student motivation levels since the
implementation of high-stakes tests. Based on the different subgroups studied, differences
appeared to exist in changes in student motivation for the questions not specifically asking about
student motivation.
The closed-ended question asking school counselors about motivation, found motivation
levels either changed for the worse (35.3%), or did not change (57.4%) during their career. Over
one-third of the counselors perceived motivation changed for the worse in students from the
beginning of their career. However, when asked to provide a written response to how testing has
impacted motivation, both negatively and positively, more respondents stated positive examples
of how testing impacted student motivation, explanations include students wanting to prove what
they know, do their best, maintain a successful school, or to make sure they pass the test. Several
counselors stated high achieving students are more motivated to perform since the
implementation of testing. These results support the beliefs of some policymakers, who assume
placing rewards and sanctions on tests may increase student motivation levels pertaining to

141
learning, believing students may try harder to gain rewards or avoid sanctions (Gunzenhauser,
2007; Madaus & Clarke, 2001). The school counselors who answered students are less
motivated; feel students are less motivated because of the frequency they are tested. One
counselor even stated, “just another day, just another test.” Of those respondents believing
motivation levels decreased, a majority reported testing negatively impacts low performing
students in particular and felt low performing students are less motivated because of the use of
high-stakes tests.
Several questions in the survey were designed to determine how high-stakes testing
impacts student motivation without specifically asking about motivation. These questions
included questions asking about student engagement, student’s feelings regarding the importance
of high-stakes testing, and the level of concern students have regarding their results. According
to responses two-thirds of students are either engaged to do their best work (32.4%) or somewhat
engaged (32.4%) during high-stakes testing time. These results are similar to Yeh (2005) who
observed an improvement in student attitudes and effort, and found students are more engaged in
the educational process, as well as Ruff (2011), who found counselors believe students are more
focused on learning and school performance because of accountability standards in place. For the
most part, school counselors reported that students are engaged during testing time, several
counselors (8.8%) reported student engagement levels really depended on the student.
School counselors in all four subgroups stated students are either engaged to do their best
work or somewhat engaged; however, differences did exist between the subgroups in the number
of students who were engaged to do their best work. The low-education-challenge-group
(27.0%) and the made-AYP-group (29.8%) had almost one quarter more participants state
students are engaged to do their best work compared to the high-education-challenge-group

142
(6.3%) and the did-not-make-AYP-group (8.8%), respectively. It may be interesting to explore
these differences further. Why did a difference exist in student engagement between these
subgroups? What caused the counselors to rate the students as being more engaged in the low-
education-challenge-group and the made-AYP-group, and did the engagement level play a factor
in determining the results of the high-stakes tests?
When asked about their perceptions on how students viewed the high-stakes tests, school
counselors reported students found high-stakes tests to be either very important (19.1%) or
somewhat important (39.7%). Respondents in all four categories reported students feel testing is
somewhat important. A difference existed in the number of participants who stated students
thought testing is a total waste of time. None of the school counselors identified in the low-
education-challenge-group stated their students thought testing is a complete waste of time,
whereas 6.3% of the school counselors identified in the high-education-challenge-group reported
students feeling testing is a complete waste of time.
Finally, another closed-ended question, designed to explore the impact of student
motivation, was how concerned students were regarding their results on high-stakes testing when
discussing the results with their school counselor. Over one half of the school counselors
reported students are either substantially concerned (17.6%) or mildly concerned (38.2%) about
their results. As was observed in the other questions addressing motivation, a difference appears
to exist between the low-education-challenge-group and high-education-challenge-group; twice
as many respondents in the high-education-challenge-group (15.6%) reported students are
indifferent about their results when discussing results with their counselor compared to 7.8% of
counselors in the low-education-challenge-group. As stated earlier, it may be interesting to
explore this idea further to determine why this difference existed between the two Education-

143
Challenge groups, and if the difference in the high-education-challenge-group was negatively
impacting the results of the high-stakes exams.
The results from these questions show school counselors perceive an increase in student
motivation due to the use of high-stakes exams, based on the level of engagement during testing,
the importance students place on the exams, and the level of concern they experience when
discussing their results. Even though respondents stated motivation changed for the worse when
specifically asked in the closed-ended question, the three other closed-ended questions
addressing motivation, along with the results of the open-ended question, seems to show school
counselors perceive an increase in student motivation due to high-stakes testing. These findings
contradict most of the research reviewed (Amrein & Berliner, 2003; Jones, 2007; Wheelock et
al., 2000) that found external rewards do not translate into better effort, and that intrinsic
motivation decreased in students when rewards or sanctions are attached to the high-stakes test.
If this is the case, it supports the belief held by some policymakers that implementing high-stakes
tests could improve student’s interest in learning and school performance.
7.4 RESEARCH QUESTION 3: CONCLUSION
Research question three addressed the perceived changes in students’ psychological and
emotional well-being in school since the inception of high-stakes testing. It appears school
counselors in this study perceive their students are experiencing higher levels of stress and test
anxiety with the use of high-stakes testing, which is similar to other research, which may show
the emphasis on accountability and high-stakes testing is intensifying the socio-emotional issues
students face (Ruff, 2011). School counselor’s awareness of student motivation, stress, and test

144
anxiety levels is important since school counselors may be capable of improving the
psychological and emotional well-being of students that may help them succeed academically,
which may not be possible if the counselors are unaware of the impact testing has on stress and
test anxiety levels of their students (Thorn & Mulvenon, 2002).

145
8.0 RECOMMENDATIONS, FUTURE RESEARCH, AND CONCLUSION
8.1 RECOMMENDATIONS FOR POLICY MAKERS AND PLANNERS
Although the results from this study show the impact on the school counselor’s role and work
environment have not changed dramatically, it appears that students are experiencing some
negative consequences associated with the use of high-stakes tests, mainly higher levels of stress
and test-anxiety. Moving forward, if considering changes to the current accountability system in
place, policy makers may ask themselves one main question before making changes to the
current system that relies heavily on high-stakes tests. What is the long-term effect of high-stakes
testing on student achievement and student psychological and emotional well-being (Sloane &
Kelly, 2003)? Results from the current study show that students are experiencing higher levels of
stress and test-anxiety, with 47.1% of respondents stating students are experiencing enough
stress to impact test performance. Previous studies show relationships between principals,
teachers, and students changed for the worse, which may impact student achievement negatively
(Horn, J., 2003; Wright, 2002).
Policy makers should understand that early education is about turning kids into life-long
learners not into machines whose sole focus is on test scores; and, those who know students the
best should create the tests that are used (Tyre, 2006). The teachers, school counselors, and
building level principals, who work with these children on a daily basis, should have input into
146
creating what content is tested. Especially since 89.7% of school counselors who participated in
this study have a role in the testing process, their experience may be useful to create new high-
stakes tests. These groups can work with policy makers to create tests that attempt to have
students use higher level thinking skill, and are developmentally appropriate, but still measure
academic performance, so schools are held accountable for what they are teaching their students
without putting undo stress and anxiety on students. Finally, policymakers should not put too
much emphasis on a single test that may create increased levels of stress and test anxiety in
students, but instead realize that the goal of an accountability system should improve the delivery
of curricula to increase student learning and use multiple indicators and assessments to measure
student growth (Ananda and Rabinowitz, 2000).
Researchers suggest the idea of using multiple measures to make any high-stakes
decision, such as graduation, grade promotion, and school funding. Testing may be used as one
of several measures used to judge and measure student, teacher, and school performance and the
effectiveness of instruction (Gunzenhauser, 2006). These multiple measures can include using
results from tests, as well as grades and teacher recommendations, using portfolios or authentic
assessment that include rubrics to ensure consistency (Horn, C., 2003, Langenfield et al., 1997,
Margheim, 2001). The use of multiple measures may decrease the amount of importance placed
on tests, which may help reduce the levels of stress and test anxiety students are experiencing, as
well as the amount of time school counselors spend coordinating such tests.

147
8.2 RECOMMENDATIONS FOR SCHOOL COUNSELORS
In case high-stakes testing continues as the measure used for decision-making in schools, school
counselors may want to use these suggestions to help students, teachers, administrators, and
parents improve the way testing is perceived in the school and possibly how students perform on
the exams. Harlen (2005) gives suggestions for reducing the negative impact of testing on
students. School counselors may use these when working with students. School counselors may
explain the purpose of testing to students, use the tests to show progress in their learning, allow
student involvement in some of the decisions involving testing, and have teachers provide
feedback to the students from the test results to help improve learning. School counselors could
try to focus the results of the tests to individual student gains, instead of student weaknesses
(Gentry, 2006).
Although counselors may have less time available to meet with students because of their
new responsibilities with high-stakes testing, mainly working as test coordinators, these changes
might not necessarily be negative. The counselors may spend their time in different ways that
could potentially benefit students. One way school counselors may help benefit students is by
working with parents to interpret data and explain the intentions of the high-stakes exams (Ruff,
2011). Results from the current study show school counselors spend more time talking with
parents about high-stakes testing now than when they began their career. The school counselors
also spend more time reviewing assessment results with students and meeting with school
administrators to plan for school improvement. These results are similar to previous research
conducted that found high-stakes testing led to a better awareness of student academic concerns
among, which may improve school performance by making parents more aware of their child’s

148
performance and by addressing student weaknesses identified by the high-stakes assessments
(Dollarhide & Lemberger, 2006).
School counselors may get involved in their state and local organizations to advocate for
student and professional school counselor needs and proactively advocate for change. Counselors
can provide professional development activities for their district to define the counselors’ role
and how a counselor can work with teachers and students to help improve the school, by helping
to improve test scores, working with students to improve motivation, and or reduce stress and
test anxiety, and improve the work environment. It may be beneficial for school counselors if
“state and national legislatures need to be educated about school counselors’ roles and the
evidence backing up their effectiveness, leading to (a) more funding to hire school counselors,
and (b) bills drafted to legally define the professional duties of a school counselor” (Monteiro-
Leitner, 2006, p 251).
Differences seen among the subgroups in most areas studied may have significant
consequences since high-stakes testing widens the educational gap between whites and
minorities, and affluent and impoverished (Amrein & Berliner, 2002; Ananda & Rabinowitz,
2000; Faulkner & Cook, 2006). Further exploration may find the differences that exist between
the subgroups may negatively affect student performance and play a role in widening the
educational gap that exists. Using the results of this study, other ACCA members can raise
awareness levels of the differences that exist between the subgroups and try to provide ways to
eliminate these differences by providing professional development during our quarterly
meetings.
By realizing that students experience more stress and test anxiety since the inception of
high-stakes testing, school counselors can work with teachers, students, and parents to more

149
effectively prepare students to cope adaptively with these tests (Segool et al., 2013). School
counselors can create lessons aimed at equipping students with the coping skills needed to handle
the stress and test anxiety appropriately, minimizing the negative effects associated with high-
stakes testing. School counselors should act as a building leader to minimize the negative impact
testing has on building morale by helping students feel in control during testing time, and work
to change the culture surrounding testing.
8.3 FUTURE RESEARCH
Extending this research could be useful. An extended study might include a larger population for
the sample size, instead of just including members of the Allegheny County Counselors
Association; participants could be selected from all of Allegheny County, the entire state, or the
entire country. This would provide a larger sample size, which could generate more
generalizable data to the entire population of school counselors. Similar survey questions could
be presented to teachers and administrators working in Allegheny County to show any alignment
or discrepancy between those two viewpoints and the school counselors’ viewpoint who
participated in this study.
Based on the data collected within, differences exist between the subgroups of
Education-Challenge, AYP-Status, and Years-Working and a deeper exploration into these areas
may be warranted. Since comprehensive counseling programs are shown to improve student
academic performance, future research may want to examine the impact specific counseling
activities have on students (Gysbers, 2004; Sink & Stroh, 2003; Vail, 2005). How much of an
impact did these small group lessons focusing on test preparation skills and academic goals have

150
on helping their students score high enough on the state assessments to have their school make
AYP? Since differences exist in the number of counselors conducting these small group lessons
for the AYP groups, with more counselors engaging in these activities from the made-AYP-group
then the did-not-make-AYP-group, did the school counselors play a role in helping their students
meet the AYP goals established by the state?
Even though the majority of respondents in the Years-Working groups stated their
relationship with their principal did not change, the percentage of respondents varied widely
between the two groups with differences in the percentage of respondents stating their
relationship changed for the worse with their principal. More participants in the prior-to-NCLB-
group stated their relationship with their principal changed for the worse compared to those in
the after-NCLB-group. There may be many factors that play a part in this difference that are not
related to testing. One prominent factor may be a change in administrators during the prior-to-
NCLB-group tenure. All of the participants in this group have worked for 13 years or more as a
school counselor. Most of these participants are probably working for new or different
administrators than when they started working, which may lead to changes occurring in their
relationship with administrators. A second factor, which may lead to further exploration, may be
to consider the role high-stakes testing played in the changed relationship. Are the counselors or
administrators experiencing pressure from high-stakes testing that has caused a change in the
way they interact? Have the dynamics between the two positions changed because of the new
role the school counselors have since the implementation of high-stakes testing?
Another interesting difference to note, that could lead to future research, was seen
between the Education-Challenge groups, with more counselors seeing an increase in time spent
conducting small group lessons focusing on personal and social skills in the low-education-

151
challenge-group compared to no change in time for the high-education-challenge-group. Again,
it would be interesting to examine why this change occurred. If the school counselors in the low-
education-challenge-group conducted need assessments in their school and found students were
in more need for personal and social skill lessons they would provide students with lessons
focusing on this need. This need may stem from the negative impact some research, including
results from the current study, that show students are experiencing higher levels of stress and
test-anxiety, and the counselors are conducting lessons in an attempt to counteract these negative
experiences (Brown et al. 2004; Fleege et al., n.d.; Frase-Blunt, n.d.; Segool et al., 2013; Zeidner,
1998)? If a needs assessment was conducted, and counselors are conducting the lessons in
response to a specific need that has arisen, why is there a difference between the participants in
the low-education-challenge-group and the high-education-challenge-group?
Finally, participants indicated they are spending more time reviewing assessment results.
An exploration into how the school counselors are using these results could be worth exploring.
Since more time is spent reviewing results, hopefully the counselors are able to use the results to
implement programs that are beneficial for students.
Some of the results in the study may indicate two things are occurring. First, some of the
results, such as taking on more responsibilities focused on testing and having less time available
to meet with students may indicate an erosion in the role of the school counselor. It may be
interesting to explore if school counselors believe that an erosion to their role is actually
occurring. The second is the idea that high-stakes testing has become the new normal. It may be
interesting to explore this idea in further detail to see if school counselors believe that high-
stakes testing has been in place for a long enough time frame that stakeholders are accustomed to
the impact high-stakes testing has on the school system. Since it seems that a limited number of

152
studies exist that explore the impact of high-stakes testing on students and school counselors
based on the school counselors perspective, future research in this area could benefit students,
school counselors, and the school system in general.
8.4 CONCLUSION
With the increased emphasis on accountability from the implementation of No Child Left
Behind, and the subsequent increase in the use of high-stakes tests used to hold schools, teachers,
and students accountable, an understanding of the impact of these high-stakes tests on students
and school counselors is necessary (Amrein & Berliner 2003; Ananda & Rabinowitz, 2000;
Gunzenhauser, 2006). This study explored the impact testing has on the psychological and
emotional well-being of students based on the perceptions of Allegheny County Counselors
Association members, as well as their perception on how testing has impacted the role and work
environment of a school counselor. Although the sample is relatively small, and the findings
cannot be generalized, results from this study may provide insight to other researchers,
educators, and policymakers. Results show high-stakes testing has an influence on the school
counselor’s role. It also appears that students are experiencing some negative consequences
associated with the use of these high-stakes tests.
The changes experienced by the school counselors involved in this study may signal an
erosion of the position. The responsibilities that the counselor is accustomed to performing or
trained to complete are evolving. The school counselor has less time to focus on the student, or
focus on the standards established by the ASCA national model and the three domains of
academic, career, and personal/social development. Most counselors are now involved in the

153
testing process, working as the test coordinator; they may also be responsible for interpreting,
distributing, and analyzing high-stakes test data for teachers, students, and parents. Many of
these roles revolve around high-stakes testing and are a direct result of the changes that occurred
in the school system with the establishment of NCLB. If high-stakes testing is here to stay
counselors should be trained and educated on the process and potential impact high-stakes
testing has on students.
At this point, high-stakes testing that was implemented with the establishment of the
NCLB act is now thirteen years old. The school counselors in this study may not have noticed a
change in their role, work environment; student’s motivation, stress, or test anxiety levels
because high-stakes testing has become the new normal. Testing may not have a tremendous
impact on motivation, stress, or test anxiety because all of the students currently in primary or
secondary school have completed their entire schooling under the rules established by the No
Child Left Behind Act. These students do not know what it is like to go to school without having
to take a high-stakes test; they have never been in a building that the teachers, school counselors,
or administrators are not under the pressure associated with trying to meet adequate yearly
progress. The changes that occurred to the school counselor’s role and work environment, and
the stress and test anxiety experienced by students when NCLB was originally implemented,
may be so ingrained at this point, it is now just a normal part of the school. High-stakes testing,
and all of the positive and negative aspects that go along with it, have become common place for
students, school counselors, teachers, parents, and administrators.
The “melt-down” that the 4th
grade student experienced in the vignette shared at the
beginning of this paper may be an experience that less students have and less counselors witness.
Whether this is a good or bad thing remains to be seen. No one wants to see a student experience

154
the stress and test anxiety that this student experienced during that week of testing; however, the
fact that less students are experiencing this level of difficulty with testing may show how
ingrained high-stakes testing has become in our culture. If stakeholders have become numb to
the impact high-stakes testing has on the school system, this may lead to complacency to accept
the negative effects of testing. This may mean stakeholders stop working to improve, or change,
the system. All of this may signal that testing has become the new normal.
Counselors in the study stated they have less time available to spend with students due to
changes to their responsibilities from high-stakes testing, such as acting as the test coordinator or
proctoring high-stakes tests. School counselors believe their work environment has remained the
same since the beginning of their career, even with the increased use of high-stakes tests. The
accountability system in place also seems to have improved student motivation. Unfortunately,
the accountability system currently in place may have negatively impacted the amount of stress
and test anxiety student’s experience, along with negatively impacting student morale. Another
result found in the study, was school counselors are counseling more students due to stress and
test anxiety during testing time than they did at the beginning of their career.
In the current study, participant information was separated into three different subgroups
based on school demographic information provided in the survey. Participants were separated
into a group labeled Education-Challenge based on the percentage of their school’s enrollment in
the National School Lunch Program and the percentage of students identified as a racial or ethnic
minority. The second subgroup participants were separated into was based on the AYP-Status of
the school. The third subgroups separated participants by the number of years they worked as a
school counselor. Interesting differences emerged from the results of the survey when participant
information was separated into the different subgroups.

155
Participants in the low-education-challenge-group had fewer respondents who reported
they: talk to parents regarding testing, work with administrators to plan for school improvement,
and conduct small group lessons focusing on personal and social skills. The low-education-
challenge-group had more participants respond that their students were engaged to do their best
work during testing. Participants in the AYP-Status groups answered survey questions differently
based on their AYP group. More participants in the group that did not make AYP are meeting
with administrators to plan for school improvement. They also state they do not engage in small
group counseling focusing on test preparation skills and academic goals that are not test
preparation based. The made-AYP-group had more participants respond that their students were
engaged to do their best work during testing.
Overall, results for this study were mixed. Counselors stated they have less time to meet
with students now, but have not experienced changes in the amount of time available to conduct
classroom lessons, small group lessons, or individual counseling sessions. The counselors did not
experience a noticeable change in their work environment with the inception of high-stakes
testing. Finally, questions regarding the psychological and emotional well-being of students also
have mixed results. Students seem to have increased levels of motivation and engagement, but
are experiencing more stress and test anxiety now than when the counselors began their career.
The survey asked respondents questions specifically looking at the relationships counselors have
with building principals, students, parents, and teachers, as well as student attendance and
discipline referrals during high-stakes testing time. Changes did not occur in any of these areas
during the school counselors’ careers. The results from this study support the findings by Thorn
and Mulvenon (2002), who found little support that suggests the school counselors believe
testing is a negative experience. Results from the current study show that although the school

156
counselor’s role has changed to include responsibilities related to high-stakes testing, such as
working as a test coordinator, which provides less time for interacting with students, most school
counselors studied have not experienced a change in their work environment since the beginning
of their career. Although a limited number of studies exist that explore the impact of high-stakes
testing on the school counselor’s role, several studies explored the impact testing has on teachers.
Many of the previous research results are different than the results in the current study. Sixty
percent of the teachers surveyed stated NCLB negatively impacts the work setting, by negatively
impacting teacher morale and taking valuable time away from important classroom issues
(Mertler, 2011). Other studies showed testing negatively affect the relationships of stakeholders
in the school (Brown et al., 2004; Fielding, 2004; Ruff, 2011; Wright, 2002).
Results from the study addressing research question one showed several noticeable
changes occurred to the counselor’s role. The most notable change occurred in the amount of
time counselors have available for students, due to changes in their responsibilities. It appears
school counselors have less time available to meet with students. Almost two-thirds (64.7%) of
participants stated the time available to meet with students decreased since the beginning of their
career, with only 1.5% responding the time available improved during his or her career. Even
with less time available to meet with students, the counselors perceived the focus on student
achievement changed for the better. Another factor to consider is that 22.1% of respondents said,
in an open-ended question, that there is more pressure to perform for all stakeholders in the
school with the use of high-stakes testing.
Seeing a change in the amount of time available to meet with students is not surprising,
since the role of the school counselor changes based on what administrators think a counselor
should do, or on the political forces impacting the school, centered on meeting the accountability

157
standards established by the federal government with the creation of NCLB in 2001 (American
School Counselor Association, 2005). Similar to the results seen in this study, testing impacted
the role the counselor played in the school (Ruff, 2011; & Davis, 2006).
Similar to other research reviewed (Brown et al., 2004; Thorn & Mulvenon, 2002;
Zalaquett, 2005), a large portion (52.9%) of the school counselors act as test coordinators, or
spend time involved in high-stakes testing by proctoring tests or counting tests for distribution
(36.8%). Only 10.3% of the participants stated they have no involvement in any aspect of the
testing process. These results are similar to other research that shows 75% to 80% of school
counselors have some involvement in the testing process (Thorn & Mulvenon, 2002; Zalaquett,
2005). In Brown et al. (2004) as many as 82% of school counselors studied functioned as the test
coordinator for their school.
Sixty-four percent of the participants stated they have less time available to meet with
students, spending more time reviewing assessment results, talking to parents about high-stakes
tests, acting as test coordinator, and meeting with administrators to plan for school improvement.
With two-thirds of the respondents believing they have less time available to meet with students,
differences may exist in the amount of time spent on classroom lessons, small group lessons, and
on individual counseling sessions; however, this was not the case for the areas explored. Results
from the survey showed that counselors do not perceive high-stakes testing as impacting the way
they conduct classroom lessons, small group lessons, and individual counseling sessions or the
amount of time available to conduct these activities. In fact, counselors actually stated they spend
less time during a typical week conducting classroom lessons, small group lessons, and
individual counseling sessions focusing on test preparation skills than in the other three areas

158
studied (college and career preparedness, personal and social skills, and academic goals that are
not test preparation based).
Based on the results from the survey questions designed to address research question two,
it does not appear high-stakes testing is impacting the work environment for school counselors.
Since differences were not observed in relationships, attendance, or discipline referrals this may
suggest high-stakes testing has become the new normal for all stakeholders involved in the
school. Teachers, students, administrators, and counselors may realize high-stakes testing is here
to stay, so instead of letting the test negatively impact the school environment they have made
the best of what previous research has shown was a bad situation (Brown, et al., 2004; Fielding,
2004; Horn, C., 2003; Wright, 2002). This may also explain why differences exist between these
researchers and the current study. At least ten years passed from the previous research to this
study, during that time students, administrators, teachers, and school counselors may have come
to accept the role high-stakes testing has in the school. If a level of acceptance exists among
stakeholders, than they should not experience a change in the relationship they have with each
other. There also should not be changes in discipline referrals or student attendance during high-
stakes testing.
The amount of pressure school counselors feel from school administrators was explored.
Almost two-thirds (64.7%) of the participants stated their interactions with school administrators,
such as the building principal, have an appropriate level of pressure. Differences did not exist
between the subgroups in this area. All subgroups studied feel an appropriate amount of pressure
when interacting with administrators. The school counselors also stated there was no change in
their relationship with school administrators with the use of high-stakes testing. Results from the
current study support findings from other research that surveyed teachers. Teachers said they

159
form better relationships with their administrators since the implementation of high-stakes
testing and are working better together to help improve student performance (Horn, J., 2003). It
may be interesting to explore the feelings of teachers and school counselors working in the same
building to see if differences exist in the perceived pressure when teachers and school counselors
have the same building administrators.
School counselors in the current study did not report any changes in their relationship
with students, teachers, or parents. Over three quarters of all respondents stated their relationship
with students (85.3%) and parents (83.8%) did not change since they began working as a school
counselor. More than two-thirds of the school counselors participating in the study did not notice
a change in their relationship with teachers (72.1%), which contradicts Brown et al. (2004) and
Ruff (2011). These researchers found testing negatively impacted the way school counselors
interacted with students and teachers, along with the relationships they had with students and
teachers. Teachers in other studies reported the pressure associated with high-stakes testing is
straining their relationships with students and other staff members (Fielding, 2004; Wright,
2002). Results in this study may show different results from these studies because of the amount
of time that has passed since Brown et al. (2004), Fielding (2004), and Wright (2002).
Only a few differences exist in the subgroups for changes in relationships with principals,
teachers, students, or parents, as well as discipline referrals and student attendance. Even though
the majority of respondents in the Years-Working group stated their relationship with their
principal did not change, the percentage of respondents varied widely between the two groups.
Fifty-four percent of the participants in the prior-to-NCLB-group stated their relationship did not
change in comparison to 91.1% of the participants in the after-NCLB-group. Differences also
existed with the percentage stating their relationship changed for the worse with their principal.

160
One quarter (27.3%) of the prior-to-NCLB-group participants stated their relationship with their
principal changed for the worse compared to only 4.4% of the after-NCLB-group. Many
variables may factor into this difference that are unrelated to testing. One prominent factor may
be a change in administrators during the prior-to-NCLB-group tenure. All of the participants in
this group have worked for 13 years or more as a school counselor. Most of these participants are
probably working for new or different administrators than when they started working, which may
lead to changes occurring in the relationship they have with administrators.
Changes in student attendance and discipline referrals during high-stakes testing time did
not change. Over two-thirds (66.2%) of the school counselors stated student attendance during
testing time did not change in comparison to other times of the school year. This may show
students are not missing school to avoid having to take the high-stakes exams. In part, this could
stem from the fact that students may realize that even if they miss school on a day a high-stakes
exam is given, they will be required to take the test when they return to school. Over three
quarters (76.5%) of the counselors stated discipline referrals during testing time are similar to
other points during the year, which contradicts previous research that found the effects of testing
led to principals reporting more incidents of students acting out in negative and inappropriate
ways during testing time (Horn, C., 2003). So, even though findings in the current study show
student morale has decreased and students are feeling more stress and test anxiety from the high-
stakes tests in place, the school counselors did not observe students acting out in negative ways
during testing time.
Research question three addressed the perceived changes in students’ psychological and
emotional well-being in school since the inception of high-stakes testing. It appears school
counselors in this study perceive their students are experiencing higher levels of stress and test

161
anxiety with the use of high-stakes testing, which is similar to other research, which may show
the emphasis on accountability and high-stakes testing is intensifying the socio-emotional issues
students face (Ruff, 2011). School counselor’s awareness of student motivation, stress, and test
anxiety levels is important since school counselors may be capable of improving the
psychological and emotional well-being of students, helping them succeed academically. This
may not be possible if the counselors are unaware of the impact testing has on stress and test
anxiety levels of their students (Thorn & Mulvenon, 2002).
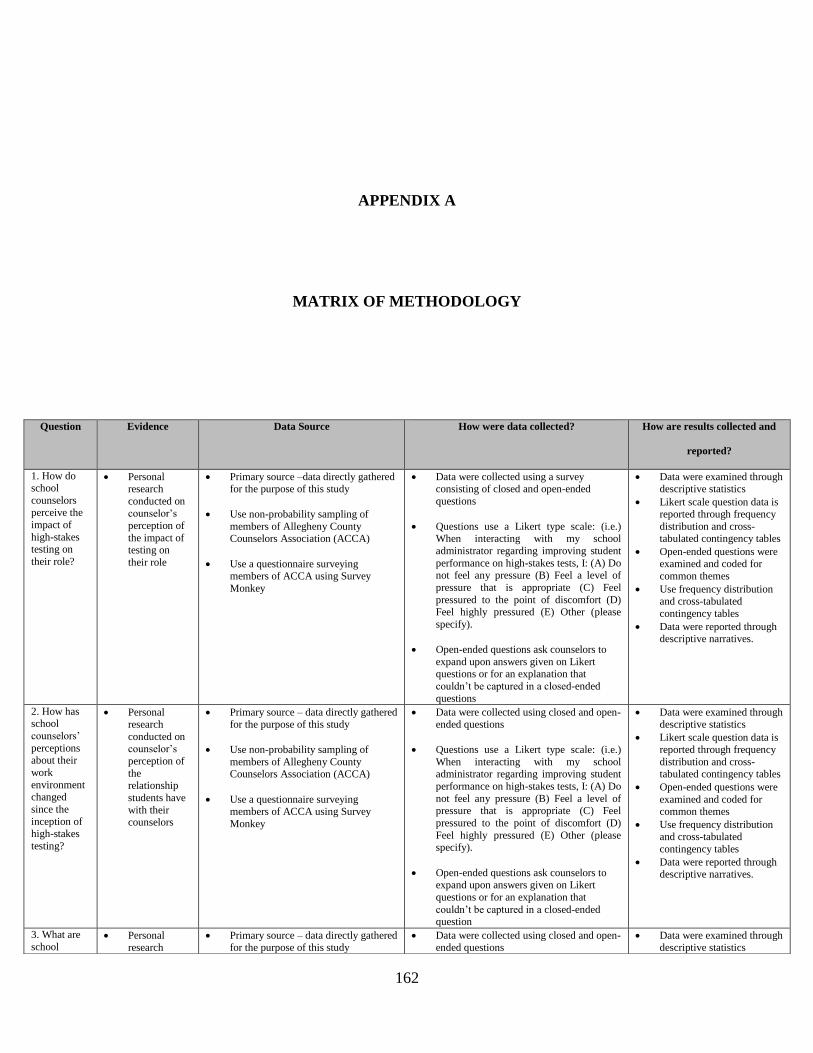
162
APPENDIX A
MATRIX OF METHODOLOGY
Question Evidence Data Source How were data collected? How are results collected and
reported?
1. How do school
counselors
perceive the
impact of
high-stakes testing on
their role?
Personal research
conducted on counselor’s
perception of
the impact of testing on
their role
Primary source –data directly gathered for the purpose of this study
Use non-probability sampling of
members of Allegheny County Counselors Association (ACCA)
Use a questionnaire surveying members of ACCA using Survey
Monkey
Data were collected using a survey consisting of closed and open-ended
questions
Questions use a Likert type scale: (i.e.) When interacting with my school
administrator regarding improving student
performance on high-stakes tests, I: (A) Do not feel any pressure (B) Feel a level of
pressure that is appropriate (C) Feel
pressured to the point of discomfort (D) Feel highly pressured (E) Other (please
specify).
Open-ended questions ask counselors to
expand upon answers given on Likert questions or for an explanation that
couldn’t be captured in a closed-ended
questions
Data were examined through descriptive statistics
Likert scale question data is reported through frequency
distribution and cross-tabulated contingency tables
Open-ended questions were examined and coded for
common themes
Use frequency distribution and cross-tabulated
contingency tables
Data were reported through descriptive narratives.
2. How has school
counselors’
perceptions about their
work
environment changed
since the
inception of high-stakes
testing?
Personal research
conducted on counselor’s
perception of
the relationship
students have
with their counselors
Primary source – data directly gathered for the purpose of this study
Use non-probability sampling of
members of Allegheny County Counselors Association (ACCA)
Use a questionnaire surveying members of ACCA using Survey
Monkey
Data were collected using closed and open-ended questions
Questions use a Likert type scale: (i.e.)
When interacting with my school administrator regarding improving student
performance on high-stakes tests, I: (A) Do
not feel any pressure (B) Feel a level of pressure that is appropriate (C) Feel
pressured to the point of discomfort (D)
Feel highly pressured (E) Other (please specify).
Open-ended questions ask counselors to expand upon answers given on Likert
questions or for an explanation that
couldn’t be captured in a closed-ended question
Data were examined through descriptive statistics
Likert scale question data is reported through frequency
distribution and cross-tabulated contingency tables
Open-ended questions were
examined and coded for common themes
Use frequency distribution and cross-tabulated
contingency tables
Data were reported through descriptive narratives.
3. What are
school Personal
research Primary source – data directly gathered
for the purpose of this study Data were collected using closed and open-
ended questions Data were examined through
descriptive statistics
163
counselors’
perceptions of student
psychologica
l and emotional
well-being
(i.e. motivation,
stress, and
test-anxiety) in school
since the
inception of high-stakes
testing?
conducted on
counselor’s perception of
student
psychological and emotional
well-being
(i.e. motivation,
stress and test
anxiety).
Use non-probability sampling of members of Allegheny County
Counselors Association (ACCA)
Use a questionnaire surveying
members of ACCA using Survey Monkey
Questions use a Likert type scale: (i.e.) When interacting with my school
administrator regarding improving student
performance on high-stakes tests, I: (A) Do not feel any pressure (B) Feel a level of
pressure that is appropriate (C) Feel
pressured to the point of discomfort (D) Feel highly pressured (E) Other (please
specify).
Open-ended questions ask counselors to
expand upon answers given on Likert questions or for an explanation that
couldn’t be captured in a closed-ended
question
Likert scale question data is
reported through frequency distribution and cross-
tabulated contingency tables
Open-ended questions were examined and coded for
common themes
Use frequency distribution
and cross-tabulated contingency tables
Data were reported through
descriptive narratives.

164
APPENDIX B
PARTICIPATION LETTER
Dear Professional School Counselor,
I am currently a doctoral candidate in the School of Education’s Administrative and Policy
Studies program at the University of Pittsburgh. I am conducting research under the supervision
of Professor Dr. Tananis to explore the impact of high-stakes testing on students and the
counselor’s role based on the perceptions of school counselors working in Western
Pennsylvania. Results from the study may help educators and policymakers when making future
decisions regarding high-stakes testing. I would appreciate your participation in the study.
I plan to conduct this research by having participants complete a survey on Survey Monkey.
Your involvement in this survey is entirely voluntary and there are no known or anticipated risks
to participation in this study. If you agree to participate, the survey should take no longer than
twenty minutes. You may decline answering any questions you feel you do not wish to answer.
All information you provide will be considered confidential and will be grouped with responses
from other participants. Further, you will not be identified by name in any thesis, report, or
publication resulting from this study.
I would like to assure you that the Institutional Review Board of the University of Pittsburgh has
reviewed this study. However, the final decision about participating is yours. If, after reading
this, you have any questions about this study, would like additional information to assist you in
reaching a decision about participation, or have questions after participation, please feel free to
contact any of the members of the research team listed below.
The survey is located at https://www.surveymonkey.com/s/YKQH8HK.
Thank you in advance for your interest in this project.

165
APPENDIX C
MATRIX OF SURVEY QUESTIONS
Construct Measured Total Number of
Questions for
Construct
Researchers Question
Number(s)
Demographic
Information
8 Hamilton, Stecher, Marsh,
McCombs, et al., (2007)
1, 2, 3, 4, 5, 6, 7,
8
Motivation 7 Brown, Galassi and Akos
(2004); Fitzgerald (2008);
Jones and Egley (2004);
Mertler (2011); Pintrich and
DeGroot (1990); Sabol
(2010); Sundre (2000); Tuan,
Chin, and Shieh (2005)
10, 11, 15 (open-
ended), 58, 61,
62, 64 (open-
ended)
Stress and
Test Anxiety
7 Brown, et al., (2004);
Hoffman, Assaf, and Paris
(2001); Jones (2007); Mertler
(2011); Thorn and Mulvenon
(2002); Zeidner (1998)
12, 13, 14 (open-
ended), 58, 60,
63, 64 (open-
ended)
Counselor’s Role 24 Fitzgerald (2008); Hamilton
et al., (2007); Mertler (2011);
Sabol (2010)
5, 9, 16-27, 28
(open-ended), 29-
52, 57, 59, 64
(open-ended)
Work Environment 9 Hamilton et al., (2007);
Mertler (2011)
53, 54, 55, 56, 60,
61, 63, 64 (open-
ended), 65 (open-
ended)

166
APPENDIX D
SURVEY
IMPACT OF HIGH-STAKES TESTING SURVEY
MEANING OF HIGH-STAKES TESTING FOR THE PURPOSE OF THIS SURVEY: A test is
considered high-stakes when results are used as criteria to determine important factors impacting
students, staff, schools and school districts. Factors affecting individual students may include
high school graduation, promotion to the next grade level, entrance into college, placement into
gifted programs and scholarship opportunities.
SECTION I: General Information
What grade(s) are you responsible for? (mark all that apply)
P
K
1
1
2
2
3
3
4
4
4
5
6
6
7
7
8
8
9
9
1
10
1
11
1
12
1
12+
Please indicate the number of years you have worked in education in your current district as a:
School Counselor
Teacher
Other
Please indicate the number of years you have worked in education in a different district as a:
School Counselor
Teacher
Other
Approximately how many students are assigned to you? ________________________________
Does your school have a dedicated test coordinator for PSSA/Keystone exams? Yes No
How would you describe your role in the testing process in your school(s)? _________________

167
Approximately what percent of students in your school(s) are considered ethnic or racial
minorities? If you work in more than one school that have different percentages choose all that
apply. (A) 0-10% (B) 11-20% (C) 21-30% (D) 31-40% (E) 41-50% (F) 51-60% (G) 61-70% (H) 71-80% (I)
81-90% (J) 91-100%
Approximately what percent of students are enrolled in the National School Lunch Program in
your school(s)? If you work in more than one school that have different percentages choose all
that apply. (A) 0-10% (B) 11-20% (C) 21-30% (D) 31-40% (E) 41-50% (F) 51-60% (G) 61-70% (H) 71-80% (I)
81-90% (J) 91-100%
What was your school’s AYP status for the 2012-2013 school year? (A) Made AYP (B) Making Progress (C) Warning (D) School Improvement I or II (E) Corrective
Action I or II
SECTION II: Counselor’s Role and Psychological and Emotional Impact
The use of psychological and emotional well-being in this study refers to student motivation,
stress and test anxiety. Stress is defined as a person’s physical and/or emotional response to a
stimulus in the environment (Burchfield, 1979; Hobfoll, 1989). Test anxiety is defined as an
emotion, or the cognitive and behavioral reactions of fear, apprehension, and nervousness to the
outcomes of a test (Zeidner, 1998). Motivation is defined as the forces “that lead to the initiation,
direction, intensity and persistence of behavior” (Vallerand & Losier, 1999, p. 428).
For the following questions please indicate your level of agreement for each statement by
choosing one option.
When interacting with my school administrator regarding improving student performance on
high-stakes tests, I:
(A) Do not feel any pressure (B) Feel a level of pressure
that is appropriate
(C) Feel pressured to the point of discomfort (D) Feel highly
pressured
Other (please specify) ___________________________________________________
I would describe student engagement with high-stakes testing as:

168
(A) Engaged to do their best (B) Somewhat engaged (C) Somewhat
disengaged
(D) Disengaged to the point of negatively impacting performance (E) Totally
disengaged and apathetic
Other (please specify)_____________________________________________
In general, students feel high-stakes tests are: (A) Very important (B) Somewhat important (C) Somewhat unimportant
(D) Considerably unimportant (E) A total waste of time
Other (please specify)_____________________________________________
I believe high-stakes tests cause my students: (A) No stress (B) A bit of stress (C) Enough stress to impact performance (D) Enough stress to
experience physical distress
Other (please specify)_____________________________________________
Of the students who approach me after receiving their high-stakes test results, the majority are: (A) Substantially concerned about their results (B) Mildly concerned about their results
(C) Satisfied with their results (D) Indifferent about their results
Other (please specify)_____________________________________________
Please provide an explanation of how you feel high-stakes testing has impacted student stress
and test anxiety.
_____________________________________________________________________________
In what ways (positive or negative) has testing impacted student motivation?
______________________________________________________________________________
On average, how much time do you spend on the following counseling activities during a typical
week?
I don’t
engage in
this activity
1 hour or less 1 to 5 hours 6-20 hours 21 hours or more
Reviewing student
assessment results
Talking with parents
about high-stakes tests
Meeting with
administrators to plan
for school
improvement
Acting as test
coordinator/proctor
(testing students,
boxing tests, placing
stickers on tests,
preparing exam

169
schedules)
Offering assistance
outside of school
hours for students who
are not proficient on
the state tests
Revising the
counseling curriculum
due to high-stakes
testing
For each of these items please indicate whether the amount of time has changed from when you
began working as a counselor to now.
I don’t engage in
this activity
Less time now About the same
amount of time
More time now
Reviewing student
assessment results
Talking with parents
about high-stakes tests
Meeting with
administrators to plan
for school
improvement
Acting as test
coordinator/proctor
(testing students,
boxing tests, placing
stickers on tests,
preparing exam
schedules)
Offering assistance
outside of school
hours for students who
are not proficient on
the state tests
Revising the
counseling curriculum
due to high-stakes
testing
During a typical week, if you have experienced a change in any of the areas listed above, why do
you think a change has occurred?
______________________________________________________________________________

170
On average, how much time do you spend on the following CLASSROOM guidance activities
during a typical week?
I don’t
engage in
this activity
1 hour or less 1 to 5 hours 6-20 hours 21 hours or more
Classroom Lessons
involving Test
Preparation Skills
Classroom Lessons
involving College and
Career Readiness
Goals
Classroom Lessons
involving
Personal/Social Skills
Classroom Lessons
involving Academic
Goals that are not Test
Preparation Based
For each of these items please indicate whether the amount of time has changed from when you
began working as a counselor to now.
I don’t engage in
this activity
Less time now About the same
amount of time
More time now
Classroom Lessons
involving Test
Preparation Skills
Classroom Lessons
involving College and
Career Readiness
Goals
Classroom Lessons
involving
Personal/Social Skills
Classroom Lessons
involving Academic
Goals that are not Test
Preparation Based
On average, how much time do you spend on the following SMALL-GROUP counseling
activities during a typical week?
I don’t
engage in
this activity
1 hour or less 1 to 5 hours 6-20 hours 21 hours or more
Small group Lessons
involving Test

171
Preparation Skills
Small group Lessons
involving College and
Career Readiness
Goals
Small group Lessons
involving
Personal/Social Skills
Small group Lessons
involving Academic
Goals that are not Test
Preparation Based
For each of these items please indicate whether the amount of time has changed from when you
began working as a counselor to now.
I don’t engage in
this activity
Less time now About the same
amount of time
More time now
Small group Lessons
involving Test
Preparation Skills
Small group Lessons
involving College and
Career Readiness
Goals
Small group Lessons
involving
Personal/Social Skills
Small group Lessons
involving Academic
Goals that are not Test
Preparation Based
On average, how much time do you spend on the following INDIVIDUAL counseling activities
during a typical week?
I don’t
engage in
this activity
1 hour or less 1 to 5 hours 6-20 hours 21 hours or more
Individual counseling
involving Test
Preparation Skills
Individual counseling
involving College and
Career Readiness
Goals
Individual counseling
involving

172
Personal/Social Skills
Individual counseling
involving Academic
Goals that are not Test
Preparation Based
For each of these items please indicate whether the amount of time has changed from when you
began working as a counselor to now.
I don’t engage in
this activity
Less time now About the same
amount of time
More time now
Individual counseling
involving Test
Preparation Skills
Individual counseling
involving College and
Career Readiness
Goals
Individual counseling
involving
Personal/Social Skills
Individual counseling
involving Academic
Goals that are not Test
Preparation Based
Please indicate how, if at all, the following have changed since the inception of high-stakes
testing.
Changed for
the worse
Did not
change
Changed for
the better
My relationship with principals
My relationship with teachers
My relationship with students
My relationship with parents
Focus on student achievement
Student morale
The time available to meet with students
Discipline referrals during high-stakes testing time
Student attendance during high-stakes testing time
Student motivation
The number of students seen during high-stakes testing
time due to stress and/or anxiety
Consider the areas indicated above, if you indicated that any of these have changed, please
choose the area that you feel has changed the MOST (whether positively or negatively) and
provide some examples of how you see these changes occurring in your school.
______________________________________________________________________________

173
What aspects of high-stakes testing in your school do you think might encourage more
POSITIVE changes in any of the areas indicated above?
______________________________________________________________________________
Is there anything you would like to add regarding high-stakes testing that was not covered in this
survey?
______________________________________________________________________________

174
APPENDIX E
Table 27. Change in counselor’s role directly involving students
Changed for
the worse
Did not
change
Changed for
the better Missing Data
n % n % n % n %
Focus on student
achievement 12 17.6 36 52.9 20 29.4 0 0
Time available to
meet with students 44 64.7 23 33.8 1 1.5 0 0

175
APPENDIX F
Table 28. Interacting with school administrators regarding student improvement
n Percentage
Do not feel any pressure 14 20.6
Feel an appropriate level of pressure 44 64.7
Feel pressured to the point of discomfort 5 7.4
Feel Highly Pressured 2 2.9
Other 2 2.9
Did not respond 1 1.5

176
APPENDIX G
Table 29. Student engagement during high-stakes testing
n Percentage
Engaged to do their best 22 32.4
Somewhat engaged 22 32.4
Somewhat disengaged 13 19.1
Disengaged to the point of impacting performance 2 2.9
Totally disengaged and apathetic 1 1.5
Other 6 8.8
Did not respond 2 2.9

177
APPENDIX H
Table 30. Students’ feelings regarding high-stakes tests
n Percentage
Very important 13 19.1
Somewhat important 27 39.7
Somewhat unimportant 9 13.2
Considerably unimportant 7 10.3
A total waste of time 5 7.4
Other 6 8.8
Did not respond 1 1.5

178
APPENDIX I
Table 31. Stress related to high-stakes tests
n Percentage
No stress 0 0
A bit of stress 28 41.2
Enough stress to impact performance 32 47.1
Enough stress to experience physical distress 4 5.9
Other 3 4.4
Did not respond 1 1.5

179
APPENDIX J
Table 32. Student discussions with counselors regarding high-stakes test results
n Percentage
Substantially concerned about their results 12 17.6
Mildly concerned about their results 26 38.2
Satisfied with their results 5 7.4
Indifferent about their results 15 22.1
Other 8 11.8
Did not respond 2 16.2
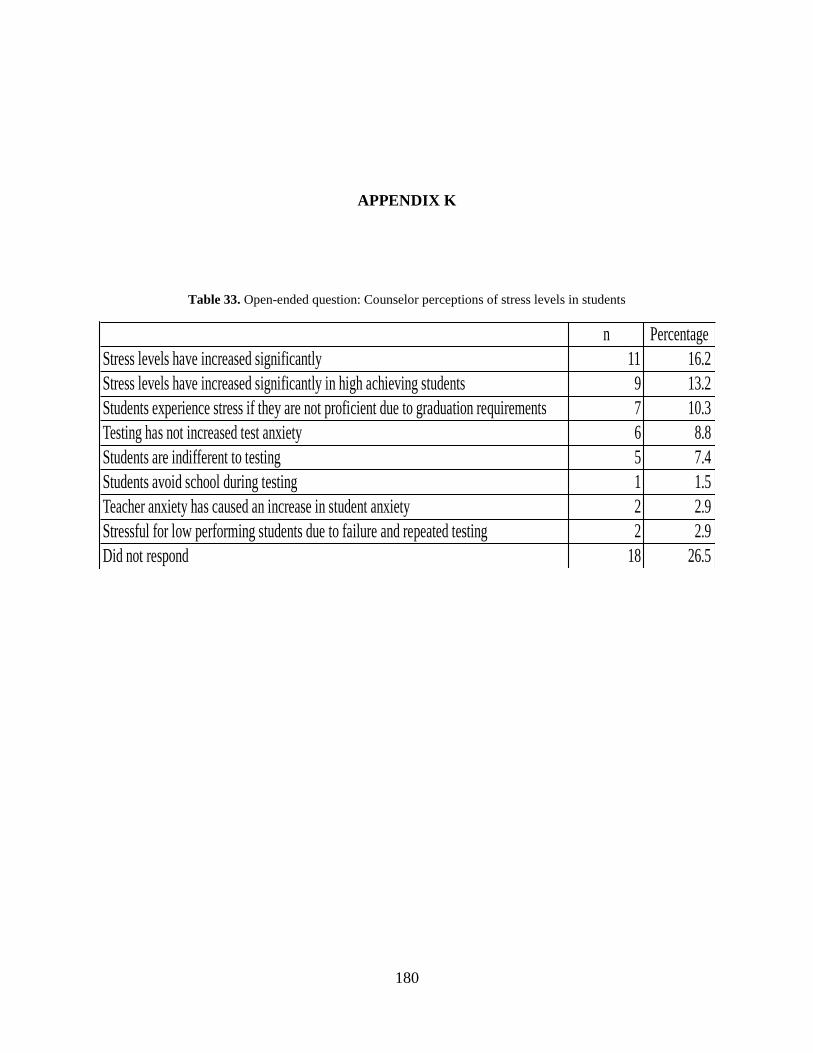
180
APPENDIX K
Table 33. Open-ended question: Counselor perceptions of stress levels in students
n Percentage
Stress levels have increased significantly 11 16.2
Stress levels have increased significantly in high achieving students 9 13.2
Students experience stress if they are not proficient due to graduation requirements 7 10.3
Testing has not increased test anxiety 6 8.8
Students are indifferent to testing 5 7.4
Students avoid school during testing 1 1.5
Teacher anxiety has caused an increase in student anxiety 2 2.9
Stressful for low performing students due to failure and repeated testing 2 2.9
Did not respond 18 26.5

181
APPENDIX L
Table 34. Open-ended question: Counselor perceptions of motivation
n Percentage
Testing has no impact on motivation 6 8.8
High achieving students are more motivated 2 2.9
Students are more engaged in the material 3 4.4
More motivated to make sure they pass the test 4 5.9
Students are more motivated to: show what they know, maintain a successful school,
do their best 6 8.8
Tested so frequently they lose motivation, "just another day, just another test" 7 10.3
Low performing students are less motivated 7 10.3
Motivation in all students has declined 1 1.5
Not motivated to learn, just motivated to pass 1 1.5
Did not respond 16 23.5

182
APPENDIX M
Table 35. Open-ended question: Areas of the most change
n Percentage
More students experiencing stress and test anxiety 4 5.9
Testing time makes it harder to counsel students if there is an issue 15 22.1
Student attendance improves during testing time 2 2.9
Student achievement is easier to monitor 2 2.9
Personal relationships and building morale have declined 7 10.3
Focus on student achievement is negatively impacting the school environment 2 2.9
Focus on student achievement is positively impacting student knowledge 1 1.5
Teachers are reluctant to allow students to leave their classroom to receive
counseling services 2 2.9
Teacher are more stressed 2 2.9
Did not respond 22 32.4

183
APPENDIX N
Table 36. Open-ended question: High-stakes testing encouraging positive changes
n Percentage
More information to students about how it can impact their future 2 2.9
Curriculum changes to promote testing skills 1 1.5
Progress and improvement are just as important as scores 1 1.5
Give teachers and administrators more input in testing 1 1.5
Eliminate the importance tests carry 2 2.9
Student motivation has increased 6 8.8
Focus on student achievement and strengthening the curriculum 6 8.8
Attendance and student effort has increased 4 5.9
Did not respond 35 51.5

184
BIBLIOGRAPHY
Amatea, E. S. & Clark, M. A. (2005). Changing schools, changing counselors: A qualitative
study of school administrators’ conceptions of the school counselor role. Professional
School Counseling, 9 (1), 16-27.
American School Counselor Association (2005). The ASCA National Model Workbook.
Alexandria, VA. Author.
American Psychological Association (2001). Appropriate use of high-stakes testing in our
nation’s schools. Retrieved February 2, 2009, from
http://www.apa.org/pbinfo/testing.html
Amrein, A. L. & Berliner, D. C. (2002). An analysis of some unintended and negative
consequences of high-stakes testing. Great Lakes Center for Education Research and
Practice. Retrieved June 26, 2012 from
http://www.greatlakescenter.org/high_stakes_testing.php
Amrein, A. L. & Berliner D. C. (2003). The effects of high-stakes testing on student motivation
and learning. Educational Leadership February 2003.
Ananda, S., & Rabinowitz, S. N. (2000). Policy brief: The high stakes of high-stakes testing
[Electronic Version]. WestEd, Retrieved February 7, 2009, from
http://www.wested.org/cs/we/view/rs/181
Borders, L. D. (2002). School counseling in the 21st century: Personal and professional
reflections on the four focus articles. Professional School Counseling, 5, 180-185.
Bracey, G. W. (2001). The 11th
Bracey report on the condition of public education. Phi Delta
Kappa International, 83 (2), 157-169. Retrieved April 12, 2013 from
http://www.jstor/org/stable/20440084
Braun, H. (2004). Reconsidering the impact of high-stakes testing. Education Policy Analysis
Archives, 12 (1), 1-37. Retrieved March 2, 2010, from http://epaa.asu.edu/epaa/v12n1
Brigman, G., & Campbell, C. (2003). Helping students improve academic achievement and
school success behavior. ASCA, 7 (2), 91- 98

185
Brown, C. P. (2010). Children of reform: The impact of high-stakes education reform on
preservice teachers. Journal of Teacher Education. Retrieved June 26, 2012, from
http://jte.sagepub.com/content/61/5/1477.
Brown, D., Galassi, J., & Akos, P. (2004). School counselors’ perceptions of the impact of high-
stakes testing. American School Counselor Association, 8 (1), 31-39. Retrieved
December 21, 2009, from http://www.highbeam.com/doc/1G1-123579431.html
Brown v. Board of Education, 347 U.S. 483 (1954).
Burchfield, S. R. (1979). The stress response: A new perspective. Psychosomatic Medicine, 41
(8), 661-672.
Causey-Bush, T. (2005). Keep your eye on Texas and California: A look at testing, school
reform, No Child Left Behind, and implications for students of color. The Journal of
Negro Education, 74 (4), 332-343. Retrieved April 12, 2013 from
http://www.eric.ed.gov/ERICWebPortal/search/detailmini.jsp?_nfpb=true&_&ERICExtS
earch_SearchValue_0=EJ764596&ERICExtSearch_SearchType_0=no&accno=EJ76459
6
Coltrane, B. (2002). English language learners and high-stakes tests: An overview of the issues.
ERIC Clearinghouse on Languages and Linguistics. Retrieved March 8, 2010 from
http://sremote.pitt.edu/websites/eric.ed.gov/ERIC_digests/,Danainfo+permanent.access.g
p
Darling-Hammond, L. (1991). The implications of testing policy for quality and equality. The
Phi Delta Kappan, 73 (3), 220-225. Retrieved September 4, 2012, from
http://www.jstor.org/stable/20404599.
Davis, T. E. (2006). Looking forward by going back: A school counselor educator’s return to
school counseling. Professional School Counseling, 10 (2), 217-223.
Debra P. v. Turlington, 644 F.2d 397 (5th
Cir. 1981).
Dollarhide, C. T. & Lemberger, M. E. (2006). “No Child Left Behind”: Implications for school
counselors. American School Counselor Association, 9 (4), 295-304. Retrieved December
21, 2009, from
http://findarticles.com/p/articles/mi_m0KOC/is_4_9/ai_n16131295/?tag=content;col1
Downes-Le Guin, T., Baker, R., Mechling, J., Ruyle, E. (2012). Myths and realities of
respondent engagement in online surveys. International Journal of Market Research 54
(5), 613-634.
Elementary and Secondary Education Act of 1965, Pub. L. No. 89–10, 79 Stat. 27, 20
U.S.C. § .70 (1965).

186
Evans, J. R. & Mathur, A. (2005). The value of online surveys. Internet Research, 15 (2). 195-
219. Retrieved November 29, 2013 from www.emeraldinsight.com/1066-2243.htm
Fairchild, A. J., Horst, S. J., Finney, S. J., & Barron, K. E. (2005). Evaluating new and existing
validity evidence for the academic motivation scale. Contemporary Educational
Psychology, 30 (3), 331-358. Retrieved March 20, 2013 from
http://www.eric.ed.gov/ERICWebPortal/search/detailmini.jsp?_nfpb=true&_&ERICExtS
earch_SearchValue_0=EJ697810&ERICExtSearch_SearchType_0=no&accno=EJ69781
0
Faulkner, S. A., & Cook, C. M. (2006). Testing vs. teaching: The perceived impact of assessment
demands on middle grades instructional practices. Research in Middle Level Education
Online, 29 (7), 1-13. Retrieved February 10, 2009, from
http://www.nmsa.org/Publications/RMLEOnline/Articles/Vol29No7/tabid/731/Default.as
px
Fielding, C. (2004). Low performance on high-stakes test drives special education referrals: A
Texas survey. The Educational Forum, 68, 126-132.
Fitzgerald, J. (2008). No Child Left Behind: The teachers’ voice, a survey of teacher attitudes
toward NCLB. Retrieved September 4, 2013 from
http://www.mn2020.org/assets/uploads/article/nclb.pdf
Fleege, P. O., Charlesworth, R., Burts, D. C., & Hart, C. H. (1993). Stress begins in
kindergarten: A look at behavior during standardized testing. Journal of Research in
Childhood Education, 7 (1), 20-26. Retrieved July 10, 2012, from
http://www.tandfonline.com/doi/pdf/10.1080/02568549209594836
Flores, B. B., & Clark, E. R. (2003). Texas voices speak out about high-stakes testing: Preservice
teachers, teachers, and students. Current Issues in Education [Online], 6(3). Retrieved
February 26, 2010 from http://cie.ed.asu.edu/volume6/number3/
Frase-Blunt, M. (n.d.). High stakes testing a mixed blessing for special students. Retrieved
February 7, 2009, from
http://www.cec.sped.org/am/template.cfm?section=home&template=/cm/contentdisplay.c
fm&contentid=4533
Gentry, M. (2006). No Child Left Behind: Gifted children and school counselors. Professional
School Counseling, 10 (1), 73-81.
Goals 2000: Educate America Act of 1994, Pub. L. No. 103-227 (1994).
Greene, J. P., Winters, M. A., & Forster, G. (2003). Testing high stakes tests: Can we believe the
results of accountability Tests? Civic Report, 33, 1-28.
Guilfoyle, C. (2006). NCLB: Is there life beyond testing? Educational Leadership, 64
(3), 8-13.

187
Gunzenhauser, M. (2003). High-stakes testing and the default philosophy of education. Theory
Into Practice, 42 (1), 51-58. Retrieved January 30, 2013 from
http://www.tandf.co.uk/journals/titles/00405841.asp
Gunzenhauser, M. (2006). Normalizing the educated subject: A Foucaultian analysis of high-
stakes accountability. Educational Studies, 39 (3), 241-259. Retrieved January 30, 2013
from
http://web.ebscohost.com.pitt.idm.oclc.org/ehost/pdfviewer/pdfviewer?sid=fee5cadf-
b82a-4ffb-a4a2-8461e46649b3%40sessionmgr10&vid=2&hid=27
Gunzenhauser, M. (2007). What is the value of public school accountability? Educational
Theory, 57 (4), 489-507. Retrieved January 30, 2013 from
http://onlinelibrary.wiley.com.pitt.idm.oclc.org/doi/10.1111/j.1741-
5446.2007.00270.x/pdf
Gysbers, N. C. (2001). School guidance and counseling in the 21st century: Remember the past
into the future. Professional School Counseling, 5 (2). Retrieved November 27, 2012
from http://career.missouri.edu/career-
educator/research/NormGysbersArticles/school%20guidance%20and%20counseling%20i
n%20the%2021st%20century
Gysbers, N. C. (2004). Comprehensive guidance and counseling programs: The evolution of
accountability. American School Counselor Association, 8 (1).
Gysbers, N. C. & Henderson, P. (2001). Comprehensive guidance and counseling programs: A
rich history and a bright future. Professional School Counseling, 4 (4), 246-256.
Hamilton, L. S., Stecher, B. M., Marsh, J. A., McCombs, J. S., Robyn, A., Russell, J. L., Naftel,
S., Barney, H. (2007). Standards-based accountability under No Child Left Behind:
Experiences of teachers and administrators in three states. Retrieved September 4, 2013
from http://www.rand.org/content/dam/rand/pubs/monographs/2007/RAND_MG589.pdf
Harlen, W. (2005). Teachers’ summative practices and assessment for learning – tensions and
synergies. The Curriculum Journal, 16 (2), 207-223.
Herman, A., Altmann, H. & Spears, B. (1971). Superintendents’ perception of the role of
counselor. Counseiller Canadien, 5 (4), 267-271.
Hobfoll, S. E. (1989). Conservation of resources: A new attempt at conceptualizing stress.
American Psychologist, 44(3), 513-524.
Hoffman, J. V., Assaf, L. C., & Paris, S. G. (2001). High-stakes testing in reading: Today in
Texas, tomorrow? The Reading Teacher, 54 (5), 482-492. Retrieved April 9, 2012, from
www.jstor.org/stable/20204940
188
Horn, C. (2003). High-stakes testing and students: Stopping or perpetuating a cycle of failure?
Theory into Practice, 42 (1), 30-41.
Horn, J. (2003). LEAP-ing toward accountability? Ideology, practice, and the voices of
Louisiana educators. The Qualitative Report, 8 (2), 224-250. Retrieved December 23,
2009, from http://www.nova.edu/ssss/QR/QR8-2/horn.pdf
Howard, T. C. (2003). “A tug of war for our minds:” African American high school students’
perceptions of their academic identities and college aspirations. The High School Journal,
87 (1), 4-17.
Hsieh, H-F, and Shannon, S. E., (2005). Three approaches to qualitative content analysis.
Qualitative Health Research 15 (9) 1277-1288. Retrieved April 15, 2014 from
http://qhr.sagepub.com/content/15/9/1277
Isaacs, M. (2003). Data-driven decision making: The engine of accountability. ASCA:
Professional School Counseling, 6 (4) 288-295.
Jacob, B. A. (2001). Getting tough? The impact of high school graduation exams. Educational
Evaluation and Policy Analysis, 23 (2), 99-121.
Jones, B. D. (2007). The unintended outcomes of high-stakes testing. Journal of Applied School
Psychology, 23 (2), 65-86.
Jones, B. D. & Egley, R. J. (2004). Voices from the frontlines: Teachers’ perceptions of high-
stakes testing. Education Policy Analysis Archives, 12. Retrieved November 12, 2012
from http://epaa.asu.edu/ojs/article/view/194
Katsiyannis, A., Zhang, D., Ryan, J. B., & Jones, J. (2007). High-stakes testing and students with
disabilities: Challenges and promises. Journal of Disability Policy Studies. Retrieved
September 4, 2012, from http://dps.sagepub.com/content/18/3/160.2
Kelley, K., Clark, B., Brown, V., & Setzia, J. (2003). Good practice in the conduct and reporting
of survey research. International Journal for Quality in Health Care, 15 (3), 261-266.
Retrieved September 30, 2013, from http://www.ncbi.nlm.nih.gov/pubmed/12803354
Krosnick, J. A. (1999) Survey research. Annual Review Psychology, 50, 537-567. Retrieved
November 27, 2013 from www.annualreviews.org.
Langenfield, K., Thurlow, M., & Scott, D. (1997). High stakes testing for students: unanswered
questions and implications for students with disabilities (Synthesis Report No. 26).
Minneapolis, MN: University of Minnesota, National Center on Educational Outcomes.
Retrieved April 3, 2009, from http://cehd.umn.edu/nceo/onlinepubs/synthesis26.htm

189
Lawrence, J. (n.d.). Florida’s race-based academic goals bring controversy. Retrieved November
12, 2012 from http://www.educationnews.org/education-policy-and-politics/floridas-race-
based-academic-goals-bring-controversy/
Lederman, J. (2012, December 11). US students far from first in math, science. Associated Press.
Retrieved December 12, 2012 from http://cnsnews.com/news/article/us-students-far-first-
math-science.
Linn, R. L. (2000). Assessments and accountability. Educational Researcher, 29 (2), 4-16.
Retrieved April 12, 2013 from http:///www.jstor.org/stable/1177052.
Mabry, L., Poole, J., Redmond, L., & Schultz, A. (2003). Local impact of state testing in
southwest Washington. Education Policy Analysis Archives, 11(21). Retrieved March 10,
2011 from http://epaa.asu.edu/epaa/v11n22/.
Madaus, G. F. & Clark, M. (2001). The adverse impact of high stakes testing on minority
students: Evidence from 100 years of test data. In G. Orfield and M. Kornhaber (Eds.),
Raising standards or raising barriers? Inequality and high stakes testing in public
education. New York: The Century Foundation.
Maehr, M. L. & Archer, J. (1985). Motivation and school achievement. In L. G. Katz (Ed.),
Current Topics in Early Childhood Education. Norwood, NJ: Ablex Publishing
Corporation.
Malpass, J. R., O’Neil, H. F. & Hocevar, D. (1996). Self-Regulation, Goal Orientation, Self-
Efficacy, and Math Achievement. Paper presented at the annual meeting of the American
Educational Research Association.
Margheim, D, E. (2001). Teacher beliefs about the outcomes of high-stakes testing and
measurement-driven instruction in Virginia’s public schools. Retrieved December 23,
2009, from http://scholar.lib.vt.edu/theses/aVailable/etd-12052001-
211701/unrestricted/MargheimChap1.pdf
Mathison, S., & Freeman, M. (2003). Constraining elementary teachers’ work: Dilemmas and
paradoxes created by state mandated testing. Education Policy Analysis Archives, 11
(34). Retrieved January 9, 2014 from
http://www.google.com/url?sa=t&rct=j&q=&esrc=s&source=web&cd=2&ved=0CDYQF
jAB&url=http%3A%2F%2Fepaa.asu.edu%2Fojs%2Farticle%2Fdownload%2F262%2F3
88&ei=f8gpU4GzPPGgyQHbxoDIBg&usg=AFQjCNF0Sxojphryzyw2zk1y80XHk4g3og
&sig2=KLsUZLjRWUsKwIwnhthWdw&bvm=bv.62922401,d.aWc
McGannon, W., Carey, J. & Dimmitt, C. (n.d.). The current status of school counseling outcome
research. What Works in School Counseling. Retrieved March 10, 2011 from
http://www.spu.edu/orgs/schoolcounseling/OutcomeStudyMonograph.pdf

190
McGuinn, P. (2006). No Child Left Behind and the Transformation of Federal Education Policy,
1965-2005. Lawrence: University Press of Kansas.
McNeil, L. M. (2000). Creating new inequalities: Contradictions of reform. Phi Delta Kappan 81
(10), 728-734. Retrieved April 12, 2013 from
http://www.eric.ed.gov/ERICWebPortal/search/detailmini.jsp?ERICExtSearch_SearchVa
lue_0=EJ607953&ERICExtSearch_SearchType_0=no&accno=EJ607953
McNeil, L. M. (2000). Sameness bureaucracy, and the myth of the educational equity: The
TAAS system of testing in Texas public schools. Hispanic Journal of Behavioral
Sciences, 22, 508-523. Retrieved April 12, 2013 from
http://hjb.sagepub.com/content/22/4/508
McNeil, L. M., Coppola, E., Radigan, J., & Vasquez-Heilig, J. (2008). Avoidable losses: High-
stakes accountability and the dropout crisis. Education Policy Analysis Archives, 16 (3).
Retrieved March 10, 2011 from http://epaa.asu.edu/epaa/v16n3/.
Mertler, C. (2011). Teachers’ perceptions of the influence of No Child Left Behind on classroom
practices. Current Issues in Education, 13 (3). Retrieved September 4, 2013, from
http://cieasu.edu
Monteiro-Leitner, J., Assner-Self, K. K., Milde, C., Leitner, D. W., & Skelton, D. (2006). The
role of the rural school counselor: Counselor, counselor-in-training, and principal
perceptions. Professional School Counseling, 9 (3), 248-251.
Mulvenon, S. W., Stegman, C. E., Ritter, G. (2005). Test anxiety: A multifaceted study on the
perceptions of teachers, principals, counselors, students, and parents. International
Journal of Testing, 5 (1), 37-61.
National Commission on Excellence in Education (1983). A nation at risk: The imperative for
educational reform. U.S. Government Printing Office, Washington, DC.
National Defense Education Act of 1958, Pub. L. No. 85-864, 72 Stat. 1580 (1958).
Nichols, S. L. (2007). High-stakes testing. Journal of Applied School Psychology, 23 (2), 47-64.
Retrieved March 12, 2009 from http://dx.doi.org/10.1300/j370v23n02_04
Nichols, S. L., & Berliner, D. C. (2005). The inevitable corruption of indicators and educators
through high-stakes testing. Tempe, AZ: Arizona State University, Education Policy
Research Unit. Retrieved March 12, 2009 from http://edpolicylab.org
No Child Left Behind Act of 2001, Pub. L. No. 107-110 (2002).
O’Neill, P. T. (2001). Special education and high stakes testing for high school graduation: An
analysis of current law and policy. Journal of Law and Education. Retrieved July 31,
2012 from http://heinonline.org

191
Paisley, P. O. & McMahon, H. G. (2001). School counseling for the twenty-first century:
Challenges and opportunities. Professional School Counseling, 5, 106-115.
Parsons, F. (1909). Choosing a vocation. Boston: Houghton Mifflin
Paulson, S. E. & Marchant, G. J. (2009). Background variables, levels or aggregation,
and standardized test scores. Education Policy Analysis Archives, 17(22). Retrieved
March 20, 2011 from http://epaa/asu.edu/epaa/v17n22/.
Paulson, S. E. & Marchant, G. J. (2009). Background variables, levels of aggregation, and
standardized test scores. Education Policy Analysis Archives, 17. Retrieved January 9,
2014 from http://epaa.asu.edu/ojs/article/view/389
Perkins & Wellman (2008). The impact of high-stakes testing: Recommendations for
professional school counselors and other support personnel. Academic Leadership.
Retrieved December 21, 2009, from
http://www.academicleadership.org/empirical_research/505_printer.shtml
Pintrich, R. R., & DeGroot, E. V. (1990). Motivational and self-regulated learning components
of classroom academic performance, Journal of Educational Psychology, 82, 33-40.
Ravitch, D. (2010). The death and life of the great American school system: How testing and
choice are undermining education. Basic Books, New York.
Rea, L. M. & Parker, R. A. (2005). Designing and conducting survey research: A comprehensive
guide. San Francisco, CA: Jossey-Bass.
Ruff, R. R. (2011). School counselor and school psychologist perceptions of accountability
policy: Lessons from Virginia. The Qualitative Report, 16 (5), 1270-1286. Retrieved
December 11, 2012, from
http://www.eric.ed.gov/ERICWebPortal/search/detailmini.jsp?_nfpb=true&_&ERICExtS
earch_SearchValue_0=EJ941703&ERICExtSearch_SearchType_0=no&accno=EJ94170
3
Sabens, F. S., Zyromski, B. (2009). Aligning school counselors, comprehensive school
counseling programs, and the No Child Left Behind Act of 2001. Journal of School
Counseling, 7 (31). Retrieved January 9, 2014 from http://eric.ed.gov/?id=EJ886145
Sabol F. R. (2010). No Child Left Behind: A study of its impact on art education programs.
Retrieved September 4, 2013 from
http://www.arteducators.org/research/NCLB_Proj_Report_2-10.pdf
Sax, L. J., Gilmartin, S. K., Bryant, A. N. (2003). Assessing response rates and nonresponse bias
in web and paper surveys. Research in Higher Education, 44 (4). Retrieved November
27, 2013 from http://link.springer.com/article/10.1023/A%3A1024232915870#page-1.

192
Segool, N. K., Carlson, J. S., Goforth, A. N., Von Der Embse, N., Barterian, J. A. (2013).
Heightened test anxiety among young children: Elementary school students’ anxious
responses to high-stakes testing. Psychology in the Schools, 50 (5), 489-499. Retrieved
November 29, 2013 from http://onlinelibrary.wiley.com/doi/10.1002/pits.21689/abstract
Shear, M. D. (2011). Obama calls for remaking of no child left behind. New York Times.
Retrieved 3/20/11 from http://thecaucus.blogs.nytimes.com/2011/03/14/obama-calls-for-
remaking-of-no-child-left-behind/?ref=nochildleftbehindact
Sheehan, K. B. (2001). E-mail survey response rates: A review. Journal of Computer-Mediated
Communication, 6. Retrieved November 29, 2013 from
http:onlinelibrary.wiley.com/doi/10.1111/j.1083-6101.2001.tb00117.x/full
Simon, S. (2012). Jeb Bush, with cash and clout, pushes contentious school reforms. Retrieved
November 27, 2012 from http://news.yahoo.com/jeb-bush-cash-cloout-pushes-
contentious-school-reforms-061817377--finance.html
Sink, C. A. & MacDonald, G. (1998). The status of comprehensive guidance and counseling in
the United States. Professional School Counseling. 2 (2), 88-94.
Sink, C. A & Stroh, H. R. (2003). Raising achievement test scores of early elementary school
students through comprehensive school counseling programs. ASCA, 6 (5), 350-364.
Sirotnik, K. A. (2002). Promoting responsible accountability in schools and education. Phi Delta
Kappan, 94 (8), 662-673.
Sloane, F. C. & Kelly, A. E. (2003). Issues in high-stakes testing programs. Theory Into Practice,
42 (1), 12-17.
Stecher, B. M. (2002). Consequences of large-scale, high-stakes testing on school and classroom
practice. In L.S. Hamilton, B.M. Stecher, & S.P. Klein (Eds.), Making sense of test-based
accountability in education (pp. 79-100). Santa Monica, CA: Rand Distribution Services.
Studer, J. R. & Allton, J. A. (1996). The professional school counselor: Supporting and
understanding the role of the guidance program. NASSP Bulletin. Retrieved September
25, 2012 from http://bul.sagepub.com/content/80/581/53
Suchak, B. (n.d.). Standardized testing: High-stakes for students and for corporate bottom lines.
Retrieved February 5, 2009, from http://www.nomoretests.com/insider.htm
Sundre, D. L. (2000). Motivation scale background and scoring guide. Retrieved March, 20,
2013, from
http://www.jmu.edu/assessment/resources/resource_files/sos_scoring_guide.pdf
http://news.yahoo.com/jeb-bush-cash-cloout-pushes-contentious-school-reforms-061817377--finance.html

193
Thorn, A. R. & Mulvenon, S. W. (2002). High-stakes testing: An examination of elementary
counselors’ views and their academic preparation to meet this challenge. Measurement
and Evaluation in Counseling and Development, 35, 195-206.
Togut, T. D. (n.d.). High-stakes testing: Educational barometer for success, or false
prognosticator for failure. Retrieved April 3, 2009, from
http://www.harborhouselaw.com/articles/highstakes.Togut.pdf
Tuan, H. L., Chin, C. C. & Sheih, S. H. (2005). The development of a questionnaire to measure
students’ motivation towards science learning. International Journal of Science
Education, 27 (6), 639-654.
Tyre, P. (2006, September 10). The new first grade: Too much too soon? Newsweek, 148 (11),
34.
Urbina, I. (2010, January 11). As school exit tests prove tough, states ease standards. The New
York Times. Retrieved January 25, 2010 from
http://www.nytimes.com/2010/01/12/education/12exit.html?pagewanted=all&_r=0
United States Department of Education: Office for Civil Rights. (2000). The use of tests as part
of high-stakes decision-making for students: A resource guide for educators and policy-
makers. Washington, DC: Berkowitz, D., Wokowitz, B., Fitch, R., & Kopriva, R.
Retrieved March 7, 2009, from
http://www.ed.gov/offices/OCR/archives/pdf/TestingResource.pdf
Vail, K. (2005). What do counselors do? American School Board Journal, (August), 24-27
Vallerand, R. J., & Losier, G. F. (1999). An integrative analysis of intrinsic and extrinsic
motivaiton in sport. Journal of Applied Sport Psychology, 11, 142-169. Retrieved March
20, 1023 from
http://www.selfdeterminationtheory.org/SDT/documents/1999_VallerandLosier_JASpP.p
df
Valli, L., Buese, D. (2007). The changing roles of teachers in an era of high-stakes
accountability. American Educational Research Journal, 44, 3, 519-558.
Walen, H. (1977). The Role of The Guidance Counselor. NASSP Bulletin, 89-95.
Westchester Institute for Human Services Research (2003). High-stakes testing. The Balanced
View, 7 (1), 1-4.
Wheeler, J. M. (2005). Anxiety levels of school age students prior to and following high-stakes
testing. Dissertation. Marshall University Graduate College. August 10, 2005
194
Wheelock, A., Bebell, D.J., & Haney, W. (2000). What can student drawings tell us about high-
stakes testing in Massachusetts? Teachers College Record, November 2, 2000 Retrieved
February 26, 2010 from http://www.tcrecord.org
Wright, W. E. (2002). The effects of high stakes testing in an inner-city elementary school: The
curriculum, the teachers, and the English language learners. Current Issues in Education
[Online], 5 (5). Retrieved March 8, 2010 from http://cie.ed.asu.edu/volume5/number5
Yeh, S. S. (2005) Limiting the unintended consequences of high-stakes testing. Education Policy
Analysis Archives, 13 (43). Retrieved March 10, 2011 from
http://epaa.asu.edu/epaa/v13n43/.
Zalaquett, C. P. (2005). Principals’ perceptions of elementary school counselors’ role and
functions. ASCA: Professional School Counseling, 8 (5).
Zeidner, M. (1998). Test anxiety: The state of the art. Kluwer Academic Publishers, Hingham,
MA