Uncertainty about Uncertainty: Optimal Adaptive Algorithms ...
Upload
nguyenkhanhCategory
view
221download
1
Schedule Uncertainty Analysis Using
Historical Data
Kelley Cyr
Independent Programmatic Assessment Office (IPAO)
Presented to the NASA Cost Symposium
August 2014

7/8/2014 2
Outline
• Background/Purpose
• Methodology
• Data Analysis
• Simulation Models
• Results
• Conclusions
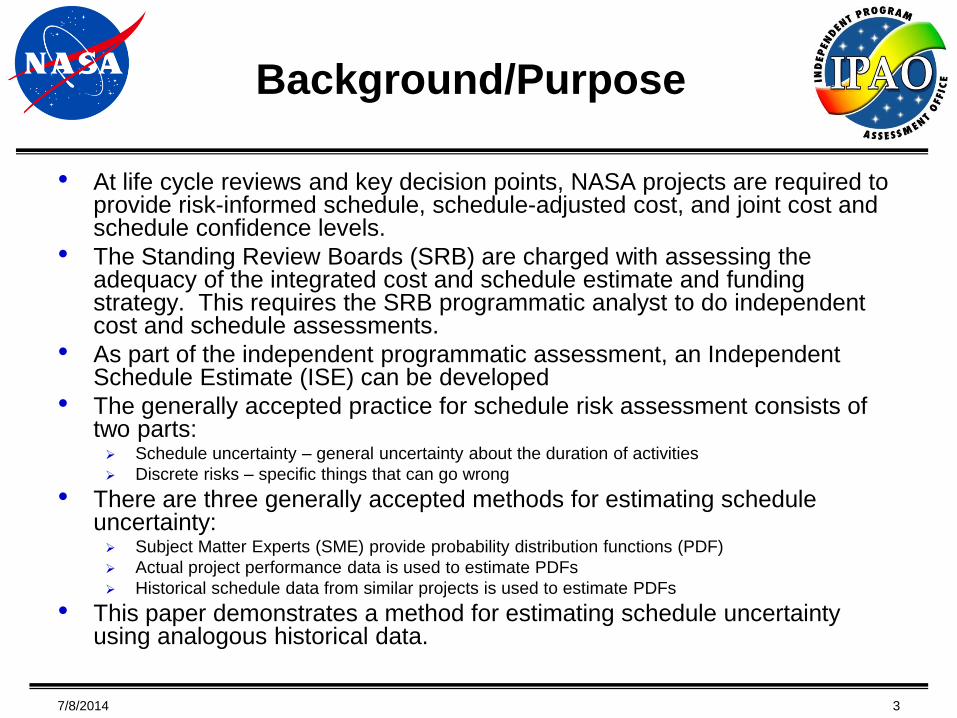
Background/Purpose
• At life cycle reviews and key decision points, NASA projects are required to provide risk-informed schedule, schedule-adjusted cost, and joint cost and schedule confidence levels.
• The Standing Review Boards (SRB) are charged with assessing the adequacy of the integrated cost and schedule estimate and funding strategy. This requires the SRB programmatic analyst to do independent cost and schedule assessments.
• As part of the independent programmatic assessment, an Independent Schedule Estimate (ISE) can be developed
• The generally accepted practice for schedule risk assessment consists of two parts: Schedule uncertainty – general uncertainty about the duration of activities
Discrete risks – specific things that can go wrong
• There are three generally accepted methods for estimating schedule uncertainty: Subject Matter Experts (SME) provide probability distribution functions (PDF)
Actual project performance data is used to estimate PDFs
Historical schedule data from similar projects is used to estimate PDFs
• This paper demonstrates a method for estimating schedule uncertainty using analogous historical data.
7/8/2014 3

Methodology
• Collect top-level schedule data on major milestones for spacecraft projects
• Filter the data for analogous missions
• Calculate the duration between major milestones
• Fit PDF curves to the duration data
• Calculate the correlation between phases
• Build level 1 and level 2 simulation models Level 1 = duration from PDR to Launch
Level 2 = sum of durations: PDR to CDR, CDR to I&T, I&T to Launch
• Run the simulation models and produce schedule s-curves
7/8/2014 4

DATA ANALYSIS
7/8/2014 5

Data Source
• The source of data for this study is the“Master List Project Schedule Milestones July 15, 2013” Excel fileThis file is maintained by the Cost Analysis Division (CAD) at NASA HQ. This file contains schedule data for major milestones for over 290 NASA projects. Milestones collected are: ATP, SRR, PDR, CR, CDR, I&T Start, PER, PSR, Launch, EoM, EoeM Only missions that have launched or plan to launch soon are included in the database. There are no cancelled projects in the data. For various reasons, many projects do not have a complete set of milestone dates.
•
•
•
•
•
7/8/2014 6
Project ATP SRR PDR CR CDR I&T Start PER PSR Launch
ACE 10/1/1993 11/1/1992 11/1/1993 9/1/1993 10/1/1994 4/24/1996 1/7/1997 6/10/1997 8/25/1997ACRIMSAT 3/16/1996 12/1/1997 2/1/1998 12/21/1999
ACTS 8/1/1984 7/15/1985 5/15/1986 5/15/1988 6/1/1991 4/1/1992 6/1/1992 9/1/1993AE-C 10/1/1971 2/1/1972 8/1/1972 12/13/1973
AEM-HCMM 12/1/1974 4/26/1978AIM 5/22/2003 1/28/2004 4/28/2004 10/27/2004 10/27/2004 4/6/2006 2/26/2007 4/25/2007
AMPTE 2/1/1982 11/1/1982 8/16/1984Apollo CSM 7/1/1962 1/6/1965 2/6/1965 10/11/1968Apollo LEM 1/1/1963 9/1/1963 1/1/1966 3/3/1969Aqua (PM-1) 8/1/1993 4/30/1997 6/19/1998 7/1/1998 2/16/2000 2/5/2002 5/4/2002
Aquarius 8/12/2004 5/28/20059/1/2008 9/28/2005SDR:10/30 7/21/2008 6/1/2009 6/26/2010 3/2/2011 6/9/2011
ARES I (Constellation) 12/19/2006 Delta PDR /07 cancelled cancelled cancelled cancelled 6/15/2014Aspera-3 Instrument on Mars Express 9/5/2000 5/1/2000 6/2/2003Astro-1 Shuttle Mission 12/2/1990
Astro-2 Shuttle Mission 3/2/1995ASTRO-E Failed Mission 7/10/2005
Astro-E2 / SUZAKU 07/2001 09/2001 3/2002 4/12/2002 7/9/2005Astro-H 6/20/2008 12/15/20083/10-11/2010 11/16/2011 N/A 10/14/2012 4/1/2014 8/15/2015?
ATS-1 2/1964 12/7/1966Technology Satellite) 4/1967 4/6/1967
ATS-3 11/5/1967ATS-4 8/10/1967
(Applications Technology Sa 8/1969 8/12/1969(Applications Technology Sa 5/1974 5/15/1974 Aura (Chem-1) or Chemistry 8/1/1993 7/1/1999 11/16/1999 9/12/2000 10/1/2001 4/2/2003 3/4/2004 7/15/2004
BARREL 12/1/2007 5/8/2008 3/26/2010 4/1/2010 1Q2011 lloon Experimlloon Experimlloon Experim 4Q2013CALIPSO 12/1/1998 1/15/2000 9/18/2000 9/15/2000 4/15/2003 3/1/2004 8/1/2004 5/19/2005 4/28/2006Cassini 1/1/1990 8/1/1988 8/11/1992 12/9/1992 10/15/1997Chandra 1/1/1989 12/1/1992 11/1/1994 2/1/1996 10/1/1997 10/1/1998 2/4/1999 7/23/1999CHIPSAT 9/1/1999 9/1/2000 12/1/2000 4/18/2001 6/1/2002 8/15/2002 10/6/2002 1/12/2003
CINDI 5/10/2000 6/19/2001 11/14/2001 6/25/2002 4/16/2008Clark Cancelled Cancelled
CLARREO 2/1/2011 ended Pre-Pha TBD TBD TBD TBD TBDClementine 2/15/1992 6/15/1992 9/15/1992 12/15/1992 1/25/1994
CloudSat 4/1/1999 2/29/2000 9/1/2000 11/15/2000 8/1/2001 7/1/2004 4/28/2006Cluster 9/1/1989 6/4/1996
Cluster-2 (Rumba & Tengo) one of two la 9/1/1989un ATP immediately after Cluster 1 destroyed at launch. These are Replicas 8/9/2000Cluster-2 (Salsa & Samba) one of two la 9/1/1989un ATP immediately after Cluster 1 destroyed at launch. These are Replicas 7/16/2000
COBE 7/1/1982 7/15/1982 10/11/1983 5/1/1987 9/1/1988 12/1/1988 9/15/1989 11/18/1989CONTOUR 10/1/1997 5/19/1999 1/19/2000 2/3/2000 12/12/2000 2/1/2002 1/8/2002 4/19/2002 7/3/2002
Constellation Integration 11/14/2006 3/4-5/2010 DR: 6/18/200 cancelled cancelled cancelled cancelled
ATS-5 tellite)ATS-6 tellite)
Ba entBa entBa ent
On Ext se A
ches for four cluster spacecraft (Joint NASA-ESA) of Cluster 1ches for four cluster spacecraft (Joint NASA-ESA) of Cluster 2
S 8
Data Filtering
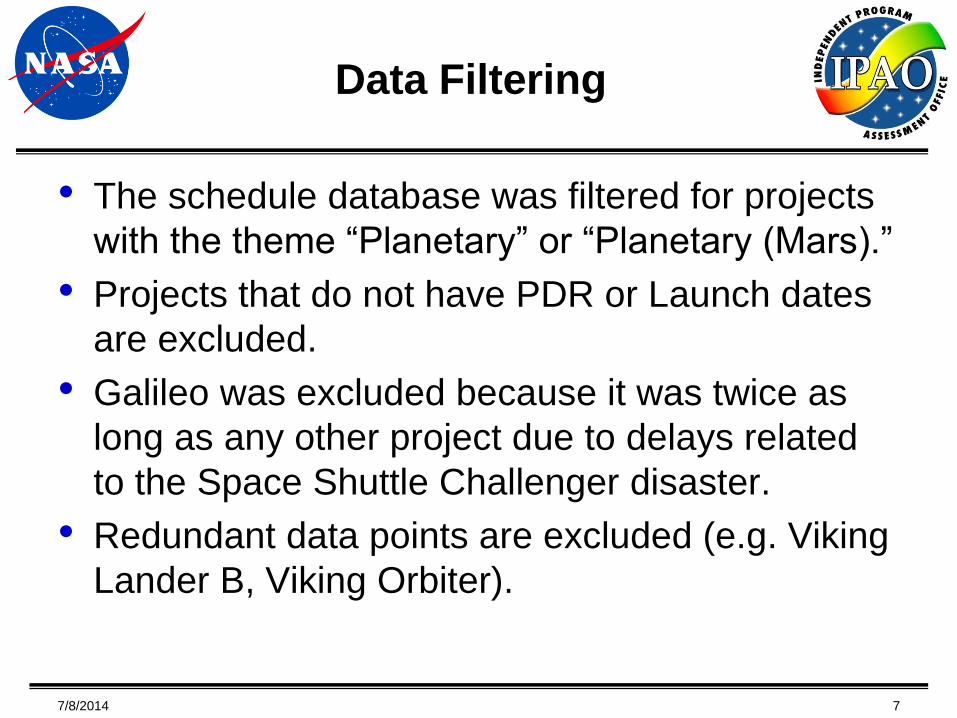
• The schedule database was filtered for projects
with the theme “Planetary” or “Planetary (Mars).”
• Projects that do not have PDR or Launch dates
are excluded.
• Galileo was excluded because it was twice as
long as any other project due to delays related
to the Space Shuttle Challenger disaster.
• Redundant data points are excluded (e.g. Viking
Lander B, Viking Orbiter).
7/8/2014 7
Selected Missions
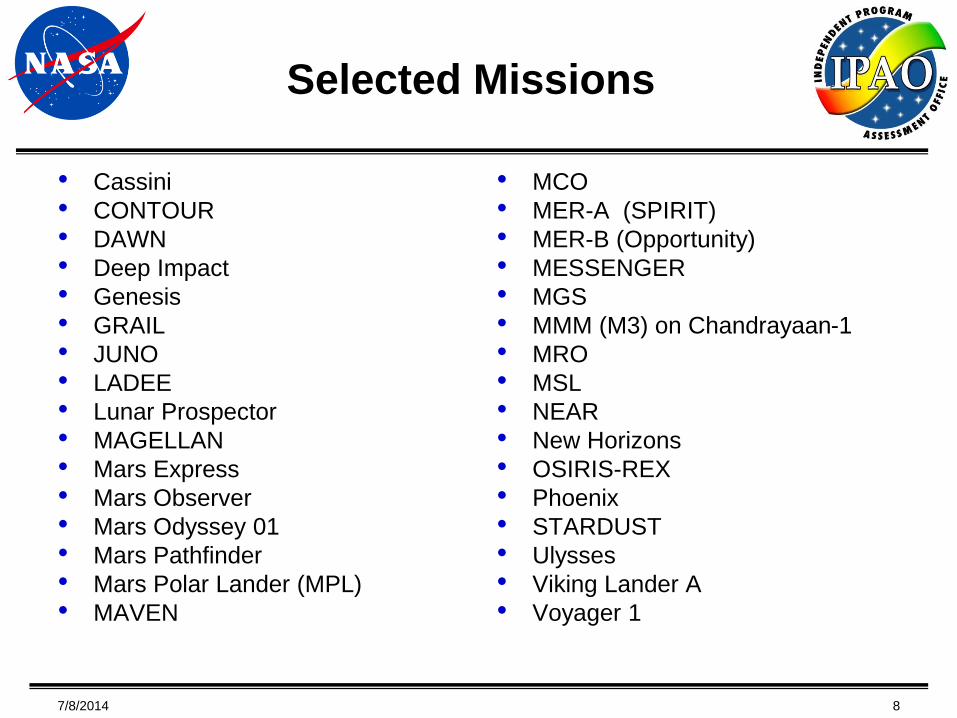
• Cassini
CONTOUR
DAWN
Deep Impact
Genesis
GRAIL
JUNO
LADEE
Lunar Prospector
MAGELLAN
Mars Express
Mars Observer
Mars Odyssey 01
Mars Pathfinder
Mars Polar Lander (MPL)
MAVEN
•••••••••••••••
• MCO
MER-A (SPIRIT)
MER-B (Opportunity)
MESSENGER
MGS
MMM (M3) on Chandrayaan-1
MRO
MSL
NEAR
New Horizons
OSIRIS-REX
Phoenix
STARDUST
Ulysses
Viking Lander A
Voyager 1
•••••••••••••••
7/8/2014 8
Data Set
7/8/2014 9
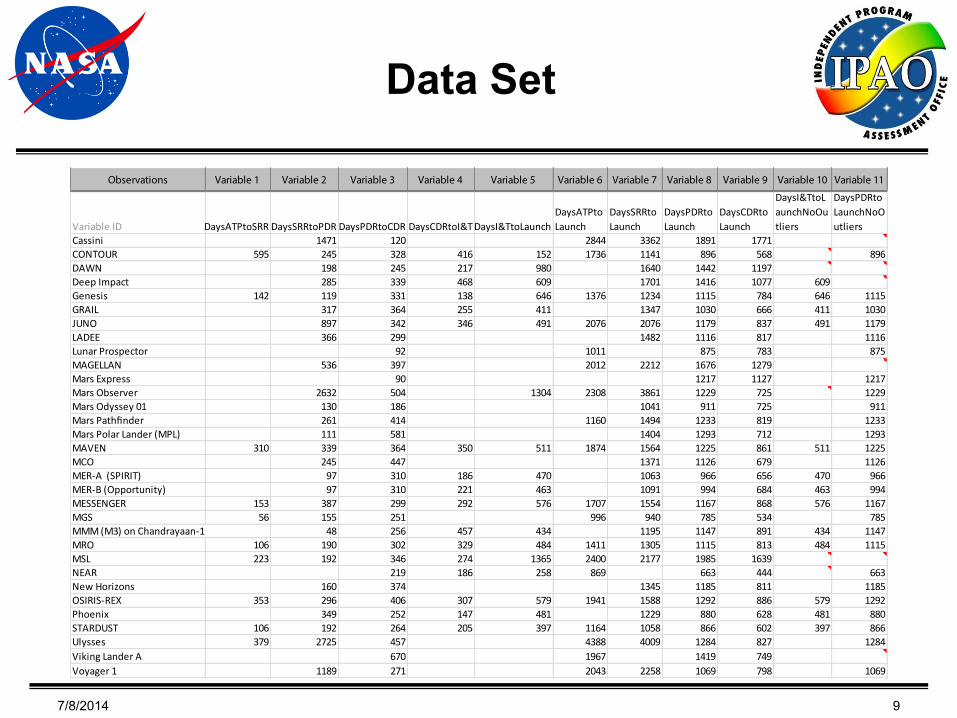
Observations Variable 1 Variable 2 Variable 3 Variable 4 Variable 5 Variable 6 Variable 7 Variable 8 Variable 9 Variable 10 Variable 11
Variable ID DaysATPtoSRR DaysSRRtoPDR DaysPDRtoCDR DaysCDRtoI&T DaysI&TtoLaunchDaysATPtoLaunch
DaysSRRtoLaunch
DaysPDRtoLaunch
DaysCDRtoLaunch
DaysI&TtoLaunchNoOutliers
DaysPDRtoLaunchNoOutliers
Cassini 1471 120 2844 3362 1891 1771896CONTOUR 595 245 328 416 152 1736 1141 896 568
DAWN 198 245 217 980 1640 1442 1197Deep Impact 285 339Genesis 142 119 331GRAIL 317 364JUNO 897 342LADEE 366 299Lunar Prospector 92
468 609138 646255 411346 491
1376
2076
1011
17011234134720761482
14161115103011791116
875
1077784666837817783
609646411491
1115103011791116
875MAGELLAN 536 397Mars Express 90
2012 2212 16761217
12791127 1217
1229911
1233129312251126
966994
1167785
11471115
Mars Observer 2632 504Mars Odyssey 01 130 186Mars Pathfinder 261 414Mars Polar Lander (MPL) 111 581MAVEN 310 339 364MCO 245 447MER-A (SPIRIT) 97 310MER-B (Opportunity) 97 310MESSENGER 153 387 299MGS 56 155 251MMM (M3) on Chandrayaan-1 48 256MRO 106 190 302
1304
350 511
186 470221 463292 576
457 434329 484
2308
1160
1874
1707996
1411
386110411494140415641371106310911554
94011951305
1229911
1233129312251126
966994
1167785
11471115
725725819712861679656684868534891813
511
470463576
434484
MSL 223 192 346 274 1365 2400 2177 1985 1639663
11851292
880866
1284
NEAR 219New Horizons 160 374OSIRIS-REX 353 296 406Phoenix 349 252STARDUST 106 192 264Ulysses 379 2725 457
186 258
307 579147 481205 397
869
1941
11644388
13451588122910584009
66311851292
880866
1284
444811886628602827
579481397
Viking Lander A 670Voyager 1 1189 271
19672043 2258
14191069
749798 1069

Data Analysis – Curve Fitting
Methodology
• Calculate calendar days duration between major milestones: Days from PDR to Launch
Days from PDR to CDR
Days from CDR to I&T Start
Days from I&T Start to Launch
Using a statistical data analysis tool called CO$TAT, find the distribution shape that most closely matches the data.
Lognormal, Normal, Triangular, Beta and Uniform distributions are assessed against the selected data.
The sum of squared error (SSE) method was used to fit the distributions to the data set.
•
•
•
7/8/2014 10
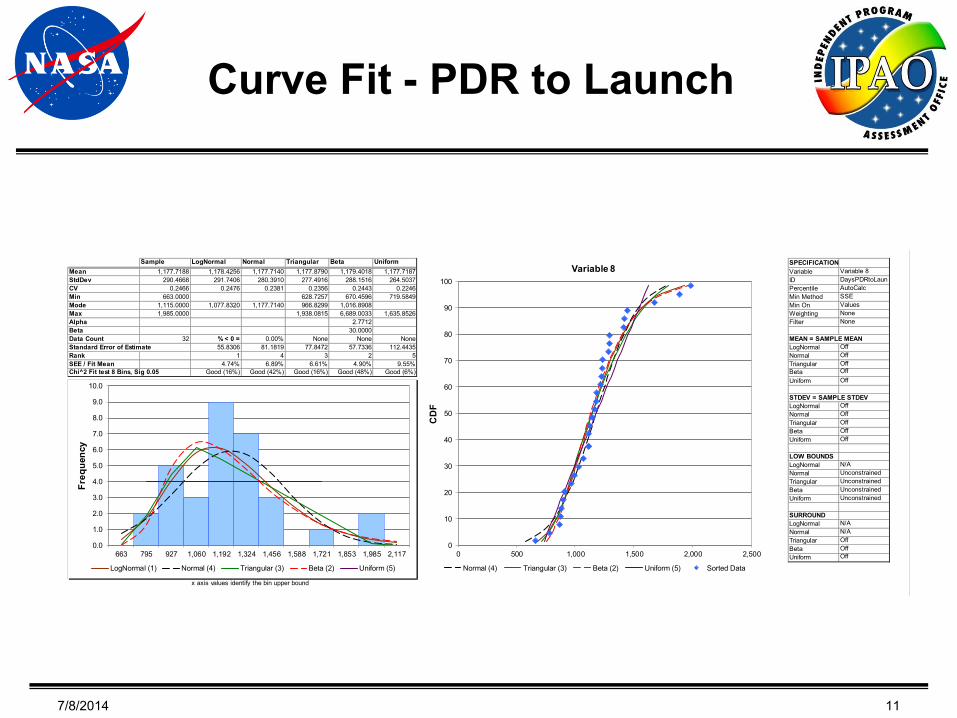
Curve Fit - PDR to Launch
7/8/2014 11
Sample LogNormal Normal Triangular Beta UniformMean 1,177.7188 1,178.4256 1,177.7140 1,177.8790 1,179.4018 1,177.7187StdDev 290.4668 291.7406 280.3910 277.4916 288.1516 264.5037CV 0.2466 0.2476 0.2381 0.2356 0.2443 0.2246Min 663.0000 628.7257 670.4596 719.5849Mode 1,115.0000 1,077.8320 1,177.7140 966.8299 1,016.8908Max 1,985.0000 1,938.0815 6,689.0033 1,635.8526Alpha 2.7712Beta 30.0000Data Count 32 % < 0 = 0.00% None None NoneStandard Error of Estimate 55.8306 81.1819 77.8472 57.7336 112.4435Rank 1 4 3 2 5SEE / Fit Mean 4.74% 6.89% 6.61% 4.90% 9.55%Chi^2 Fit test 8 Bins, Sig 0.05 Good (16%) Good (42%) Good (16%) Good (48%) Good (6%)
x axis values identify the bin upper bound
0.0
1.0
2.0
3.0
4.0
5.0
6.0
7.0
8.0
9.0
10.0
663 795 927 1,060 1,192 1,324 1,456 1,588 1,721 1,853 1,985 2,117
Freq
uenc
y
LogNormal (1) Normal (4) Triangular (3) Beta (2) Uniform (5)
0
10
20
30
40
50
60
70
80
90
100
0 500 1,000 1,500 2,000 2,500
Variable 8
Normal (4) Triangular (3) Beta (2) Uniform (5) Sorted Data
SPECIFICATIONVariable Variable 8ID DaysPDRtoLaunPercentile AutoCalcMin Method SSEMin On ValuesWeighting NoneFilter None
MEAN = SAMPLE MEANLogNormal OffNormal OffTriangular OffBeta OffUniform Off
STDEV = SAMPLE STDEVLogNormal OffNormal OffTriangular OffBeta OffUniform Off
LOW BOUNDSLogNormal N/ANormal UnconstrainedTriangular UnconstrainedBeta UnconstrainedUniform Unconstrained
SURROUNDLogNormal N/ANormal N/ATriangular OffBeta OffUniform Off
CD
F
Sample LogNormal Normal Triangular Beta Uniform

Curve Fit - PDR to CDR
7/8/2014 12
Sample LogNormal Normal Triangular Beta UniformMean 325.9375 327.6903 325.9386 325.9688 325.8424 5325.937StdDev 125.4658 123.6420 123.3971 121.0827 123.3159 3116.194CV 0.3849 0.3773 0.3786 0.3715 0.3785 50.356Min 90.0000 50.2655 -348.3794 1124.683Mode 299.0000 268.3835 325.9386 287.8747 316.4153Max 670.0000 639.7663 1,435.6466 9527.191Alpha 18.2178Beta 29.9874Data Count 32 % < 0 = 0.41% None 0.19% eNonStandard Error of Estimate 24.6481 25.7159 28.6986 25.5153 843.441Rank 1 3 4 2 5SEE / Fit Mean 7.52% 7.89% 8.80% 7.83% %13.33Chi^2 Fit test 8 Bins, Sig 0.05 Good (42%) Good (36%) Good (48%) Good (32%) Good (16%)
x axis values identify the bin upper bound
0.0
1.0
2.0
3.0
4.0
5.0
6.0
7.0
8.0
9.0
90 148 206 264 322 380 438 496 554 612 670 728
Freq
uenc
y
LogNormal (1) Normal (3) Triangular (4) Beta (2) Uniform (5)
0
10
20
30
40
50
60
70
80
90
100
0 100 200 300 400 500 600 700 800
CD
F
Variable 3
Normal (3) Triangular (4) Beta (2) Uniform (5) Sorted Data
SPECIFICATIONVariable Variable 3ID DaysPDRtoCDRPercentile AutoCalcMin Method SSEMin On ValuesWeighting NoneFilter None
MEAN = SAMPLE MEANLogNormal OffNormal OffTriangular OffBeta OffUniform Off
STDEV = SAMPLE STDEVLogNormal OffNormal OffTriangular OffBeta OffUniform Off
LOW BOUNDSLogNormal N/ANormal UnconstrainedTriangular UnconstrainedBeta UnconstrainedUniform Unconstrained
SURROUNDLogNormal N/ANormal N/ATriangular OffBeta OffUniform Off
Sample LogNormal Normal Triangular Beta Uniform

Curve Fit – CDR to I&T Start
7/8/2014 13
Sample LogNormal Normal Triangular Beta UniformMean 282.0000 283.9363 281.9280 282.1381 282.2157 00282.00StdDev 102.1310 101.6207 100.9969 99.7265 99.1920 6297.77CV 0.3622 0.3579 0.3582 0.3535 0.3515 670.34Min 138.0000 95.8465 131.4748 66112.64Mode 186.0000 236.9758 281.9280 191.8614 156.5016Max 468.0000 558.7064 526.7032 34451.35Alpha 1.0472Beta 1.6985Data Count 17 % < 0 = 0.26% None None neNoStandard Error of Estimate 19.8923 20.7527 12.1107 11.9985 2618.49Rank 4 5 2 1 3SEE / Fit Mean 7.01% 7.36% 4.29% 4.25% %6.56Chi^2 Fit test 6 Bins, Sig 0.05 Good (64%) Good (49%) Good (21%) Good (32%) Good %(49 )
x axis values identify the bin upper bound
0.0
0.5
1.0
1.5
2.0
2.5
3.0
3.5
138 171 204 237 270 303 336 369 402 435 468 501
Freq
uenc
y
LogNormal (4) Normal (5) Triangular (2) Beta (1) Uniform (3)
0
10
20
30
40
50
60
70
80
90
100
0 100 200 300 400 500 600
CD
F
Variable 4
Normal (5) Triangular (2) Beta (1) Uniform (3) Sorted Data
SPECIFICATIONVariable Variable 4ID DaysCDRtoI&TPercentile AutoCalcMin Method SSEMin On ValuesWeighting NoneFilter None
MEAN = SAMPLE MEANLogNormal OffNormal OffTriangular OffBeta OffUniform Off
STDEV = SAMPLE STDEVLogNormal OffNormal OffTriangular OffBeta OffUniform Off
LOW BOUNDSLogNormal N/ANormal UnconstrainedTriangular UnconstrainedBeta UnconstrainedUniform Unconstrained
SURROUNDLogNormal N/ANormal N/ATriangular OffBeta OffUniform Off

Curve Fit – I&T Start to Launch
7/8/2014 14
Sample LogNormal Normal Triangular Beta UniformMean 589.5000 592.7094 589.5000 590.0521 590.1902 589.5000StdDev 319.1637 331.6551 287.6735 288.4371 298.2548 265.3791CV 0.5414 0.5596 0.4880 0.4888 0.5054 0.4502Min 152.0000 86.7438 391.0956 129.8498Mode 393.9062 589.5000 285.6610Max 1,365.0000 1,397.7515 1,562.9700 1,049.1502Alpha 0.2000Beta 0.9772Data Count 18 % < 0 = 2.02% None None NoneStandard Error of Estimate 98.3849 146.5231 133.0706 105.2432 171.0182Rank 1 4 3 2 5SEE / Fit Mean 16.60% 24.86% 22.55% 17.83% 29.01%Chi^2 Fit test 6 Bins, Sig 0.05 Poor (3%) Poor (3%) Poor (1%) Poor (0%) Poor (1%)
x axis values identify the bin upper bound
0.0
1.0
2.0
3.0
4.0
5.0
6.0
7.0
8.0
9.0
10.0
152 273 395 516 637 759 880 1,001 1,122 1,244 1,365 1,486
Freq
uenc
y
LogNormal (1) Normal (4) Triangular (3) Beta (2) Uniform (5)
0
10
20
30
40
50
60
70
80
90
100
0 200 400 600 800 1,000 1,200 1,400 1,600
CD
F
Variable 5
Normal (4) Triangular (3) Beta (2) Uniform (5) Sorted Data
SPECIFICATIONVariable Variable 5ID DaysI&TtoLauncPercentile AutoCalcMin Method SSEMin On ValuesWeighting NoneFilter None
MEAN = SAMPLE MEANLogNormal OffNormal OffTriangular OffBeta OffUniform Off
STDEV = SAMPLE STDEVLogNormal OffNormal OffTriangular OffBeta OffUniform Off
LOW BOUNDSLogNormal N/ANormal UnconstrainedTriangular UnconstrainedBeta UnconstrainedUniform Unconstrained
SURROUNDLogNormal N/ANormal N/ATriangular OffBeta OffUniform Off

Curve Fit – I&T Start to Launch – No Outliers
7/8/2014 15
I&T to Launch exhibited poor fit characteristics, so 5 extreme data points were removed and another distribution was calculated
Sample LogNormal Normal Triangular Beta UniformMean 504.0000 504.5063 504.0000 504.1704 504.3960 504.0000StdDev 76.9090 76.9413 75.6320 74.2609 74.1818 72.0657CV 0.1526 0.1525 0.1501 0.1473 0.1471 0.1430Min 397.0000 359.1930 387.5126 379.1786Mode 487.4032 504.0000 445.0375 443.4828Max 646.0000 708.2806 728.5443 628.8214Alpha 1.2890Beta 2.4719Data Count 13 % < 0 = 0.00% None None NoneStandard Error of Estimate 15.0928 17.9827 13.5439 14.6345 18.7434Rank 3 4 1 2 5SEE / Fit Mean 2.99% 3.57% 2.69% 2.90% 3.72%Chi^2 Fit test 6 Bins, Sig 0.05 Good (37%) Good (53%) Good (8%) Poor (3%) Good (17%)
x axis values identify the bin upper bound
0.0
0.5
1.0
1.5
2.0
2.5
3.0
3.5
397 422 447 472 497 522 546 571 596 621 646 671
Freq
uenc
y
LogNormal (3) Normal (4) Triangular (1) Beta (2) Uniform (5)
0
10
20
30
40
50
60
70
80
90
100
0 100 200 300 400 500 600 700
CD
F
Variable 6
Normal (4) Triangular (1) Beta (2) Uniform (5) Sorted Data
•
Sample LogNormal Normal Triangular Beta Uniform
SPECIFICATIONVariable Variable 6ID DaysI&TtoLauncPercentile AutoCalcMin Method SSEMin On ValuesWeighting NoneFilter None
MEAN = SAMPLE MEANLogNormal OffNormal OffTriangular OffBeta OffUniform Off
STDEV = SAMPLE STDEVLogNormal OffNormal OffTriangular OffBeta OffUniform Off
LOW BOUNDSLogNormal N/ANormal UnconstrainedTriangular UnconstrainedBeta UnconstrainedUniform Unconstrained
SURROUNDLogNormal N/ANormal N/ATriangular OffBeta OffUniform Off
Summary of Selected Distributions
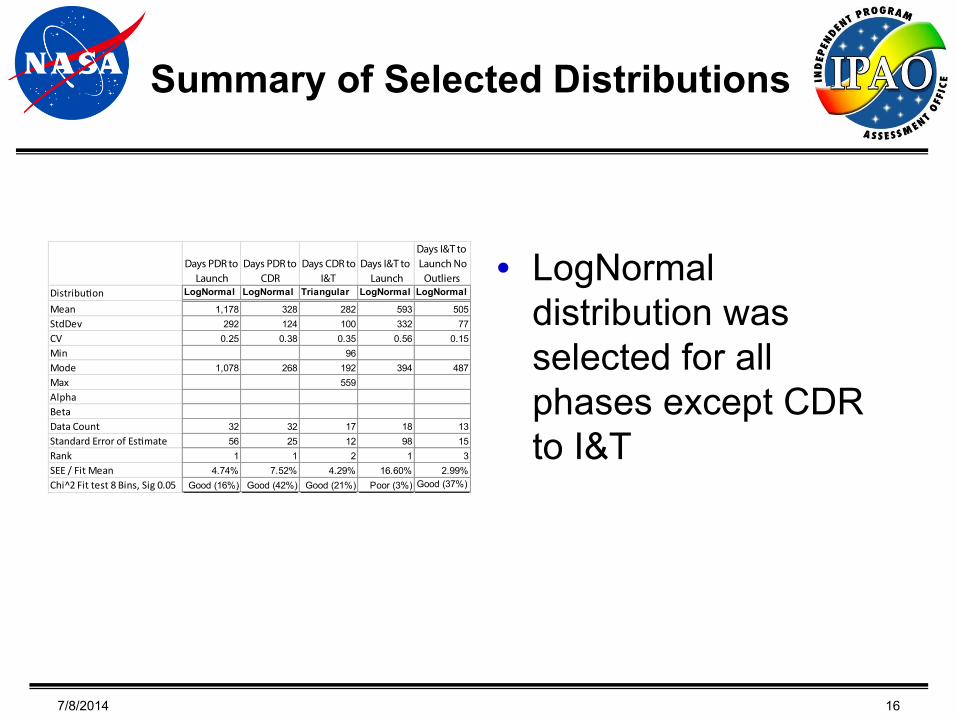
•Days I&T to Days PDR to Days PDR to Days CDR to Days I&T to Launch No
Launch CDR I&T Launch OutliersDistribution LogNormal LogNormal Triangular LogNormal LogNormal
Mean 1,178 328 282 593 505StdDev 292 124 100 332 77CV 0.25 0.38 0.35 0.56 0.15Min 96Mode 1,078 268 192 394 487Max 559AlphaBetaData Count 32 32 17 18 13Standard Error of Estimate 56 25 12 98 15Rank 1 1 2 1 3SEE / Fit Mean 4.74% 7.52% 4.29% 16.60% 2.99%Chi^2 Fit test 8 Bins, Sig 0.05 Good (16%) Good (42%) Good (21%) Poor (3%) Good (37%)
LogNormal distribution was selected for all phases except CDR to I&T
7/8/2014 16

Correlation Matrix
Pairwise Variable Analysis For Dataset New DatasetThursday, 05 September 2013, 10:48 am
I. Correlation Matrix
DaysATPtoSRR
DaysSRRtoPDR
DaysPDRtoCDR
DaysCDRtoI&T
DaysI&TtoLaunch
DaysATPtoLaunch
DaysSRRtoLaunch
DaysPDRtoLaunch
DaysCDRtoLaunch
DaysI&TtoLaunchNoOu
tliers
DaysPDRtoLaunchNoOu
tliersDaysATPtoSRR 1.0000 0.3227 0.6081 0.7141 -0.3414 0.4700 0.3192 0.0930 -0.0222 0.2837 0.2413DaysSRRtoPDR 0.3227 1.0000 0.2363 0.1733 0.5114 0.7876 0.9394 0.2284 0.1453 0.0755 0.2530DaysPDRtoCDR 0.6081 0.2363 1.0000 0.3125 0.4750 0.3293 0.2336 0.2371 -0.1966 0.4169 0.5421DaysCDRtoI&T 0.7141 0.1733 0.3125 1.0000 -0.1203 0.5614 0.2693 0.2863 0.2479 0.0791 0.4434DaysI&TtoLaunch -0.3414 0.5114 0.4750 -0.1203 1.0000 0.7104 0.7670 0.7884 0.7192 1.0000 0.6365DaysATPtoLaunch 0.4700 0.7876 0.3293 0.5614 0.7104 1.0000 0.8592 0.5695 0.4558 0.2416 0.5807DaysSRRtoLaunch 0.3192 0.9394 0.2336 0.2693 0.7670 0.8592 1.0000 0.5482 0.4577 0.4048 0.4556DaysPDRtoLaunch 0.0930 0.2284 0.2371 0.2863 0.7884 0.5695 0.5482 1.0000 0.9059 0.6574 1.0000DaysCDRtoLaunch -0.0222 0.1453 -0.1966 0.2479 0.7192 0.4558 0.4577 0.9059 1.0000 0.6274 0.7703DaysI&TtoLaunchNoOutliers 0.2837 0.0755 0.4169 0.0791 1.0000 0.2416 0.4048 0.6574 0.6274 1.0000 0.6574DaysPDRtoLaunchNoOutliers 0.2413 0.2530 0.5421 0.4434 0.6365 0.5807 0.4556 1.0000 0.7703 0.6574 1.0000
7/8/2014 17
• The report shows a correlation matrix for all the data points in the data set. The numbers that are highlighted represent the correlation between phases of interest for this project. For example, for the data above, we want to know the correlation between PDR to CDR, CDR to I&T, and I&T to Launch.
•
•

Correlation Scatter Plots
7/8/2014 18
The scatter plots
show that weak
correlation exists
between phases.
•
Examination of Possible Outliers
MSL
1st longest duration from PDR to Launch (1985 days, 64 months).
Removing this data point would reduce mean PDR-Launch duration by 26 days.
By November 2008 most hardware and software development was complete, and testing continued. At this point, cost overruns were approximately $400 million. In the attempts to meet the launch date, several instruments and a cache for samples were removed and other instruments and cameras were simplified to simplify testing and integration of the rover. The next month, NASA delayed the launch to late 2011 because of inadequate testing time. Eventually the costs for developing the rover did reach $2.47 billion, that for a rover that initially had been classified as a medium-cost mission with a maximum budget of $650 million, yet NASA still had to ask for an additional $82 million to meet the planned November launch.
Cassini
2rd longest duration from PDR to Launch (1891 days, 61 months).
Removing this data point would reduce mean PDR-Launch duration by 23 days.
"The spacecraft was originally planned to be the second three-axis stabilized, RTG-powered Mariner Mark II, a class of spacecraft developed for missions beyond the orbit of Mars. Cassini was developed simultaneously with the Comet Rendezvous Asteroid Flyby (CRAF) spacecraft, but various budget cuts and rescopings of the project forced NASA to terminate CRAF development in order to save Cassini. As a result, the Cassini spacecraft became a more specialized design, canceling the implementation of the Mariner Mark II series."
MAGELLAN
3rd longest duration from PDR to Launch (1676 days, 54 months).
Removing this data point would reduce mean PDR-Launch duration by 16 days.
"Originally, Magellan had been scheduled for launch in 1988 with a trajectory lasting six months. However, due to the Space Shuttle Challenger disaster in 1986, several missions, including Galileo and Magellan, were deferred until shuttle flights resumed in September 1988. Intended to be launched with a new, liquid-fueled, Centaur-G shuttle deployable upper-stage booster, subsequently canceled after the Challenger disaster, Magellan had to be modified to attach to a less powerful solid-fueled, Inertial Upper Stage. The next best opportunity for launch would occur in October 1989.Further complicating the launch however, was the upcoming Galileo mission to Jupiter, which included a flyby of Venus. Intended for launch in 1986, the pressures to ensure a launch for Galileo in 1989, mixed with a short launch-window necessitating a mid-October launch, resulted in replanning the Magellan mission. Weary of rapid shuttle launches, the decision was made to launch Magellan in May 1989, and into an orbit that would require 1 year and 3 months before encountering Venus."
Dawn
4th longest duration from PDR to Launch (1442 days, 46 months).
Removing this data point would reduce mean PDR-Launch duration by 9 days.
"The status of the Dawn mission changed several times. The project was cancelled in December 2003 and then reinstated in February 2004. In October 2005, work on Dawn was placed in ""stand down"" mode, and in January 2006, the mission was discussed in the press as ""indefinitely postponed"", even though NASA had made no new announcements regarding its status. On March 2, 2006, Dawn was again cancelled by NASA. The spacecraft's manufacturer, Orbital Sciences Corporation, appealed NASA's decision, offering to build the spacecraft at cost, forgoing any profit in order to gain experience in a new market field. NASA then put the cancellation under review, and on March 27, 2006, it was announced that the mission would not be cancelled after all. In the last week of September 2006, the Dawn mission's instrument payload integration reached full functionality. Although originally projected to cost US$373 million, cost overruns inflated the final cost of the mission to US$446 million in 2007."
7/8/2014 19
SIMULATION MODELS
7/8/2014 20

Simulation Methodology
• Build top-level schedule simulation model in Primavera Risk Analysis (PRA)
Apply deterministic duration estimates based on nominal plan
Apply fitted duration distributions to the phases in the model
Apply correlation
Run Monte Carlo Simulation
Plot resulting s-curves, confidence level in deterministic plan, 50% confidence level
Note that since distributions are based on actual historical durations, no additional discrete risks are applied to this model
•
•
•••
•
7/8/2014 21
Level 1 Models
7/8/2014 22
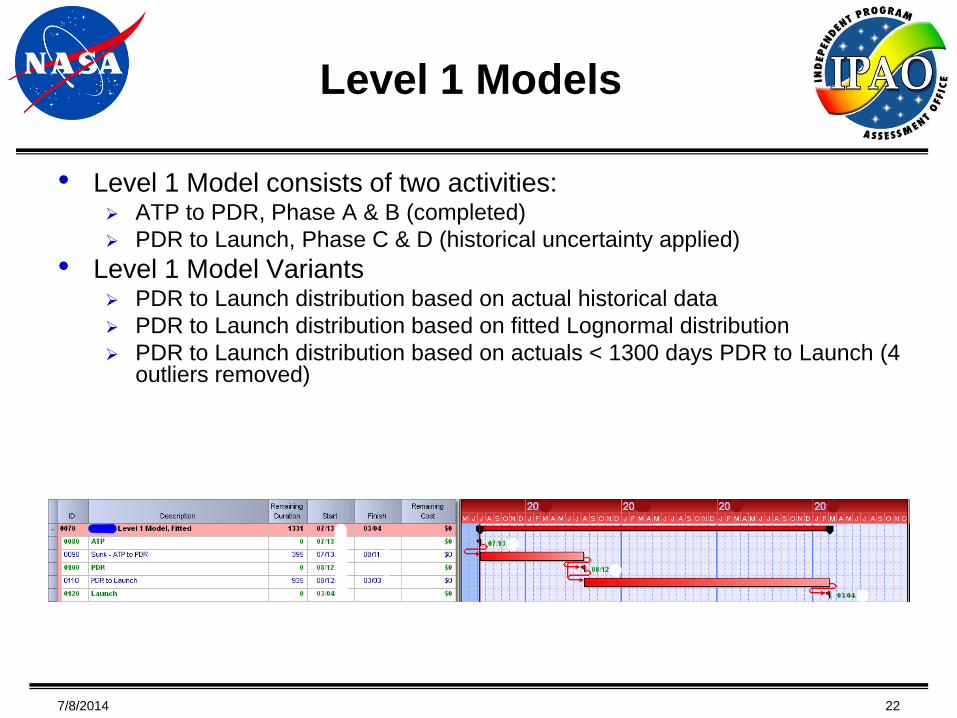
• Level 1 Model consists of two activities: ATP to PDR, Phase A & B (completed)
PDR to Launch, Phase C & D (historical uncertainty applied)
• Level 1 Model Variants PDR to Launch distribution based on actual historical data
PDR to Launch distribution based on fitted Lognormal distribution
PDR to Launch distribution based on actuals < 1300 days PDR to Launch (4 outliers removed)
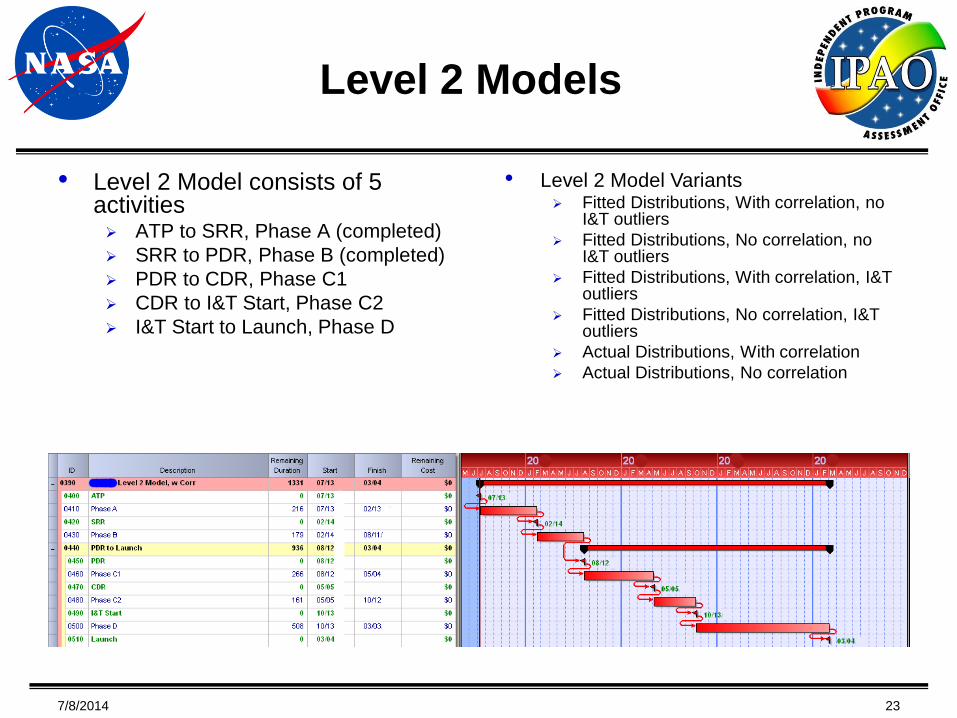
Level 2 Models
• Level 2 Model consists of 5 activities ATP to SRR, Phase A (completed)
SRR to PDR, Phase B (completed)
PDR to CDR, Phase C1
CDR to I&T Start, Phase C2
I&T Start to Launch, Phase D
7/8/2014 23
• Level 2 Model Variants Fitted Distributions, With correlation, no
I&T outliers
Fitted Distributions, No correlation, no I&T outliers
Fitted Distributions, With correlation, I&T outliers
Fitted Distributions, No correlation, I&T outliers
Actual Distributions, With correlation
Actual Distributions, No correlation

Correlation Factors
Model with I&T outliers
Phase
C1
Phase
C2
Phase
D
Phase
C1
1 31% 48%
Phase
C2
1 -12%
Phase
D
1
Model without I&T outliers
7/8/2014 24
Phase
C1
Phase
C2
Phase
D
Phase
C1
1 31% 42%
Phase
C2
1 8%
Phase
D
1
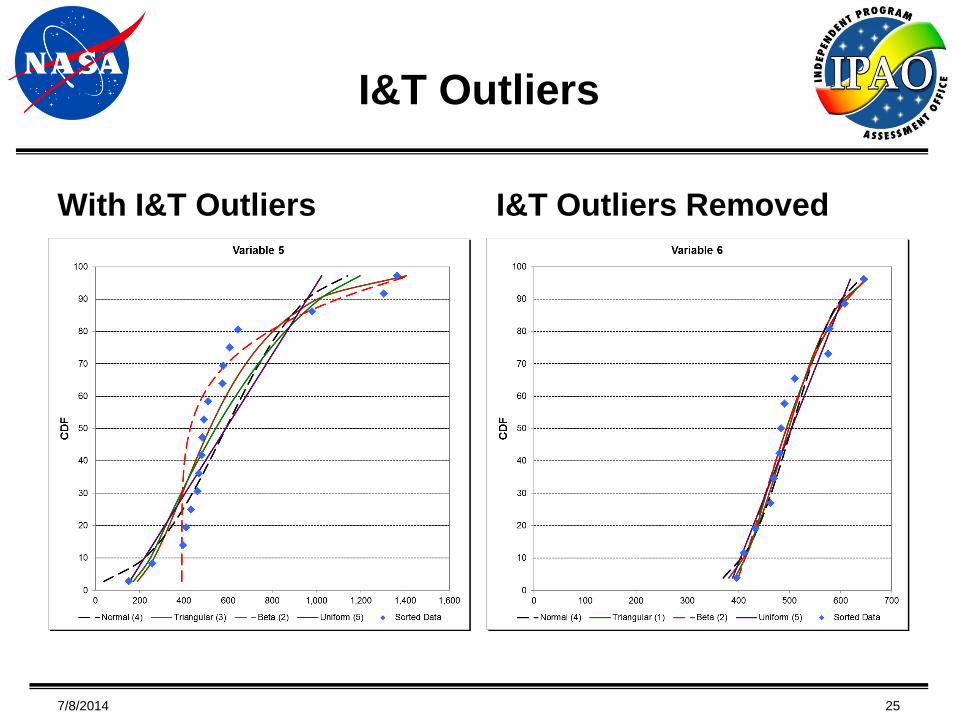
I&T Outliers
With I&T Outliers I&T Outliers Removed
7/8/2014 25

RESULTS
7/8/2014 26

Comparative Analysis
Box & Whiskers Charts
7/8/2014 27
• The box and whiskers show quartile ranges.
The yellow diamond is the hypothetical project planned duration.
•
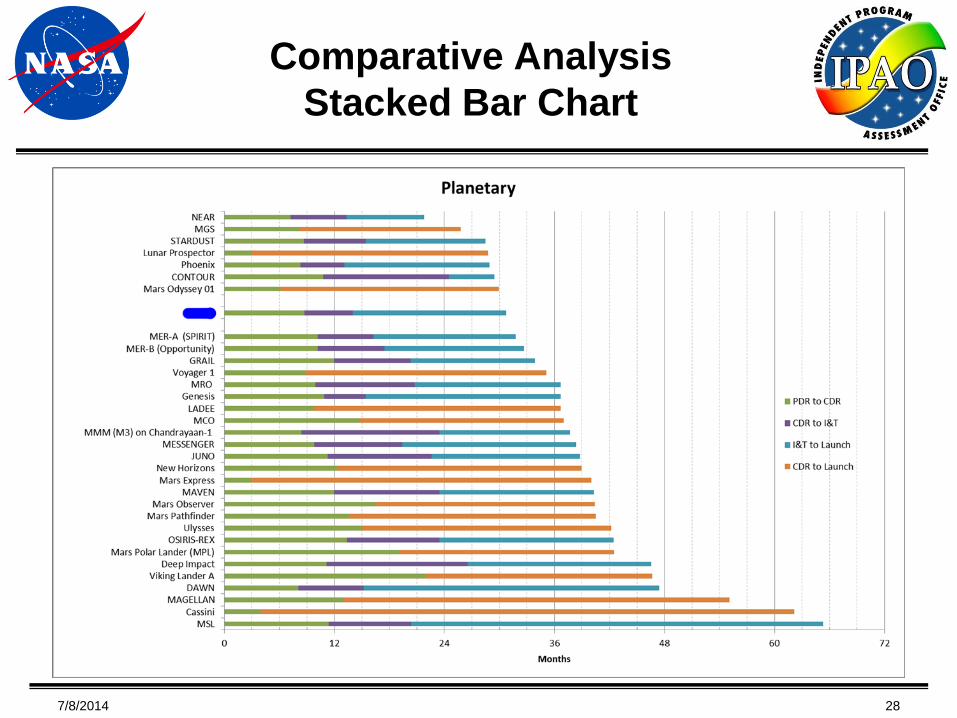
Comparative Analysis
Stacked Bar Chart
7/8/2014 28
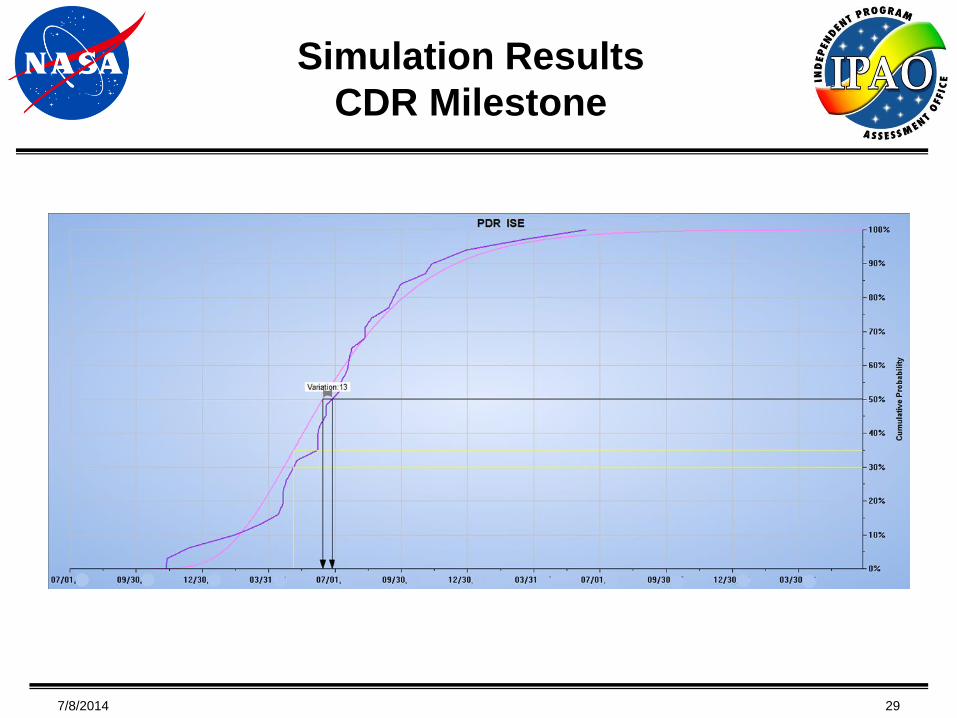
Simulation Results
CDR Milestone
7/8/2014 29
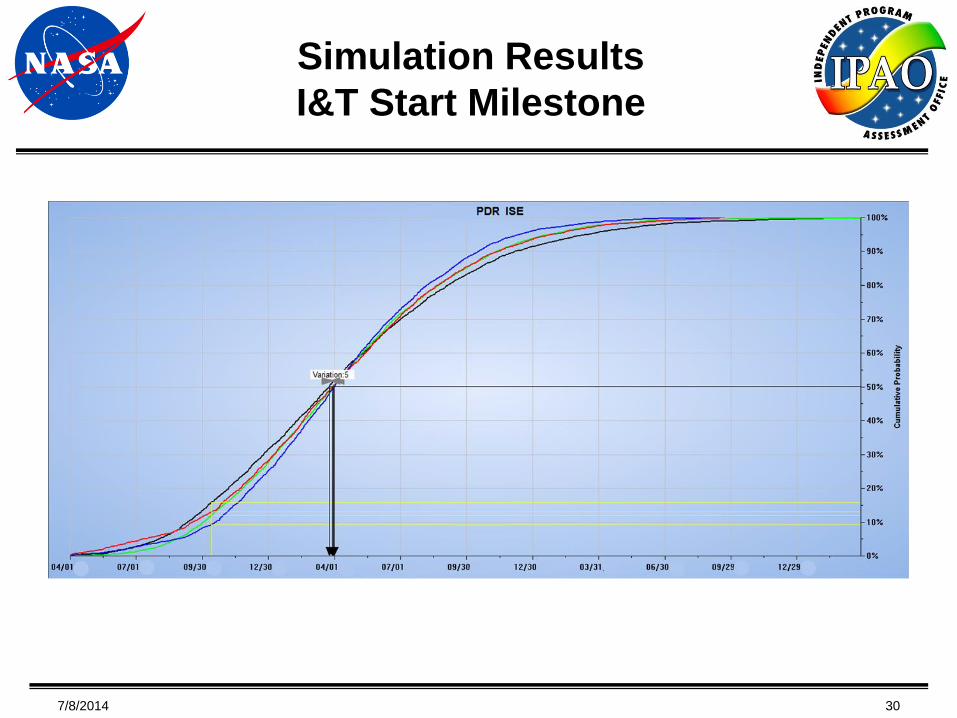
Simulation Results
I&T Start Milestone
7/8/2014 30

Simulation Results
Launch Date
7/8/2014 31
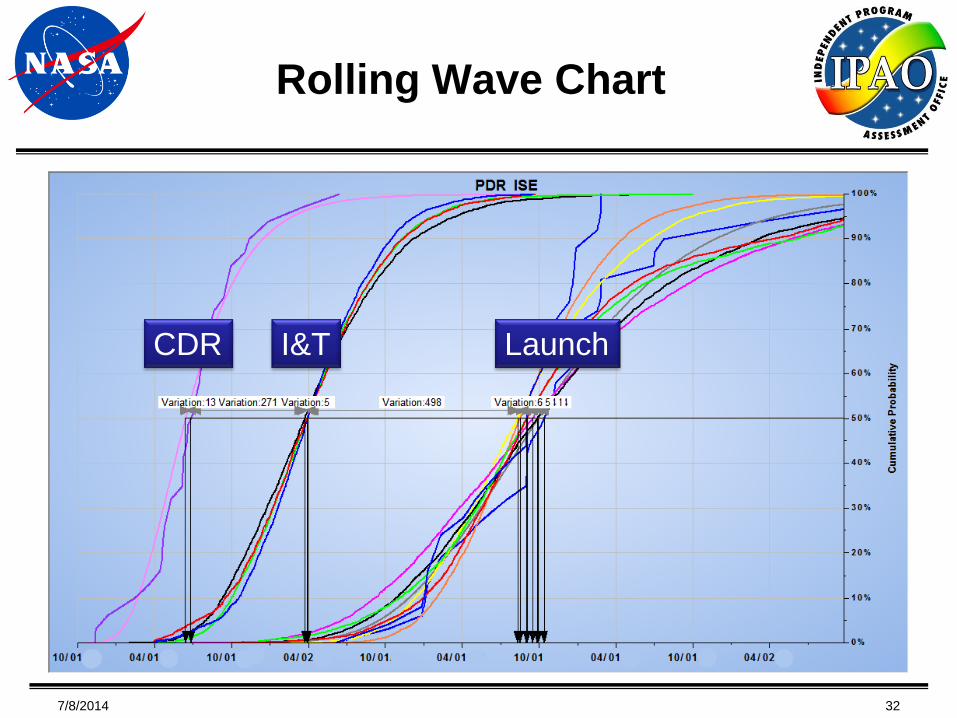
Rolling Wave Chart
7/8/2014 32
CDR I&T Launch

•
Executive Summary
S-Curve
The ISE is a top-down estimate based on the average duration and variation of similar projects
Various level 1 and level 2 schedule simulation models were developed
Based on these ISE models, the likelihood of meeting the 3/##/## opening day of the launch window ranges from 15-28%
The 50% confidence level launch readiness date ranges from 8/11/## to 10/13/##
If nothing is done to maintain schedule, then based on historical data, the project could launch 5-7 months late
However, the project must launch during the 20## opportunity or face a 26 month delay to the next opportunity
Various mitigation strategies can be employed to compress the schedule to meet the launch window, including working overtime or additional shifts
Additional shifts may require additional resources above the planned reserves.
•
•
•
•
•
•
•
7/8/2014 33

CONCLUSIONS
7/8/2014 34
7/8/2014 35
Conclusions
• Historical data analysis can be used to estimate the schedule uncertainty for a new mission.
• Analysis and removal of outliers can improve the quality of probability distributions.
• Weak correlation exists between phases of a project.
• Uncertainty distributions can be applied to high-level summary models.
• Intermediate milestones can be predicted as well as launch date.
• Results are consistent across various types of models.