
Schaeffler AG Capital Markets Presentation AG Capital Markets Presentation January 24, 2017 Analyst...
27
Schaeffler AG Capital Markets Presentation January 24, 2017 Analyst and Investor Conference Call Pre-release FY2016 Results and Update Equity Story
Transcript of Schaeffler AG Capital Markets Presentation AG Capital Markets Presentation January 24, 2017 Analyst...

Schaeffler AGCapital Markets Presentation
January 24, 2017Analyst and Investor Conference Call
Pre-release FY2016 Results and Update Equity Story
This presentation contains forward-looking statements. The words "anticipate", "assume", "believe", "estimate", "expect", "intend", "may", "plan", "project“, "should" and similar expressions are used to identify forward-looking statements. Forward-looking statements are statements that are not historical facts; they include statements about Schaeffler Group's beliefs and expectations and the assumptions underlying them. These statements are based on plans, estimates and projections as they are currently available to the management of Schaeffler AG. Forward-looking statements therefore speak only as of the date they are made, and Schaeffler Group undertakes no obligation to update any of them in light of new information or future events.
By their very nature, forward-looking statements involve risks and uncertainties. These statements are based on Schaeffler AG management's current expectations and are subject to a number of factors and uncertainties that could cause actual results to differ materially from those described in the forward-looking statements. Actual results may differ from those set forth in the forward-looking statements as a result of various factors (including, but not limited to, future global economic conditions, changed market conditions affecting the automotive industry, intense competition in the markets in which we operate and costs of compliance with applicable laws, regulations and standards, diverse political, legal, economic and other conditions affecting our markets, and other factors beyond our control).
This presentation is intended to provide a general overview of Schaeffler Group’s business and does not purport to deal with all aspects and details regarding Schaeffler Group. Accordingly, neither Schaeffler Group nor any of its directors, officers, employees or advisers nor any other person makes any representation
or warranty, express or implied, as to, and accordingly no reliance should be placed on, the accuracy or completeness of the information contained in the presentation or of the views given or implied. Neither Schaeffler Group nor any of its directors, officers, employees or advisors nor any other person shall have any liability whatsoever for any errors or omissions or any loss howsoever arising, directly or indirectly, from any use of this information or its contents or otherwise arising in connection therewith.
The material contained in this presentation reflects current legislation and the business and financial affairs of Schaeffler Group which are subject to change.
Schaeffler AG Capital Markets Presentation
Disclaimer
January 24, 20172
1 Overview
2 Strategy "Mobility for tomorrow"
3 Investment Highlights
4 Outlook and Summary
Agenda
January 24, 2017 Schaeffler AG Capital Markets Presentation3
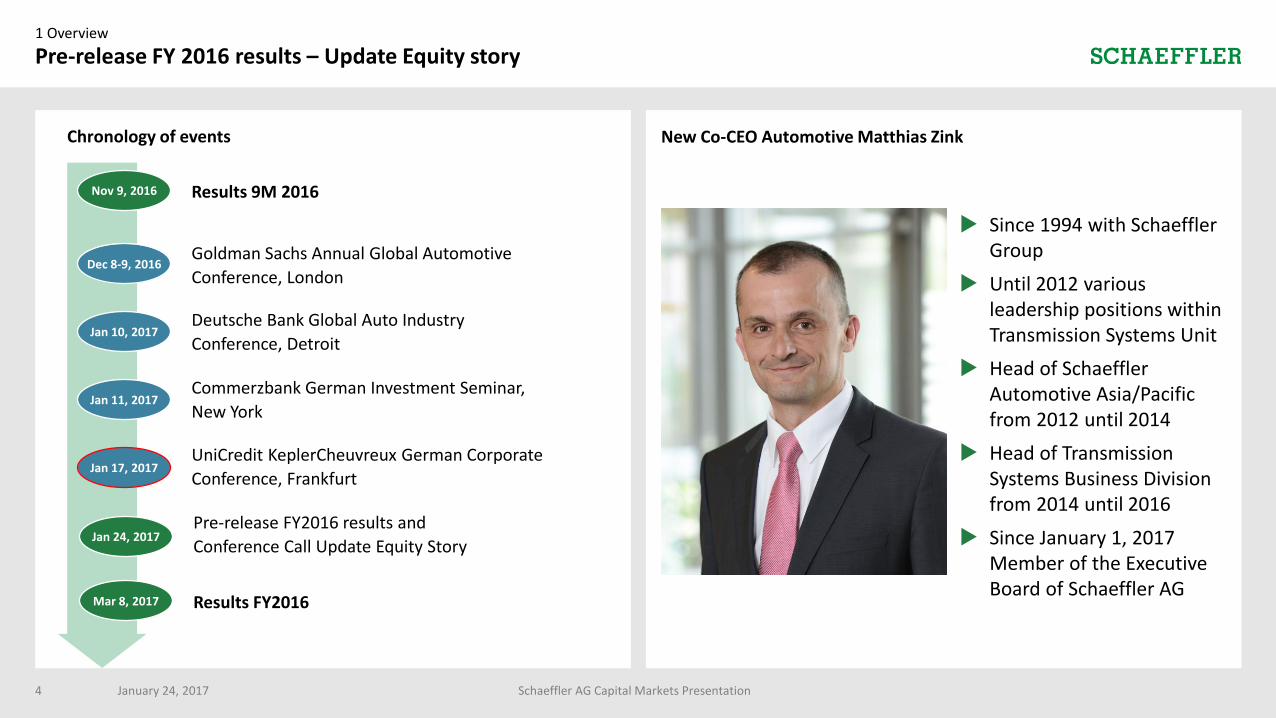
New Co-CEO Automotive Matthias Zink
1 Overview
Pre-release FY 2016 results – Update Equity story
January 24, 2017 Schaeffler AG Capital Markets Presentation4
Results 9M 2016Nov 9, 2016
Goldman Sachs Annual Global Automotive
Conference, LondonDec 8-9, 2016
Commerzbank German Investment Seminar,
New York
Jan 10, 2017Deutsche Bank Global Auto Industry
Conference, Detroit
Jan 11, 2017
UniCredit KeplerCheuvreux German Corporate
Conference, FrankfurtJan 17, 2017
Pre-release FY2016 results and
Conference Call Update Equity StoryJan 24, 2017
Since 1994 with Schaeffler Group
Until 2012 various leadership positions within Transmission Systems Unit
Head of Schaeffler Automotive Asia/Pacific from 2012 until 2014
Head of Transmission Systems Business Division from 2014 until 2016
Since January 1, 2017 Member of the Executive Board of Schaeffler AG
Chronology of events
Results FY2016Mar 8, 2017
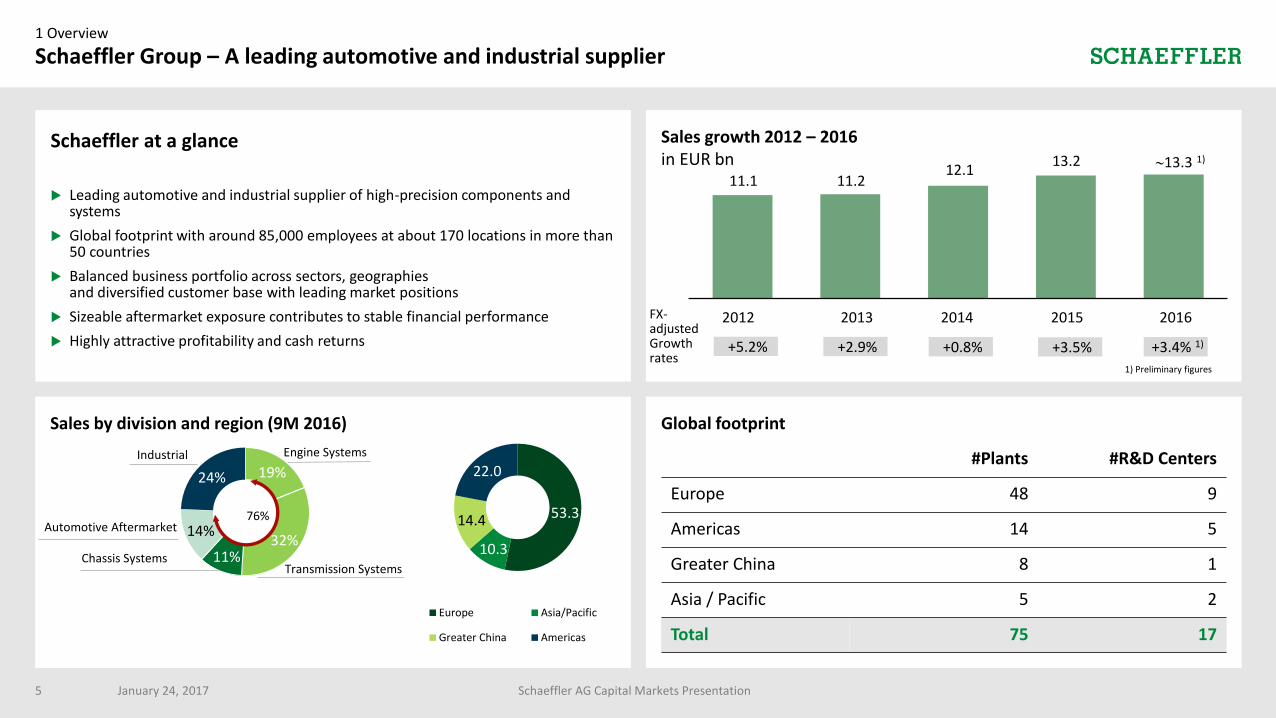
Sales growth 2012 – 2016in EUR bn
Global footprintSales by division and region (9M 2016)
FX-adjustedGrowth rates
19%
32%11%
14%
24%
Chassis SystemsTransmission Systems
Engine Systems
Automotive Aftermarket53.3
10.3
14.4
22.0
Europe Asia/Pacific
Greater China Americas
#Plants #R&D Centers
Europe 48 9
Americas 14 5
Greater China 8 1
Asia / Pacific 5 2
Total 75 17
11.1 11.212.1
13.2 13.3 1)
20162015201420132012
+5.2% +2.9% +0.8% +3.5%
January 24, 2017 Schaeffler AG Capital Markets Presentation
Schaeffler at a glance
Leading automotive and industrial supplier of high-precision components and systems
Global footprint with around 85,000 employees at about 170 locations in more than 50 countries
Balanced business portfolio across sectors, geographiesand diversified customer base with leading market positions
Sizeable aftermarket exposure contributes to stable financial performance
Highly attractive profitability and cash returns
1 Overview
Schaeffler Group – A leading automotive and industrial supplier
Industrial
76%
5
+3.4% 1)
1) Preliminary figures
1,523
1,402
1,700 2)
1,5611,676
1 Overview
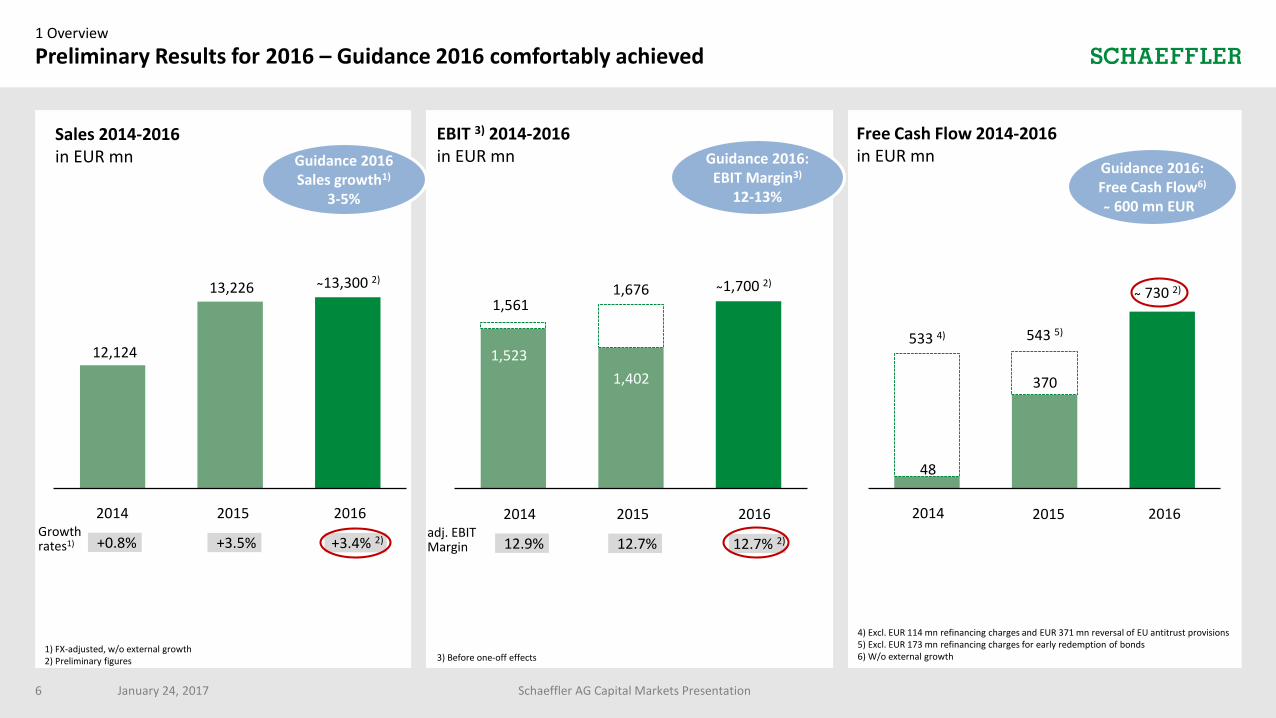
Preliminary Results for 2016 – Guidance 2016 comfortably achieved
Sales 2014-2016 in EUR mn
Growth rates1)
12,124
13,226 13,300 2)
201620152014
+0.8% +3.5% +3.4% 2)
1) FX-adjusted, w/o external growth2) Preliminary figures 3) Before one-off effects
4) Excl. EUR 114 mn refinancing charges and EUR 371 mn reversal of EU antitrust provisions5) Excl. EUR 173 mn refinancing charges for early redemption of bonds6) W/o external growth
adj. EBIT Margin
201620152014
12.9% 12.7% 12.7% 2)
EBIT 3) 2014-2016 in EUR mn
48
370
730 2)
533 4) 543 5)
201620152014
Free Cash Flow 2014-2016 in EUR mnGuidance 2016
Sales growth1)
3-5%
Guidance 2016:Free Cash Flow6)
600 mn EUR
Guidance 2016:EBIT Margin3)
12-13%
January 24, 2017 Schaeffler AG Capital Markets Presentation6
2 Strategy "Mobility for tomorrow"
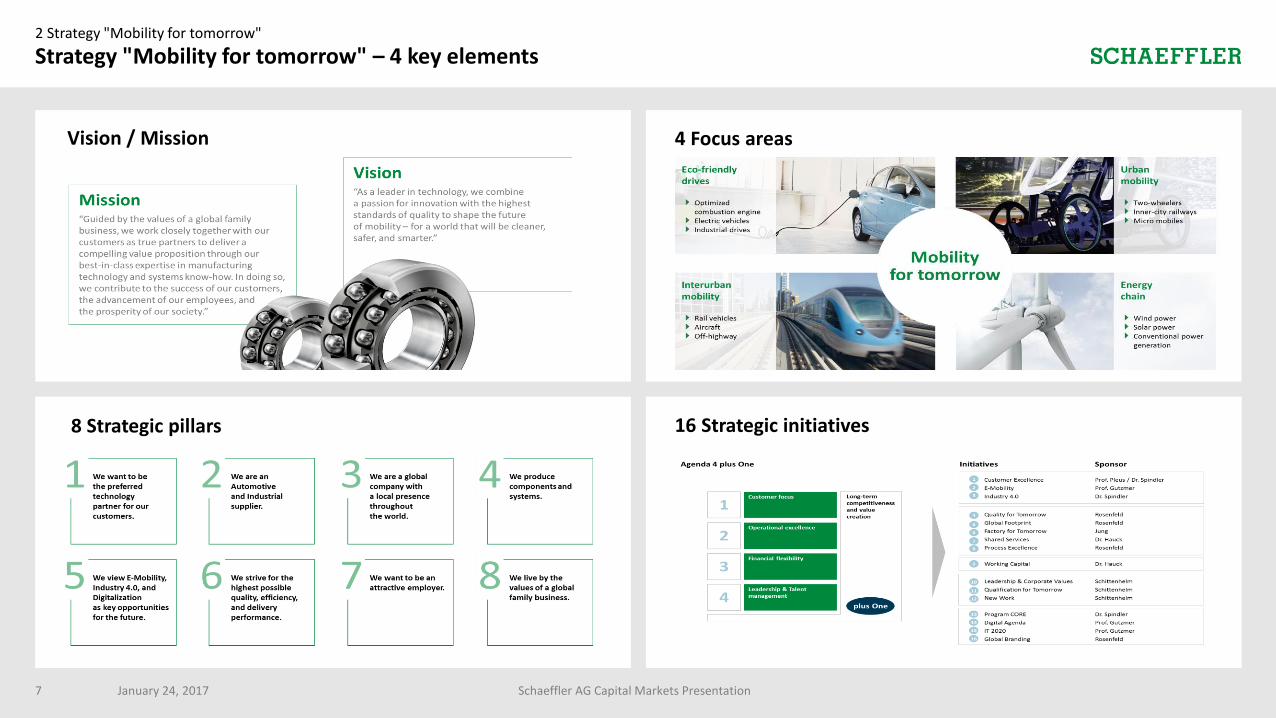
Strategy "Mobility for tomorrow" – 4 key elements
4 Focus areas
8 Strategic pillars 16 Strategic initiatives
Vision / Mission
January 24, 2017 Schaeffler AG Capital Markets Presentation7

2 Strategy "Mobility for tomorrow"
Financial Ambitions 2020 – Profitable growth and sustainable value creation
January 24, 2017 Schaeffler AG Capital Markets Presentation8
Financial Ambitions 2020
Automotive: Growth of global passenger car production around 2%
Industrial: Low single-digit growth of industrial production
Market assumptions
1) Net-debt to equity ratio (excluding pensions) 2) Payout ratio based on Net income
EBIT Margin
Sales Growth Ø 4-6% p.a. w/o external growth, FX-adjusted
Free Cash flow
Earnings per Share
Gearing ratio 1)
Dividend 2)
12-13% p.a.Before one-off effects, w/o external growth
~€ 2.00 per share in 2020w/o external growth
<75% in 2020
30-40% of Net income
~€ 900M in 2020w/o external growth
Profitable growth and sustainable value creation
3 Investment highlights
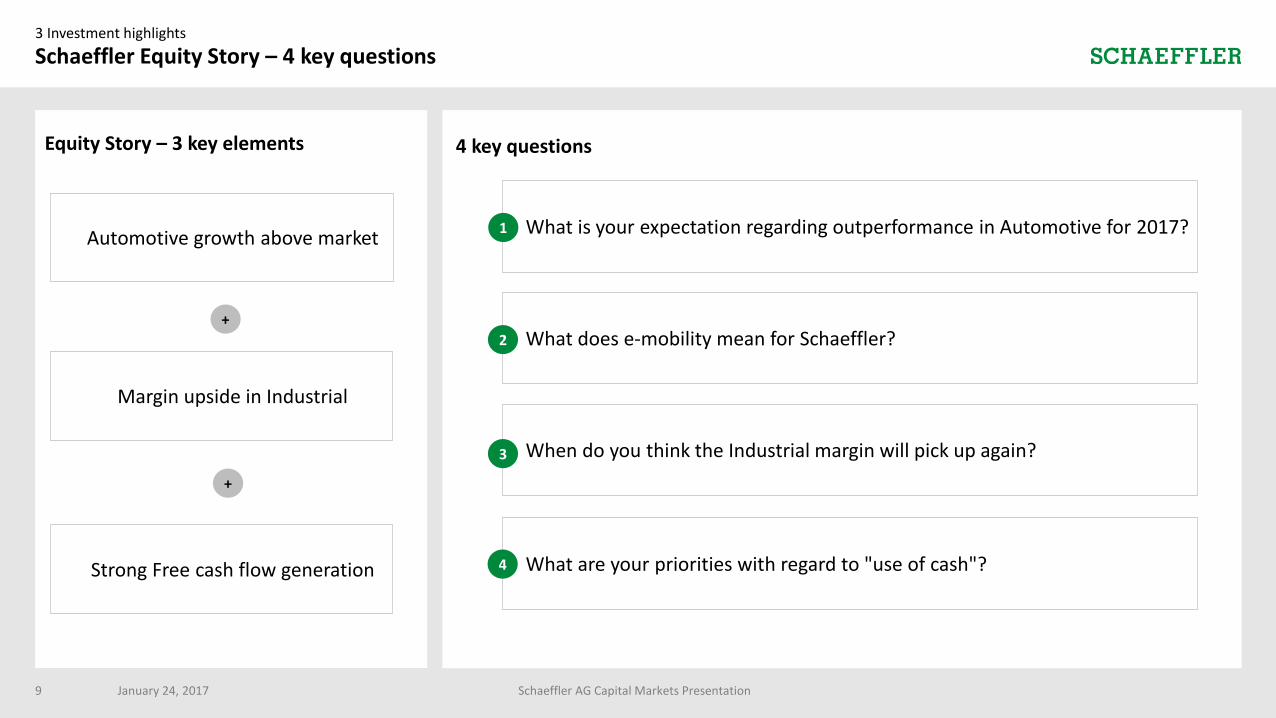
Schaeffler Equity Story – 4 key questions
January 24, 2017 Schaeffler AG Capital Markets Presentation9
Equity Story – 3 key elements
Automotive growth above market
Margin upside in Industrial
Strong Free cash flow generation
What is your expectation regarding outperformance in Automotive for 2017?1
What does e-mobility mean for Schaeffler?
When do you think the Industrial margin will pick up again?
What are your priorities with regard to "use of cash"?
3
2
4
4 key questions
+
+
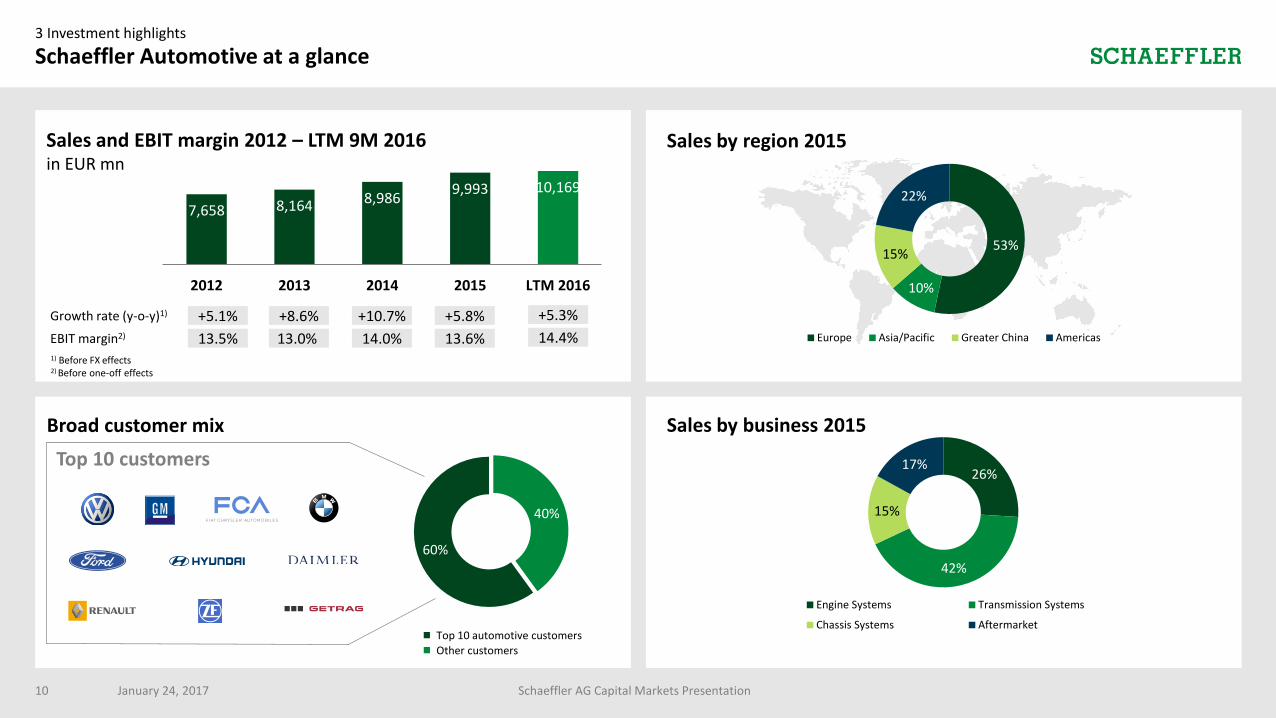
Sales and EBIT margin 2012 – LTM 9M 2016in EUR mn
3 Investment highlights
Sales by region 2015
Schaeffler Automotive at a glance
53%
10%
15%
22%
Europe Asia/Pacific Greater China Americas
7,658 8,164 8,9869,993 10,169
2012 2013 2014 2015 LTM 2016
Growth rate (y-o-y)1) +5.1% +8.6% +10.7% +5.8%
EBIT margin2) 13.5% 13.0% 14.0% 13.6%
Broad customer mix
Top 10 customers
40%
60%
Top 10 automotive customers
Other customers
Schaeffler AG Capital Markets PresentationJanuary 24, 2017
+5.3%
14.4%1) Before FX effects2) Before one-off effects
10
26%
42%
15%
17%
Engine Systems Transmission Systems
Chassis Systems Aftermarket
Sales by business 2015

3.8%
Outperformance 2010 – 9M 2016 Key aspects
3 Investment highlights
Outperformance Automotive 2016 – Below average
9M 2016
1.9%
2015
4.2%
2014
7.6%
2013
4.6%
2012
-0.9%
2011
10.8%
2010
28.8% 14.1% 5.1% 8.6% 10.7% 5.8% 5.3%
25.0% 3.3% 6.0% 4.0% 3.1% 1.6% 3.4%
1
Growth rateAutomotive 1)
1) Before FX effects2) Source: IHS
Light VehicleProduction2)
Historical outperformance 2010 – 9M 2016 above internal benchmark of plus 4%-pts
Above vehicle production in 2016 with strong 4th quarter
Schaeffler outperformance 9M 2016 1.9% due to:
Trucks effect: Truck sales is part of our total Automotive sales, weak markets dampening growth
Phase out effect: Phase-out of two projects affecting growth rate negatively in 2016
Americas mix effect: OEM stopped production of two small sedans as market was shifting to SUVs and light trucks
ø 2010 – 2015:+5%
Target: +4%-pts
above market
January 24, 2017 Schaeffler AG Capital Markets Presentation11
Indicative figures for illustration purposes
Q1 2016 Q2 2016 Q3 2016 9M 2016 Q4 2016 FY 2016
5.0% 5.8% 5.1% 5.3% to come to come
0.9% 2.8% 5.1% 3.4% 5.8% 4.4%
4.1% 3.0% 0.0% 1.9%
Growth rate Automotive 1)
Light Vehicle Production2)
Outperformance
2016 2017 2018 2019 2020
Booked Customer projects initiated New business
Indicative figures for illustration
purposes
3 Investment highlights
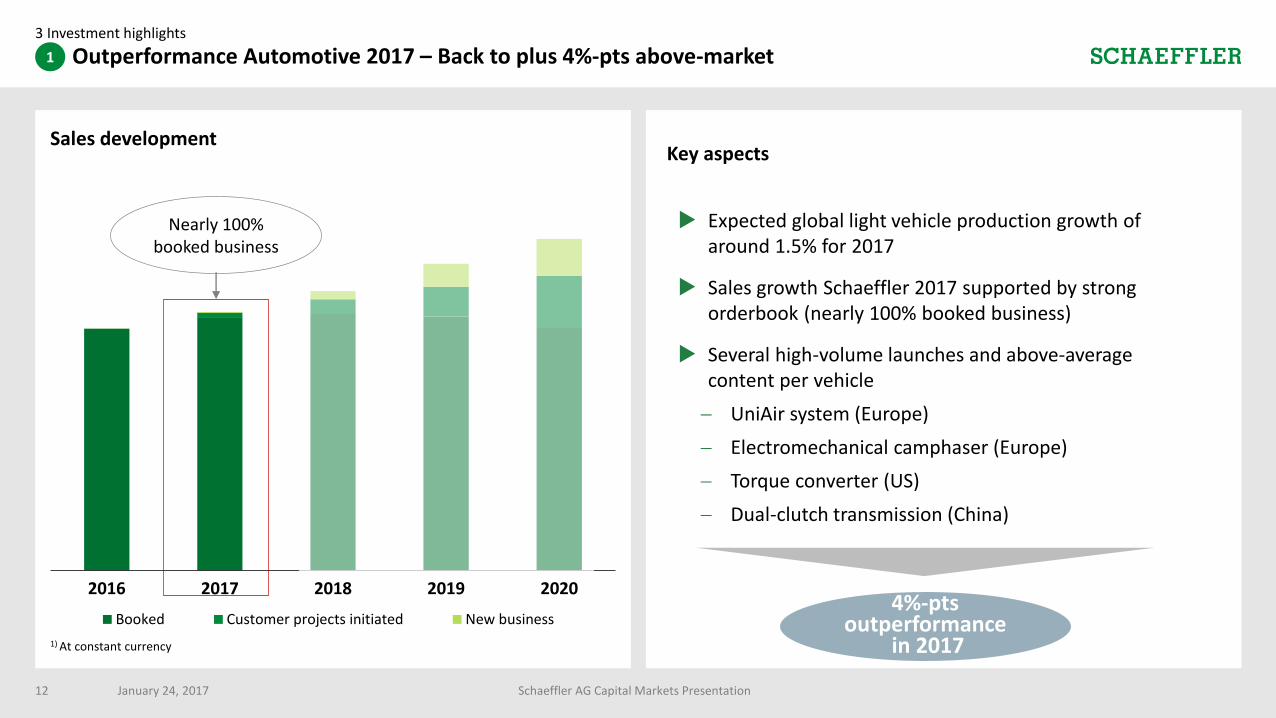
Outperformance Automotive 2017 – Back to plus 4%-pts above-market
January 24, 2017 Schaeffler AG Capital Markets Presentation12
Sales developmentKey aspects
Expected global light vehicle production growth of around 1.5% for 2017
Sales growth Schaeffler 2017 supported by strong orderbook (nearly 100% booked business)
Several high-volume launches and above-average content per vehicle
UniAir system (Europe)
Electromechanical camphaser (Europe)
Torque converter (US)
Dual-clutch transmission (China)
1) At constant currency
1
4%-ptsoutperformance
in 2017
Nearly 100% booked business
3 Investment highlights
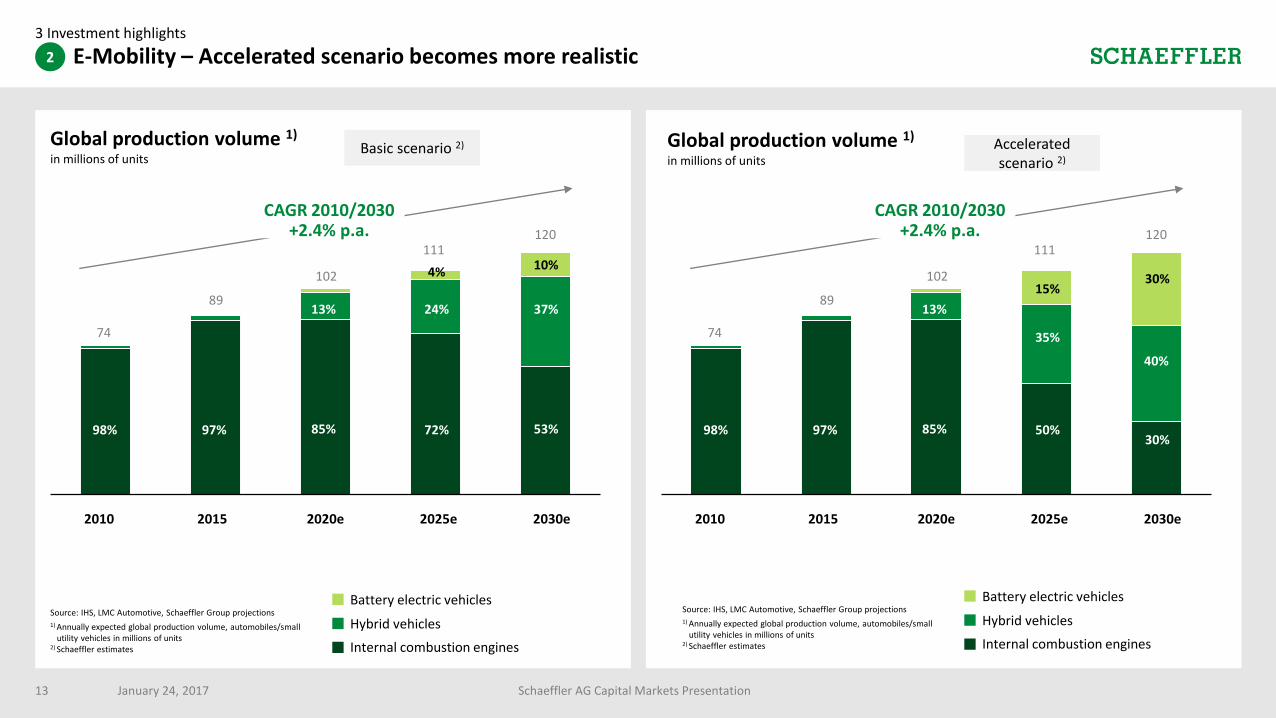
E-Mobility – Accelerated scenario becomes more realistic
January 24, 2017 Schaeffler AG Capital Markets Presentation
Global production volume 1)
in millions of units
Source: IHS, LMC Automotive, Schaeffler Group projections
2020e20152010 2030e2025e
1) Annually expected global production volume, automobiles/smallutility vehicles in millions of units
2) Schaeffler estimates
98% 97% 85% 72% 53%
13% 24% 37%
10%
Battery electric vehicles
Hybrid vehicles
Internal combustion engines
CAGR 2010/2030 +2.4% p.a.
4%
Basic scenario 2)
74
89
102
111120
2
2020e20152010 2030e2025e
98% 97% 85% 50%30%
13%
35%
40%
30%
CAGR 2010/2030 +2.4% p.a.
15%
74
89
102
111120
Accelerated scenario 2)
Source: IHS, LMC Automotive, Schaeffler Group projections1) Annually expected global production volume, automobiles/small
utility vehicles in millions of units2) Schaeffler estimates
Battery electric vehicles
Hybrid vehicles
Internal combustion engines
Global production volume 1)
in millions of units
13
Powertrain structure
Powertrain portfolio
Selected components1 + Electric Axles
Powertrain structure
Powertrain portfolio
Existing Schaeffler portfolio + Hybrid Module
Powertrain structure
Powertrain portfolio
Existing Schaeffler portfolio
3 Investment highlights
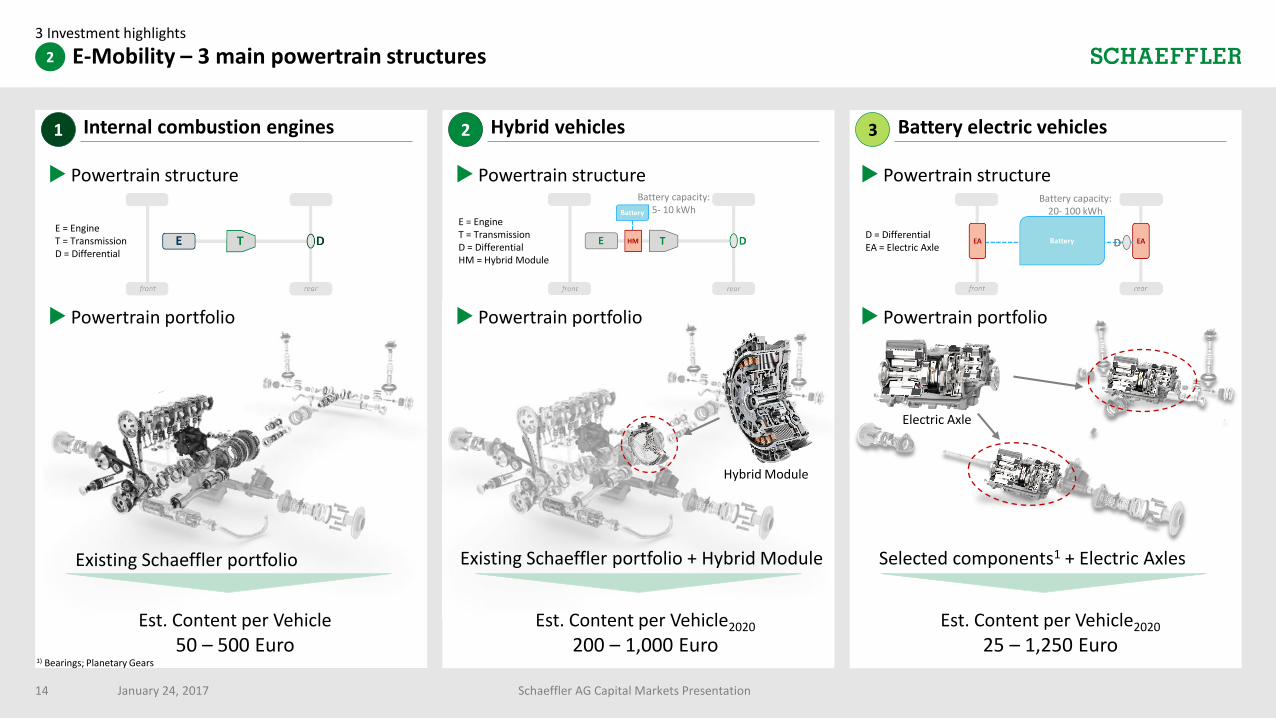
E-Mobility – 3 main powertrain structures
January 24, 2017 Schaeffler AG Capital Markets Presentation14
Internal combustion engines Hybrid vehicles Battery electric vehicles
E = EngineT = TransmissionD = Differential
E = EngineT = TransmissionD = DifferentialHM = Hybrid Module
D = DifferentialEA = Electric Axle
Battery capacity:5- 10 kWh
Battery capacity:20- 100 kWh
1) Bearings; Planetary Gears
1 2 3
Hybrid Module
Est. Content per Vehicle
50 – 500 EuroEst. Content per Vehicle2020
200 – 1,000 EuroEst. Content per Vehicle2020
25 – 1,250 Euro
Electric Axle
2
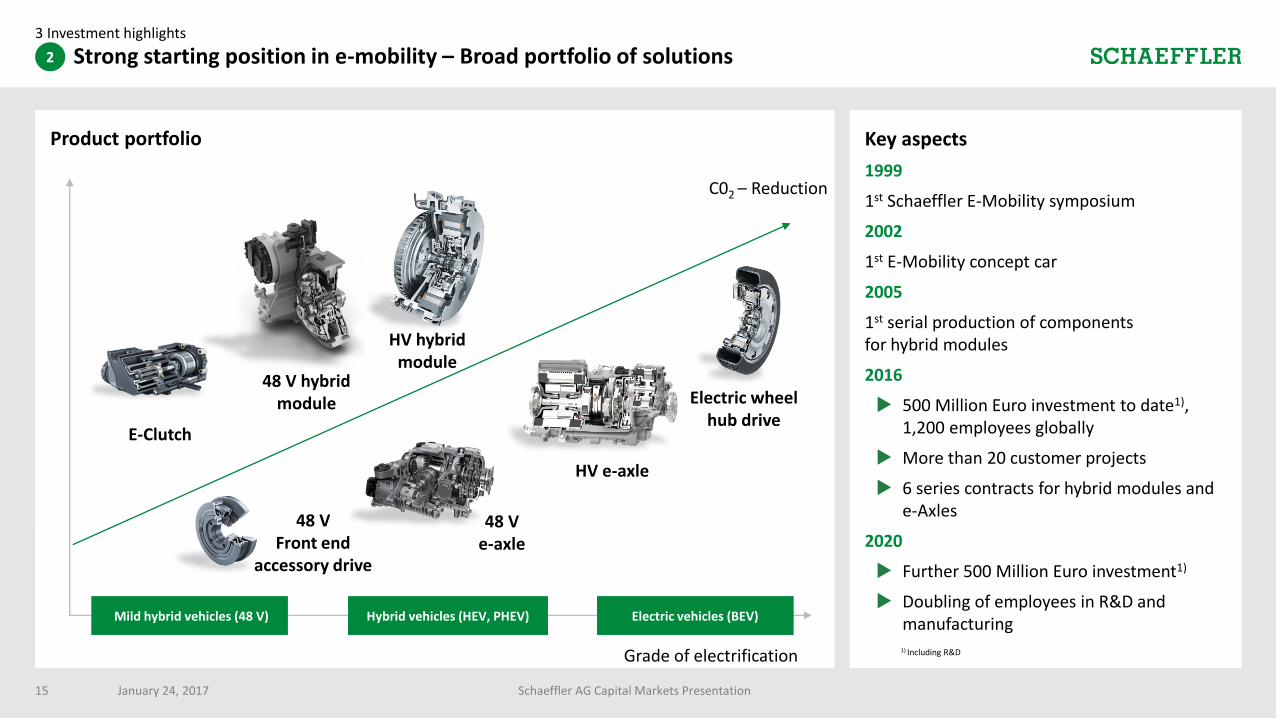
Strong starting position in e-mobility – Broad portfolio of solutions
Product portfolio
C02 – Reduction
Grade of electrification
E-Clutch
HV hybridmodule
HV e-axle
Electric wheelhub drive
48 V hybrid module
48 V e-axle
Mild hybrid vehicles (48 V) Hybrid vehicles (HEV, PHEV) Electric vehicles (BEV)
Key aspects
1999
1st Schaeffler E-Mobility symposium
2002
1st E-Mobility concept car
2005
1st serial production of componentsfor hybrid modules
2016
500 Million Euro investment to date1), 1,200 employees globally
More than 20 customer projects
6 series contracts for hybrid modules and e-Axles
2020
Further 500 Million Euro investment1)
Doubling of employees in R&D and manufacturing
48 V Front end
accessory drive
January 24, 2017 Schaeffler AG Capital Markets Presentation
1) Including R&D
3 Investment highlights
2
15

3 Investment highlights
January 24, 2017 Schaeffler AG Capital Markets Presentation
More than 20 customer projects – 6 series contracts
Hybrid Module withIntegrated Torque ConverterTier 1SOP Q4/2018
1-Gear Electric AxleFront + RearTier 1SOP Q3/2018
2-Gear Electric AxleRearTier 1SOP Q4/2017
Hybrid ModuleTier 1SOP Q1/2018
1-Gear Electric AxleFrontTier 1SOP Q3/2019
Americas Europe China
► 2 series contracts received
► More than 10 customerprojects ongoing
Hybrid Modules
► 4 series contracts received
► More than 10 customerproject ongoing
E-Axles
2
16

Compact Dynamics acquired – Broadening competence and scope
January 24, 2017 Schaeffler AG Capital Markets Presentation
Acquisition2
Cooperation3
Schaeffler acquires a 51% stake in Compact
Dynamics GmbH from SEMIKRON International
GmbH.
Closing expected in Q1 2017; call option for
remaining 49% stake until June 2018.
Compact Dynamics is a development specialist in
the field of innovative, electric drive concepts
At the same time, SEMIKRON and Schaeffler
establish a cooperation to develop power electronic
solutions for alternative drive concepts
SEMIKRON is a worldwide leader for innovative
power electronics
Schaeffler is significantly expending its expertise in
e-motors and power electronics
Quality, Technology and
Innovation
500 Million Euro investment to date1), 1,200 employees globally
More than 20 customer projects
6 series contracts for hybrid modules and e-axles
System and Powertrain Competence 1
HV E-Axle
2
3 Investment highlights
17
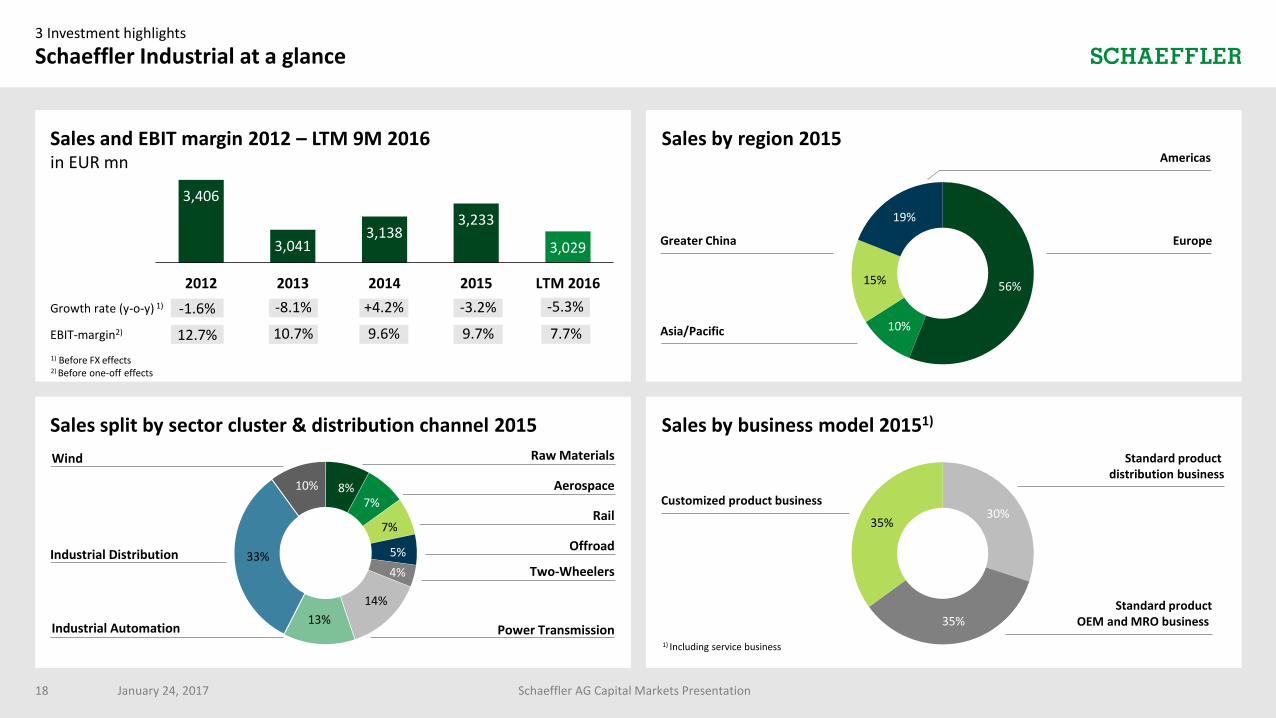
3,406
3,0413,138
3,233
3,029
2012 2013 2014 2015 LTM 2016
+3.0%-5.3%
7.7%
Sales by region 2015Sales and EBIT margin 2012 – LTM 9M 2016in EUR mn
3 Investment highlights
Schaeffler Industrial at a glance
Sales split by sector cluster & distribution channel 2015
-1.6% -8.1% +4.2% -3.2%Growth rate (y-o-y) 1)
12.7% 10.7% 9.6% 9.7%EBIT-margin2)
1) Before FX effects2) Before one-off effects
56%
10%
15%
19%
Greater China
Americas
Europe
Asia/Pacific
Schaeffler AG Capital Markets Presentation
10%
13%
14%
8%7%
7%
5%
4%33%
Power Transmission
Two-Wheelers
Offroad
Rail
Aerospace
Raw Materials
Industrial Distribution
Wind
Industrial Automation
January 24, 2017
Sales by business model 20151)
1) Including service business
30%
35%
35%
Customized product business
Standard productOEM and MRO business
Standard product distribution business
18
3 Investment highlights
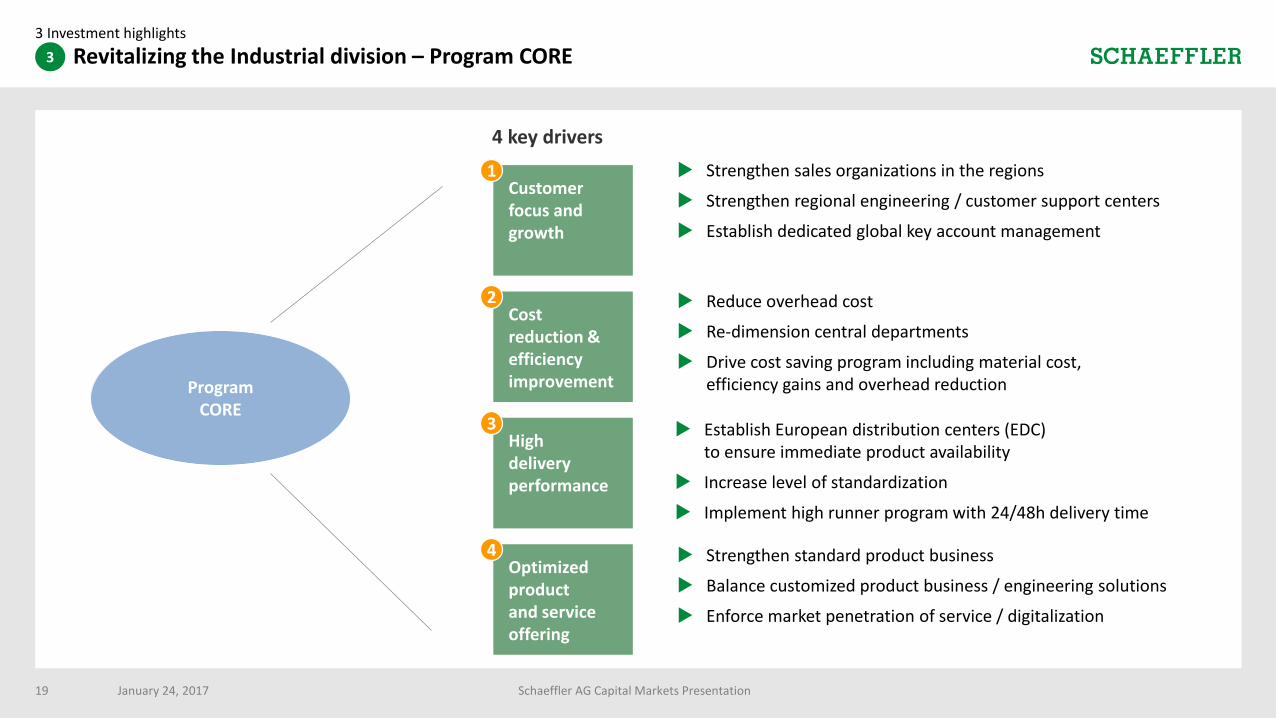
Revitalizing the Industrial division – Program CORE
ProgramCORE
Customer focus and growth
1
4 key drivers
Cost reduction &efficiency improvement
2
High deliveryperformance
3
Optimized product and service offering
4
Reduce overhead cost
Re-dimension central departments
Drive cost saving program including material cost,efficiency gains and overhead reduction
Establish European distribution centers (EDC)to ensure immediate product availability
Increase level of standardization
Implement high runner program with 24/48h delivery time
Strengthen standard product business
Balance customized product business / engineering solutions
Enforce market penetration of service / digitalization
Strengthen sales organizations in the regions
Strengthen regional engineering / customer support centers
Establish dedicated global key account management
January 24, 2017 Schaeffler AG Capital Markets Presentation
3
19
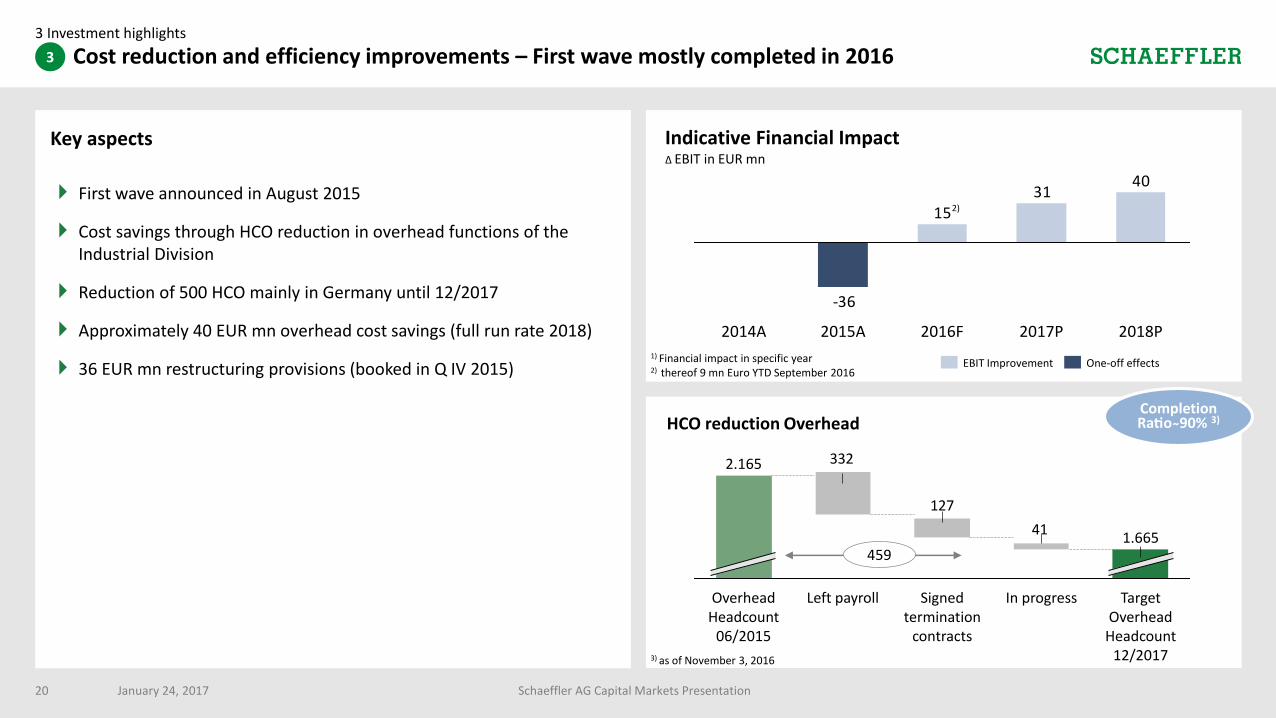
Cost reduction and efficiency improvements – First wave mostly completed in 2016
Key aspects
First wave announced in August 2015
Cost savings through HCO reduction in overhead functions of the Industrial Division
Reduction of 500 HCO mainly in Germany until 12/2017
Approximately 40 EUR mn overhead cost savings (full run rate 2018)
36 EUR mn restructuring provisions (booked in Q IV 2015)
-36
4031
15
2018P2017P2016F2015A2014A
41
127
332
Target Overhead
Headcount 12/2017
1.665
Signed termination
contracts
Left payrollOverhead Headcount
06/2015
2.165
In progress
HCO reduction OverheadCompletion Ratio 90% 3)
1) Financial impact in specific year 2) thereof 9 mn Euro YTD September 2016
459
EBIT Improvement One-off effects
3) as of November 3, 2016
2)
Indicative Financial Impact Δ EBIT in EUR mn
January 24, 2017 Schaeffler AG Capital Markets Presentation
3 Investment highlights
3
20
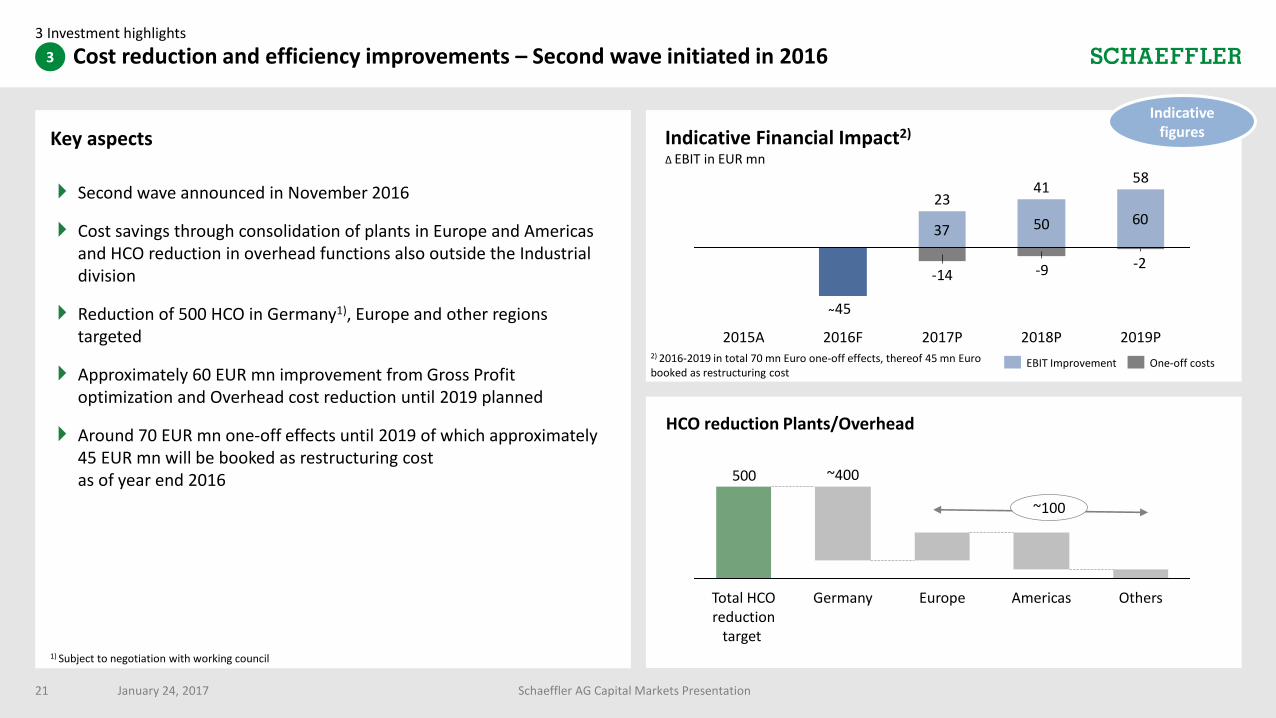
Cost reduction and efficiency improvements – Second wave initiated in 2016
Key aspects
1) Subject to negotiation with working council
37 50 60
-2-9-14
2019P
58
2018P
41
2017P
23
2016F
45
2015A
Indicative Financial Impact2)
Δ EBIT in EUR mn
One-off costsEBIT Improvement
HCO reduction Plants/Overhead
500
OthersAmericasEuropeGermanyTotal HCO reduction
target
~400
~100
Second wave announced in November 2016
Cost savings through consolidation of plants in Europe and Americas and HCO reduction in overhead functions also outside the Industrial division
Reduction of 500 HCO in Germany1), Europe and other regions targeted
Approximately 60 EUR mn improvement from Gross Profit optimization and Overhead cost reduction until 2019 planned
Around 70 EUR mn one-off effects until 2019 of which approximately45 EUR mn will be booked as restructuring costas of year end 2016
2) 2016-2019 in total 70 mn Euro one-off effects, thereof 45 mn Euro booked as restructuring cost
January 24, 2017 Schaeffler AG Capital Markets Presentation
3 Investment highlights
3
21
Indicative figures
3 Investment highlights
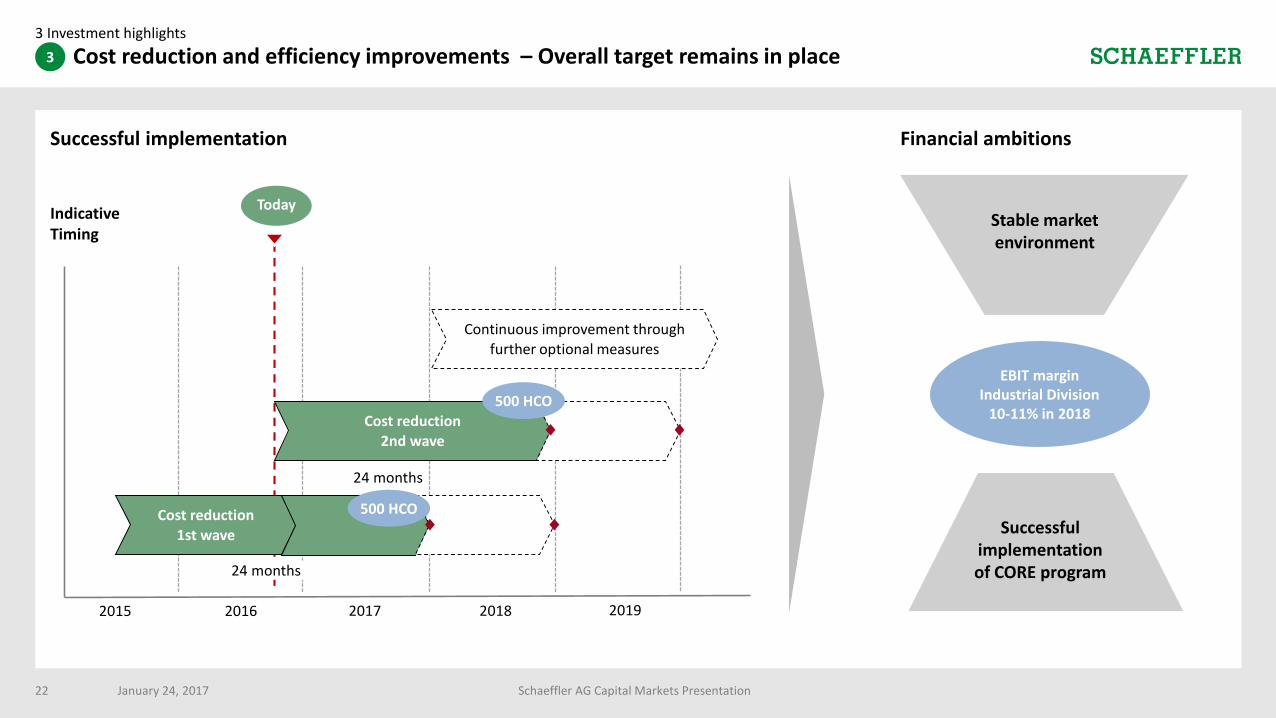
Cost reduction and efficiency improvements – Overall target remains in place
Successful implementation Financial ambitions
2015 2016 2017 2018
Today
2019
Indicative Timing
Cost reduction
1st wave
24 months
24 months
500 HCO
Cost reduction 2nd wave
Continuous improvement through further optional measures
500 HCO
Stable market environment
Successfulimplementation of CORE program
EBIT margin Industrial Division
10-11% in 2018
January 24, 2017 Schaeffler AG Capital Markets Presentation
3
22

Customer focus and growth – New business picking up3 Investment highlights
Sectors and products
E-locomotive
Tapered and cylindrical roller bearing with ceramic coating; TAROL for Wheelset and Axle box housing
Supplier network
Sectors and products
Aerospace engine
Bearings and components for key engine programs;Main shaft and gearbox bearings
Supplier network
Sectors and products
Wind turbine
Durotect B coated spherical roller bearing with WPOS
Supplier network
Signed 12/2016
10-year contract Two-digit Euro mn
Signed 12/2016
5-year contract Three-digit Euro mn
Signed 09/2016
1-year contract Two-digit Euro mn
Railway Wind Aerospace
January 24, 2017 Schaeffler AG Capital Markets Presentation
3
Example 1 Example 2 Example 3
23
3 Investment highlights
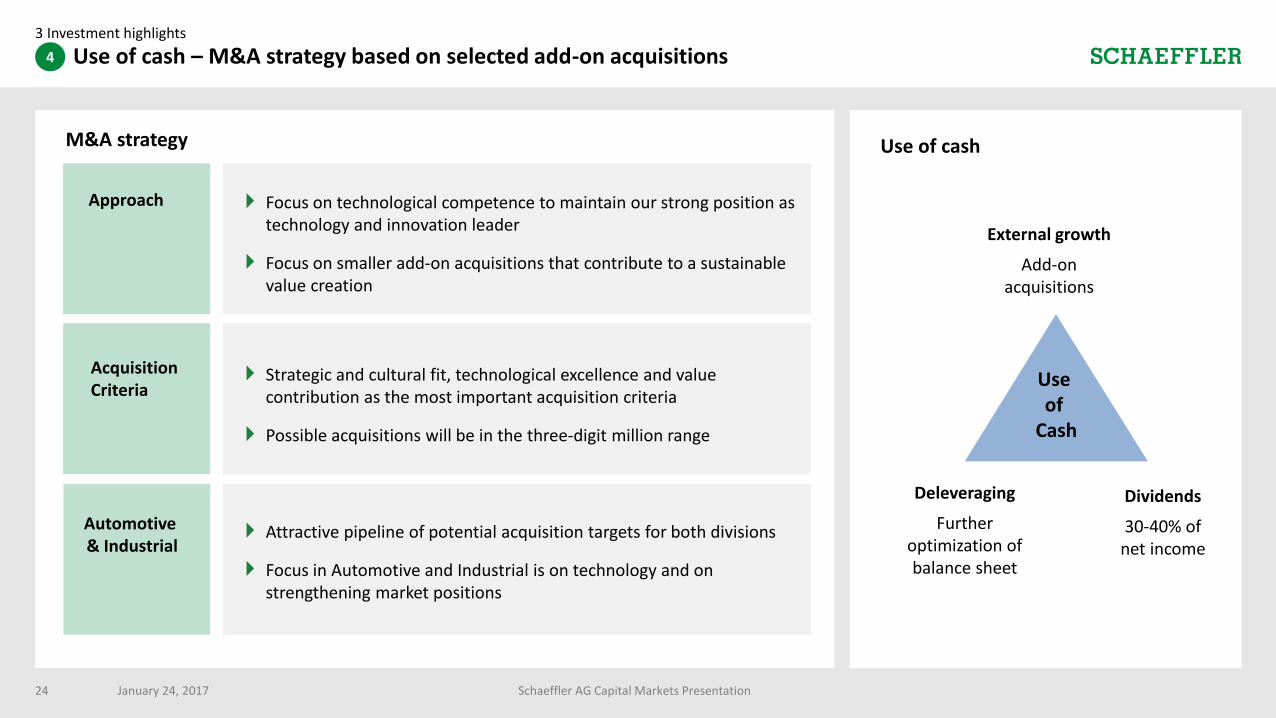
Use of cash – M&A strategy based on selected add-on acquisitions
Dividends
30-40% of net income
Use of cash
External growth
Add-on acquisitions
Deleveraging
Further optimization of balance sheet
Use of
Cash
Strategic and cultural fit, technological excellence and value contribution as the most important acquisition criteria
Possible acquisitions will be in the three-digit million range
Approach
Acquisition Criteria
Automotive& Industrial
Focus on technological competence to maintain our strong position as technology and innovation leader
Focus on smaller add-on acquisitions that contribute to a sustainable value creation
Attractive pipeline of potential acquisition targets for both divisions
Focus in Automotive and Industrial is on technology and on strengthening market positions
M&A strategy
January 24, 2017 Schaeffler AG Capital Markets Presentation
4
24
4 Outlook and Summary
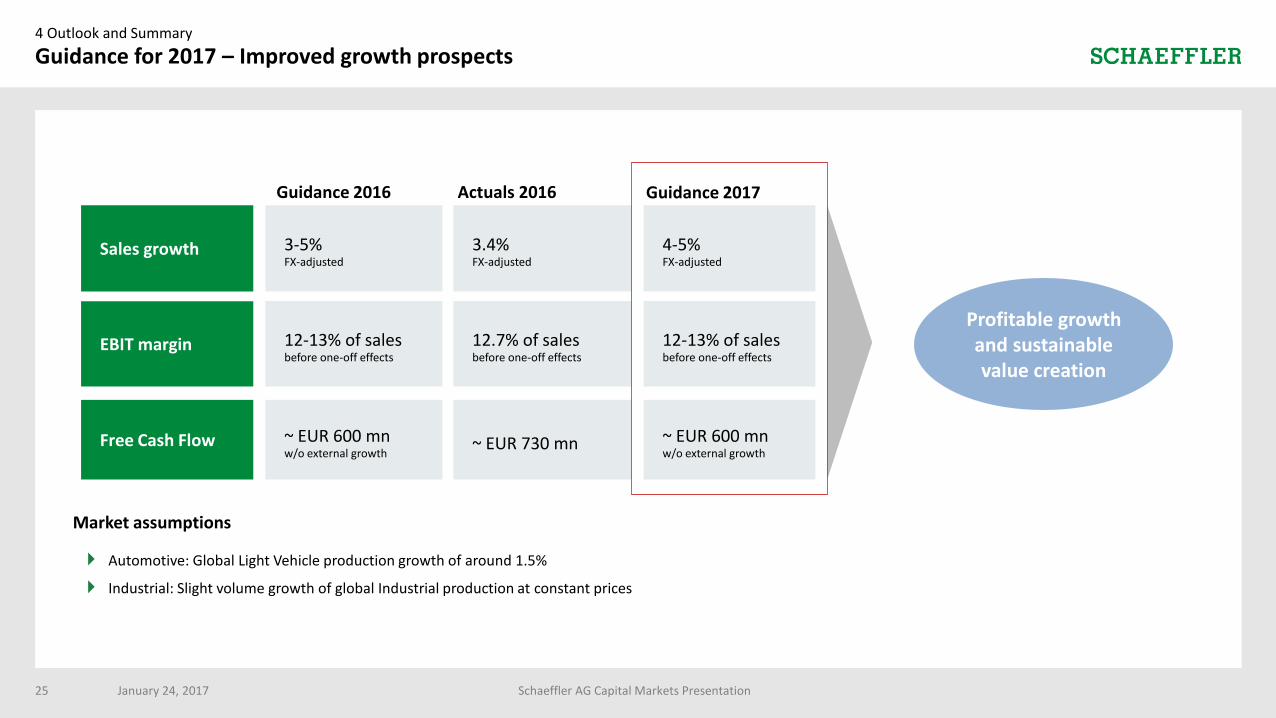
Guidance for 2017 – Improved growth prospects
Automotive: Global Light Vehicle production growth of around 1.5%
Industrial: Slight volume growth of global Industrial production at constant prices
EBIT margin 12-13% of salesbefore one-off effects
Sales growth 4-5%FX-adjusted
Free Cash Flow ~ EUR 600 mnw/o external growth
Market assumptions
Profitable growth and sustainable value creation
12.7% of salesbefore one-off effects
3.4%FX-adjusted
~ EUR 730 mn
Guidance 2017Guidance 2016 Actuals 2016
January 24, 2017 Schaeffler AG Capital Markets Presentation25
12-13% of salesbefore one-off effects
3-5%FX-adjusted
~ EUR 600 mnw/o external growth
4 Outlook and Summary
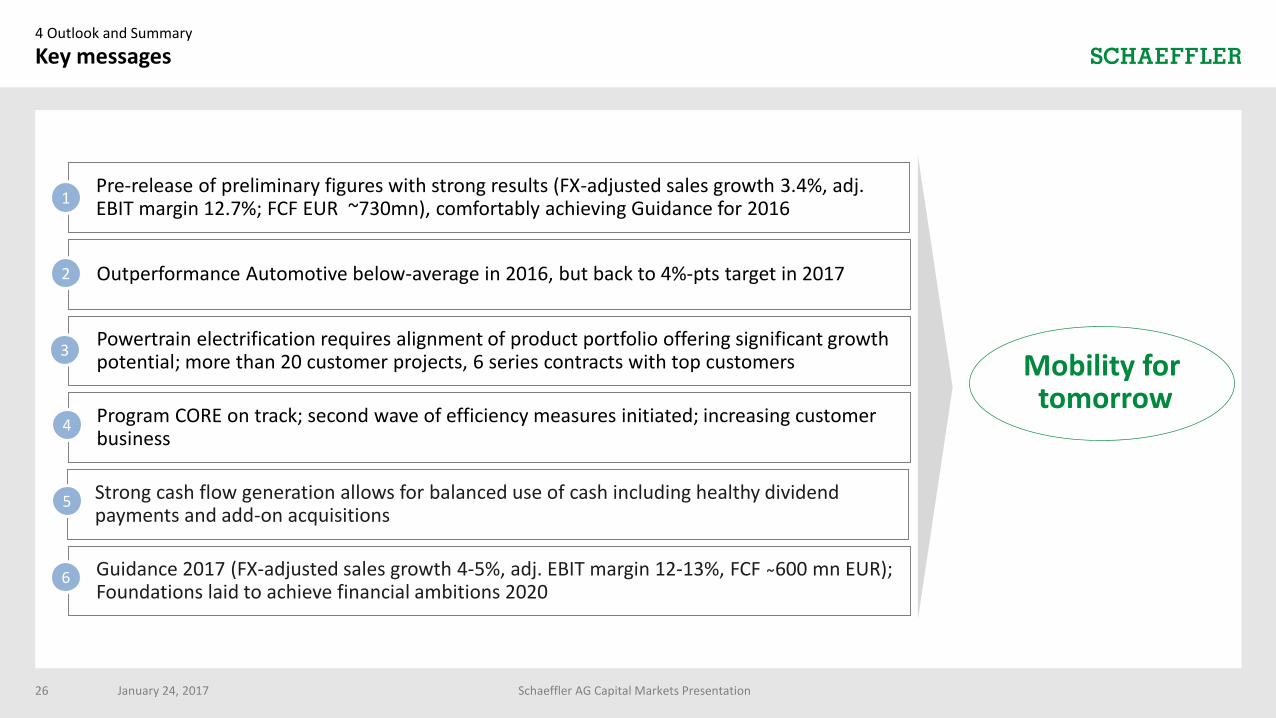
Key messages
Pre-release of preliminary figures with strong results (FX-adjusted sales growth 3.4%, adj. EBIT margin 12.7%; FCF EUR ~730mn), comfortably achieving Guidance for 2016
Outperformance Automotive below-average in 2016, but back to 4%-pts target in 2017
Powertrain electrification requires alignment of product portfolio offering significant growth potential; more than 20 customer projects, 6 series contracts with top customers
Program CORE on track; second wave of efficiency measures initiated; increasing customer business
1
3
2
4
Mobility fortomorrow
January 24, 2017 Schaeffler AG Capital Markets Presentation26
Strong cash flow generation allows for balanced use of cash including healthy dividend payments and add-on acquisitions
5
Guidance 2017 (FX-adjusted sales growth 4-5%, adj. EBIT margin 12-13%, FCF 600 mn EUR); Foundations laid to achieve financial ambitions 2020
6
Investor Relations
Phone: + 49 9132 82 4440
Email: [email protected]
Web: www.schaeffler.com/ir
Financial Calendar
FY 2016 results: March 8, 2017
Q1 2017 results: May 11, 2017
H1 2017 results: August 8, 2017
9M 2017 results: November 8, 2017
January 24, 2017 Schaeffler AG Capital Markets Presentation
IR Contact
27