Scanning electron microscopy, cathodoluminescence, and ... · Scanning electron microscopy,...
11
Meteoritics & Planetary Science 38, Nr 8, 1187–1197 (2003) Abstract available online at http://meteoritics.org 1187 © Meteoritical Society, 2003. Printed in USA. Scanning electron microscopy, cathodoluminescence, and Raman spectroscopy of experimentally shock-metamorphosed quartzite Arnold GUCSIK, 1 Christian KOEBERL, 1* Franz BRANDSTÄTTER, 2 Eugen LIBOWITZKY, 3 and Wolf Uwe REIMOLD 4 1 Department of Geological Sciences, University of Vienna, Althanstrasse 14, A-1090 Vienna, Austria 2 Department of Mineralogy, Natural History Museum, P.O. Box 417, A-1014 Vienna, Austria 3 Institute of Mineralogy and Crystallography, University of Vienna, Althanstrasse 14, A-1090 Vienna, Austria 4 Impact Cratering Research Group, School of Geosciences, University of Witwatersrand, Private Bag 3, P.O. 2050, Johannesburg, South Africa * Corresponding author. E-mail: [email protected] (Received 30 December 2002; revision accepted 8 July 2003) Abstract–We studied unshocked and experimentally (at 12, 25, and 28 GPa, with 25, 100, 450, and 750°C pre-shock temperatures) shock-metamorphosed Hospital Hill quartzite from South Africa using cathodoluminescence (CL) images and spectroscopy and Raman spectroscopy to document systematic pressure or temperature-related effects that could be used in shock barometry. In general, CL images of all samples show CL-bright luminescent patchy areas and bands in otherwise non- luminescent quartz, as well as CL-dark irregular fractures. Fluid inclusions appear dominant in CL images of the 25 GPa sample shocked at 750°C and of the 28 GPa sample shocked at 450°C. Only the optical image of our 28 GPa sample shocked at 25°C exhibits distinct planar deformation features (PDFs). Cathodoluminescence spectra of unshocked and experimentally shocked samples show broad bands in the near-ultraviolet range and the visible light range at all shock stages, indicating the presence of defect centers on, e.g., SiO 4 groups. No systematic change in the appearance of the CL images was obvious, but the CL spectra do show changes between the shock stages. The Raman spectra are characteristic for quartz in the unshocked and 12 GPa samples. In the 25 and 28 GPa samples, broad bands indicate the presence of glassy SiO 2 , while high-pressure polymorphs are not detected. Apparently, some of the CL and Raman spectral properties can be used in shock barometry. INTRODUCTION Cathodoluminescence (CL) is an optical phenomenon that is based on the generation of visible radiation through sample excitation by high-energy electrons (in general, with energies of the incident beam of 5–25 kV, the depth of penetration is 1–3 mm). Wavelengths of the cathodoluminescence emissions range from the ultraviolet (UV) to the infrared (IR) and result from a variety of defects (e.g., various structural imperfections such as poor ordering, radiation damage, and shock damage) and impurities in the crystal structure of a mineral (Marshall 1988; Hayward 1998). Luminescence can have 2 causes: intrinsic CL, which is characteristic of the host material, and extrinsic CL, which results from impurities. 1) Intrinsic luminescence is enhanced by vacancies, poor ordering, radiation damage, and shock damage as structural imperfections and impurities (non- activators), which distort the crystal lattice (Marshall 1988). 2) Extrinsic luminescence is caused by impurities or activator elements, which are also referred to as sensitizers. Their presence is necessary to create a luminescence center with an activator mineral (Marshall 1988; Hayward 1998). It is important to note that quenchers, such as Fe 3+ , Fe 2+ , and Co 2+ , show broad and intense charge transfer bands in the absorption spectrum and cause quenching of the luminescence of activators with interfering emission bands (Marshall 1988; Hayward 1998). So far, no systematic study has been made regarding the changes of CL properties (optical appearance in CL images and the characteristics of CL spectra) with shock pressure in quartz, although CL petrography of impact-related carbonates has been described (Fouke et al. 2002). As quartz is one of the most common rock-forming minerals, for which ample information on shock-related changes of a large variety of mineralogical, crystallographic, and petrographic parameters exists (e.g., Stöffler and Langenhorst 1994; Langenhorst and
Transcript of Scanning electron microscopy, cathodoluminescence, and ... · Scanning electron microscopy,...
Meteoritics & Planetary Science 38, Nr 8, 1187–1197 (2003)Abstract available online at http://meteoritics.org
1187 © Meteoritical Society, 2003. Printed in USA.
Scanning electron microscopy, cathodoluminescence, and Raman spectroscopy of experimentally shock-metamorphosed quartzite
Arnold GUCSIK,1 Christian KOEBERL,1* Franz BRANDSTÄTTER,2
Eugen LIBOWITZKY,3 and Wolf Uwe REIMOLD4
1Department of Geological Sciences, University of Vienna, Althanstrasse 14, A-1090 Vienna, Austria2Department of Mineralogy, Natural History Museum, P.O. Box 417, A-1014 Vienna, Austria
3Institute of Mineralogy and Crystallography, University of Vienna, Althanstrasse 14, A-1090 Vienna, Austria4Impact Cratering Research Group, School of Geosciences, University of Witwatersrand, Private Bag 3,
P.O. 2050, Johannesburg, South Africa*Corresponding author. E-mail: [email protected]
(Received 30 December 2002; revision accepted 8 July 2003)
Abstract–We studied unshocked and experimentally (at 12, 25, and 28 GPa, with 25, 100, 450, and750°C pre-shock temperatures) shock-metamorphosed Hospital Hill quartzite from South Africausing cathodoluminescence (CL) images and spectroscopy and Raman spectroscopy to documentsystematic pressure or temperature-related effects that could be used in shock barometry. In general,CL images of all samples show CL-bright luminescent patchy areas and bands in otherwise non-luminescent quartz, as well as CL-dark irregular fractures. Fluid inclusions appear dominant in CLimages of the 25 GPa sample shocked at 750°C and of the 28 GPa sample shocked at 450°C. Only theoptical image of our 28 GPa sample shocked at 25°C exhibits distinct planar deformation features(PDFs). Cathodoluminescence spectra of unshocked and experimentally shocked samples showbroad bands in the near-ultraviolet range and the visible light range at all shock stages, indicating thepresence of defect centers on, e.g., SiO4 groups. No systematic change in the appearance of the CLimages was obvious, but the CL spectra do show changes between the shock stages. The Ramanspectra are characteristic for quartz in the unshocked and 12 GPa samples. In the 25 and 28 GPasamples, broad bands indicate the presence of glassy SiO2, while high-pressure polymorphs are notdetected. Apparently, some of the CL and Raman spectral properties can be used in shock barometry.
INTRODUCTION
Cathodoluminescence (CL) is an optical phenomenonthat is based on the generation of visible radiation throughsample excitation by high-energy electrons (in general, withenergies of the incident beam of 5–25 kV, the depth ofpenetration is 1–3 mm). Wavelengths of thecathodoluminescence emissions range from the ultraviolet(UV) to the infrared (IR) and result from a variety of defects(e.g., various structural imperfections such as poor ordering,radiation damage, and shock damage) and impurities in thecrystal structure of a mineral (Marshall 1988; Hayward 1998).
Luminescence can have 2 causes: intrinsic CL, which ischaracteristic of the host material, and extrinsic CL, whichresults from impurities. 1) Intrinsic luminescence is enhancedby vacancies, poor ordering, radiation damage, and shockdamage as structural imperfections and impurities (non-activators), which distort the crystal lattice (Marshall 1988).
2) Extrinsic luminescence is caused by impurities or activatorelements, which are also referred to as sensitizers. Theirpresence is necessary to create a luminescence center with anactivator mineral (Marshall 1988; Hayward 1998). It isimportant to note that quenchers, such as Fe3+, Fe2+, and Co2+,show broad and intense charge transfer bands in theabsorption spectrum and cause quenching of theluminescence of activators with interfering emission bands(Marshall 1988; Hayward 1998).
So far, no systematic study has been made regarding thechanges of CL properties (optical appearance in CL imagesand the characteristics of CL spectra) with shock pressure inquartz, although CL petrography of impact-related carbonateshas been described (Fouke et al. 2002). As quartz is one of themost common rock-forming minerals, for which ampleinformation on shock-related changes of a large variety ofmineralogical, crystallographic, and petrographic parametersexists (e.g., Stöffler and Langenhorst 1994; Langenhorst and

1188 A. Gucsik et al.
Deutsch 1994; Grieve et al. 1996; Huffman and Reimold1996), we undertook such an investigation.
The CL luminescence emission in the unshocked quartzmight be associated with defect structures. The silicon dioxidestructure is modified by different types of defect structures(impurities, vacancies, etc.), which occur in the short rangeorder. Hence, similar types of defects are found in crystallineand amorphous polymorphs of silicon dioxide (StevensKalceff et al. 2000, and references therein). Generally, theluminescence of quartz shows different CL colors dependingon its origin. CL studies have been performed on fracturedquartz (e.g., Milliken and Laubach 2000, and referencestherein) and for provenance studies (e.g., Ramseyer andMullis 2000; Götze et al. 2001, and references therein).Serebrennikov et al. (1982) studied thermoluminescenceproperties of shocked quartz, but previous work on CLproperties of shocked quartz is limited. Owen and Anders(1988), in a pioneering study, showed that quartz fromintrusive igneous and high-grade metamorphic rock showsdarker purple-blue CL, while quartz from low-grademetamorphic rocks exhibits reddish-brown CL, and thatshocked quartz from the Cretaceous-Tertiary (K/T) boundaryexhibits CL colors similar to those of low-grade metamorphicquartz. Owen and Anders (1988) used these observations todemonstrate that shocked quartz from the K/T boundary wasnot derived from volcanic sources. At that time (1988), thiswas an important contribution to the study of the thencontroversial origin of the K/T boundary. Ramseyer et al.(1992) reported CL luminescence changes for quartz andfeldspar from the granitic rocks of the Siljan impact structure,Sweden, and related their findings to complex alteration of theminerals during a post-impact hydrothermal overprint.Seyedolali et al. (1997) reported CL studies of shocked quartzgrains from the Mjølnir impact structure (Barents Sea) incomparison with quartz from a variety of other sources. Theseauthors studied patterns of variable-intensity CL, includingzoning, healed fractures, complex fractures, complex shears,and planar microdeformations from different source rocksusing a combined scanning electron microscopy (SEM)-CLfabric-analysis technique. Ramseyer and Mullis (2000) brieflynoted that quartz affected by meteorite impact or lightning ischaracterized by red CL of about 630 nm, but they do not giveany detailed information.
More recently, Boggs et al. (2001) studied planardeformation features (PDFs) in shocked quartz from the Riescrater, Germany, using a SEM-CL imaging facility. Theyfound that (in contrast to planar microstructures associatedwith tectonic fracturing) these features are filled byamorphous silica and appear as dark lines in the CL images,which indicates the absence of recombination centers for theemission of photons.
Micro-Raman spectroscopy is a technique that providesinformation on molecular vibrations (lattice vibrations in acrystal) from relatively small sample volumes (comparable to
that analyzed by an electron microprobe). The resultingspectral bands depend upon the crystal structure (with itssymmetry), the vibrating atoms (with their masses), and theforces between them. Well-crystallized quartz shows anumber of vibrational bands between 128 and 1163 cm-1 thatare localized in specific regions (Etchepare et al. 1974), i.e.,>1050 and 700–800 cm-1 (Si-O stretching modes), 350–500cm-1 (O-Si-O bending modes), and <300 cm-1 (Si-O-Sibending and torsional/twisting modes). Note that the Ramanspectra of quartz are dominated by only one intense band at~464 cm-1 (beside weaker bands), whereas IR spectra showintense bands both in the stretching and O-Si-O bendingregions.
The study of Raman properties of unshocked andexperimentally shock-deformed minerals (e.g., quartz) hasthe potential to provide a tool that can be used in shockbarometry and to supplement the methods available so far,i.e., optical microscopy, X-ray, and density measurements(cf., Stöffler and Langenhorst 1994). Micro-Ramanspectroscopy is, by now, a fairly routine technique that is nottoo complicated in its use (unlike the Nuclear MagneticResonance [NMR] technique; see, e.g., Cygan et al. 1990).Identification of a Raman spectroscopic method that wouldallow one to: a) identify shocked minerals, and b) giveinformation on the shock pressure would be useful for theidentification and study of impact structures.
However, only a few Raman studies on shockmetamorphosed minerals from impact environments havebeen carried out so far. McMillan et al. (1992) were the first tostudy shocked quartz with Raman bulk methods.Champagnon et al. (1996) investigated quartz that wasexperimentally shocked in the range of 22 to 32 GPa bymicro-Raman spectroscopy. However, some studies ofglasses and of high-pressure polymorphs of quartz exist (cf.,Boyer et al. 1985) that are relevant to impact studies. Theseinclude the investigation of the Raman properties of coesitefrom the Vredefort dome, South Africa (Halvorson andMcHone 1992), coesite in suevite from the Chicxulub impactstructure, Mexico (Lounejeva et al. 2002; Ostroumov et al.2002), natural and synthetic coesite (Boyer et al. 1985), thecoesite-stishovite transition (e.g., Serghiou et al. 1995), thedensification behavior of silica glasses in shock experiments(Okuno et al. 1999), and tektites and impact glasses (Faulqueset al. 2001)
The pre-shock temperature of the target rock alsoinfluences the formation and crystallographic orientation ofPDFs. Reimold (1988), Huffman et al. (1993), and Huffmanand Reimold (1996) presented the results of shockexperiments with quartzite and granite at room temperature(25°C) and preheated to 450°C and 750°C. They noticed adistinct difference in the relative abundances of the {1013}and {1012} orientations and a large difference in the numberof sets of PDFs per grain. Langenhorst et al. (1992) andLangenhorst and Deutsch (1994) used oriented single crystal
Scanning electron microscopy, cathodoluminescence, and Raman spectroscopy 1189
quartz samples at pressures of 20 to 40 GPa and temperaturesof 20, 275, 540 and 630°C. They observed that developmentof PDFs and their orientation is a function of peak pressure,pre-shock temperature, and orientation of the crystal structurerelative to the propagation direction of the shock wave.
Here, we present the results of cathodoluminescence (CL)and Raman spectroscopic observations obtained onexperimentally shocked and partly preheated quartzitesamples (Hospital Hill quartzite, Witwatersrand, SouthAfrica). The purpose of this investigation is to explore thecapability of the SEM-CL/micro-Raman technique todocument shock effects and to determine whether CL effects inquartz are characteristic for particular shock pressure stages.
SAMPLES AND EXPERIMENTAL PROCEDURES
A sample from the Hospital Hill quartzite formation(Lower Witwatersrand Supergroup = West Rand Group) wasobtained from a locality about 20 km west of Johannesburg(Reimold and Hörz 1986). This particular rock type waschosen because it occurs, naturally shock deformed, in thecentral uplift of the Vredefort impact structure, the Vredefortdome. The samples used in this study and previouslydescribed by Reimold and Hörz (1986), Huffman et al.(1993), and Huffman and Reimold (1996) show virtually noaccessory phases (sericite <1 vol%); evidence of tectonicdeformation was restricted to occasional weak subgraindevelopment and rare tectonic lamellae. The samples were cutinto plates of about 1 mm thickness and embedded in density-matching epoxy material. Shock recovery experiments wereperformed using an explosive wave generator. Forcomparison with naturally shocked material, these specimenwere subjected to experimental shock at pressures of 12, 25,and 28 GPa at room temperature (25°C) and preheated to 100,450, and 750°C, respectively (for further details, see Huffmanand Reimold [1996] and Huffman et al. [1993]). In thesequartzite samples, the previous authors found shock-inducedmicrostructures, such as extension cracks, brecciation, planardeformation features, mosaicism, partial isotropization, anddiaplectic glass.
For our studies, we used polished thin sections of freshchips (i.e., not the same thin sections) of the same material.The samples were first examined under a petrographicmicroscope, and optical images were captured digitally. Thesamples were then carbon-coated and examined with anOxford Mono-CL system attached to a JEOL JSM 6400scanning electron microscope (SEM) at the Department ofMineralogy, Natural History Museum, Vienna, Austria. Theoperating conditions for all SEM-CL investigations were15 kV accelerating voltage and 1.2 nA beam current;backscattered-electron (BSE) and cathodoluminescence (CL)images were obtained from areas of approximately450 × 450 mm. CL spectra were recorded in the wavelengthrange of 200–800 nm, with 1 nm resolution using a photo-multiplier detector. The acquisition time of each CL spectrum
was 18 min, whereas CL images were obtained withinscanning times of about 1 min. The grating of themonochromator was 1200 lines/mm. The CL spectra wereobtained from approximately 40 × 40 mm areas.
The Raman spectra were obtained with a RenishawRM1000 confocal micro-Raman spectrometer with a 20 mW,632 nm He-Ne-laser excitation system and a thermo-electrically cooled CCD detector at the Institute ofMineralogy and Crystallography, University of Vienna,Vienna, Austria. The power of the laser beam on the samplewas approximately 3 mW. The spectra were obtained in therange of 100–1200 cm-1, with approximately a 30 secacquisition time. The spectral resolution (apparatus function)was 4 cm-1 using a grating with 1200 grooves/mm. TheRaman spectra were taken in confocal mode from a3 × 3 × 3 mm3 sample volume using a Leica DMLMmicroscope and a Leica 50×/0.75 N.A. objective.Unfortunately, the quality of some of the Raman spectra is notideal, and we have tried to reacquire the Raman spectra of the25 and 28 GPa shocked quartzite samples. The samples hadsuffered irreversible changes in SEM/CL, i.e., the samples nolonger display nice, glassy SiO2 spectra but, rather, anincredibly large luminescence background, which does notallow us to identify any real spectral features.
Three CL spectra and three Raman spectra of differentareas were acquired per sample, and, as no significantintrasample variations appeared to exist, only representativeimages and spectra are shown in the following figures.
RESULTS
According to Reimold and Hörz (1986) and Huffman etal. (1993), the experimentally shocked Hospital Hill quartzitespecimens show the usual progression, with increasing shockintensity, from random fractures (at 5 GPa) to thedevelopment of planar fractures (16 GPa) and mosaicstructure (at 25 GPa), to single sets of PDFs, to multiple setsof PDFs, and finally, to isotropization (at 30 GPa) and partialmelting (35 GPa). Reimold (1988) noted that pervasivefracturing, brecciation, and shock mosaicism are betterdeveloped at comparatively lower shock pressures in thepreheated specimens. As the development of mosaicismproceeds, random fracturing decreases in abundance andplanar fractures appear. PDFs first appear at 16.8 GPa in thecold shocked sample but were not observed at 17.5 GPa in thepreheated specimen (these samples were not available for thepresent study). This could reflect inhomogeneous pressuredistribution in the disks during shock experiments.
Cathodoluminescence (CL) Image Observations
Unshocked Sample Relatively CL-bright patchy areas and bands that are
transected by irregular CL-dark fractures in non-luminescentquartzite are visible in the CL images (Fig. 1a). We did not

1190 A. Gucsik et al.
observe irregular or subparallel fractures in the BSE imagesas in the previous optical studies (e.g., Reimold and Hörz1986). Fluid inclusions and zonation patterns are not evidentin the CL images (Fig. 1a).
Samples Shocked to 12 GPa at 100, 450, and 750°CShock mosaic texture and other shock-induced
microdeformations (e.g., planar fractures), as described byHuffman et al. (1993), were not observed in our BSE imagesof 12 GPa samples. The sample shocked at 100°C shows areaswith variations in CL intensity in otherwise non-luminescentquartzite (Fig. 1b). The sample shocked at 450°C exhibitslight lenses along irregular fractures, which have a strongcontrast to the CL-bright (with variations in CL intensity)luminescent background (Fig. 1c). According to the opticalmicroscopy observations, these CL-bright lenses might berelated to the recrystallization of quartz, which occurred alongfractures. No fractures are visible in the CL mode of thesample shocked at 750°C (Fig. 1d). The randomly distributed
light spots could be impurities. Some CL-bright bands arenoted in the otherwise non-luminescent quartz.
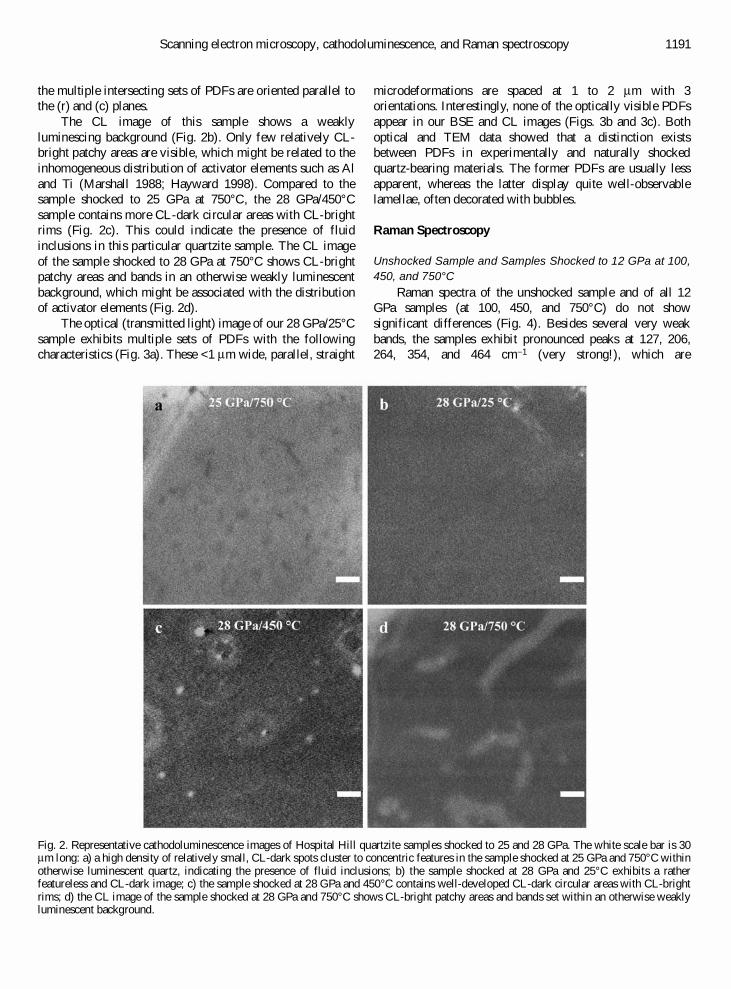
Sample Shocked to 25 GPa at 750°CNumerous relatively small, somewhat rounded CL-dark
areas are visible in the sample shocked at 25 GPa and 750°Cin otherwise luminescent quartz (Fig. 2a). These dark spotsmight be associated with fluid inclusions, which wereprobably part of the somewhat heterogeneous naturalquartzite. A straight fracture in the upper left corner of the CLimage shows relatively stronger CL luminescence than thesurrounding area, perhaps indicating an effect related to therecrystallization of quartz.
Samples Shocked to 28 GPa at 25, 450, and 750°CTEM investigations of microstructures in the samples
shocked at 28 GPa and 25°C exhibit a well-developed shockmosaic structure along very narrow (£1 mm) PDFs parallel tothe p plane (Huffman et al. 1993). These authors noted that
Fig. 1. Representative cathodoluminescence images of an unshocked quartzite from Hospital Hill, Witwatersrand Supergroup, and a quarzite(same location) shocked to 12 GPa. The images suffer somewhat from the very low luminosity of the quartz (i.e., bad signal to noise ratio).The white scale bar is 30 mm long: a) the CL-bright patchy areas and bands are transected by irregular CL-dark fractures in non-luminescentquartzite of the unshocked sample; b) the sample shocked at 12 GPa and 100°C shows rounded areas with variations in CL intensity in otherwisenon-luminescent quartzite; c) the sample shocked to 12 GPa at 450°C exhibits light-colored lenses along the irregular fractures; d) no fracturesare visible in the CL image of the sample shocked to 12 GPa at 750°C.
Scanning electron microscopy, cathodoluminescence, and Raman spectroscopy 1191
the multiple intersecting sets of PDFs are oriented parallel tothe (r) and (c) planes.
The CL image of this sample shows a weaklyluminescing background (Fig. 2b). Only few relatively CL-bright patchy areas are visible, which might be related to theinhomogeneous distribution of activator elements such as Aland Ti (Marshall 1988; Hayward 1998). Compared to thesample shocked to 25 GPa at 750°C, the 28 GPa/450°Csample contains more CL-dark circular areas with CL-brightrims (Fig. 2c). This could indicate the presence of fluidinclusions in this particular quartzite sample. The CL imageof the sample shocked to 28 GPa at 750°C shows CL-brightpatchy areas and bands in an otherwise weakly luminescentbackground, which might be associated with the distributionof activator elements (Fig. 2d).
The optical (transmitted light) image of our 28 GPa/25°Csample exhibits multiple sets of PDFs with the followingcharacteristics (Fig. 3a). These <1 mm wide, parallel, straight
microdeformations are spaced at 1 to 2 mm with 3orientations. Interestingly, none of the optically visible PDFsappear in our BSE and CL images (Figs. 3b and 3c). Bothoptical and TEM data showed that a distinction existsbetween PDFs in experimentally and naturally shockedquartz-bearing materials. The former PDFs are usually lessapparent, whereas the latter display quite well-observablelamellae, often decorated with bubbles.
Raman Spectroscopy
Unshocked Sample and Samples Shocked to 12 GPa at 100,450, and 750°C
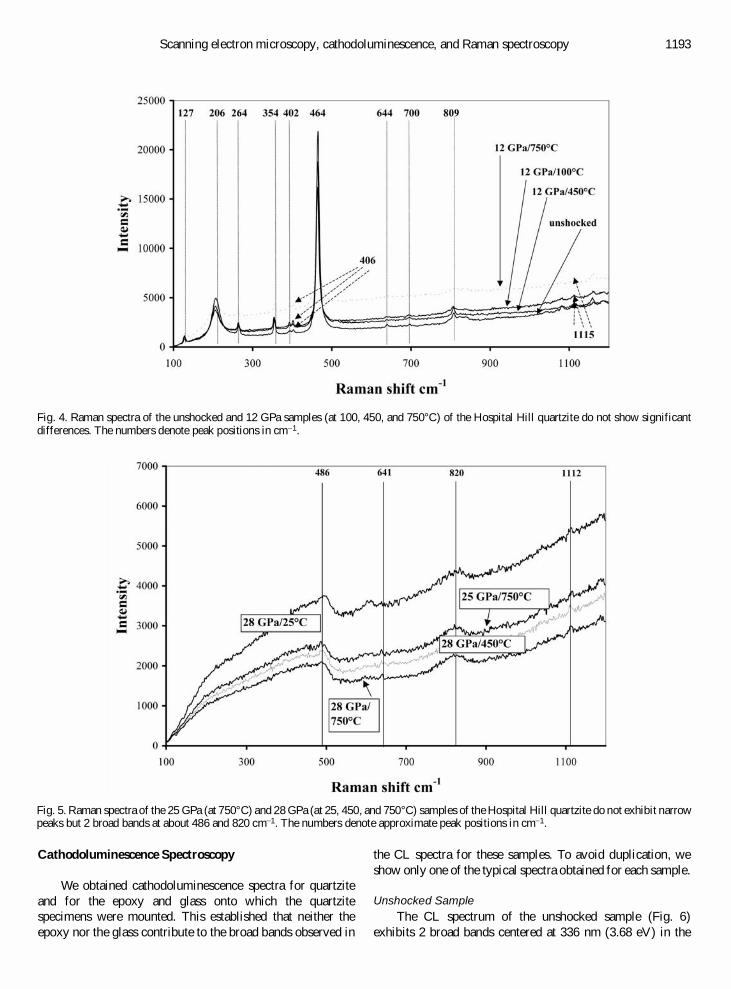
Raman spectra of the unshocked sample and of all 12GPa samples (at 100, 450, and 750°C) do not showsignificant differences (Fig. 4). Besides several very weakbands, the samples exhibit pronounced peaks at 127, 206,264, 354, and 464 cm-1 (very strong!), which are
Fig. 2. Representative cathodoluminescence images of Hospital Hill quartzite samples shocked to 25 and 28 GPa. The white scale bar is 30mm long: a) a high density of relatively small, CL-dark spots cluster to concentric features in the sample shocked at 25 GPa and 750°C withinotherwise luminescent quartz, indicating the presence of fluid inclusions; b) the sample shocked at 28 GPa and 25°C exhibits a ratherfeatureless and CL-dark image; c) the sample shocked at 28 GPa and 450°C contains well-developed CL-dark circular areas with CL-brightrims; d) the CL image of the sample shocked at 28 GPa and 750°C shows CL-bright patchy areas and bands set within an otherwise weaklyluminescent background.

1192 A. Gucsik et al.
characteristic for quartz. Additionally, the backgroundintensity is increased in the 12 GPa sample at 750°C (Fig. 4).
Samples Shocked to 25 GPa at 750°C and to 28 GPa at 25,450, and 750°C
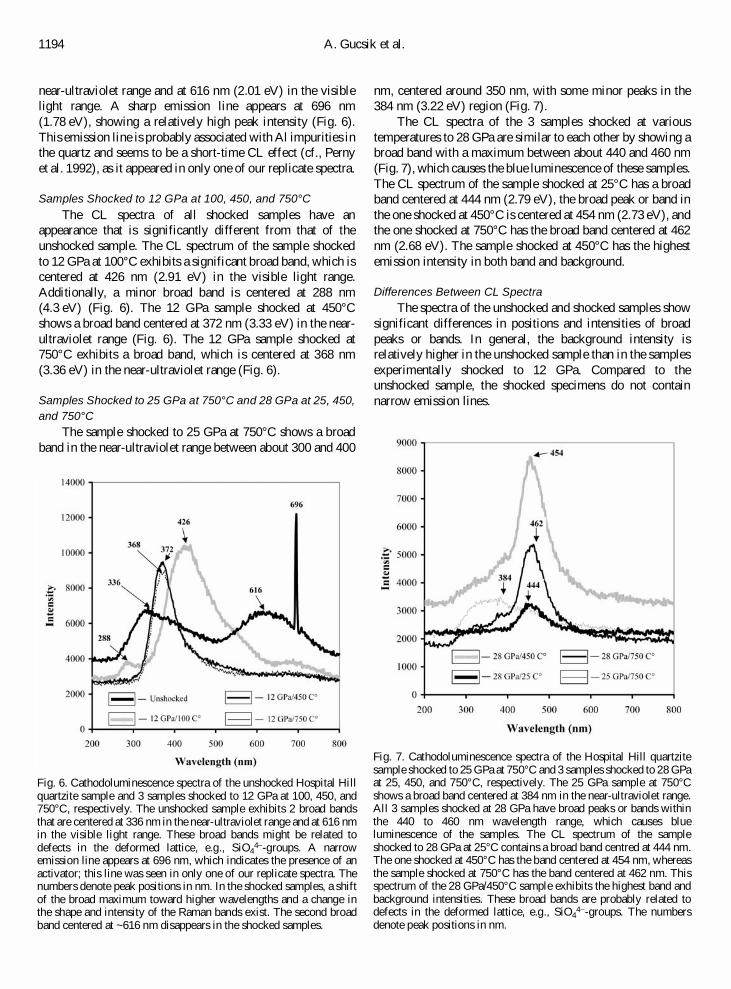
Except for a higher background intensity in the 28 GPa/25°C sample, the Raman spectra of the samples shocked to25 GPa at 750°C and to 28 GPa (at 25, 450, and 750°C) are
very similar but have a different appearance from the spectraof samples shocked at lower pressures and from theunshocked one. These samples do not show the dominantvibrational peak at 464 cm-1 but contain 2 broad bandscentered at about 486 and 820 cm-1 (Fig. 5). These 2 broadbands indicate the transformation of quartz to diaplectic SiO2
glass. Note that no other sharp bands exist that could indicatethe presence of high-pressure SiO2 polymorphs.
Fig. 3. Representative images of the same area with a Hospital Hill quartzite sample shocked at 28 GPa: a) optical (transmitted light); b)backscattered-electron image (BSE); and c) cathodoluminescence (CL) images of the 28 GPa/25°C sample of the Hospital Hill quartzitesample. The BSE image exhibits variations in BSE intensities and irregular fractures in these regions. The CL image shows CL-dark grainboundaries, which are transected by areas that are slightly less luminescent. Three discernable orientations (white bars) of well-developed,closely-spaced, parallel planar deformation features (PDFs) are observed. None of these features are visible in the BSE or CL images.
Scanning electron microscopy, cathodoluminescence, and Raman spectroscopy 1193
Cathodoluminescence Spectroscopy
We obtained cathodoluminescence spectra for quartziteand for the epoxy and glass onto which the quartzitespecimens were mounted. This established that neither theepoxy nor the glass contribute to the broad bands observed in
the CL spectra for these samples. To avoid duplication, weshow only one of the typical spectra obtained for each sample.
Unshocked SampleThe CL spectrum of the unshocked sample (Fig. 6)
exhibits 2 broad bands centered at 336 nm (3.68 eV) in the
Fig. 4. Raman spectra of the unshocked and 12 GPa samples (at 100, 450, and 750°C) of the Hospital Hill quartzite do not show significantdifferences. The numbers denote peak positions in cm-1.
Fig. 5. Raman spectra of the 25 GPa (at 750°C) and 28 GPa (at 25, 450, and 750°C) samples of the Hospital Hill quartzite do not exhibit narrowpeaks but 2 broad bands at about 486 and 820 cm-1. The numbers denote approximate peak positions in cm-1.
1194 A. Gucsik et al.
near-ultraviolet range and at 616 nm (2.01 eV) in the visiblelight range. A sharp emission line appears at 696 nm(1.78 eV), showing a relatively high peak intensity (Fig. 6).This emission line is probably associated with Al impurities inthe quartz and seems to be a short-time CL effect (cf., Pernyet al. 1992), as it appeared in only one of our replicate spectra.
Samples Shocked to 12 GPa at 100, 450, and 750°CThe CL spectra of all shocked samples have an
appearance that is significantly different from that of theunshocked sample. The CL spectrum of the sample shockedto 12 GPa at 100°C exhibits a significant broad band, which iscentered at 426 nm (2.91 eV) in the visible light range.Additionally, a minor broad band is centered at 288 nm(4.3 eV) (Fig. 6). The 12 GPa sample shocked at 450°Cshows a broad band centered at 372 nm (3.33 eV) in the near-ultraviolet range (Fig. 6). The 12 GPa sample shocked at750°C exhibits a broad band, which is centered at 368 nm(3.36 eV) in the near-ultraviolet range (Fig. 6).
Samples Shocked to 25 GPa at 750°C and 28 GPa at 25, 450,and 750°C
The sample shocked to 25 GPa at 750°C shows a broadband in the near-ultraviolet range between about 300 and 400
nm, centered around 350 nm, with some minor peaks in the384 nm (3.22 eV) region (Fig. 7).
The CL spectra of the 3 samples shocked at varioustemperatures to 28 GPa are similar to each other by showing abroad band with a maximum between about 440 and 460 nm(Fig. 7), which causes the blue luminescence of these samples.The CL spectrum of the sample shocked at 25°C has a broadband centered at 444 nm (2.79 eV), the broad peak or band inthe one shocked at 450°C is centered at 454 nm (2.73 eV), andthe one shocked at 750°C has the broad band centered at 462nm (2.68 eV). The sample shocked at 450°C has the highestemission intensity in both band and background.
Differences Between CL SpectraThe spectra of the unshocked and shocked samples show
significant differences in positions and intensities of broadpeaks or bands. In general, the background intensity isrelatively higher in the unshocked sample than in the samplesexperimentally shocked to 12 GPa. Compared to theunshocked sample, the shocked specimens do not containnarrow emission lines.
Fig. 6. Cathodoluminescence spectra of the unshocked Hospital Hillquartzite sample and 3 samples shocked to 12 GPa at 100, 450, and750°C, respectively. The unshocked sample exhibits 2 broad bandsthat are centered at 336 nm in the near-ultraviolet range and at 616 nmin the visible light range. These broad bands might be related todefects in the deformed lattice, e.g., SiO4
4--groups. A narrowemission line appears at 696 nm, which indicates the presence of anactivator; this line was seen in only one of our replicate spectra. Thenumbers denote peak positions in nm. In the shocked samples, a shiftof the broad maximum toward higher wavelengths and a change inthe shape and intensity of the Raman bands exist. The second broadband centered at ~616 nm disappears in the shocked samples.
Fig. 7. Cathodoluminescence spectra of the Hospital Hill quartzitesample shocked to 25 GPa at 750°C and 3 samples shocked to 28 GPaat 25, 450, and 750°C, respectively. The 25 GPa sample at 750°Cshows a broad band centered at 384 nm in the near-ultraviolet range.All 3 samples shocked at 28 GPa have broad peaks or bands withinthe 440 to 460 nm wavelength range, which causes blueluminescence of the samples. The CL spectrum of the sampleshocked to 28 GPa at 25°C contains a broad band centred at 444 nm.The one shocked at 450°C has the band centered at 454 nm, whereasthe sample shocked at 750°C has the band centered at 462 nm. Thisspectrum of the 28 GPa/450°C sample exhibits the highest band andbackground intensities. These broad bands are probably related todefects in the deformed lattice, e.g., SiO4
4--groups. The numbersdenote peak positions in nm.

Scanning electron microscopy, cathodoluminescence, and Raman spectroscopy 1195
The unshocked sample has 2 broad bands centered around336 and 616 nm, which are absent in the samples shocked at12 GPa. These samples contain only 1 wide band, which issomewhat more narrow and has a relatively higher intensitythan those of the unshocked sample. Figure 6 indicates that thebroad band in the red part of the spectrum of the unshockedsample, at 616 nm, is still weakly visible in the sample shockedto 12 GPa at 100°C but is shifted further toward the red (around700 nm). Moreover, this band disappears completely in thesamples shocked at higher temperatures. In addition, theintensity of the band around 336 nm in the unshocked sampleincreases in the samples shocked to 12 GPa and is shiftedtoward higher wavelengths (~426 nm in the sample shocked at100°C and about 370 nm in the samples shocked to 450 at750°C). In the samples shocked to 25 and 28 GPa, the samebroad band seems to be shifted even further from the ultravioletregion of the spectrum, up to ~460 nm (Fig. 7).
DISCUSSION
Raman Spectroscopy
Seifert et al. (1982) identified very strong (vs), strong (s),and medium (m) intensity Raman bands in vitreous SiO2 at 440(vs), 495 (vs), 605 (m), 810 (s), 1060 (m), and 1195 cm-1.Raman spectra of quartz measured from 23 to 800°C forpressures between 0.1 MPa and 2.1 GPa have been describedby Schmidt and Ziemann (2000). They found changes infrequency and line-width of the 206 and 464 cm-1 A1 Ramanmodes. The positions and widths of peaks in the Raman spectraof our unshocked and 12 GPa samples are in good agreementwith these previous studies. Raman spectra and characteristicbands of coesite and stishovite have been reported by Boyer etal. (1985), Serghiou et al. (1995), Lounejeva et al. (2002), andOstroumov et al. (2002). Boyer et al. (1985) found that thestrongest coesite line is at 521 cm-1, with other characteristiclines at 117, 177, and 271 cm-1, while Serghiou et al. (1995),in laser-heated diamond cell experiments, found that coesiteexhibits 3 relatively strong Raman bands at 489, 552, and 790cm-1, and stishovite shows a strong peak at 790 cm-1.However, none of these Raman bands were observed in any ofour Hospital Hill quartzite samples, in agreement with resultsof other studies of shocked quartz (e.g., Stöffler andLangenhorst 1994; Grieve et al. 1996).
While the unshocked sample and the 12 GPa samplesshow Raman spectra with distinct, sharp lines that agree withlines for a-quartz, the spectra of the 25 and 28 GPa samplesare characterized by the absence of such sharp lines and by thepresence of rather broad bands at lower total intensities (Figs.4 and 5). We observe that a distinct broad band is centerednear 490 cm-1 in the spectra of the samples shocked at 25 and28 GPa, being most pronounced in the spectra of the 28 GPa/25°C sample. McMillan et al. (1992) showed that spectra forpressure-densified SiO2 glass and diaplectic quartz glass arecharacterized by bands centered at 490 cm-1, with a second
band at about 810 cm-1. This agrees well with the positions ofthe bands in our spectra of the 25 and 28 GPa samples andindicates the presence of diaplectic SiO2 glass and/oramorphization associated with the presence of glass-filledPDFs. Champagnon et al. (1996) found from their Ramanstudies of shocked quartz that the crystalline quartz isconverted to the amorphous state between 22 and 32 GPa atroom temperature. Our data agree well with this observation,although the dominance of the broad bands in the Ramanspectra seems to appear only around 31 GPa in the samplesstudied by Champagnon et al. (1996). The difference could bea side effect of higher temperatures in our shock experiments,and/or a higher degree of lattice defects in the quartzite usedin our experiments.
Cathodoluminescence Spectroscopy
CL-Bright and CL-Dark Areas in Cathodoluminescence (CL)Images
The cathodoluminescence images provide informationon the presence of activators and quenchers in the sample.Thus, the CL-bright luminescence of the samples is related tothe presence of different inclusions and fractures, as well asdefects of the crystal structure and chemical impurities (e.g.,Al, Li, and Na; Ramseyer and Mullis 1990; Perny et al. 1992;Demars et al. 1996). However, this also includes slightdifferences due to the somewhat heterogeneous nature of thenatural quartzite. The amorphous state of quartz at highshock pressure and pre-shock temperature is characterized bya lack of recombination centers for photon emissions, whichleads to the CL-dark areas and weakly luminescentbackground of the samples.
CL Spectra of Unshocked and Shocked SamplesThe CL spectra of all samples are dominated by broad
band/peaks and almost total absence of any sharp emissionlines. According to Remond et al. (2000), the peak width ofbroad CL emission bands indicates that excited and groundstates of the electronic radiative transitions are stronglycoupled with the vibrating lattice. Stronger coupling indicatesthat more phonons are emitted after the electronic transition.1) Broad intrinsic emission generally results from self-trappedexcitons (STE), which are highly localized excitons trappedby their own self-induced lattice distortion. STE are generallyproduced in crystals that are characterized by strong electron-phonon coupling. The emission energy of the STE is usuallymuch lower than the band gap of the material due to the energylost by phonon emission during the electronic transition; 2)excitation of electrons or holes trapped (dangling bonds incovalent crystals) at point defects, such as vacancies, andinterstitial and point defect clusters usually produce broad CLpeaks at all temperatures (Remond et al. 2000).
According to Stevens Kalceff et al. (2000, and referencestherein), the normal defect-free configuration of (low pressure)silicon dioxide polymorphs can be represented as (ºSi-O-Siº),

1196 A. Gucsik et al.
indicating that each silicon atom is surrounded by 4tetrahedrally configured oxygen atoms, and the adjacentsilicon atoms are bridge-bonded through a single oxygen atom.The silicon dioxide structure may be modified by the presenceof defects (e.g., impurities, vacancies). The dominant observeddefects occur in the short-range order involving the slightlydistorted SiO4 tetrahedra, which are common to both thecrystalline and amorphous SiO2 structures. Recently, thedetected luminescence bands of the crystalline and amorphousmodifications of SiO2 have been attributed to 3 optically activeluminescence centers: 1) two-fold coordinated silicon (=Si:);2) non-bridging oxygen hole centers; and 3) the STE (Fitting etal. 2001). Fitting et al. (2001) found a red band at 650 nm dueto a band-band recombination center, a blue band at 460 nm(triplet-singlet), and an ultraviolet band at 290 nm (singlet-singlet defect luminescence band).
The positions of the broad bands can be interpreted asband-band recombination centers (at around 290 nm in our 12GPa/100°C sample) and as defect luminescence centerscaused by high shock pressure (at around 460 nm in the CLspectra of all 28 GPa samples); these positions are similar tothose that have been described for previous CL studies ofquartz (Fitting et al. 2001). The broad bands between 330 and438 nm in our unshocked, 12 GPa (at 100, 450, and 750°C),and 25 GPa (at 750°C) samples might be related to structuralimperfections (e.g., Sippel and Spencer 1970). The broad,reddish emission band at 610–650 nm, which was mentionedby Götze et al. (2001) for some shocked quartz, is of lowintensity in our samples.
SUMMARY AND CONCLUSIONS
In general, CL images of all samples show CL-brightluminescent patchy areas and bands in otherwise non-luminescent quartz and CL-dark irregular fractures, whichcould be related to the microdistribution of some activatorelements (e.g., Al, Li, Na). The presence of fluid inclusionscould be indicated in the CL images of the sample shocked to25 GPa at 750°C and the sample shocked at 28 GPa and450°C. Only the optical image of the sample shocked to28 GPa at 25°C exhibits PDFs, which are, however, neithervisible in the BSE nor the CL image, in contrast toobservations by Boggs et al. (2001), who noticed a network ofbright and dark zones generally corresponding to opticalPDFs in shocked quartz from the Ries impact structure.
Cathodoluminescence spectra of unshocked andexperimentally shock-deformed samples show broad bands inthe near-ultraviolet range and the visible light range at allshock pressures. These broad bands might be associated withdefect centers on, e.g., SiO4
4--groups. Distinct differences existbetween the CL spectra of the unshocked and the shockedsamples, and shifts in the center positions of the broad bandsare evident with increasing shock pressure. This mightindicate that recombination centers or traps for the photon
emission are more closely-spaced in the band gap betweenVB and CB as a function of the increasing shock pressure,which is probably caused by partial amorphization.
The Raman spectra with sharp peaks indicate thepresence of normal quartz in the unshocked and 12 GPasamples. These peaks disappear in the samples shocked at 25and 28 GPa, which are dominated by broad bands of about490 and 820 cm-1. These broad bands indicate a wide range ofdiffuse vibrational modes and indicate the presence ofdiaplectic SiO2 glass.
The results show distinct changes of the CL and Ramanproperties of quartz with shock pressure and point to a possibleuse of these methods as shock barometers. Changes based onthe pre-shock temperature are less pronounced. A wider rangeof shock pressures and a variety of quartz and quartzite samplesshould be studied before any quantification is possible.
Acknowledgments–We thank Ming Zhang (University ofCambridge, UK) for helpful comments, Alan Huffman(Exxon, USA) for providing some of the experimentallyshocked samples, and Gero Kurat (Natural History Museum,Vienna, Austria) for access to the SEM-CL facility at theNatural History Museum, Vienna, Austria. We are grateful toL. Nasdala (Mainz) and R. Skala (Prague) for detailed andhelpful reviews and to A. Deutsch for editorial comments andsupport. Laboratory work was supported by the AustrianScience Foundation (grant Y58-GEO, to C. Koeberl). This isUniversity of the Witwatersrand Impact Cratering ResearchGroup Contribution No. 58. A. Gucsik was also supported bya Mobility Grant of the European Science FoundationIMPACT Programme.
Editorial Handling—Dr. Alex Deutsch
REFERENCES
Boggs S., Krinsley D. H., Goles G. G., Seyedolali A., and Dypvik H.2001. Identification of shocked quartz by scanningcathodoluminescence imaging. Meteoritics & Planetary Science36:783–793.
Boyer H., Smith D., Chopin C., and Lasnier B. 1985. Ramanmicroprobe determination of natural and synthetic coesite.Physics and Chemistry of Minerals 12:45–48.
Champagnon B., Panczer G., Chemarin C., and Humbert-LabeaumazB. 1996. Raman study of quartz amorphization by shockpressure. Journal of Non-Crystalline Solids 196:221–226.
Cygan R. T., Boslough M. B., and Kirkpatrick R. J. 1990. NMRspectroscopy of experimentally shocked quartz: Shock wavebarometry. Proceedings, 20th Lunar and Planetary ScienceConference. pp. 127–136.
Demars C., Pagel M., Deloule E., and Blanc P. 1996.Cathodoluminescence of quartz from sandstones: Interpretationof the UV range by determination of trace element distributionsand fluid inclusion P-T-X properties in authigenic quartz.American Mineralogist 81:891–901.
Etchepare J., Meriane M., and Smetankine L. 1974. Vibrationalmodes of SiO2. I. a and b quartz. Journal of Chemical Physics60:1874–1876.

Scanning electron microscopy, cathodoluminescence, and Raman spectroscopy 1197
Faulques E., Fritsch E., and Ostroumov M. 2001. Spectroscopy ofnatural silica-rich glasses. Journal of Mineralogical andPetrological Sciences 96:120–128.
Fitting H J., Barfels T., Trukhin A. N., and Schmidt B. 2001.Cathodoluminescence of crystalline and amorphous SiO2 andGeO2. Journal of Non-Crystalline Solids 279:51–59.
Fouke B. W., Zerkle A. L., Alvarez W., Pope K. O., Ocampo A. C.,Wachtmann R. J., Grajales-Nishimura J. M., Claeys P., andFischer A. G. 2002. Cathodoluminescence petrography andisotope geochemistry of KT impact ejecta deposited 360 km fromthe Chicxulub crater, at Albion Island, Belize. Sedimentology 49:117–138.
Götze J., Plötze M., and Habermann D. 2001. Origin, spectralcharacteristics, and practical applications of thecathodoluminescence (CL) of quartz—A review. Mineralogyand Petrology 71:225–250.
Grieve R. A. F., Langenhorst F., and Stöffler D. 1996. Shockmetamorphism in nature and experiment: II. Significance ingeoscience. Meteoritics & Planetary Science 31:6–35.
Halvorson K. and McHone J. F. 1992. Vredefort coesite confirmedwith Raman spectroscopy (abstract). 23rd Lunar and PlanetaryScience Conference. pp. 477–478.
Hayward C. L. 1998. Cathodoluminescence of ore and gangueminerals and its application in the minerals industry: In Modernapproaches to ore and environmental mineralogy, edited byCabri L. J. and Vaughan D. J. Mineralogical Association ofCanada Short Course Series 27. pp. 269–325.
Huffman A. R., and Reimold W. U. 1996. Experimental constraintson shock-induced microstructures in naturally deformedsilicates. Tectonophysics 256:165–217.
Huffman A. R., Brown J. M., Carter N. L., and Reimold W. U. 1993.The microstructural response of quartz and feldspar under shockloading at variable temperatures. Journal of GeophysicalResearch 98:22171–22195.
Langenhorst F. and Deutsch A. 1994. Shock experiments on pre-heated a- and b-quartz: I. Optical and density data. Earth andPlanetary Science Letters 125:407–420.
Langenhorst F., Deutsch A., Hornemann U., and Stöffler D. 1992.Effect of temperature on shock metamorphism of single crystalquartz. Nature 356:507–509.
Lounejeva E., Ostroumov M., and Sánches-Rubio G. 2002. Micro-Raman and optical identification of coesite in suevite fromChicxulub. In Catastrophic events and mass extinctions: Impactsand beyond, edited by Koeberl C. and MacLeod K. G. SpecialPaper 356. Boulder: Geological Society of America. pp. 47–54.
McMillan P. F., Wolf G. H., and Lambert P. 1992. A Ramanspectroscopic study of shocked single crystalline quartz. Physicsand Chemistry of Minerals 19:71–79.
Marshall D. J. 1988. Cathodoluminescence of geological materials.Boston: Unwin Hyman. 146 p.
Milliken K. L. and Laubach S. E. 2000. Brittle deformation insandstone diagenesis as revealed by scanningcathodoluminescence imaging with application tocharacterization of fractured reservoirs. In Cathodoluminescencein geosciences, edited by Pagel M., Barbin V., Blanc P., andOhnenstetter D. Heidelberg: Springer. pp. 225–243.
Okuno M., Reynard B., Shimada Y., Syono Y., and Willaime C. 1999.A Raman spectroscopic study of shock-wave densification ofvitreous silica. Physics and Chemistry of Minerals 26:304–311.
Ostroumov M., Faulques E., and Lounejeva E. 2002. Ramanspectroscopy of natural silica in Chicxulub impactite, Mexico.Comptes Rendus Geoscience 334:21–26.
Owen M. R. and Anders H. M. 1988. Evidence fromcathodoluminescence from non-volcanic origin of shockedquartz at the Cretaceous/Tertiary boundary. Nature 334:145–147.
Perny B., Eberhardt P., Ramseyer K., Mullis J., and Pankrath R. 1992.Microdistribution of Al, Li, and Na in a-quartz: Possible causesand correlation with short-lived cathodoluminescence. AmericanMineralogist 77:534–544.
Poutivcev M., Kempe U., Götze J., Monecke T., Wolf D., andKremenetsky A. A. 2001. Cathodoluminescence and traceelement characteristics of quartz pebbles from the Witwatersrand,South Africa (abstract). In Cathodoluminescence in geosciences:New insights from CL in combination with other techniques.Freiberg: Technische Universität Bergakademie. pp. 101–102.
Ramseyer K. and Mullis J. 1990. Factors influencing short-lived bluecathodoluminescence of a-quartz. American Mineralogist 75:791–800.
Ramseyer K. and Mullis J. 2000. Geologic application ofcathodoluminescence of silicates. In Cathodoluminescence ingeosciences, edited by Pagel M., Barbin V., Blanc P.,Ohnenstetter D. Heidelberg: Springer. pp. 177–191.
Ramseyer K., Aldahan A. A., Collini B., and Lindström O. 1992.Petrological modifications in granitic rocks from the Siljanimpact structure: Evidence from cathodoluminescence.Tectonophysics 216:195–204.
Reimold W. U. 1988. Shock experiments with preheatedWitwatersrand quartzite and the Vredefort microdeformationcontroversy (abstract). 19th Lunar and Planetary ScienceConference. pp. 970–971.
Reimold W. U. and Hörz F. 1986. Experimental shock metamorphismof Witwatersrand quartzite (abstract). Geocongress ‘86,Geological Society of South Africa, Johannesburg. pp. 53–57.
Remond G., Phillips M. R., and Roques-Carmes C. 2000. Importanceof instrumental and experimental factors on the interpretation ofcathodoluminescence data from wide gap materials: InCathodoluminescence in geosciences, edited by Pagel M., BarbinV., Blanc P., and Ohnenstetter D. Heidelberg: Springer. pp. 59–126.
Schmidt C. and Ziemann A. M. 2000. In-situ Raman spectroscopy ofquartz: A pressure sensor for hydrothermal diamond-anvil cellexperiments at elevated temperatures. American Mineralogist85:1725–1734.
Serebrennikov A. I., Valter A. A., Mashkovtsev R. I., andScherbakova M. Y. 1982. The investigation of defects in shock-metamorphosed quartz. Physics and Chemistry of Minerals 8:153–157.
Serghiou G., Zerr A., Chudinovskikh L., and Boehler R. 1995. Thecoesite-stishovite transition in a laser-heated diamond cell.Geophysical Research Letters 22:441–444.
Seifert, F., Mysen B. O., and Virgo D. 1982. Three-dimensionalnetwork structure of quenched melts (glass) in the systems SiO2-NaAlO2, SiO2-CaAl2O4, and SiO2-MgAl2O4. AmericanMineralogist 67:696–717.
Seyedolali A., Krinsley D. H., Boggs S., O’Hara P. F., Dypvik H., andGoles G. 1997. Provenance interpretation of quartz by scanningelectron microscope-cathodoluminescence fabric analysis.Geology 25:787–790.
Sippel F. R. and Spencer B. A. 1970. Luminescence petrography andproperties of lunar crystalline rocks and breccias: In Proceedingsof the Apollo 11 Lunar Science Conference, edited by LevinsonA. A. New York: Pergamon Press. pp. 2413–2426.
Stevens Kalceff M. A., Phillips M. R., Moon A. R., and Kalceff W.2000. Cathodoluminescence microcharacterisation of silicondioxide polymorphs: In Cathodoluminescence in geosciences,edited by Pagel M., Barbin V., Blanc P., and Ohnenstetter D.Heidelberg: Springer. pp. 193–224.
Stöffler D. and Langenhorst F. 1994. Shock metamorphism of quartzin nature and experiment: I. Basic observations and theory.Meteoritics 29:155–181.