Scanning Devices Thermochron Application for Palm OS · 3. The setup wizard takes you through a...
17
Scanning Devices Thermochron22 Application for Palm OS Users Guide Table of Contents The Palm Application Launch Screen ................................................................................................ 2 Starting the Application ...................................................................................................................... 2 Application Components .................................................................................................................... 2 Preferences ...................................................................................................................................... 2 Application Functions ..................................................................................................................... 3 Application Screens ........................................................................................................................ 4 Starting a Mission ............................................................................................................................... 6 Required Fields ............................................................................................................................... 6 Optional Fields ................................................................................................................................ 8 Read-Only Fields ............................................................................................................................ 9 Reading Mission Information and Graphing Temperature Data ........................................................ 9 Hot Sync to PC.................................................................................................................................. 10 iConnection Testing and Information ............................................................................................... 10 Screen by Screen and Button by Button ........................................................................................... 11 Application Start Screen ............................................................................................................... 11 Database List Screen ..................................................................................................................... 12 Mission Information Screen .......................................................................................................... 13 Graph Data Screen ........................................................................................................................ 15 For More Information ....................................................................................................................... 17
Transcript of Scanning Devices Thermochron Application for Palm OS · 3. The setup wizard takes you through a...
Scanning Devices Thermochron22 Application for Palm OS
Users Guide
Table of Contents
The Palm Application Launch Screen ................................................................................................ 2
Starting the Application ...................................................................................................................... 2
Application Components .................................................................................................................... 2
Preferences ...................................................................................................................................... 2
Application Functions ..................................................................................................................... 3
Application Screens ........................................................................................................................ 4
Starting a Mission ............................................................................................................................... 6
Required Fields ............................................................................................................................... 6
Optional Fields ................................................................................................................................ 8
Read-Only Fields ............................................................................................................................ 9
Reading Mission Information and Graphing Temperature Data ........................................................ 9
Hot Sync to PC.................................................................................................................................. 10
iConnection Testing and Information ............................................................................................... 10
Screen by Screen and Button by Button ........................................................................................... 11
Application Start Screen ............................................................................................................... 11
Database List Screen ..................................................................................................................... 12
Mission Information Screen .......................................................................................................... 13
Graph Data Screen ........................................................................................................................ 15
For More Information ....................................................................................................................... 17
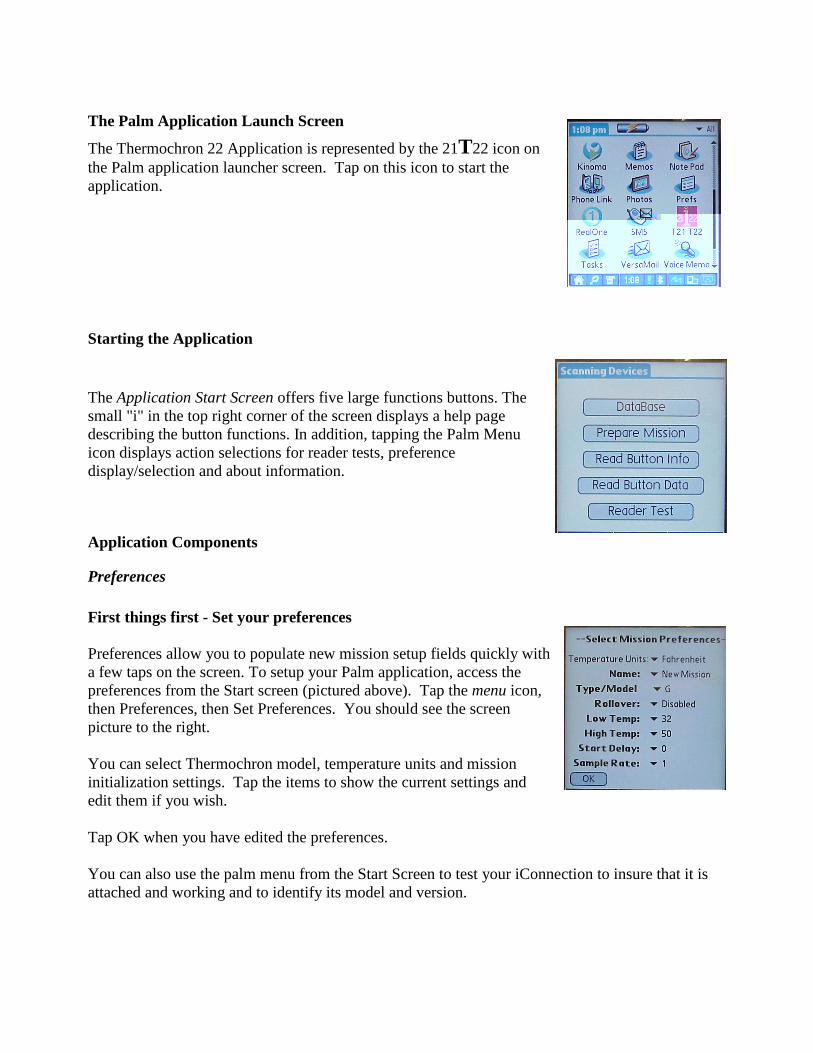
The Palm Application Launch Screen
The Thermochron 22 Application is represented by the 21T22 icon on
the Palm application launcher screen. Tap on this icon to start the
application.
Starting the Application
The Application Start Screen offers five large functions buttons. The
small "i" in the top right corner of the screen displays a help page
describing the button functions. In addition, tapping the Palm Menu
icon displays action selections for reader tests, preference
display/selection and about information.
Application Components
Preferences
First things first - Set your preferences
Preferences allow you to populate new mission setup fields quickly with
a few taps on the screen. To setup your Palm application, access the
preferences from the Start screen (pictured above). Tap the menu icon,
then Preferences, then Set Preferences. You should see the screen
picture to the right.
You can select Thermochron model, temperature units and mission
initialization settings. Tap the items to show the current settings and
edit them if you wish.
Tap OK when you have edited the preferences.
You can also use the palm menu from the Start Screen to test your iConnection to insure that it is
attached and working and to identify its model and version.

Application Functions
What You Can Do – Four Application Functions
The Palm application has four separate functions displayed in a drop down menu at the top of the
Mission Data screen.
1. Edit Data within the handheld – not reading or writing from the iButton
2. Read Info mission settings from the from the iButton
3. Write Button data to the iButton
4. Read data or use database data to Graph Data
Four of the buttons on the start screen select function. Tapping any of
the buttons selects your function and takes you to a screen to select the
mission to perform the function. (Think of it like clicking File-Open on
a word processor and seeing a list of documents to open.)
1. Database allows you to edit mission information. Tapping the
database button takes you to the Database list form to allow you to select
the mission to edit. Select a mission from the list or tap "New" to make a
new database entry. Don't forget to SAVE your data when you are
finished editing. For other operations, iConnection and an iButton must
be attached.
2. Prepare Mission makes a new record. Tapping the Prepare Mission button takes you to a small
screen to select how you want to fill in the new record. Select one of three ways:
1. Your preferences, accessed from Menu-Preferences, allow you to set mission name, temperature
units, alarm ranges and start time. These are the minimum required parameters to start a mission.
You can add more information to the mission table before starting the mission.
2. Your database - you can keep a new mission template in your database, edit it, start a mission,
read the mission back and save it. Tip: read the mission back as NEW to create a new record and
avoid overwriting your template.
3. The setup wizard takes you through a series of screens to collect mission data. Try the wizard a
few times to understand what data is required.
After completing the process, mission data will be displayed and ready to edit. Make any changes
to the displayed information. Don't forget to tap Save to save your changes. Then use the pop-up
list at the top to select Write Button function. Then START to start the mission. If STOP is
displayed, a mission is already running in the iButton and must be stopped to start a new one. Press
STOP then START.
3. Read Button Info - Tapping the Read Button Info takes you to the Database List Screen with
your function set to Read Button. Select a mission from the database or NEW to make a new entry.

Make sure you have an iButton attached to the iConnection probe. Then press READ to read and
display information from the attached iButton, SAVE to store it in the database.
4. Read Button Data - Tapping the Read Button Data takes you to the Database List with your
function set to Graph Temperature Data. Select a mission from the database or NEW to read a new
one. Make sure you have an iButton attached to the iConnection probe. Then tap READ to read
and graph temperature data. On first read, the application constructs a temperature graph with 64
vertical lines, each is a line between the minimum and maximum temperature withing a set of
samples. The number of samples used to construct the line depends on the Thermochron iButton
model type and is displayed in the top right area of the screen.. The upper left part of the display
shows the date/time of the first sample in the graph.
Tap on Zoom IN Zoom OUT , Left , Right symbols to move around the graph
Application Screens
Most application work is done from three screens:
1. Database List - shows you a list of the thermochron iButtons in
your Palm Database. Tap one on the list to display its information.
Tap new to make a new record. Or tap Search to find all records for
the attached thermochron iButton. The application reads the iButton
serial number, then lists all the matches for the serial number found in
your database.
2. Mission Data - displays information about the mission: name,
number, when it started, sample rate, projected time when 2048, 4096
or 8192 samples (depends on model and setup parameters) will be
collected, time of the last reading, number of samples collected at the
last reading.
This screen contains 15 data rows, but only 8 are visible at one time.
You can scroll the screen up or down with the scroll bar on the right
side or use the five-way navigator up-down buttons on your Palm.
The lower half of the screen looks like the picture on the right.
The display in the upper right corner of the Mission Data Form lists
your current function. Edit Data is shown in the picture to the right.
Tapping on the display pulls down a menu and lets you change the
function:

Read Info, Write Button or Graph Data.
Tap the display to drop down a menu and select from that menu to
change the function.
If you select Graph Data you are taken to the Temperature Graph
Screen.
3. Temperature Graph - generates a graph of temperature data read from iButtons or from
temperature data retrieved from the Palm database.
When you access the Temperature Graph
Screen with your function set to Read Data,
the screen is blank and the Read Button is
displayed as shown to the left. Tap this
button to read temperature data from the
attached iButton and display it, as shown to
the right.
After reading, the application generates its initial display with 64 vertical lines. Each line is drawn
between the minimum and maximum temperature for a set of consecutive temperature samples.
The number of samples in each line is calculated so that the display shows the full capacity of the
thermochron model in use. The number of samples per line is displayed in the upper right corner of
the screen. The number of samples displayed is also shown in the upper right area. At a glance,
you can see the temperature pattern for the complete set of data collected by the logger.
For additional data views, there are four button icons that manipulate the screen display.
Tap Zoom IN Zoom OUT , Left , and Right symbols to move around the graph.
Zoom-In reduces the number of samples per line (the graph always has 64 vertical lines) to show
more temperature detail over a smaller time period. Zoom-Out increases the number of samples
per line to reduce the temperature detail over a longer time period.
The Left and Right arrows in the top corners of the display area move the start point of the data set
if the number of samples per line is less than the maximum. The time of the first temperature
sample (“Start”) in the display set is shown in the upper left field.

If you tap on a vertical line in the display area, a small window pops up with the time and
temperature of the first sample (in time) that is contained in the line.
If you have set high and low temperature alarms and they are within the temperature graph, a light
horizontal line will be drawn indicating the high and low alarm values. These help to detect over-
or under-limit conditions. The window will remain displayed as long as you hold your stylus on the
screen.
Tapping the Info button takes you to the display to Mission Data screen. If you have unsaved data
on the screen, you will be asked if you want to save your data
Starting a Mission
Missions are started from the Mission Data Form. Use this procedure:
1. Fill in and check required and optional fields. See below for details.
2. Select the Write Button function from drop-down menu in the upper right corner of the screen.
3. Make sure an iButton is attached to the probe.
4. If the Start button is visible, tap it. The application will attempt to start a new mission in the
attached iButton using the information displayed in the Mission Data Form.
If the Stop button is visible, a mission is still running in the iButton. It must be stopped before a
new mission is started. Make sure that you have saved any data from the attached iButton as
stopping and starting will overwrite data in the iButton. Then tap Stop. The application will
attempt to stop the mission and display the Start button.
5. After the mission is started, the application reports the event and switches the function to Read.
Tap Read and Save to save the data in the Palm database.
Required Fields
Access these fields by tapping on the status row on the Mission
Data.Screen
Enable and Rollover Selection
1. Enable - must be checked to log temperature.
2. Rollover - check Rollover to continue logging beyond the maximum
storage capacity of the iButton model in use. If this box is checked, the
thermochron iButton continues to take temperature measurements


collect the full capacity of the iButton (number of samples) in the interval between selected
Mission Start and Mission End. Be careful using this method as fractions of a minute are not
allowed, a limitation which may effect your selections for small intervals.
5. Temperature Units, Range and High/Low Alarms
Access the Temperature Range screen by tapping the High or Low Temp Alarm fields in the
Mission Data Form. The Setup Wizard takes you through this selection form.
Check Fahrenheit or Centigrade Units to display temperature data.
The application supports 5 Temperature Ranges, one for each iButton
type in use. Select the range and then select the high and low
temperature alarms. Your selection is subject to rounding, as the
temperatures are discrete integers, not continuous. The iButton models
and temperature ranges are:
Loggers with capacity of 2048 samples
G: -10 to 85 degrees C (14 to 185 degrees F) in .5 degrees C increments
H: 15 to 46 degrees C (55 to 114 degrees F) in .125 degrees C increments
Z: -5 to 26 degrees C (23 to 78 degrees F) in .125 degrees C increments
Higher capacity thermochron loggers
L: -40 to 85 degrees C (-40 to 185 degrees F) with two resolution levels
T: 0 to 125 degrees C(32 to 257 degrees F) with two resolution levels
High and Low Limits
You can specify an acceptable temperature range with a high and low limit. If an out-of-range
temperature is logged, a high alarm or low alarm flag will be checked on reading. This flag is
display is accessed by tapping on the status row in the Mission Data table.
When you issue the start command, the application will check the iButton serial number to insure
that the temperature range you have selected is consistent with the iButton model. If it is not, an
error message will be displayed.
Optional Fields
1. Mission Name and Number - while not required, these are helpful to
identify missions. Data may be entered using the Setup Wizard, from
your Application preferences, or edited directly in the Mission Data
Form. When you start your mission, name and number are written to
the iButton. Mission name and number are listed and visible in the
Database form, helping to select missions from the database.
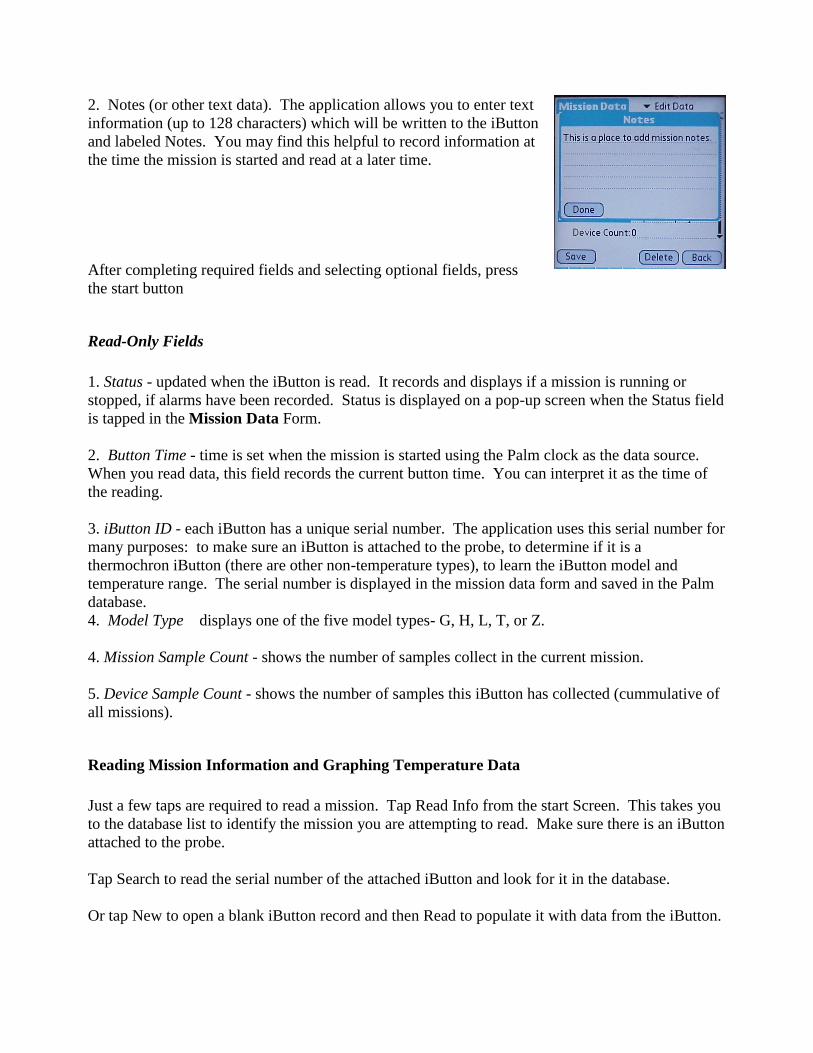
2. Notes (or other text data). The application allows you to enter text
information (up to 128 characters) which will be written to the iButton
and labeled Notes. You may find this helpful to record information at
the time the mission is started and read at a later time.
After completing required fields and selecting optional fields, press
the start button
Read-Only Fields
1. Status - updated when the iButton is read. It records and displays if a mission is running or
stopped, if alarms have been recorded. Status is displayed on a pop-up screen when the Status field
is tapped in the Mission Data Form.
2. Button Time - time is set when the mission is started using the Palm clock as the data source.
When you read data, this field records the current button time. You can interpret it as the time of
the reading.
3. iButton ID - each iButton has a unique serial number. The application uses this serial number for
many purposes: to make sure an iButton is attached to the probe, to determine if it is a
thermochron iButton (there are other non-temperature types), to learn the iButton model and
temperature range. The serial number is displayed in the mission data form and saved in the Palm
database.
4. Model Type – displays one of the five model types- G, H, L, T, or Z.
4. Mission Sample Count - shows the number of samples collect in the current mission.
5. Device Sample Count - shows the number of samples this iButton has collected (cummulative of
all missions).
Reading Mission Information and Graphing Temperature Data
Just a few taps are required to read a mission. Tap Read Info from the start Screen. This takes you
to the database list to identify the mission you are attempting to read. Make sure there is an iButton
attached to the probe.
Tap Search to read the serial number of the attached iButton and look for it in the database.
Or tap New to open a blank iButton record and then Read to populate it with data from the iButton.
Or if you recognize the mission as listed and want to update it with new data from the iButton, tap
it and then tap the read button to read mission info. Be careful as this procedure updates database
information with new information read from the iButton. It does not create a new record. This
displays name, number, iButton ID and time, alarms, number of samples.
Drop down the function menu and select Graph Data. This takes you to the Temperature Graph
Screen.
Tap Read to get temperature data from the iButton and graph it on the screen. Tap on Zoom IN
, Zoom OUT , Left , Right symbols to move around the graph.
Tap Save to store data read from the iButton in the Palm database.
Hot Sync to PC
The Conduit component of the Thermochron 22 System performs bi-direction data transfer between
Palm Handhelds and PC. It transfers mission records from the Palm database to the inbox on PC
and transfers records from the PC outbox to the Palm handheld database. Conduit action is set up
on PC using the hot sync action dialog. See the PC User‟s guide for more information on how to
setup the conduit and its operational results.
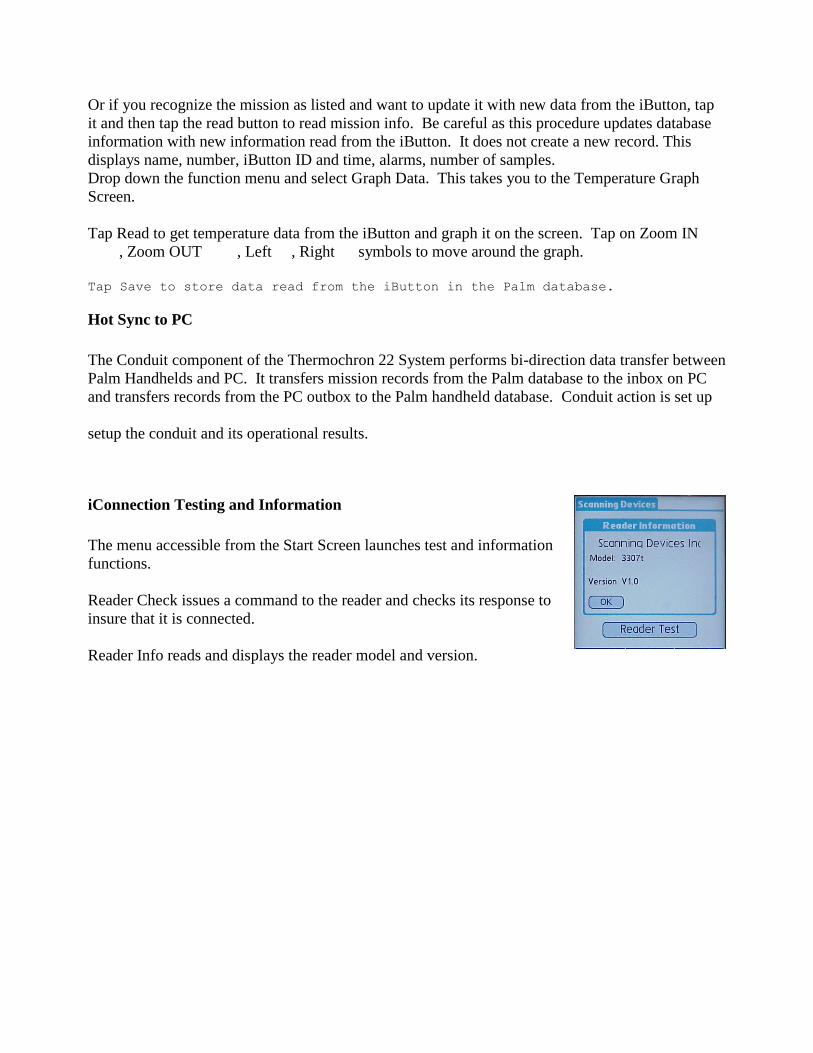
iConnection Testing and Information
The menu accessible from the Start Screen launches test and information
functions.
Reader Check issues a command to the reader and checks its response to
insure that it is connected.
Reader Info reads and displays the reader model and version.

Screen by Screen and Button by Button
Here is some detail on what you can do from each screen and with each button.
Application Start Screen
DataBase sets the function to Edit Data and takes you to the database
list form with the intention to edit an existing record or create a new
one. You can do this without an iButton or iConnection attached.
Prepare Mission sets the function to Write Data. It gives you three
options on how you want to prepare the mission: Select it from a
database item that you have previously prepared as a template; use
your preferences to build a new mission item or use the Wizard to take
you through a series of setup screens.
After your preparation, you will see your mission setup information displayed.
Read Button Info sets the function to Read Data. It takes you to the database list with the
intention of reading and displaying mission information (not temperature data) from the iButton.
Read Button Data sets the function to Graph Data. It takes you to the database list with the
intention of reading and displaying mission temperature data in graphic form.
Why are there two separate methods to read an iButton? Reading Information about a mission is a
fast operation. Reading temperature data takes more time. You can read the information quickly
first, look it over to see if you want to or need to read the temperature data.
Reader Test performs a check to see if the iConnection is attached properly. It issues a command
to the iConnection and waits for its expected response. You should see a message to tell you if it
got the right response. If not, you may have to re-seat your Palm in the iConnection socket.
The small „i” in the top right corner is an information icon. Tap on it and you will see a page
describing the actions you can take from this screen. Most Thermochron screens have an
information icon.

Database List Screen
Each mission in your Palm database is listed in one line. The line
consists of the iButton serial number, the mission number you have
assigned and the mission name you have assigned.
If you tap on the line, you will “open” this item and display its
mission information or temperature data graph. Which one you
display depends on the current function setting that was made on the
Application Start Screen.
Three buttons give you other choices:
New – makes a new database item with your preferences and displays the mission information or
temperature data graph, depending on the current function setting.
Search – reads the attached iButton serial number and looks for it in the database. It lists all the
mission items that match the serial number. There is a lot in that last sentence.
First, you should have an iButton and iConnection attached or the application will respond with a
“No Button or Wrong Button found” message.
Second, you might have more than one item stored for a unique iButton serial number. If you have
a practice of reading and saving mission information and temperature data using New, then you
will be accumulating many items from the same iButton.
Consider this method: When you come upon an iButton to read, use Search to check if it is in your
database already.
If not, then you will see “No matching items found” as the only entry in the list. Then use New to
make a new item.
If you see one or more, consider opening one of the listed items and update it with new information
or temperature data from the iButton.
Back – returns to the Application Start screen.

Mission Information Screen
This form is organized as a table with information labels on the left
side and mission information on the right. It also has seven buttons,
although no more than 4 can be displayed or are active at any one
time. It also shows the current function selection in the top right
corner.
Here is what you can do from this form:
Select you function - tap in on the Edit Data and you will drop down a list of the
four application functions. Select the one you want by tapping on it. Buttons
appear and disappear depending on your selection.
If your function is:
1. Edit Data – you can change any data by tapping on the mission information on the right side.
Either editing is done by pop-up form or in-place using Palm editing techniques. Pop-up forms are
used for entering and editing specific information elements that the application checks for
consistency. Text fields such as mission name and mission number use Palm editing including
graffiti or the on-screen keyboards.
Editing data does not change any information in the iButton. It works only on data in the Palm
database. Select the Write Button function to change data in the iButton.
Three buttons are displayed:
Save – takes information from the screen and updates the current item in the database. If you got to
this display by making a new item, it saves it as the first item in your database.
Don‟t forget to save your data after editing as it is not automatic. If you attempt to leave this screen
with unsaved data, you will see a reminder.
Delete – does just what it says, deletes the current item from your database. You will be asked to
confirm the delete. Be careful because there is no un-do for the delete after you confirm.
Back – takes you back to the Database list form.
2. Read Info – you can read from the iButton.

Tap the read button – this reads and updates all the information fields on the screen (including the
fields that have been scrolled out of view). Information updates only the screen. Don‟t forget to
tap Save if you want to keep it.
Three buttons are displayed:
Read – Reads all the information fields from the iButton and displays them on the screen.
Save – takes information from the screen and updates the current item in the database. If you got to
this display by making a new item, it saves it as the first item in your database.
Back – takes you back to the Database list form.
3. Write Button – this function takes information from the screen and writes it to the iButton.
While you might think that this should be a simple operation, there are several complications. Read
on.
Three buttons are displayed. Save and Back are always displayed, but the third depends on the
status of the iButton‟s mission.
Stop - If the iButton‟s mission is running, then writing mission information will cause it to stop. In
this case, the Stop button is displayed. Use the stop button to stop the mission without loss of data.
Start - If no mission is running, then the Start button is displayed. Use the start button to start a
mission. It generates the proper sequence of commands to start the iButton mission using the
information displayed on the screen.
Starting a Mission
Use this method to start a new mission in an iButton:
If a mission is running, (you will see the stop button or check the status information), select the
Read Info and then Graph Data functions to read the mission information and graph temperature
data from the iButton.
Save information and temperature data from the running mission if you want.
Select the Write Button function. The Stop button appears.
Tap Stop. You will see a message that the mission has been stopped and the Start Button appears.
You may save data from a stopped mission. Change the function to Read Info and tap Read. Then
change the function to Graph Data and tap read when the display screen appears. Tap Save to
complete the operation. Change the function back to Write Button and you should see the Start
button re-appear.

Don‟t tap start yet! Update the display with the information you want to use to start the new
mission, either from your database template item, using your preferences or the Application
Wizard. You may have to change the function to Edit Data or go back to the application start
screen to startup the Wizard.
When the information is set for the new mission, then tap Start. You will see a confirming
message.
Updating information in the iButton when a mission is running.
Three text fields may be updated when a mission is running: Mission Name, Mission Number and
Notes.
When the Write Button function is selected, tapping the information label (left side of the palm
screen) for these items writes the information displayed (right side of the palm screen) to the
iButton without effecting the status of the mission. A confirming message will be displayed.
Instructions are edited in a pop-up form and then written to the iButton.
Graph Data Screen
Selecting this function displays a screen for graphing temperature data.
The screen has four buttons, four sets of arrows for navigating the
screen and four display fields in addition to the graph area.
If you have reached this screen while making a new item or by
selected an item from your palm database with no saved data, then you
will initially see a blank graph as show to the right.
Tap the Read button to read temperature data from the attached
iButton and generate the graph. If you are reading from a high capacity
iButton, progress in reading the data will be displayed at the bottom of
the screen until the read operation is complete.
If you have reached this screen by opening an item from your database
and if that item has saved temperature data, the data will be graphed
automatically as shown to the right.
The Info button in the upper left corner changes the function to Read
Info and takes you back to the Mission information display for this
iButton. It reads information from the attached iButton on its way.
The Save and Back buttons are the same as on the other screens:
Save – takes information from the screen and updates the current item

in the database. If you got to this display by making a new item, it saves it as the first item in your
database.
Back – takes you back to the Database list form.
The four display fields describe the contents of the graph.
Start (upper left line) shows the date and time of the first sample in the graph. Mission Name is
shown in the lower left line of the information ares. The number of samples shown in the display is
shown in the top right line and the number of samples per vertical line is in the lower right line of
the display.
If you tap the arrows to zoom in or out, move left or right, the information display lines are updated
accordingly.
About the graph:
The Palm screen allows 128 data points to be displayed along the
horizontal axis. Since there are 2048, 4096 or 8192 temperature points
in the data read from the iButton, not all points can be displayed
individually. The application compresses data it and gives you several
options.
On the initial read and display, the application draws 64 vertical lines
with a blank space between each line. Each line is drawn between the
minimum and maximum temperature in a set of consecutive samples.
The number of samples in a line is one-sixty-fourth of the capacity of
the iButton, effectively displaying all temperature data on the opening
screen.
There vertical axis is scaled to provide the maximum span within the range of points displayed.
The number of samples per vertical line is displayed in the upper right corner in the text area.
The and symbols change the characteristics of the display. Tapping zooms in by
reducing the number of samples per line and the time period represented by the graph. Each tap
halves the number of samples per line.
Tapping zooms out by doubling the number of samples per line and the time represented by
the graph. The display updates to show time of the first sample in the graph..
Remember only 64 vertical lines are displayed at any one time. After repeated taps on , no
further changes will occur.

To change the display region range without changing the samples per line, use the and
symbols within the boundaries of the graph. Tapping moves left by the width of the display.
Tapping moves to the right. The time of the first point is displayed in the text area.
Each time you change the interval or range, the vertical axis is re-scaled to show the maximum
resolution of temperature within the range of points.
To identify a specific point, tap on in the graph area. A window will open with a display of the
date, time and temperature of the point.
Don‟t forget to save your data if you have read new data from an iButton. Only temperature data is
saved. The application does not save the number of samples per line or start position selected when
the Save button is pushed. The graph always starts with the samples per line selected to display the
full capacity of the iButton and it settings. The start of the display is always the first data point in
the data set. The temperature axis is always scaled to maximize temperature resolution.
For More Information
Contact Scanning Devices:
On the web: www.scanningdevices.com
Email: [email protected]
Phone: 781-272-5135
Fax: 781-272-4856
Scanning Devices Inc.
111 Terrace Hall Avenue
Burlington, MA 01803


![Instructions - GfK Etilizecontent.etilize.com/User-Manual/1018964183.pdfsimilar wizard screen appears in Windows XP/7, click [Cancel]. A Install the software Install the Scanning Utility](https://static.fdocuments.net/doc/165x107/5f991596582b2920096cc23f/instructions-gfk-similar-wizard-screen-appears-in-windows-xp7-click-cancel.jpg)