Scanned using Book ScanCenter 5022 · Sand, ‘"and* Siopi'ng Slay. j"' / 'The lahdscape' types'*...
118
/ ?77 PROCEEDINGS of the Middle States Division Association of American Geographers VOLUME XI , 1977 C.W. Post College of Long Island University Greehvale , New York October 21 -22 , 1977 S tates -1 /
Transcript of Scanned using Book ScanCenter 5022 · Sand, ‘"and* Siopi'ng Slay. j"' / 'The lahdscape' types'*...
/ ■ ■ ? 7 7
PROCEEDINGSof the Middle States Division Association of American Geographers
VOLUME XI , 1977
C.W. Post College of Long Island University Greehvale , New York
October 21 -22 , 1977
■St a t e s
-1
/

Volume XI, Proceedings of the Middle States Division, Association of Mierican Geographers, contains a record of the Annual Meeting of the Division, held at C.W. Post College of Long Island University, October 21- 22, 1977. Copies of this publication may be obtained from T.W. Kury, Dean^ State University College at Buffalo, New York 14222.
A note on the preparation of manuscripts for submission to the Proceedings appears on pages 114 and 115.
Statements and opinions in the Proceedings are the responsibility of the authors and do not necessarily reflect the views of the Middle States Division.
Officers of the Division, 1977 PRESIDENT
Martha L. CorryState Vn-Lverstty College^ Oneonta
VICE PRESIDENTRobert M. Hordon
Butgers--The State Vn-Lvevsity
SECRETARY-TREASURERPeter W. Rees
Vnivevs-ity of Delaware
AAG COUNCILORKennard W. Rumage
State Un-tvers'ity College^ Brookport
EXECUTIVE COMMITTEEMartha L. Corry Robert M . Hordon Peter W. Rees
Kennard W. Rumage Martin G. Orlins Peter 0. Muller
PROCEEDINGS " ••a P T H E ,
K iddle-'STATES di vi si on ‘ ASSOCIATION OF AMERICAN GEOGRAPHERS
i ^
-VOLUME )CL 1977
C.W. POST COLLEGE OF LONG ISLAND UNIVERSITY GREENVALE^ MEW' YORKOCTOBER 21-22^ 1977
e d i t o r :M a r t h a L. Co r r y
STATE UNIVERSITY COLLEGE OF NEW YORK^ ONEONTA
MANAGING EDITOR':Pe t e r W. Re e s
UNIVERSITY OF DELAWARE
C o p y r i g h t 1977, Middle States Division Published by Department of Geography University of Delaware, Newark, Delaware 19711
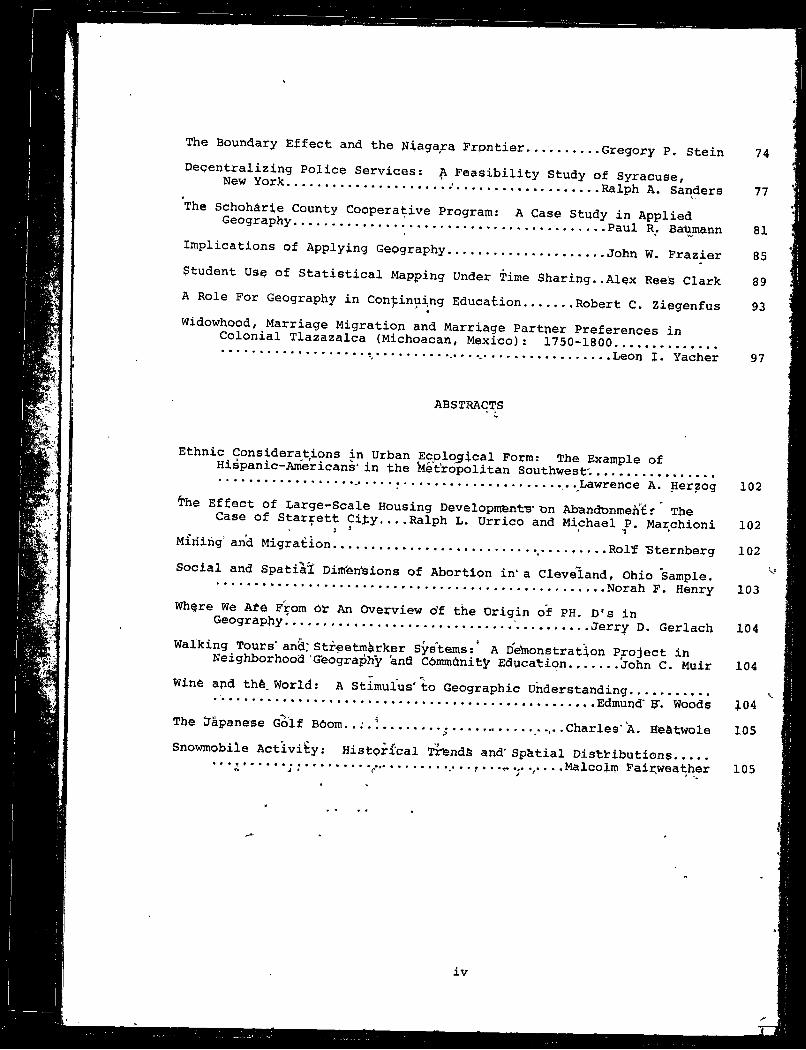
74The Boundary Effect and the Niagara Frpntier.......... Gregory P. Stein°®' ®”New^iork^ Services: ^ Feasibility Study of Syracuse,
...................... Ralph A. Sanders^GeoaJanhv^°''"^^ Cooperative Program: A Case Study in Applied
*.......................... Paul R. BaumannImplications of Applying Geography.................... . w. FrazierStudent Use of Statistical Mapping Under Time Sharing..Alex Rees ClarkA Role For Geography in Cont:inui.ng Education...... Robert C. ZiegenfusWidowhood, Marriage Migration and Marriage Partner Preferences in
Colonial Tlazazalca (Michoacan, Mexico): 1750-1800......... Leoi) I. Yacher
77
81858993
97
ABSTRACTS
Ethnic Considerations in Urban Ecological Form: The Example ofHispanic-Americans’ in the Metropolitan Southwest'................................. -..... .Lawrence A. Herzog
The Effect of Large-Scale Housing Developments-on Abandonments' TheCase of Starrett City---Ralph L. Urrico and Michael P. Marchioni
Mfriihg and Migration.......................... SternbergSocial and Spatial Dim'en'sions of Abortion in‘a Cleveland, Ohio Sample.
........................ Norah F. HenryWhare We Ata From Or An Overview o’f the Origin of PH D's in
..............................■......... Jerry D. GerlachWalking Tours_an|; stroetmarker Systems:* A D^onstration Project inNeighborhood Oleography and COmmUnity Education...... John C. MuirWine and the. World: A Stimulus'to Geographic Understanding....... .
...................................... Edmund' S’. WoodsThe Japanese oSlf B6om.. !....... ...... ....... .Charles'A. HeatwoleSnowmobile Activity; Historical Trends and' Spatial Distributions....
' ‘ ' I ......j ..........r”...................... . .Malcolm Fair.weather
102
102102
103
104
104
104105
105
iv
SPECIAL SESSIONS
The Water Resources of Long Island: A Classic Case of GeographicLimits...................................... Chair: Leonard Zobler 106Issues in Geographic Education................... Chair; Arlene Rengert 112Applied Geography: Some Examples and Implications.................................................... Chair: Martha L. Corry 113
****
Instructions for Papers Presented at Annual Meeting of Middle States Division, AAG................................................. 114
V
THE USE OF LUNR IN AGRICULTURAL LAND USE RESEARCH'* Jon P. Amato
State University College, Buffalo
LUNR is the acronym f' r thei Land Use and Natural Resource Inventory developed by the Center for Aeria^ Photographic. Studies at Cornell University for-the New York State’Office of Planning Coordinati*on. It is a statewide, computer-based geographic information'system that provides a detailed portrait of the State's land use and natural re’SOurces.(1)Basic data for LUNR were coihpiled from air photos(1:24,000) taken in April and May of 1968. This information was then tra'n'sposed‘o'ntb ”bverlays for each 7-1/2 minute-USGS quadrangle (1:24,000) 'covering the tateJ.
Unlike most previous inventories in which information was* only mapped, LUNR data were fed into an information bank which incorporates a spatial referencing, system based on the Universal Transverse Mercator (UTM) grid.. The, one square_Jdlpmeter grid cell (100 hectares) is the basic reference unit; it is-the key to all data handling-, propessing, storage, and display; Approximately 140,000 of these cells cover New York State. Data fi nf _each*^7-l/^'minute map ov^erlay-are summarized for each square kildmeter”c"ell”within, the quadrangle as acr.eages,} hectares, and percentages *i'n a certain Land use (of which' fifty’types were classified), as,-miles—of -d^ne^r-features, and as counfs o'5 various ,point "]iterns. The computer progranf fo:p retrieving\this data, is-known as DATALI^T.'
Although the LUNR>.Inventor-y. was-developed for long-range land use planning in New York State, and- has been used mainly by regional and county planning agencies,~T21 it .is also a'‘pdtentially valuable analytical tool in agricultural geography, j Thib "pap^r ipTjI^tr.ates how the LUNR system was utilized in a s tudy of the, Relationship between agricultural land use patterns, and the ph’ysickl environmept* in the two western New York counties of--Enie--and~Nikgara.-(3) The- focus of* the paper is on the methodology employed to organize land--useland-.physipal environment data into a format suitable for quant;Ltative analysis.
' r IORGANIZATtDR.X)F„LANll£sE' DATA
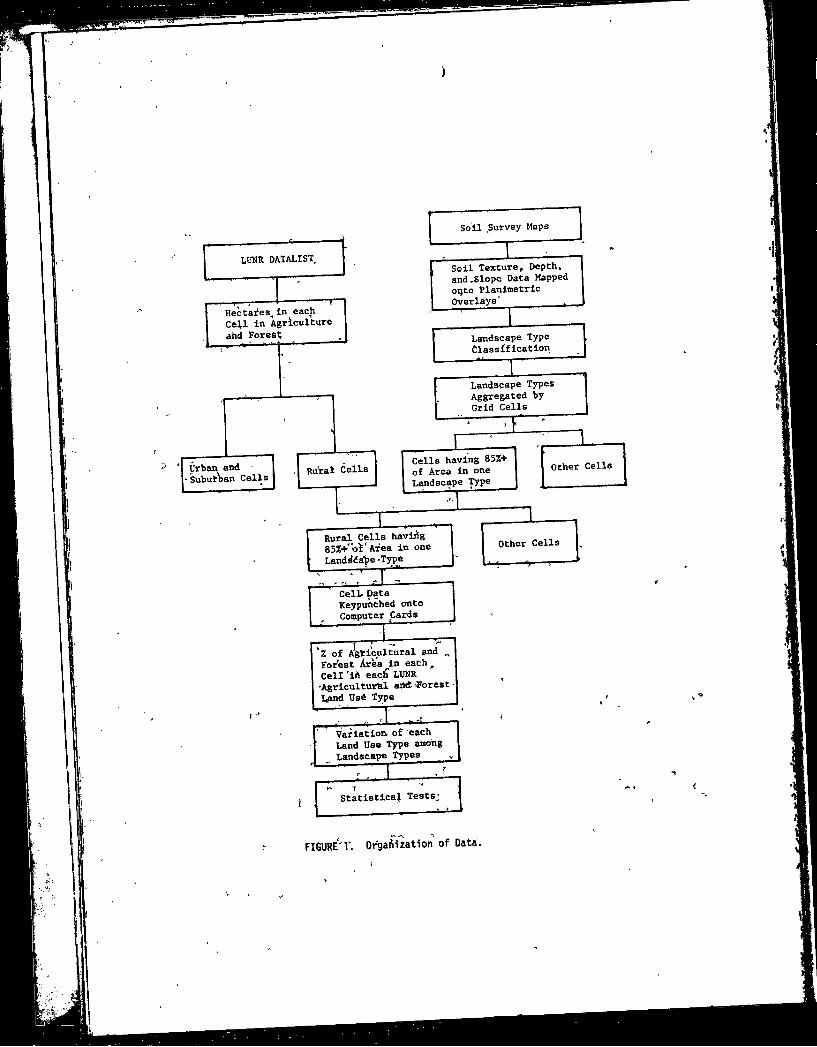
Land use information for eacH"" square klj.’oraeter grid cell in the study area was obtained through the LUNR User' Service at Cornell University. Grid cell data retreived by DATALIST, iiicludedj the number of hectares in each of the agricultural and forest, land use types classified by LUNI : orchard, vineyard, horticulture and floribulture, high intensity cropland, extensive cropland', periftkridnt pasture, inactive agricultural* land, specialty farmlands, forest brushland, natural forest, and forest plantation (Fig. 1). • *
Agricultural land use patterns_in parts, of-the study area are affected by urban sprawl, especiay.y around thg^Byifalo Urbanized-Area, and by various forms of rural, npn-farm development. An attem.pt was m.ade to minimize' the impact of these factors’ in -the-analysis by excluding the following grid cells from the stidy:---- - — -
1. Cells with less than 85 hectares in the LUNR agricultural and forest land use types. ""
2. Cells within the corporate boundaries of a city or village.3. Cells bordering a city corporate boundary.4. Cells within the Buffalo and Niagara Falls suburbanizing
1
lunr datalist
Hectares. Cell in A and Fores
in each jriculturet
'f
' Urban and ■ -’Suburban Cells Rural Cells
Soil Survey Maps 1Soil Texture, Depth, and.Slope Data Mapped oi)to Planlmetric Overlavs'
Landscape Type Classffication
Landscape Types Aggregated by Grid Cells
i *1 -J_ _ _Cells having 85%+ of Area In one Landscape Type
other Cells
Rural Cells having 85%-r'nt’ Area in one Landsca'pe -Type
Cell- Data Keypunched onto Computer Cards□
“% of A^lculbural and Forest Area_ln each. Cell 'ift each LUNR 'Agricultural and-Forestland Usd Type_____
1 Variation of each Land Use Type among Landscape Types
Statistics}. Tests-
Other Cells
f
/*< <
FIGURE'r. Organization of Data.
zone.(4)Over l,800^of the-approximately 4,200 grj.a "c'eais c33verin‘g 'CHe sliudy area fell into one or more of these categories. The remaining cells, of which there were 2,372, were designated as Vural". Not all of the rural .cells, wete incor|)o::ated into the analysis,' however"They" had”to satisfy one other criterion, to be discussed below.
ORGANIZATION OF PHYSICAL ENVIRONMENT DATA -physical environment factor was operationally defined in terms
of soil texture-soil depth-slope complexes, henceforth palled ,landscape types. Data were derived from post-1960 soil survey manuscript maps on an airphoto base (1:15,840) and accompanying soil descriptions provided by the Soil Conservation Service. Inform.ation on the geomorphic origin and texture of the soil parent material, on depth to bedrock, and on sloped chairScter-istics, was transpdsed from the soil survey maps to trans—
'’-parent* overlays^ tff 7— 1/2 minute -New York State planime1;r”iG maps (1:24,000) (Fig. 1). The vafipuS categories exhibited by these factors were then
'"g'dneralized into a- classification of landscape types. Viz.: 'Level Sand,Level Clay, Level Till, Level Till‘over‘Bedrock, Level Sand over Clay, -Level defy oveir Sand*, 'Sloping fill, 'Sloping Till over Bedrock, Sloping- Sand, ‘"and* Siopi'ng Slay.j"' / 'The lahdscape' types'* Ve*re then aggregated'by square kilometer grid- ceir. The first’ step in this pfobedure was 'to' bo'nnecf the tick marks *■' sphcfed 'one' kilometer apart on'the* marglhs- of’"the planimetric maps, thereby forming a square kilometer UTM grid pattern 'on each map. By observing ■the soil pexture, depth, -and slope data on the transparent overlay sheets in rdlatibn to’'the 'grid cells,becafne Apparent which cells were occupied by'which‘landscape ty'pe( -)'. Only those* cells having 85 percent *br rtbre' of 'their’ areh -in one landscape type' were eligible for incorporation into the ■analy'sls*'.
* « i* h 7 INTEGRATION-‘OF 'LAND USE. AND' ‘PHY-StCAL ENVIRONMENT DATA
A total of 739 grid cells“met’ all of the*criteria for incorporation into the analysis; i.e., they were classified as rural cells having 85 percent or more of their area given over to one landscape type. Data coded from each of these cells were recorded on computer punch cards.They included the UTM grid_coordinate number of the cell, the landscape type desighatipn’, and the" humbdr of hectares in each LUNR agricultural
" ’and fprest land use tjpe. The total' number of hectares in these land ■'usfe.-types Was'-''th'fe'?i-divi'ded into'the number of hectares in each of the respe^tiV^ ’land* use tyfies* multiplied by 100, sp'that land use" type data ■fotJeach* cel-1 wer^ expressed as a percfentage of agricultural and" forest a'rea. ' ’
, ,
THE DATA ‘ANALYSISWith the data organized ipto the above format, the relationship between Ihnd (ise' types and landscape types^ could be"‘analvzed. The first
step in the analysis consisted' of determining the' mein percentage of , the_ agricultural and forest area of the grid cells, comprising pach la’nd- •scape type-''4iveh ove'r to a specified land'use'type! An example'of the
'* output resulting-trbm’ t is* computation'is illustretfed'^fbr..qrchhra^iand use oh” thfe Out'er Ontario Plain, I'.e., the'area w'ihhih'eight )cil9me1:ers of'the Lake Ontario' shoreline. (Table*'1). ' rt) •
• T ' j i*I *
3

TABLE 1PERCENTAGE- OF AREA OF. OUTER ONTARIO PEAIN LANDSCAPE TYPES IN ORCHARD
- * "1 'Landscape Type Orchard as % bf Agricultural
and Forest Area
Level Sand 59. aLevel Clay 12.8Leyel Till 4.2
SOURCE: Computed by authorIn the course of testing hypothesized land use/landscape type
relationships, it was sometimes necessary to determine whether the mean percentage of the area of a certain landscape type given over to a speci:^ied land use was significantly greater than those of other landscape types. In the case of prchard land use (Table 1), for example, is the Level Sand mean percentage significantly greater than that qf Level Clay and of Level Till? Analysis of variance could not be used as an .initial test for significant differences among these mean percentages because their variances were heterogeneous. An alternative test developed by Welch (5) to overcome this type of problem was therefore applied to the orchard data. It indicated that significant differences existed within the data set at the 0.005 level of probablili'ty.
It still reamined to be determined which mean percentages were significantly different from one another. .Scheffe's (6) test was employed for this purpose. It indicated that the Level Land value was significantly greater than that of either the Level Clay or the Level Till at the0.005 level of probability. Thus, ,it seems quite certain that landscape type exercises a significant influence on-t|ie distribution of orchard land use within the Outer Ontario Plain. Level Sand sites within this region, compared with other site types, are preferentially devoted to orchards.
CONCLUSIONThe employment, of the LUNft Invehpory as a,data base in land use.
environment research overcomes major methodological problems encountered in previous studies. For example, spatial covariation between environmental conditions and land use .was usually determined by the visual comparison of maps. liUIJR permits a mpre sophisticated analysis because information from other sources (such as*soil survey maps) can be coded to the UTM square kilometer" grid, stored in numerical form in the computer, and subsequently combined or quantitatively manipulated with the land use data.
Those few studies that have dn the. past .attempted to assess quantitatively the degree of association between land use and physical environmental conditions were constrained by data, aggregated at relatively large units of observation (viz. townships-or counties), thereby obscuring important variation in these conditions. .The aggregation of data at the square kilometer level provides for a fine grid mesh, thus minimizing the loss of land use and environmental detail. In conclusion,- the LUNR Inventory can serve as a valuable analytical tool for refining the empirical techniques necessary to assess the importance of the physical
4

environment in the aphtiel organization of agriculture.REFERENCES CITEP
1. D.J. Belcher, et al. New York State Land Use and Natural Resource Inventory t Final Report (Cornell University Center for Aerial Photographic Studies,. 1971) .
2. New York State Office of Planning Services. Survey of Users: LUNR.1974. ----------------------3. Jon P. Amato. The Physical Environment Factor in the Analysis of
Agriculti^al Land Use Patterns; A Case Study in Western New York, (Ph.D. Dissertation, University of Toronto, 1976). Microfilmed, National Library, Ottawa.
4. Erie and Niagara Counties Regional Planning Board. Adapted Land UseConcept (Map). Newsletter II: 1970. No. 4,5,6; Erie County andNiagara County Departments of Planning. Svunmary Report of Erie- Niaqara Regional Plan; 1961.
5. B.L. Welch. "On the Comparison of Several Mean Values - An Alternative Approach," Biometrika 38 (1951); 330-336.
6. H. Scheffe. "A Method for Judging all Contrasts in the Analysis ofVariance," Biometrika 40 (1953); 87-104.

CORN FARr^ING FOR THE FUTUREDonald Q. Innis
State University College, Geneseo
Corn (ZEA MAYS) is at prsssnt on© of the most productive crops that hag ever existed. Its modern productivity is not so much dependent on fertile soil, where fertility is kept up by careful farm management,
xt xs on putting chemicals into the soil. The chemicals come from mxnes, which means that modern agriculture has become largely dependent on resources which cannot be replaced.
In 1840, Justus von Liebig published a book in which he proposed that adding appropriate chemicals to the soil would enable plants to grow more quickly. His idea has been adopted to such an extent that modern agriculture is now largely dependent on such added chemicals. Phosphates come largely from mines in,Florida and Morocco, potash from deep mines in Saskatchewan and nitrates from .natural gas via the Haber process. Pesticides and herbicides,are made from petroleum which is also becomxng scarce. The crisis in modern agriculture and the need to design new possible futures is not caused solely by minerals which are becoming scarce. The few countries which now possess large reserves of essential minerals have suddenly realized that deriving any large monetary or developmental benefit from these resources must be done now, before the resources are all gone. Cartels to raise prices give all countries an incentive to switch over to permanently viable methods of food produc- txon while some mined resources are still available.
Using corn.as an example it can be pointed out that super—productive hybrid corn has been developed because chemical fertilizers are so commonly used. Old fashioned varieties of corn, which are still grown in some parts of the world.cannot make efficient use of 'heavy doses of nitrates, phosphates and potash. Hybrid, varieties of corn have been bred to have much greater growth potential and can produce up to 200 bushels of corn per acre.^ Hybrid corn l as also been designed to be dependent on chemxcal insecticides and weedicides; since new wonder chemicals are available it has not been necessary ^or corn breeders to worry about developing resistance to insects or competition with weeds. Because much of,the corn grown at present has been bred to be dependent on chemicals which are derived from non-replaceable sources it is going to be jguite •difficult to design other types of corn farming, apd perhaps even more difficult to persuade modern farmers with large acreages that change is possible and essential.
Richard Merrill, in an excellent chapter of a book called Radical Agriculture, which .he edited, points out that about .2 percent-of the organxc solid waste produced each year in the United States is returned to the soil. Sewage sludge is dumped in rivers, lakes, oceans, or-old mines while manure from feed-lot cattle .and pigs has al,so become a waste disposal problem instead of a source of nutrients. (1) It seems almost incredible that much dried sewage sludge has been incinerated using natural gas, in effect using one valuable natural resource to destroy another.
It seems fairly clear that ways can be worked, out to develop a type of agriculture which depends on renewable resources, but the free'inter- plsyof economic forces may not allow this to happen for some time. As fertilizers, insecticides, herbicides, gasoline and machinery increase in cost the amQunt of investment and working capital needed to produce a crop
6

on a large modern farm will continue to increase. This is one of the main reasons why banks and big corporations are taking over ownership and management of more and more farms. If high costs of operation have increased the concentration of farm ownership by agri-business, as opposed to family ownership, then it stands to reason that still higher costs will lead to still greater concentration of the agricultural industry in the hands of big business.
Bigness is not necessarily bad, but big farms, heavily dependent on gasoline, petroleum derived chemicals, natural gas, phosphates and potash are not the type of agriculture which has a very long future. The great tragedy of the coming century may be that the enormous human population which has grown up, based on nutrients taken from reserves deep in the ground, cannot be supported during the period of change over to depen- •dence on soil fertility, recycled nutrients and small intensively worked farms. ‘
Small farmers are often more efficient than big farmers. It is not widely realized that the efficiency of modern machine-chemical agriculture depends very largely on special definitions of the word efficient; The cos’t of supporting people'who have been driven from the land as small farms' give way to big farms is not counted when the "efficiency" of modern agriculture is measured. The extra yield produced when t«?o or more crops are grown together in one field is not counted because the majority of modern agricultural experts have decided to measure the yield of only one crop per field. The greatest totkl yield is however obtained when two or more crops are grown together in a field.
To quote from an agricultural experiment at Pantnagar, India, "the total yield by monetary value of moth soybeans and corn is greater when there are two crops in the field instead of one, when little or no nitrogen fertilizer is used." (2) When no nitrogen was added the corn grown .alone yielded 2,100 kg/hectare, worth 1,344 rupees. When two-rows of corn were alternated with one row of soybeans the total yield was 4,088 kg/ha of corn plus 217 kg/ha of soybeans, giving a total monetary yield of 3,006 tupiees. The addition of nitrogen fertilizer prevented the soybeans from fixing atmospheric nitrogen so fehat the addition of 150 kg/ha of nitrogen lowered soybean yields and increased corn yields to a level where corn grown alone was about equal in value to the corn-soybean mixture. It will be seen that assessing the aid which legumes can give to other crops is difficult when nitrogen fertilizer is added as a matter of course in ntany agricultural experiments. In the Pantnagar experiment, however; 'the value of leguries nitrogen fixation was compared with the 'addition' of nitrate fertilizer, with the conclusion that one row of soybeans per two rows of corn was about equal to adding 75 kg/ha of nitrogen fertilizer. This is a very valuable conclusion for future farming, in Tariganhyika varying densities of peanut plants per acre were intercropped with varying densities of maize.(3) One intercropped acre produced on the average as irtuch as 1.54 acres of crops grown alone. Two half acres of pure stands of corn .aftd peanuts at medium population density produced 837 pounds of cotil and 299 "pounds of peanuts whereas 6ne acre of corn and ‘peanut plants alternating within each row produced 1,218 pounds of corn plus 329 pounds of peanuts. Where corn and peanuts were planted in alternate rows the yields were 1,085 pounds of corn plus 255 pounds of peanuts per acre. These figures show how modern mechanized monocropped agriculture has- reduced total yields.
An experiment in Virginia from 1951 to 1954 showed that corn plants •yielded 30 percent more when corn and soybeans were planted in alternating double rows.(4) An experiment in the Punjab, India to see what could be
7
grown in the relatively wide spaces between the newly introduced hybrid corn plants showed that corn and soybeans together yielded an average 2,900 kg/hectare total in 1965 and 1966 as against 2,440 kg/hectare for corn grown alone. (5)
Corn is a crop which grows relatively quickly so 'there are perhaps two ways to consider getting extra crops from corn fields. One method would be to grow small quick growing crops between the dorn 'plants and harvest them before the corn grow to full si^e. The other method, which would' be used in the tropics or areas with a long growing season would be to grow crops which grow more slowly than corn and which could take over the field after the corn has been harvested.
.An experiment -with alternating rows of dorn and sesame j.n central India (Madhya Pradesh) gave a 33 percent increase in monetary yield in 1969 and 47 percent increase* in 1977 .compared to mai* e grown alone. (6)In western India it was found that black gram, which i§«a'Small legume, w&s the'best intercrop with maize.(7) 'Black gram increased the protein content of the maize grain, increased the yield of corn, gave a small additional crop of .black gram .seeds and improved the nitr;ogen content 3Jf the
?? much that a following crop of linse^ always -yi^Wed -nJOte in a field^where black- gram-,- green gram or cowpeas had been grovm than when linseed was the following crop in a field where corn had been grown alone. In, tropical areas .where nitrogen is quickiy leacljed from the ground or rendered chemically inert it is more important to r§ly on in.tetcropping than on crop rotation. The native peoples of tropicai countpies practice intercropping for this reason.
An experiment in southern India (Tamil Nadu-), tested eight quick growing crops as poss'ible useful intercrops with hybtid maize‘1 (8) None of the vegetable (okra, radish, .cowpea, cluster .beans., lab lab, beet root, carrots or knol) had an effect on maiz'e yield so’ the valu^- of the vegetables can all be considered as extra yield. ' Okra was the most satisfactory crop since it gave an average additional 934 rupees/hectare in the summer seasons and 2,632 .rupees/hectare for two monsoon seasons.
Pigeon peas-are a longer lived crop than corn, ready for harvesting eight weeks after the corn harvest. An experiment in Trinidad in 1972 comparing pigeon peas and corn mixed within each row, against planting in alternate rows showed that by the date of corn harvesting (16 weeks after both were planted) pigeon peas had absorbed only 6.5 percent and 11.2 percent of the total pigeon pea potassivim uptake, for mixed stand and alternate rows respectively.(9) The pigeon peas started flowering after the maize harvest; the period of maximum growth and maximim demand for nutrients did not take place at the scime time, as happens when two corn plants are grown together. Total grain yields in. kg/ha were 3,130 fdr maize alone, 1,871 for pigeon peas alone, 3,735 for mixed stand of the two crops and 4,460 for alternate rows.
The conclusion of thia study of corn yields is that there are better methods of farming than "modern" farming. The decline of large scale farming as resources of petroleum, natural gas and mineral fertilizers are used up need not be a tragedy. Small scale farming where many more people work on the land and are involved in proprietory decision making will produce a society in which more people have a Stake in making society work. Soil fertility can be maintained along with adequate yields as society learns to recycle nutrients and use age-old intercropping and crop rotation methods with new disease resistant hybrids. A great deal of scholarly and practical work will be needed to develop types of agriculture dependent only on resources which can be perennially renewed, but the work can be done.
8
REFERENCES CITED1. Richard Merrill, ed. Radical Agriculture, Chapter 16, "Toward a Self-
Sustaining Agriculture," (Harper Colophon Books, New York, 1976), pp. 284-327.
2. I(.C. SHarma, M.C. Saxena and Tajuddin, "Intercropping Maize and Soybean in Tairai," Indian Fatiner's Digest (August 1969) Volume 2, No.8, pp. 33-36.
3. A.C. Evans, "Studies of Intercropping, 1-Maize or Sorghum with Groundnuts," East African AgricuTturar and Forestry Journal (July 1960), Vol.- 26i pp;’ 1-10. 71 ’
4. M.W.- Alexander dnd C.F. Centner, "Produdtion of Corh and Soybeans iij -Alterriafe Pairs of Rows," Agronomy Journal (1962), Vol. 54, pp. 233-234 s-
5. S.D. Natang, J.MT kaul, et al., "Beneficial Effect of Maize-rSoybean 'Intercropping 'to ^Sried NPK Levels," Fettirizar News (June 1970), -Vol. 15-, pp. 35-36.
6. P.P.KSingh, V.P. Nena and P.K. Koushal, "A study of Intercropping -Sasamuitr v^th Maize and Mung (beans)," 'Indian Journal ot Agronomy(December'1972), Vol. 17, pp. 294-296;
7. S.B. Roy and M.N. Shahani, "Intercropping Legumes in Hybrid Maize," !Allahabad Fatm^ * (Marct 1970), Vol. 49, pp. 49-53.
8. K. Ma*enafeeKi, “7v.'R.*P. "Khan ;and R. Appadurai, "Studies on liltercroppingof Shbrt'Daratibn vegetables with Maize,* Madros Agricultural Journal (August 1974)", -Vol. ,61,, p. '3^8-401. ‘ '
9. R.D. Dalai, "Effects of Intercropping Maize‘with Pigeon P6as on Grain Yield and Nutrient Uptake," EXperimentaT AgriOulture (July 1974),Vol. ID, pp. 219-1224.
9

1„ " ITHE GREAT.AMERICAN DESERT AND NEBRASKA SETTLEMENT
Fredeirtck Piellusch Mansfield State College
, The Great American Degert concept has Been discussed »for -decades j Jiistori^ns and historical geographers. Acceptance was challenged by
riartyn Bowden who expressed the belief that, "The" MytK of thfe Gfdat American Desert as a popular image of the Western Interior Befdr^ the Civil War is itself a myth."(l) This paper is an attempt to consider the ^degsrt^ cpncept's role in the settlement of a part of the -Great American Desert, Nebraska. ^
Nebraska was known to Americans before settlement was allowed by the Kaps^s-Nebraska Act il854). The Mormon and Oregon trails and the transcontinental connection by railroad were chosen by thousands of immigpapts but surprisingly few people selected Nebraska for settlement.Few seemed to hold that Nebraska was a new land, a place -not necessarily completely unoccupied but land suited for development ‘and attractive as a place for a fresh start offering a chance for success.
Twenty-eight years after the Kansas-Nebraska Act, Robert Porter stated that based .on the Tenth Federal Census, 1880,; (2). a*
_ ■ t '
Consider that four-fifths of the present population of Nebraska is sparsely scattered over about one- fifth of its entire area along its eastern border.|Vll its cities of five thousand; inhabitants and' upwards, and ninety-five percent of all its manufacturing interests, lie within these narrow limits; while more than four-fifths of 4-"ts agricul^piral products have been gathered from a cultivated arecp legs rithan :one- fifth of this fraction of the state, or, say, from one-twenty-.fifth of the whole.
Census figpres indicated that in 1880 there was a, total population in Nebraska of 452,402 and a total-of 63,387 farms were^present. No county had more than 80 percent of its area in farms, and.only four' counties had more than 75 percent of their area i-n farms•- In 1-880 Nebraska remained an area* available .for settlement, and the pext five-years j 1880- 1885, represent the main period of tije-boomjdecade that Sheldon described as being! the time of.: {3) ' , i
" -...the largest .addition to our population; the* greatestincrease in our production; the furthest extension of railroad mileage; the greatest change in the physical aspects of our state. . More land was taken by. settlers in this period, more livestock added, larger- increase ii\.crops of .all kinds, more, new .towns were founfled, more po.st offices were established, more... ,
' iand availability was not enough to attract settlers. ,An iipportant element in the settlement process was the area's reputation as projected to the nation, and especially to potential settlers. It was the belief among‘settlers of either'the positive or the negative publicity .that served to 'influence the pate, and direction of settlement into Nebraska.'The kpectacular agricultur'al growth of Nebraska was based on the multiple
10
combinations of factors that included above normal precipitation (1878- 1886) accompanied by the widely publicized Aughey-Wilbur comments (1880) on climatic changfe. The'se factors came into play at a time when thousands of immigrants were seeking free and cheap land a commodity Nebraska still contained in quantity. In the 1880's Nebraska became a popular new land and its population increased to 1,062,656 and its numbers of farms increased to 113,608 by 1890.
Early American experiences with the Great Plains region resulted in the formulation of the-Great American Desert concept. Noted explorers and military men, such as Long and Pike espoused the view that the region was inhospitable-, without agricultural capabilities, and even a barrier to settlement.
The detrimental effect of the desert concept on Nebraska's settlement was expressed in the 1871 Annual Report of the State Board of Agriculture:
•The present fertile State of Nebraska, was known only a few score of years ago, and mapped out as a portion -of the Great American Desert. A decade and a half has changed all this, irtost marvelously, and the "American Desert" has vanished into thin air and Nebraska stands characterized for fifty millions of acres more than ordinary fertile lands.
Similarly, nearly a decade later, the first issue of the Rural Nebraska reported: (5) -----An impression prevails to some extent in the Eastern States, growing out of the theory of the earlier geographers of the existence of a Great American Desert, ‘that Nebraska is deficient in water supply and 'subject to frequent drought. This impression is entirely erroneous. -No section of the west is more -abundantly watered with streams, both large and small.
Many said that Nebraska was too dry for agriculture, others denied it, while a third group began to emphasize climatic change as a valued characteristic. Thn Nebraska farmer' was aware of the variable nature of precipitation, sfeasonably and spatially. The newspapers of the period include numerous references to prospects for good crops due to good rains while the opposite was reported from another nearby place. Extremes in precipitation- were also expressed when references were made to the torrential thunder stowns ot td the" localized droughts. Dr. Childs of Platts- ™^nth emphasized that seasonality was important when he advised residents to remember that, "...the largest portion or our rainfall occurs during the growing season of vegetable just when it is most desirable."(6)
The thifiking of many was greatly influenced by cliches such as "tillage produces rain" or "rain follows the plow." Others believed that observations, experimentation, and scientific authority did indeed prove that the climate of the plains was getting more moist on a permanent basis. Whatever the reasoning, it was based on optimism and positive thinking based on limited experience, with little use of the available data as supportive evidence.
The most prominent advocates of increasing precipitation were Professors Samuel Aughey and D.C. Wilber of, the University of Nebraska, who promoted the idea that increasing precipitation could be attributed
11
to the environmental changes which accompanied cultivation. Aughey estimated that cultivated land could absorb three times the moisture of prairie sod; therefore, more moisture would be available for evaporation; arid this moisture in turn would become the source of the atmospheric water needed to increase precipitation.
Rather than statistical evidence, Aughey relied on empirical evidence such as the replacement of vegetatiqnal forms associated with aridity by those native to moist areas, the appearance of springs in new areas, and the resumption of stream flowage in formerly dry drainage beds.
Another voice, prominent in the dispute, was tl\e group that preferred to emphasize that trees were responsible for the increasing p'recipitation. Settlers brought "tree planting" to an area where Indians had used fire as a hunting tool. It was this cultural reason, rather than an environmental one, that was used to explain the grasslands, and the lower precipitation levels. A Dr. Miller at West Point, Nebraska, was quoted in the Nebraska Farmer as saying;(7)
It is largely due to the growth of young and the protection of old forests in western Iowa and eastern Nebraska in the last thirty years, that we have seen the gradual measure of rainfall in this region, and the same influence has extended the rainbelt a long reach to the westward.
Two issues earlier, the Nebraska Farmer added a third variable to explain increased precipitation:(8)
The tread arid tramp of millions bf livestock now herding on our western borders are contributing to future supply in that region, by bringing to the surface now dormant subterranean currents or deposits.
The optimism of the early 1880's was substantiated by the above normal precipitation recorded and published during the years from 1875 through. 1886. Unfortunately, little analysis of the data sources and applications were made until after 1890. The*Nebraska State Board of Agriculture published data in 1879 that were designed to give people the oppottunity 'to compare records on rainfall in ot'her ‘states with that of Nebraska. (Table 1)
It is understandable how many could believe that if agriculture was possible in these eastern cities with less than^ fifteen inches of precipitation'during the growing season, agriculture could be successful in Nebraska too— especially if precipitation was increasing. Largely ignored was the pfesvunable fact that the record for Plattsmo^ith was short-term and for a period of, above average precipitation, futhermore, Plattsmouth may "hot be representative, of the entire state as it is in far southeastern "Nebraska. Also forgotten .were the dry years of the early l§70's.
The importance of precipitation in' the mipds, of Nebra,skans during "the early 1880*s is' evidenced by the upheaval caused by Major Powell's report. Lands of the. Arid Regibri published in 1879,_ which designated the 'land west of’-the' 100 th meridian as lapd unfit feor agriculture due,- to the marginal character df the precipitation. This was' tbf,moSt recent official report that put Nebraska in an unfavorable' light. The report caused an uproar in Nebraska, including a resolution adopted by the State Board of
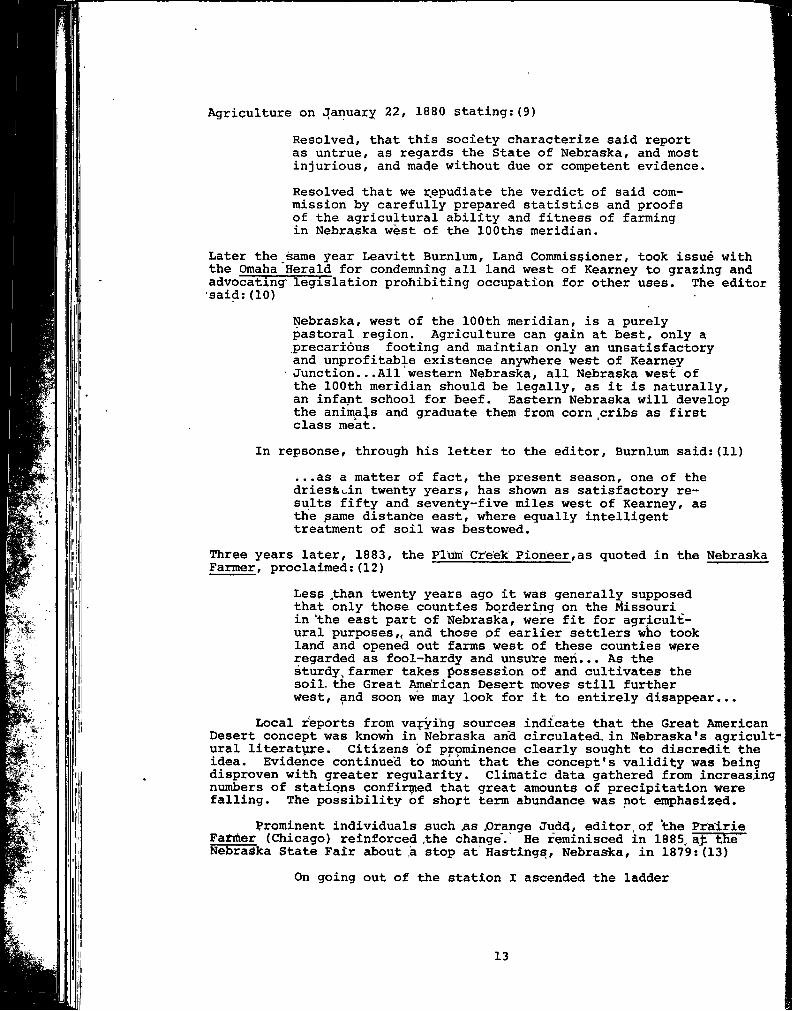
Resolved, that this society characterize said report as untrue, as regards the State of Nebraska, and most injurious, and made without due or competent evidence.Resolved that we r^epudiate the verdict of said commission by carefully prepared statistics and proofs of the agricultural ability and fitness of farming in Nebraska west of the lOOths meridian.
Later the same year Leavitt Burnlum, Land Commissioner, took issue with the Omaha Herald for condemning all land west of Kearney to grazing and advocating' legislation prohibiting occupation for other uses. The editor said:(10)
Agriculture on January 22, 1880 stating:(9)
Nebraska, west of the 100th meridian, is a purely pastoral region. Agriculture can gain at best, only a precarious footing and maintian only an unsatisfactory and unprofitable existence anywhere west of Kearney Junction...All western Nebraska, all Nebraska west of the 100th meridian should be legally, as it is naturally, an infant school for Beef. Eastern Nebraska will develop the anima}.s and graduate them from corn _cribs as first class meat.
In repsonse, through his letter to the editor, Burnliam said:(11)...as a matter of fact, the present season, one of the driestuin twenty years, has shown as satisfactory results fifty and seventy-five miles west of Kearney, as the ^ame distance east, where equally intelligent treatment of soil was bestowed.
Three years later, 1883, the Plum Creek Pioneer,as quoted in the Nebraska Farmer, proclaimed: (12)
Less .than twenty years ago it was generally supposed that only those counties bordering on the Missouri in the east part of Nebraska, were fit for agricultural purposes,, and those pf earlier settlers who took land and opened out farms west of these counties were regarded as fool-hardy and unsute men... As the sturdy, farmer takes possession of and cultivates the soil, the Great American Desert moves still further west, and soon we may look for it to entirely disappear...
Local reports from varying sources indicate that the Great American Desert concept was known in Nebraska and circulated, in Nebraska's agricult ural literature. Citizens of prpminence clearly sought to discredit the idea. Evidence continued to mount that the concept's validity was being disproven with greater regularity. Climatic data gathered from increasing numbers of stations confir fied that great amounts of precipitation were falling. The possibility of short term abundance was not emphasized.
Prominent individuals such ss .Orange Judd, editor.of the Prairie Fa^er (Chicago) reinforced ,the change’. He reminisced in 1885, aj: the Nebraska State Fair about a stop at Hastings, Nebraska, in 1879:(13)
On going out of the station I ascended the ladder

r is «against a new frame building going up, to take a look off upon the "Great American Desert!" ^y, as far as the eye could reach were golden fiel'ds, covered with thickly-standing, vigprous Wheat stocks.—
This was the past. In the same address Judd continued about the future:Today, in the cultivated counties of this^state, the cornfield is greater and more frequent than ~ it was when they were first settled. As-this goes on towards ybuir western boundaries the whole state will be in a new condition as to its -rainfall and fertility.
Perception of climatic conditions in Nebraska included in acceptance that precipitation was increasing— the real concern seemed to be the acceptance of a plausible explanation that was directed towards plowing and forestation. Largely ignpred as a concern was the spatial variance in precipitation and the' plausibility that increases were part of a cyclical condition. Unthinkable in. the early 1880's was the return of drought conditions— a part of rea],i^y that in fact returned in the early 1890's. Instead, how edsy it was to believe Aughey and Wilbur when they said: (14)
...climates of the west are welcoming moisture; that rainfall is increasing steadily. The increase must extend until the plains east of Denver ,Laramie,receive sufficient rainfall to produce farm products without irrigation......evidence of present dryrtess, where dryness exists is evidence only for the present, and shduld not^be used to cover these areas with the undeserved reproach or the curse of desert lands. __
For Nebraskans in the 1880's, the image of Nebraska as part of the Great American Desert had been adequately disproven, only to be largely replaced by an areal image that ihcluded increasing precipitation that accompanied the state's increasing settlement - an image that proved to be erroneous in the drought years of the 1890's.
REFERENCES CITED1. Martyn Bowden, "The Perception of the Western Interior of the United
States, 1800-1870: A Problem in Historical Geography ," Proceedingsof the Association of American Geographers, 1969, p. 21.
2. Robert Porter, The West: From the Census of 1880 (Chicago: Rand McNally and Company, 1882), p. 370.
3. Addison Sheldon, Nebraska: The Land and the Pteople (Chicago: TheLewis Publishing Company, 1931), p. 661.
4. Nebraska State Board of Agriculture, Annual Report - 1871 (Des Moines,Iowa: Mills and Co., Printers and Publishers, 1871), p. 5.
5. Rural Nebraska, March, 1879, p.l.6. Sheldon, p. 42.
14
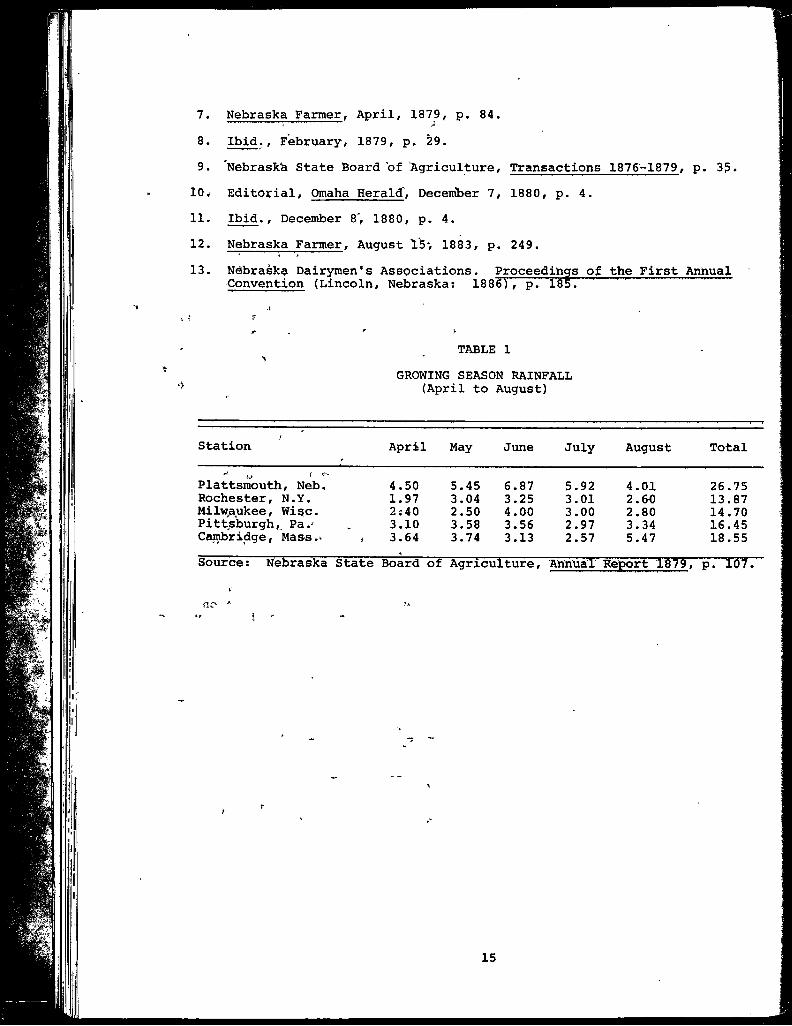
7. Nebraska Farmer, April, 1879, p. 84,8. Ibid., February, 1879, p. 29,9. Nebraska State Board of Agriculture, Transactions 1876-1879, p, 3?, 10^ Editorial, Omaha Heralci, December 7, 1880, p, 4,11, Ibid,, December 8', 1880, p, 4,12, Nebraska Farmer, August 15‘, 1883, p, 249,13, Nebraska Dairymen's Associations, Proceedihgs of the First Annual
Convention (Lincoln, Nebraska: 1886), p, 185,jr f
TABLE 1’IGROWING SEASON RAINFALL
(April to August)
Station / April May June July August Total
Plattsmouth, Neb. 4.50 5.45 6.87 5.92 4.01 26.75Rochester, N.Y. 1.97 3.04 3.25 3.01 2.&0 13.87Milwaukee, Wise. 2.-40 2.50 4.00 3.00 2.80 14.70Pittsburgh ,. Pa •“ 3.10 3.58 3.56 2.97 3.34 16.45Cambridge, Mass , 3.64 3.74 3.13 2,57 5.47 18.55Source: Nebraska State Board of Agriculture, Annual Report 1879, p, 107,
}
15

/
SPATIAL VARIATION OF COMMERCIAL BANK CAPITAL FLOWSi THE EXAMPLE ’OF ETHIOPIAJ. Hafol(i Ledmarf
ViZlanova University
John Friedmann^ has nqt^d Chat jf'tibfi'shed’studies,of interregional .tinvestment flows within less-developed countrjles (LDC/sl do not exist.(1) This is in sharp contrast to'.aS^er^ df-Studies ,examining; inJ:ranational ffiigration> interregional trade'flows, the' marketing systems,, and the general organizdtidn of spatial' econoitiic systems xithin.'hDC.’s'. Ttie lack of •published redeardh that ex^ines the spatial^^allocation of bapk capital
j Jin less dd-\ eloped countries 'limits our uhddtst^nding of'ah importafit process: capital accumulation and dispersion. ’The' purpose of this studyis to isolate several factors important in the ^patfal variation of com- ifteri'cal Bank capital flbws.
•" THF STUDY AREA4
€' The coTuiitry choshn for this stud^ is thte East African country ofEthiopi'a diirlng the'period from' 1964-l97’3, Although the|:e were, three »phivate’banks* operating Vithi'h the’Country'prior to,'J’ehr.viary i 1^‘7S, when-* all bariks- were na'ti'onalizMd,- one bf 'tlf sb, the Comm‘eripal''Ba'n , 0:f^Ethiopia handled-B5 per*'cent*bf the^ country’* b a n k i n g . 2) .,Jn,';ad'diti9n]'by 1973 the dommercial Bank of Ethiopia^ha'd 'eighty-^four branch of f ices„ so that as laTO institution it was spatia*lly distlTibuted throughout fhe. country. Friedmann notes that for chtintries' In the rudimentary stage bf industrialization, centripetal economic forces make it extremely difficult for investments to'-flow into the peripheral regions.(3) Therefore, it is hypothesized that the Commercial Bank of Ethiopia was able tp_acq:^ire capital' funds in the form of depoS‘ii;s from Vu'fai regions and then invested much of this capital in the major urban centets*. If this hypothesis is correct, the rural pefiphery financed most of the' corerarea urban development in Ethiopia.
A second hypothesis is that the distance from either the primary core city bf Addis Ababa, or the secondary and*often .competing core city of Asmara, to each of the branch offices of the Commercial Bank of Ethiopia will ,have a negative effect on the volume of loans. It-is bxpected that the distance of § b^-anch bank from the. nearest of these two--urban”core cities is important: for several reasons.. Ffrst,. because..of .primacy within the urban system and the economies-of scale and agglomeration, loans are likely to be made to firms either in of, very near these j-two cities.Second, information levels concerning investment opportunities tehd to be highest -in core., cities where an interactive environment* facilitates information. flows];.' Information flows ,from' the most highly developed urban areas exhibit some distance decay as they move downward through the urban system in highly developed economy such as Sweden's.(41 In a much more poorly developed’ system of communication and information transfer such as the one encountered, in Ethiopia, it is ^ntfpipated that information levels concerning investment opportunities ^ill gpijprally decrease 'quite rapidly with distances from these two core cities. As a result, the volume of loans reaching the. periphery ,will be, felatively ;Stiall.'„ »■^ I «-»l. . . a ^ ^ *• **
,,‘The. third hypothesis is based on the pattern of sectoral investments ^ide '-^e Commerdial Bank of Ethiopia. (5) The bank' s decision to extend credit ..primarily, to industrial and commesrcial borrowera has a spatial dimeiision. It is hypothesized that most of the loans will have been made
16
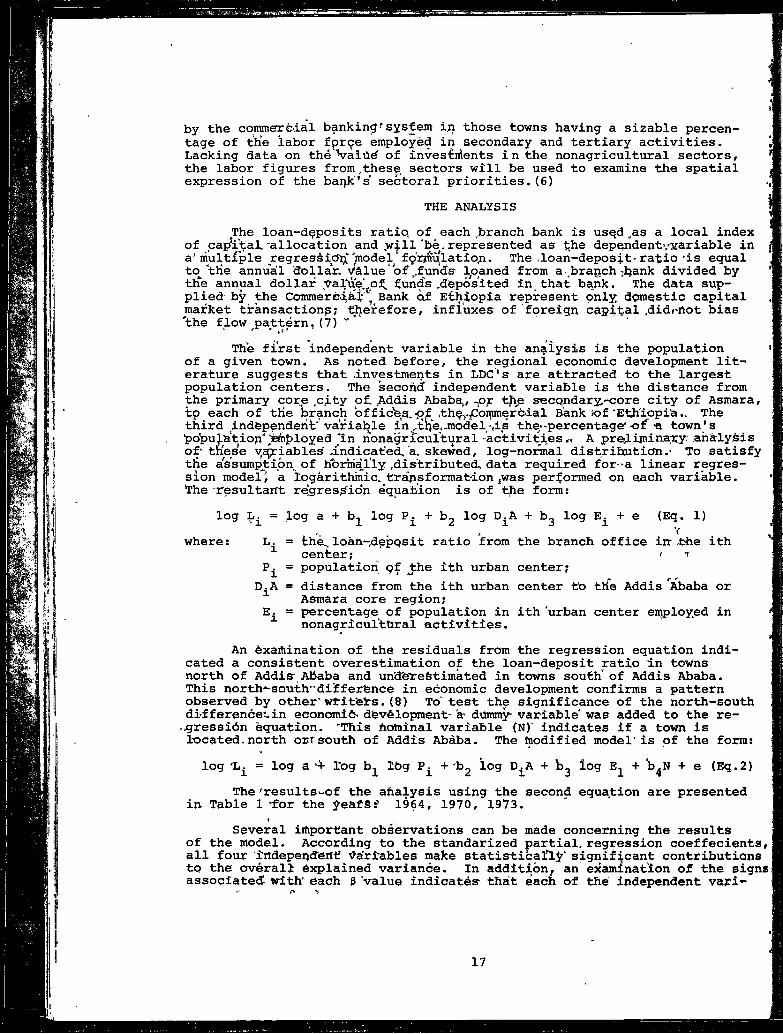
by the commerEdal banking»system i;i those towns having a sizable percentage of the labor fprge employed in secondary and tertiary activities. !Lacking data on the Valid of investments in the nonagricultural sectors, * the labor figures from.these, sectors will be used to examine the spatial expression of the barjk's’ sectoral priorities. (6)
THE ANALYSIS |The loan-deposits ratio, of each .branch bank is usqd .as a local index
of cap^ital'allocation and will "be. represented as t;he dependentvxariable in j a'multiple regressicf^'model ‘ fp'rjti latio;!. The ,loan-deposit-ratio *is equal to^'tHe annual dollar, value of ..funds loaned from a-.branch jfctank divided by ' tlie annual dollar Vadue’.o tunds .deposited in. that b^nk. The data supplied- by the Commercial'i^ Bank df Ethiopia represent only domestic capital market transactions; l^erefore, influxes of foreign capital .didrhot bias 'the flow pattern,(7) ” '
The first independent variable in the analysis is the population 'of a given town. As noted before, the regional economic development literature suggests that .investments in LDC's are attracted to the largest population centers. The second' independent variable is the distance from the primary core .city o£ T ddis Ababa,, -px the secondary-core city of Asmara, to each of the i)ranch offic’tejS.-jjjf ithOy;Pommercdal Bank «of‘Ethiopia.. The third indfepsnderif variable in ,theiJnodel-,is the-percentage'-oi-a town's po^uia'tiop';Mi{)loyed "in nonagricultural activities., A preliminary analysis of'tnes’e ya^iableS JLndicafed/a, skewed, log-normal distriEuiticJn.- To satisfy the assumption, of horirially distributed., data required for>a linear regression models a logarithmic, transformationjWas performed on each variable.The r'esultartt reqresSidn equation is of the form:
log L^ = log a + bj log log D^A b^ log E^ + e (Eq. 1)where: L. = the., loan-depqsit ratio from the branch office inr the ith
center; « iPj = population qf the ith urban center;
D^A = distance from the ith urban center to the Addis Ababa or Asmara core region;
Ej = percentage of population in ith 'urban center epaployed in nonagricul'ttiral activities.
An 6xaiSiination of the residuals from the regression equation indicated a consistent overestimation of the loan-deposit ratio In towns north of Addis* Ababa and underestimated in towns south’ of Addis Ababa.This north'^south"differfence in economic development confirms a pattern observed by othSr'wtitfets.(8) To* test the significance of the nprth-south difference*-in economic development- a dilmmy variable* was added to the re- .jgressibn equation. 'This ftolninal variable (N)' indicates if a town is located.north orrsouth of Addis Ababa. The modified model'is pf the form;
log 'L = log a log b log P^ + b2 log D^A + b^ log E + b^N + e (Eq.2)The fresults-of the ahalysis using the second equation are presented
in Table 1 -for the yeafS:' 1964, 1970, 1973.Several important observations can be made concerning the results
of the model. According to the standarized partial, regression coeffecients, all four Imdependertt variables make statistically' significant contributions to the overall explained variance. In addition, an examination of the signs associated with' each 6 'value indicates that each of the independent vafi-

ables is related, to the dependent; variable in the hypothesized direction, i / TABLE 1-
RESULTS OF THE REGRESSION MODEL
T-;--rVariables(1964) Standard Partial
Regression Coefficient (B)
-4Standard Efroi of Regression Coefficient
( 1Multiple Coefficient of Determination (R2)
.5^61*. .0543 .6323°A -.4278 .0479 .668.6-E .3216 *0771 .7210N .2948 .0664 .7946
Variables(1970)
P .5237' .0473' ’".6041°A -.6189, .0418 5 .6923.E .3780 .0627 .8050N * -.3960 .0762 ,8486
Variables (1973).. T> .3513 ‘ .0434 '.5791^ - -.5984 .0561, 1651,4■e' * -43M 00o “ .8386N .4829 .0719 .8890
■*'A11 values significant dt the .01 level.' ' ■" --------- -- --'SOURCE: Computediby .author. ' _
The values for the multiple coefficient of determination (R2) illustrate that population of a town was the single most important variable in ex-the^magnitude of the loan^deposit ratio. However, the importance of population to the model decreased throughout the period under study as
the Commericial Bank of Ethiopia opened more branch offices in smaller towns. Also, the, amount of overall explanation that the level of nonagri- cultural employment contributes to the model increases through time.(?)
CONCLUSIONSThe,multiple regression model supports .the three hypotheses concerning
the variables important in determining the size of the loan-deposit ratio' of a given branch bank. Population and distance of a branch bank from either Addis Ababa or Asmara are important in accounting for variance
18
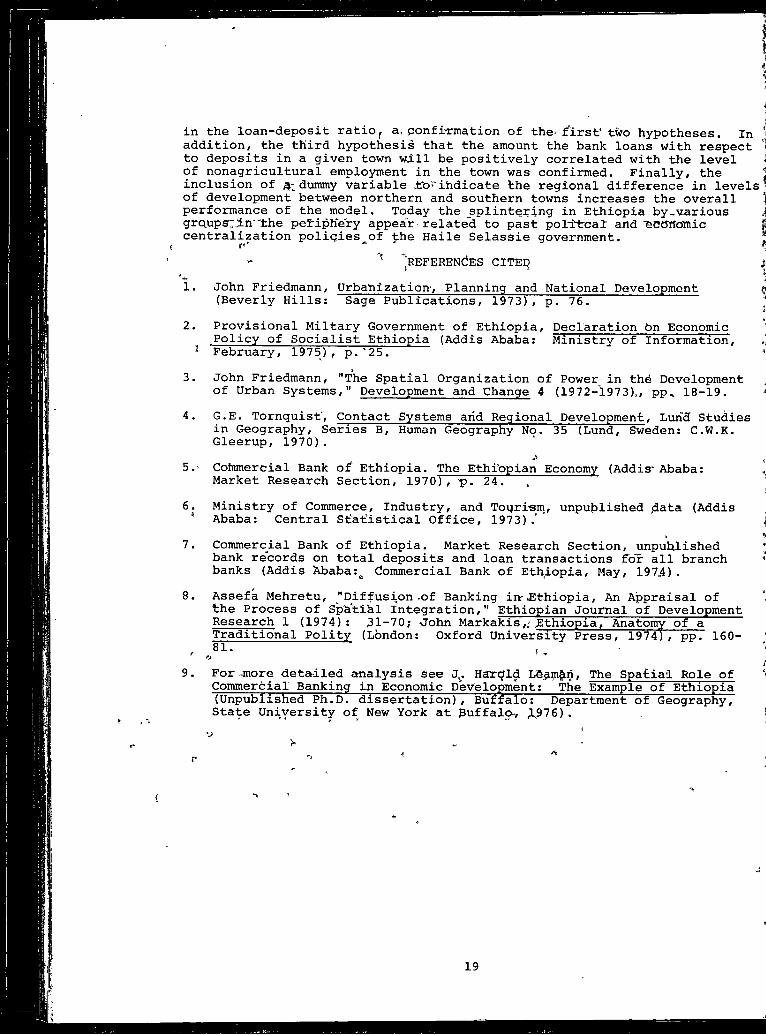
in the loan-deposit ratio, a, ponfi-rmation of the-first' two hypotheses. In ’• addition, the third hypothesis that the amount the bank loans with respect 1 to deposits in a given town wall be positively correlated with the level iof nonagricultural employment in the town was confirmed. Finally, the 1inclusion of 4-dummy variable tb^'ihdicate the regional difference in levels* of development between northern and southern towns increases the overall ^performance of the model. Today the splintering in Ethiopia by-various jgrQupsrrin'the periphery appear relate'd to past pol-±tcal and TecCWcMic |centralization policies of the Haile Selassie government. *yr* ■*" f
' 'referenc’es citeq j1. John Friedmann, Urbanization', Planning and National Development ^
(Beverly Hills: Sage Publications, 1973), p. 76. '
2. Provisional Miltary Government of Ethiopia, Declaration bn EconomicPolicy of Socialist Ethiopia (Addis Ababa: Ministry of Information,
1 February, 1975), p.’25. >3. John Friedmann, "The Spatial Organization of Power in thd Development
of Urban Systems," Development and Change 4 (1972-1973),, pp,. 18-19. <4. G.E. Tornquisf, Contact Systems arid Regional Development, Lurid Studies
in Geography, Series B, Human Geography No. 35 (Lund, Sweden: C.W.K. Gleerup, 1970).5. ’ Coinmercial Bank of Ethiopia. The Ethiopian Economy (Addis* Ababa:
Market Research Section, 1970), p. 24. , ‘6. Ministry of Commerce, Industry, and Toqri«m_, unpublished data (Addis* Ababa: Central Statistical Office, 1973). )
7. Commercial Bank of Ethiopia. Market Research Section, unpublished *bank records on total deposits and loan transactions for all branch ' banks (Addis AbabaCommercial Bank of Ethiopia, May, 197.4) .
8. Assefa Mehretu, "Dif fusion .of Banking in-.Ethiopia, An Appraisal ofthe Process of Sph'tial Integration," Ethiopian Journal of Development Research 1 (1974): 31-70; -John Markakis,; Ethiopia, Anatomy of aTraditional Polity (London: Oxford University Press, 1974), pp. 160-
9. For anore deta-iled analysis see J._. Harold Leamari, The Spatial Role of Commercial Banking in Economic Development: The Example of Ethiopia(Unpublished Ph.D. dissertation), Buffalo: Department of Geography,State University of New York at Buffalo-, JL 76) .
%
19

MIGRANT WORKERS IN WESTERN EUROPE: CHANGED PERSPECTIVESHomer I>rice anej Thomas Pohl
City University of Uew Hunter College
The migrant worker, *or Gastarbeiter (guest worker), boom in Northwestern Europe in the late 1950's, accelerated in the 1960's, and peaked in the early 1970's. This paper analyzes the current status of the migrant worker phenomenon, some of its principal effects on the. host countries, and the changing attitudes and policies of these countries regarding foreign workers.
The importance of foreign workers in the industrialized European Community (EC) is often not appreciated. First, in the labor-short years of rapid economic expansion they provided a” vital, cheap, flexible supplement to the work force. Second, they take Ipw-pay and often unpleasant jobs which' host ocuntry nationals have'become* increasingly loathe to accept. Finally, their large numbers and relative permanence insure that they are a minority which cannot be overlooked. West Germany and France today each have about two million foreign workers who constitute 8% and 9% respectively of their total work force. The EC as a whole Has in 1977 some 6,000,000 immigrant workers plus an estimated 600,000 illegal migrant workers.
Changing economic conditions since the early 1970's and their attendant social concerns focus attention on three recent trends. Foremost among these has been the stemming of new immigration and, indeed, a considerable repatriation of resident foreign workers from northwestern Europe. Though there is free migration of labor within the nine-member EC now, immigration from third countries has been essentially halted.France and West Germany, for ins-^^nce, haver had their borders closed to third-country immigrants since 1973. West Germany's peak migrant worker population of 2,600,000 in the latter year has dwindled by nearly 25% to about- 2,000,000 in 1977. The International Labor Organization (1) estimates, that 2,000,000 migrant workers in, northwestern Europe have lost their old jobs since late 19*73 and that most of them have gone home. This repatriation poses a major problem foil Yugoslavia, Turkey, Spain, Portugal and Italy, all with serious unemplo,yment’themselves.
In more recent years a second trend i§ discernible in the slower turnover within the migrant worker population. Fewer workers*have come for one- or two-year stints. A related aspect is the larger number of family members, i.e. non-workers, residing in .the host countries. tThus the mi- ■grant worker population has become more permanent and characterized by 'a larger “number of dependents. In West Germany in 1974 nearly two-thirds 'of^the foreign workers had spouses with them. In the EC in 1973 the total migrant population of roughly 10,000,000. included more than 2,000*.,000 cHildreri.*
A inal trend, evidenced over a somewhat longer period, concerns the changing arid, increasingly* varied ethnic make-up of migrant workers in northwestern’Europe. As Jihe tide of la.bor migration, especially that directed toward" the EC, rose,, the areas of origin shifted and widened. As late aS'l^S^; three-fourths of all migrant workers in the EC of six came from member states of the Community, largely from Italy. By 1973, the proportions had been reversed. Three-fourths of the alien workers in the
-newly expanded Community of nine came from non-member states. The number of intra-Communlty,^.migrants had not decreased, however. The proportionate
20
^thnic shift simply reflected the rapid increase in’ the total alien work force and implied insufficient a,vail'ability of migrant workers from within the EC.
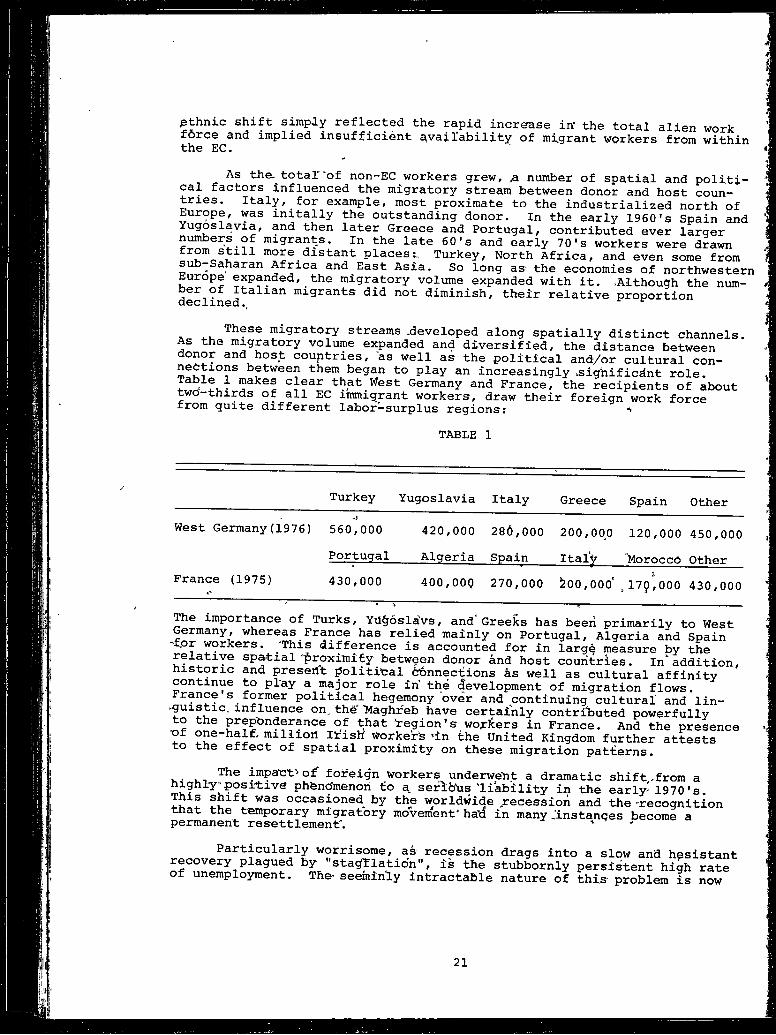
As the. total''of non-EC workers grew, ^ number of spatial and political factors influenced the migratory stream between donor and host countries. Italy, for example, most proximate to the industrialized north of Europe, was initally the outstanding donor. In the early 1960's Spain and Yugoslavia, and then later Greece and Portugal, contributed ever larger numbers of migrants. In the late 60’s and early 70's workers were drawn from still more distant places:,, Turkey, North Africa, and even some from su -Saharan Africa and East Asia. So long as the economies of northwestern Europe expanded, the migratory volume expanded with it. -Although the num- ber of Italian migrants did not diminish, their relative proportion declined. ^R 4-u migratory streams .developed along spatially distinct channels.As the migratory voliame expanded and diversified, the distance between donor and host countries, as well as the political and/or cultural con- nections between them began to play an increasingly >sighificdnt role, r makes clear that West Germany and France, the recipients of abouttwo-thirds of all EC immigrant workers, draw their foreign work force from quite different labor-surplus regions: --
TABLE 1
Turkey Yugoslavia Italy Greece Spain Other. -i
West Germany(1976) 560,000 420,000 286,000 200,000 120,000 450,000Portugal Algeria Spain ItalV "Morocco Other
France (1975) 430,000**■ 400,000 270,000 ^00,000* , 179U00 430,000
The importance of Turks, Ydgosla'vs, and Greeks has been primarily to West Germany, whereas France has relied mainly on Portugal, Algeria and Spain '■for workers. 'This difference is accounted for in large measure by the relative spatial ”f)roxitoity between donor and host countries. In"addition, historic and present ^olitibal 6i6nnections as well as cultural affinity continue to play a major role in' the development of migration flows, franee s former political hegemony over and continuing cultural' and lin- .^uistic. influence on.the "Maghreb have certainly contributed powerfully to the prep'onderance of that ’region's wo;rJcers in France. And the presence mf one-half, million ItisK Workerb ’in the United Kingdom further attests to the effect of spatial proximity on these migration patterns.
The impatrt^oi foifeign Workers underwent a dramatic shift .from a highly'positive phfendmenori to a, seribiis'liability in the early- 1970's.
f occasioned by the worldwide .recession and the -recognitionthat the temporary migratory movement’ ha1d in many .instanges become a permanent resettlement". 'Particularly worrisome, as recession drags into a slow and hesistant
recovery plagued by 'stagflation", is the stubbornly persi^ent high rate of unemployment. The> seeminly intractable nature of this problem is now
21

admitted, as i.a eyi,dehced hy the increasing tendency to describe unemployment in-the rich- countries as "Structural”f‘ t.ev pfenoartent, or at least long range, rather then "cyclical" or temj^orary.
The unemplbyment rate *th European- countries which dre members of the Organization for Econofnic Co-operation and Development (OECb) i's'expected to climb, in fact, from 4.25%',in 19-7h to 4.75% in'1977. The-'burdeff falls especially hhrd on the young,'poor an'd minority groups, which-already have higher" crinte‘ rates and pblitically* tiroioblesome histories. Onq-third of the 5,500,000 unemployed in the-EC in January, 1977 were under 25, a rate ‘twice as high as for the work force as a whole. Data from the United Kingdom indicates that the rise in unemployment, between*1973 and 1.975 was more than two times as steep for the foreign workers as for the total labor force. It is no wonder then that government policies are geared today toward repatriation of migrant workers.
A-Sebond^'problem, related'to the high unemplo;^ent'rates, is "the increasing size and permanence of minority groups, in recent years’* latent racial and class prejudices have surfaced and complicated sQcietal harmony and stability, in Switzerland three referendd-in as many years ha e tackled the issue of limitiftg the resident foreign population. The extensive problems associated with the repatriation, integration or assimilation of foreign workers and their families have only lately been given the attention they deserve.
The large and highly concentrated foreign populations have had an especially harsh impact on already crowded large urban areas. The concentration of these minorities in bfdon-villes and ghettoes has led to many very serious gocial and physical conflicts. The permanent migrant and his family place a greater demand on the host societies' social capital "than did the single, temporary migrant of a decade earlier. The need for more and better housing, health, educational and social welfare services is now thought to entail costs greater than the benefits supplied by foreign manpower.
Moreover, the concentration of population and industrial activity has led to an even greater regional imbalance in the host countries._ To satisfy the needs of an ever larger population in already developed regions these countries have had to siphon development funds away from their underdeveloped areas. Meanwhile, the peripheral zones of donor countries have suffered the loss of their mo?,t dynamic population. As a result, the poorer regions of both host and donor countries have indirectly subsidized the richer, already developed regions.
A number of EC policies are attempting to deal positively with the above-mentioned problems. Foremost is the nearly total ban on furthOr immigration, mentioned earlier. Secondly, also previously cited, repatriation has been encouraggd, and the reverse flow has already been sizable. France i-s currently offering a $2,000 bonus to workers who agree to returiv to their home countries permanently. Also in the past.few months a .s'$riOtis effort has been initiated to curb illegal immigration. Furthermore, a policy aimed at attacking the root cuases of emigration is being generally followed through various EC economic and trade agreements and concession^, aid programs and the like, mostly with Mediterranean countries which have been the chief donors of labor.
In all fairness, it must be stated that EC governments have instituted many-faceted programs aimed at helping semi-peinnanent and permanent, foreign workers improve their economic and social conditions and even, more recently, political rights. These are generally in a framework directed-
22

toward greater assimilation within the host country’s spciety, and in many cases they .have attaj^ed a: substantial measure of success. (2) ^
In conclusion, we should like to emphasize two points regarding the industrialized northwestern European countries: 1) the importanceand conplexity of the, migrant.worker problems and 2) the difficulty, but urgency of addressing their repercussions effectively with practical, high priority programs. Obviously, this is a subject which merits further investigation. Moreover, the related issues, largely ignored here, of the effects of emigration and .repatriation on the donor countries and on the
migrants themselves— especially the hon-monetary ones— need elaboration. These interesting.aspects of the-European migrant worker phenomenon wil l £>e examiped^iu a follow-up study by the authors.
.. lEFgl NCES CIT5P1.. U.S. millions News' and World Eeport, "Vfhen Europe tailorrmakes programs for out of work;," .Fe^ruagy 21, 1977, p . 61.2* * * Bulletin .of ,the Europeah Cotmnunitdes. supplement 3/76-, "Action
Programme in Favour of .Migran^ Workers and Their Families."
V
4
rr \
i
f* (
t
V
23
FOREIGN OWNED MANUFACTURING ESTABLISHMENTS IN NEW YORK STATE( David A. Smith.
State University of New Xork at Buffalo
*• In'recent yedrs, there has been considerable publicity about theflight of business from the northeastern United States, particularly New York State. There has been much less publicity about another flow that is 'occurring, namely the movement of foreign capital into the United States and the commencing of United States' operations by non-American owned enterprises. Although there are no'precise records kept of the "ownership of American establishments by foreign individuals or corpbra-
I tions, the United States Department of Commerce and the Conference 1. t. Board, an independent research organization, attempt to- keep track of
the investments and ownership by foreigners in American business and probably achieve a high, if not perfect, level of accuracy. The'data for this paper ccftne from a rece'nt publication of the Department of Commerce (!)■ and a survey of foreign ownership published by Arpen and Ricks ‘in *1975 (2), plus information culled from articles (3), newspapers^ and other sources.
Studies of the location of manufacturing activity can generally be placed into one of two categories; the macro, or theoretical, approach, represented by the works of -Weber, Losck, Isard, and others; and the micro, or empirical-,- approach taken by Hunker(4), Krumme(5), and others. Looking at the .United States as a whole, the macro, or theoretical, approach will probebly" exjjlain the location of foreign manufacturers in tlie country. The ‘traditionally industrial northeastern area is the site of a large percentage of foreign owned operations, with New Jersey, New York, and Pennsylvania leading the nation in that order. In fact, the foreign entrepr^eneurS do not seem to be as discouraged with, the northeastern United States as are American managers since, as late as ^976,New, York State was the chosen location for" more new direct investments than any other state. This may change in the' future as the number of investments -in the South and* West ‘seems to be increasing very rapidly.The southerh states,- in -particular, are making every effort to, create a favorable inves-tment bliinate for fore'ign manufacturers.
On an intra-state level, however, the micro', or empirical method of study seems better able to explain the distribution pf foreign owned manufacturing. One can at least hypothesize that foreign manufacturers have different location criteria for their establishm^n-ts, simply because they are foreign. Not* being an in-tegral part of the American business community, their gohls, and certainly their sources of information, may •be-quite different from the United States-businessman. Thus, although one study(6) has determined that the'order of major factors affecting the,'locatioTi decision of foreign manufacturers is: first, proximity tomarkets,; second, transpoftation facilities; third, labor factors; and' fourth-;- tax consideration, other studies(7) have found' th^t inexpensive labor and state or local incentive packages rank the highest. Although these are not necessarily contradictory findings, they at least indicate the problem, of trying to analyze the decision-makihg activities of persons Who mdy not be thinking along the same lines ■ hat their American counterparts do.
-The -foreign.manufacturer is, by definition, an outsider. Although he may be sought 'after and wooed by governments as a potential provider
of employment and tax revenues, he also faces not only the normal comoet- itive forces that all American businessmen face, but some additional handicaps as well. The guestipn of ^cale of operation, for instance, may
differently by a foreign manufacturer than by a domestic one. How large can a foreign manufacturing operation become before it begins to attract unfavorable attention from the somewhat nationalistic^rtainlv^affect^?h’ " is question, the answer to which is unknown, willconsideration of economies of scale and agglomerationcosts throuS ' increased size m^y lead to lower productioncosts, through economies of scale, but, on-the other hand, large size could result in accusations of "draining profits from the country".
foreign manufacturer want to-enter ■ fully into the rough American business community, or would he rather
corner a little, "doing -his own thing", but not actively participating in the business life of the country? It is interesting to note that the great majority of foreign organizations adopt a different a matter^n?^?^ their United States operations. Perhaps this is just language; it may be easier for Americans to say "Auburn Steel Company than Kyoei Steel" or "Peter Cooper Corporation" L a n "Rousselot,"Americanized- "’ tter of attracting less attention with anAmericanized name. This same attitude can possibly apply ,to location—
fringes of business activity, may be preferred over a central, but more visible, site. * ^.n -p the part of foreign manufacturers to stay infSr estaSishiJm®"co? ^ nationality? Aiqericans are notoriouswSLrthei outposts of Ameriqa, in the countries, inwiiich they may be living. Do foreign businessmen, even if they do not
proportion of their enterprises' employment, have the
rm « ?ther, personal factors may well play a more importantopeLtioi thfn°the°L^^ '"I?®''® '2 locate a foreign owned manufLturingmacro factors of markets, transportatibn, labor, etcaccount- fof found tothromieJ" factory locations, "residence of' f°®® uot apply to foreign entrepreneurs. But there may wellunioue American businessman, but which areBakina ^°f^® foreign operator, that enter into his location decision
remainder of this paper «ie distribution ,of foreign ownedtSse g S t i L s ! explore
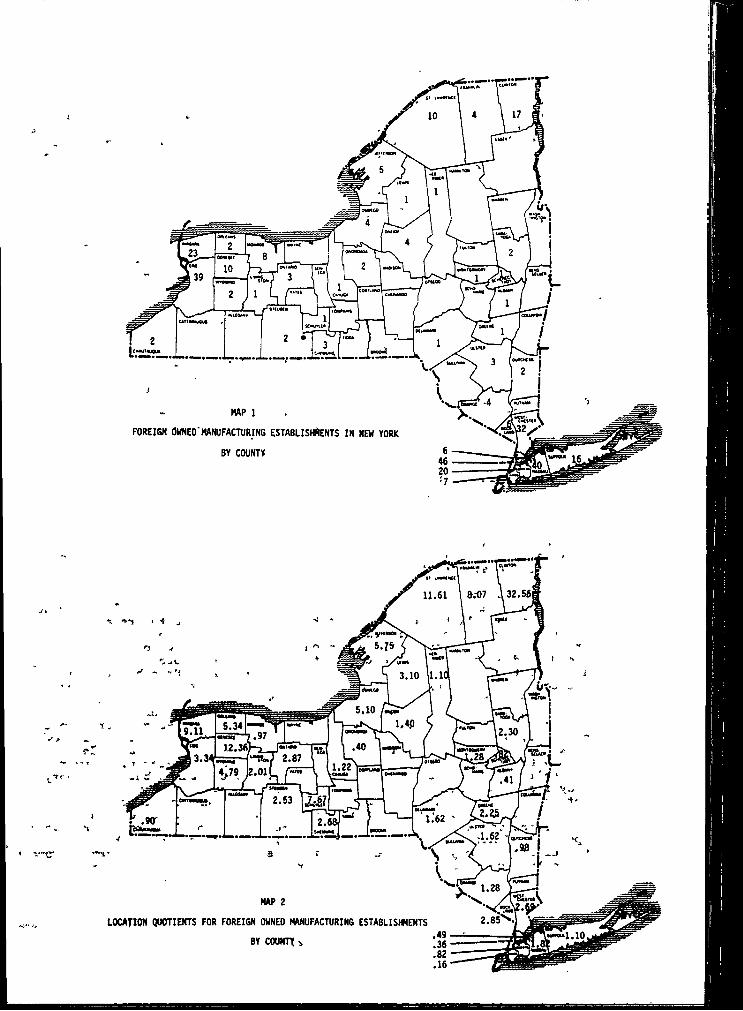
Maj5 1 shows the distribution, by county, of the- 334 foreicrn nwne>a manufacturing establishments in New York state that have-been found onfirst■-gSnce, I? SJ n'rE* ?Sometropolitan area-has a, large number of
Nassau counties leading-the list. Niagara Frontier, with Erie County in third rank in the state IS not unexpected in its importance. Butt on further examinationClintoi^^a^5%^®^v?'"™*®^ foreign ownqd establishments in Niagara, 'counties, and a relatively low number in suL industrialized counties as Monroe and Onondaga. If-we convert theselo?mulfas'’f Q u o t i i n t s , by t h f ^ o n ^ ^ S r tormula as found in Alexander(8); ^NunOaer of foreign owned mahufacturing establishments’ in a county
Total manufacturing establishments in a county'-------Total foreign owned manufacturing establishments in New York
Total manufacturing establishments in New York State
25
|iw«w _ '.-fw [_
MAP 1 .FOREIGN OWNEO'MANUFACTURING ESTABLISHMENTS IN NEW YORK
BY COUNTY
LOCATION QUOTIENTS FOR FOREIGN OWNED MANUFACTURING ESTABLISHMENTS BY COUNTT i
and map the resulting values, we come up with Map 2. In this map,Clinton, Genesee, St. Lawrence, Niagara, Franklin, and Schuyler counties are the'" leaders, in that o'rder. Although Nassau, Suffolk, and Westchester countifes all have values ab^ve one, indicating that they have a higher concentration of foreign owned establishments than the state as a whole, their values are well below the previously listed counties. The inner part o^ metropolitan New York City, Kings, Queens, Bronx, an(i New York counties, all have values well below one.
From a perusal of Map 2, one could assume that foreign manufacturers, much more than their American associates, prefer more remote, out of the way locations. In addition to the six high ranking counties already mentioned, Orleans, Wyoming, Oswego, Jefferson, and .Lewis all haVe values indicating a high concentration of foreign- ;nanufacturing within their boundaries. None of these counties would normally be thought of as being in the industrial heart Of New York State.
Since Maps 1 and 2 deal with all foreign owned manufacturing establishments' in New York State, and we earlier asked the question whether or not there is variation among the locations preferred by different national groups, let us turn to Map'3. We do not have maps Showing the locations for every national group. Maps of British and Dutch locations would, however, show a fairly wide and even distribution across the state. In the case of West German locations, however, there is a decided concentration. Of the thirty-six West German owned nianu- facturing esjtablishments in New York State, thirty-two are located in the greater New York City area. Only Monroe, Oswego, and Ulster cdunties are outliers from the concentration of German ownership in and around New York City. Nassau is the leading county, with twelve, or one third, of the German manufacturing plants. Map 3 raises more questions than it answers. What are the factors behind this great concentration of German manufacturing establishments in the southeastern part of the state, whereas British and Dutch ownership is much more widely distributed?Is this a case of "psychological agglomeration"? Blackboum quotes this as "de Smidt's term for the tendency for foreign companies to form national JLndustrial 'ghettos' once the links with companies in the home-
seen by an examination of Map 4, the distribution of Canadian owned manufacturing establishments in ,New York. Canadian manufacturers are, of course\ somewhat unique in the category of "foreign” owners, since they are the only ones that share a common bounifery with New York State and the united States. 'Thus, although they are legally foreign, perhaps they are a llttle^^Jess fq^-eigp than the Germans, British, French, etc. That the Canadians not only share a boundary with New York State, but that they like to stay close^ to,, that boundary when_locating mattuf actmrimg plants in the States is obvious from Map Er;ie>«!cltoton, and Niagara counties, all boundary cbunties,- contain fifty-eight, or almost one-half, of the 123 Canadian owned manufacturing establishments in New York State. . Tf-pne adds tP this Tist/Si. Xawrehce County, a border county but fifth rankiSSC, one raises 'th,ier*tbtal'“to sixty-seven, or over one-half. Xnd‘if one adds Gentesee County,' fourth rainkpd but one couhty away from ’the boundary and the seventh-ranked-boundary dOunty of Jefferson, one has a total of eighty-^twb, or exactly two thirds, of all Canadian manufacturing establishments in the state. This certainly does not correspond to the distribution of American tirms in Europe. Blackboum speaking” of American firms in" Europe "“.r.fhefe' is an obviouspreference for major manufacturing regions, a tendency which seems stronger
land ar,fe transferred to foreign ."(9)fA-major, component in the distribution shown in Maps 1 and 2 can be
among American-owned than among either locally-owned or other foreign
i 27

firms."(10) Although there are many similarities between this distribution and that found by Ray(11) for American factories in Canada, there are also obvious dissimilarities. American firms locating near Toronto or in southeastern Ontario were locating* in an area of high market potential. St/ Lawrence, Frahklin^^ and Clinton counties are hardly the market potential pfeaks of New York State. On the^ther hand, Ray's concept of "economic Shadow" -may well apply here. Further analysis of the distribution of Canadian owned firms", by ownership location and industry type*will be required before that is known. Similarly, the effect of corporate organization and .fnter-plant "linkages will have to be examined, as Brittonil2) studieil American plants in Canada-.' 5
Questi"bns tumble, out of Map 4 What are the markets served by these establishments? Is there a sense of "security" in locating close to the border?- If Canadian markets ar.e being served?' w’hat edvantages— labor, raw materials, "taxes, etc.— are great enough to overcome tariff disadvantages? If United States markets are .being served, are these the optimum locations to serve the United .States, or are they "secure” locations?
This pap^r h^s tried to inject another element into the study of manufacturing location in the United States— the element of being foreign owned. Although' foreign owned establishments may not loom very large in the total' United States manufacturing picture, for some areas, such as the 'southefn 'states tliat are actively' seeking such investments, or for -the borderr^pommunities of Upper New York State, the presence of foreign owned pla'i\,ts may m^ke a considerable .difference to the economic health of the community. Wiat are the factors that influence the location of foreign owned manufacturing establishments in the United States?
REFERENCES CITED1. U.S. Department of Commerce. . Foreign Direct Investment in £he United
States. Vol. 3,. Appendix A . 1976.•
2. Jeffrey S. Arpan and David'A. Ricks, Directory of Foreign Manufacturers in the United States (Atlanta:^ Publishing Services Division, Schoolof Business, Administration, Georgia State University, 1975)
3. Paul Stephen Dempsey, "Leg^l and Economic Incentives for ForeignDirect Investment in the. Southeastern United States," Vanderbilt Journal of (Transnational L&w 9 (Spying, 1976) ; 247-293; Tom Foster,"The Friendly'Ihvasion," Distribution Worldwide 75 (December, 1976): 27-30.' "
4. Henry L'. Bunker, and Alfred J. Wright, Factots of Industrial Location ■ in Ohio (Columbus: Bureau of Business Research, the Ohio StateUniversity, 1963) „
} "5. Gunter Krumme, .".Toward .a Geography of Enterprise," Economic- Geography45 (January,. 1969): 30-40.
6. Arpan and Ricks, p*. xv.7. Foster, p. *27.
J8. John W. Alexander, Economic Geography (Englewood Cliffs: Prentice-Hall, Inc., 1963): 594-595.
i ^9. Anthony Blackbourn,^ "^he Spatial Behaviour of American Firms in
29
Western Europe," in F.E.I. Hamilton (ed.), Spatial Perspectives on Industrial 0rqani2ation and Decision-making (London; John Wilev s Sons, 19741:245-264,
10. Ibid., p. 258.11. D. Michael Ray, "The Location of United States Manufacturing
Subsidiaries in Canada," Economic Geography 47 (July, 1971): 389-400.12. John N. H. Britton, "The Influence of Corporate Organization and
Ovmership on the Linkages of Industrial Plants: A Canadian Enauiry,"Economic Geography 52 (October, 1976): 311-324.

THE NEW^YDRK CTTY flSeAL CRISIS': WILL II OCCUR ELSEWHEI^E?■ » .3 ' ‘ •
Matgaref'F’i Boorstein Long Island University, C.V. College
-1 When l ew York City, the largest-city in-the country, _ face'd a seriousfiscal crisis in 1975,- one question of prime'concern was whether other citifes would" follo«r Suit. It was feared that this' situation "was only
a forerunner of a sefies-of fiscal disasters which might take place in cities throughout the countfy.
•j B J -~ „ -New York-City-was unable to borfow->money at any interest rate. TheGahks had decided that they did not like "the City' s. jfi-scal practices an^ refuged to.extend'credit. \Since the-City depended on-a constant rollover of debt to support its expenditures,_ it was fpr all purposes
. ungblg either!to-pay for-servides'provded or to r^pay itsji^btors. In t jtesponse to this crisis> thd Maiflfcipal Assistance -Co^pration was_ established..) This; agencywas to'be'independent of the City and_ wqiAd’ float its own.'bonds; however, it met" with difficulty almost immediately. The City was then forced to -relinquish its fiscal* powers H:d the' State government in the form of the Emergency Financial Control ^qard. Still facing 5the ,possibiiity';of bankruptcy, " NeW York City convinced the federal govern- cmentrto give it ?a'Jseas’onal lind'"o'f't:redit’<5f $2i2 billion for the next three years. The-^City agreed to'repay thd loan with iuterest each year and to have a balanced budget for the fiscal year 1978.AT 3r'i. 'll c' 3’ - . '•* '* '
since 1^75, New'York City, along with other cities in the nation,. IhaSihad additional fiscal difficulties buf has -escaped defalilt. As a j consequence,’ though, jmunicipal bonds irt''general- have been considered
" riskier J.nvestments-thaji previously; the-avairability of funds to cities .aihaSjideclined while the interest rate’that Pities must^-pay has^*^incxeased.j -3 - This turn ■of .events leadd to several ih^erestirig quest'ibris: 1) whyNdw York) City wai hit with the'-Prisis-iri the "first placed; 2--)''How'these
c prPblems.'manifested themselvels inithe City's finaricfes"; -3-V-whether similar fiscal conditions eptistdd in other-cities; 4 whether thfese'conditions were .^spatially or functiofialiy oorrelcLted— i-’Je., -are' cities- in--fiscal trouble located in one part of the country or are' their economies basPd on similar activities; and 5) why New York City was faced with near default while other cities with similar fiscal characteristiPS have* not faced that problem.'.a V .This paper will try to.* answer these' questions By examining the 1975'_finances of the 25 largest .cities in the Jnited" States; thfe source
.. of xthta is City Government Finances- in 197'4-5 from the United States Bureau of the Census.(1) The specific components to- be examined are total revenues, including local tax collections and intergovernmental revenues; total expenditures 'including capital outlay and public welfare expenditures and total outstanding gross debt, including total borrowing for the year. The types and amounts xif) revenues and expendi-tures abe-lmportant in under- .atAnding the cities' fiscal health. For example, high capital expenditures jaii4 heasc depen<^ence on. tax collections (measured- as a' percentage of all general revenues) -are probably indicative 'of a growing- city with faith in its future and the -income nePessary "to -supply its citizens with services Anottier sign'of ja city‘s Jiealth is the orelative growth Pt decline-of its ,1;ax B.ase, as reflected in its population.
The employment, structure will be used to compare
31
the economies of

the cities. -Figures for each city.' whole’Staptiprd Metropolitan Statis- j tical Area will be examined since a city's econoiiiy is very:much intertwined] with that of its surrounding area,,.C21* '
WHY NEW YORK CITY WAS HIT WITH THE FISCAL CRISISThe New York City fiscal crisis or "its inability to borrow money at
any price through the issuance of pon4s or notes in the tax exempt bond 'marKet"(3) occurred .Because thp Cify had not tried to ."keep expenditure growth in line with tax receipts.!' Various fiscal "gimmicks" were used which kept New York.Cjfy solvent in the short run but resulted in great difficulties in the long run. For oxample.» the capital budget, funded by long term borrowing, was used to finance current operating expenditures and| jShort term borrowing financed deficits, "in anticipation of revenues that did jiot e3p-^t."(4) Thejm§rket had lost-confidence in the City.!s ability to repay rtf debts because^the flity's revenues were not growing accordingly]
■The fiscal .problems were ,a function of several-?underlyirtg factors including tjie loss of any taxpayers to suburban areas- for a- variety of reasons. These involved the desire to, escape the racial and educational problems,of *],iving in the city as,well as reaping the esthetic, psychological,, and financial, Bene.fits of owning a-,house and land.
In addition, Ney? York City granted its, unionized employees-extremely generous ^ages,^ pensions, and-other fringe^benefits. »The City-also .greatly increa,sed tijernumber-pf its public employees.
MANIFESTATIONS OF NEW YORK CITY'S FISCAL PROBLEMS IN THE DATA. t eThe fiscal problems of -New York .City were reflected in its-.levels
an,d, types of rev^nues,, -expenditures» end debt. New York-City:was collect- i ig very large amojjnts o/^tot^l--and per papitatrevenues'and'itaxes (Tables I-and II) , .Yet ta?ee-termed a-rather small percentage of all general revenues (3'4) indicating that its tax base was not sufficient to support i,ts .ejcpenditures.s York, City., therefore, depended on o'ther revenueso,urce,s, primarily, jinter-governmental -revenues, for ovef o’ne^half of its general revenues-.. Moreover, it had an outstanding gfoss debt df .$15 billion
s ($.1,934 per q,apit ,)., of v hidh $2 billion ($285 per-capita) was borrowed in fiscal-year 1974-5. The-total Iborrowing for 1974-5 represented 15 percent of its-.total revenues (Table III);
. In comparison.jWith the 24 next largest cities in the country. New York City ranked highest in terms of both total and per capita revenues collected, total borrowing and gross debt outstanding (Tables I and III).Yet it ranked eighth,-when- total-borrowing was compared with total revenue.] Hqnce, thepp. were pities that .were borrowing larger proportionate amounts in rela.tioji to their totafl revenues implying that they might have been in a precapious- fiscal position.
CITIES WITH A GREATER BORROWING REVENUE RATIOThe seven cities in which, the percentage of their total revenues
supplemented by total- borrowing was gteater than New York City were San Antonip, Cleveland, Houston, San Jose, Washington, D.C., Philadelphia, and Phoenix. Pour of these, San Antonio, Houston, San Jose, and Bhoenix are in the Southwest--generally considered a growing part of the country; Washington, D.G., Philadelphia, and'New York are in the troubled Northeast;| Cleveland is in the northern industrial belt. Although their debt patterns were similar, their population growth and revenue and expenditure patterns depicted .two different situations: 1) comparatively well-off southwest
32
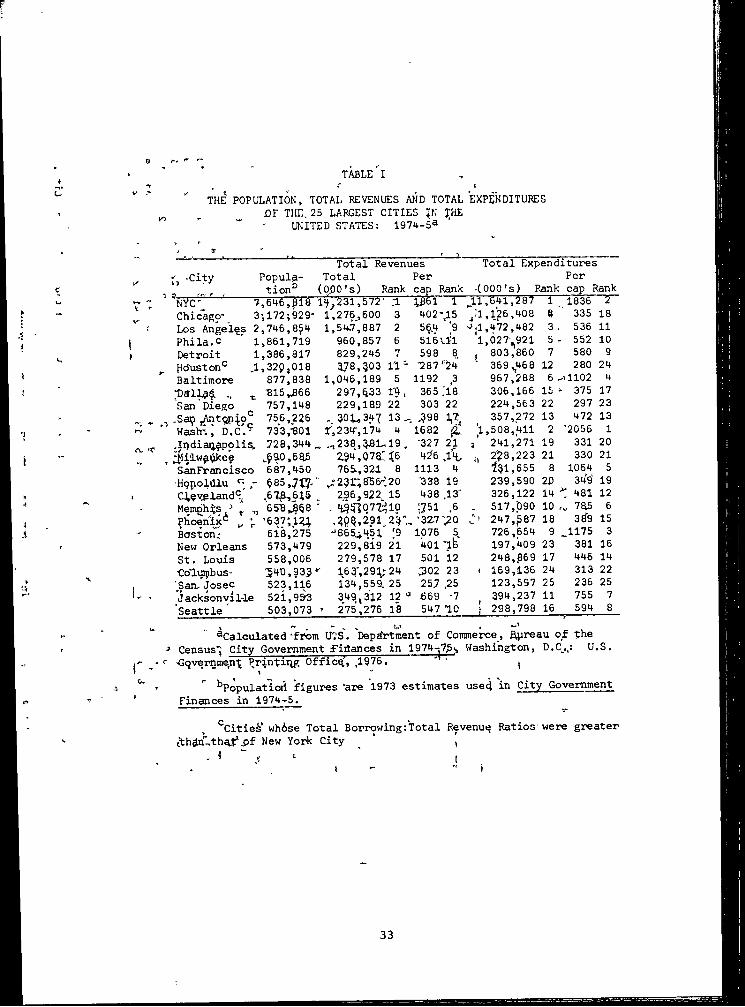
TABLE I
THE POPULATION, TOTAL REVENUES AND TOTAL EXPENDITURES or THE. 25 LARGEST CITIES |N !HE
UNITED STATES: 1974-5^•r
r, ‘City 1Population^Total Revenues
Total Per (000's) Rank cap Rank
Total Expenditures Per
.(OOO's) Pank cap RankNYC ‘ 7,646,^18 231,572' 5 1861 1 51,641,287 1 1835 2Chicago* 3•,172-,929- 1,276., 600 3 402- :i,125,408 « 335 18Los Aneeies 2,746,8^4 1. GOCO5to 2 544 .9 0 .1,472,482 3. 535 11Phila.c 1,861,719 960,857 6 515111 1,027 921 5 . 552 10Detroit 1,386,817 829,245 n 598 8, . 803,860 7 580 9Ncfuston' ,1,32p,018 378,303 11 -287‘24" * 359 ,,468 12 280 24Baltimore 877,838 1,045,189 5 1192 ,3 967,288 6 -'1102 4*Dail?4 „ t 815,^66 2 9 7 ,4 3 3 365 ;i8 305,156 15 - 375 17San Diego 757,148 229,189 22 303 22 224,553 22 297 23..Sa ,MtQp4p° 756,226 301 ,347 13 588 I’T; 357,272 13 472 13Wash-., D.C.^ 733,-801 11234-, 174 4 1682 12. 1,508,411 2 ■2056 1,Ipdiaijppolis. 728,344 ,, 238.,381.19 . ■327 2; , 241,271 19 331 20■Milwaukee .p90,6a5 2 9 4,07a:18 426 .IH, :j, 2'?8,223 21 330 21SanFrancisco 687,450 765., 321 8 1113 4 231,655 8 1064 5•Hpnoldlu ^85,717/ V"23r,S5&;20 -338 19 239,590 20 349' 19CI,pyeland° ,67B,6i3 . 295,922 15 438 ,13’ 326,122 14 481 12Memphtf^ „ Phoenix® „ U
65B»j868 ■ 1*937077;:;10 ;j5i ,6 -, 517,090 10 785 6'637;124 208,291 23"-, -3Z750 : 1 247,^87 18 3b'9 15
Boston; 618,275 vJ'6654451 5 1076 5. 725,654 9 -.1175 3New Orleans 573,479 229,8i9 2’l 401 ’lb 197,409 23 381 16St. Louis 558,006 279,578 17 501 12 248,869 17 445 14■Co'liiiibus- 5 4 0 ,9 3 5* 153-,291;24 -302 23 1 159,136 24 313 22'San- Josec 523,116 134,559. 25 257 ,25 123,597 25 235 25Jacksonville 521,9W 349,312 12 “ 669 •7 394,237 11 755 7Seattle 503,073 275,275 18 547 10 i 298,798 16 594 8
^Calculated ‘from U7S'. Depetrtment of Commerce, ^reau of fhe Census' City Government ,-Fiilances in 1974-,? Washington, D.C.,: U.S.-Gqvernmen't Printing Office, ,1976. ' ' jt
Populatioil "figures ‘are 1973 estimates use4 in City Government Finances in 1974-5.
Citiek' vhbse Total Borrowing :Total Revenue Ratios were greater pf New York City
- ~ i
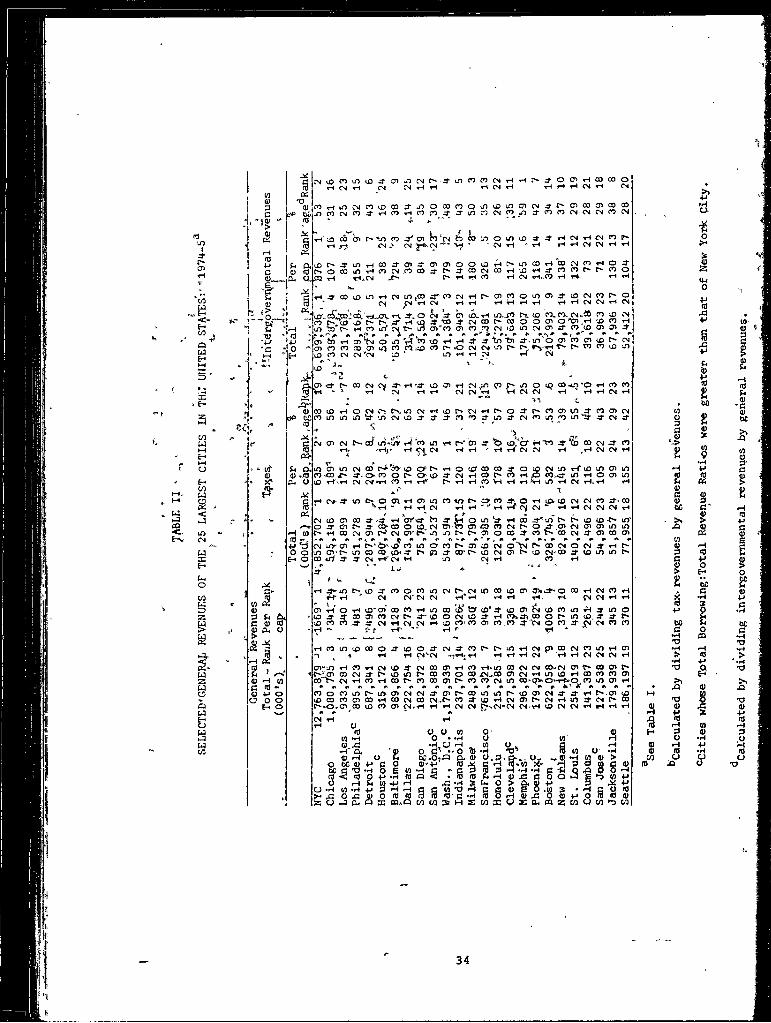

cities which have increased their pppulations between 1960 and 1973 and2)less affluent northern cities whose populations have declined CTable IV).
In general the southwestern cities had healthier tax situations.While their citizens were paying less taxes per capita, the tax collections were providing relatively larger percentages pf the general revenues.Their ranks on the percentage of general revenues paid in taxes were greater than those for the absolute taxes paid CTable II). The-reverse was true for the other cities.; their high taxes were comparatively less important as a source of all general revenues.
The southwestern cities also exhibited a more optimistic position with respect to ^their expenditures. Their per capita expenditures on capital outlay (as a proportion of all general expenditures) were greater than in the other cities; they were placing a greater emphasis on their future growth (Table .V).
EFFECTS OF ECONOMIC STRUCTURESThe employment structures of the eight cities show that New York City
and Washington, D.C. both had large percentages- of their work forces in government, finance or service industries -(Table IV). Th6se two cities also generally had the highest levels of per capita and “total revenues,
intergovernmental aid, expenditures, public welfare expenditures, and debt outstanding and borrowed (Xables II, III, and V). NO other significant relationship seemed to exist between the other six cities' overall fiscal situation and their employment structures'.
NEW YORK CITY'S UNIQUE FISCAL PROBLEMSIn comparison with all of the 24 cities studied. New York City's
fiscal situation was unique in many ways. Its total debt and borrowing was much greater than-any other city. Its per capita debt outstanding was 23 percent greater than that of Washington, D.C., the second ranking city. The total outstanding gross debt was seven times that of Los Angeles, its nearest cqinpetitor. Washington, D.C‘.'s per capita total borrowing almost eguallqd that of -New York City's, but both were over two times greater than Boston, the third ranking fiity. Yet New YorTc City's total borrowing fqr 1974-5 was 83 times greater 'than that of any other city.Its expenditures on public welfare and femployee-retirement expenditures were also greater- than any other city (Tables III and V).
V
Tt can be dChcluded' that ew York city's fiscal problems ceune about, not just because it was losing its tak base and usihg long term Igans to finance current expenditures, but bebaUse it was doing so in such large amojints» The City, may-have been overly’generous in supplying services to its own citizens and-, its commuters; -it runkfed ‘second only to Washington, D.C. in per capita expenditures but first in total expen- ^itures. Therefore, it. .needed very large amounts-of -revenues from taxes and ai'd from the federal and state governments as- well' ah rather considerable amounts from borrowed funds.
summary and implicationsThere were seven cities whose total borrowing formed a larger per
centage of total .revenues than in New York City. These all could be divided into two types. The first were growing communities in the Southwest with small but generally adequate tax collections. The second were declining communities in the North with large but not necessarily adequate tax collections for their expenditures. Except for Washington, D.C.’s and
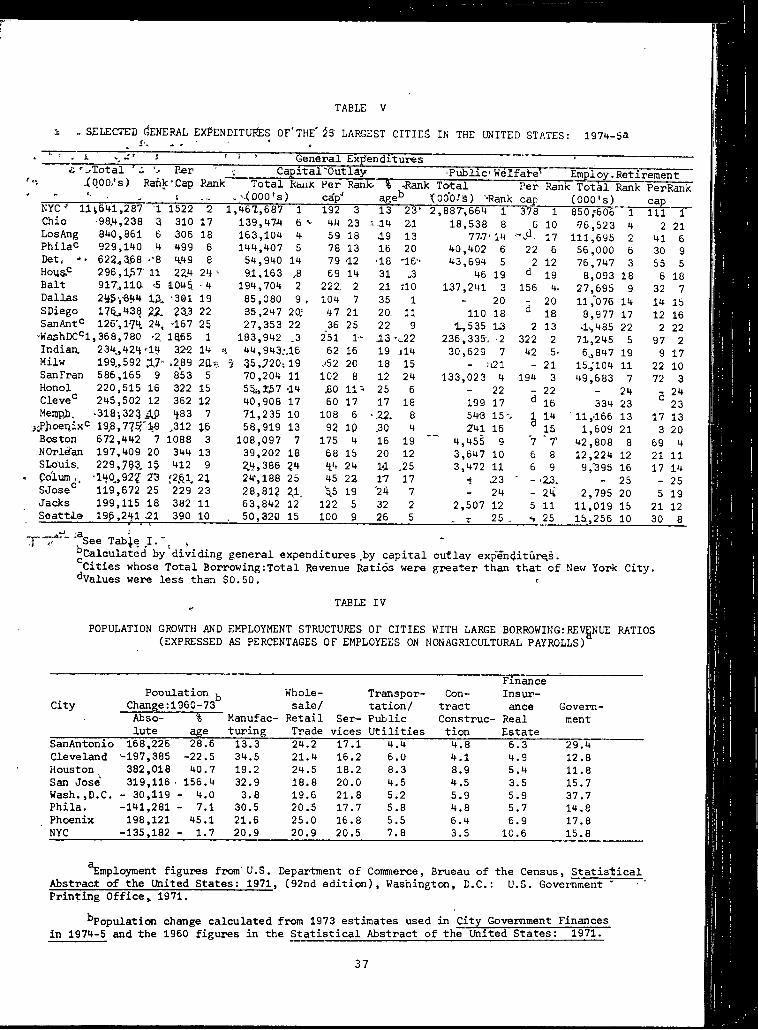
Jt . SELECTED dENERAL EXPENDITUltES OF'THE'2S LARGEST CITIES IN THE UNITED STATES: 1974-SaTABLE V
i ' ' General Expfenditures >& '. Xotal a
> iqoo.'s)Pjer
Rank 'Cap1
Capital'Outlay •Public’ Welfare' Employ.RetirementP,ank Total Rcujk .>(000's)
Percap’’
Rank.-age
J^k Tatal -(OOOlg) Rank
Percap
Rank: Total (OOO's)
Rank PerRankcaoNYC^ 114641,287 1 1522 2 1,467,687 1 192 3 13 23' 2,887-,664 1 378 1 850,-606 1 111 1Chic -98,4,238 a 310 17 139,47-4 6 44 23 I14 21 18,538 8 6 10 •76,523 4 2 21LosAng 840,861 6 306 18 163,104 4 59 18 19 13 77.7. m 17 111,695 2 41 6Philac 929,140 4 y99 6 144,407 5 78 13 16 20 40,402 6 22 6 56,000 6 30 9Det, •• • 622., 3.68 ■•8 4,49 8 54,940 14 79 12 18 -16- 43,694 5 2 12 76,747 3 55 5Hoyg,= 296,167- 11 22,4 24 ' 9.1,163 .8 69 14 31 .3 46 19 d 19 8,093 18 6 18Balt 917,110 •5 1046 ■ 4 194,704 2 22Z 2 21 no 137,241 3 156 4. 27,695 9 32 7Dallas 2ii5',6if4 16. '301 19 85,080 9 , 104 7 35 1 - 20 _ 20 11 ,'076 14 14 15SDiego 176., 438 72. 23.3 22 35,247 20; 47 21 20. 11 110 18 d 18 8,977 17 12 16SanAnt' 126', m 24, -167 25 27,353 22 36 25 22 9 1,535 13 2 13 n.,485 22 2 22•WashDC' l,368,780 '2 1365 1 183,942 .3 251 1-- 13 ' 22 236,336, 2 322 2 71,245 5 97 2Indian. 2 34., 42 4'14 32-2 14 <5 44,943;,16 62 16 19 il4 30,629 7 42 5« 6., 847 19 9 17Milw 199.,592 Xl~ .289 .2Ub i 35,720,19 ,•52 20 18 15 J21 - 21 15.,'104 11 22 10SanFran 586,165 9 853 5 70,204 11 102 8 12 24 133,023 4 194 3 49,683 7 72 3Honol 220,515 16 322 15 56i,t57 -14 60 11-5 25 6 - 22 22 _ 24 24Cleve' 245,502 12 362 12 40,908 17 60 17 17 18 199 17 d 16 334 23 d 23MempJu. .318’,323iy) *i83 7 71,235 10 108 6 ^22, 8 54-3 15 1 14 ' 11,166 13 17 13,;P)ioeiiix= 19^,77?'M ,312 16 58,919 13 92 10 20 4 Z41 16 a 15 1,609 21 3 20Boston 672,442 7 1088 3 108,097 7 175 4 16 19 4,455 9 7 ‘ 7' 42,808 8 69 4NOrld'an 197,409 20 344 13 39,202 18 68 15 20 12 3,647 10 6 8 12,224 12 21 11SLouis, 229,763, 15 412 9 2.4,386 24 44 24 1-1 ,25 3,472 11 6 9 9,395 16 17 14Colum ,, •1‘+0,.922 23 (261, 21 24,188 25 45 22 17 17 ■i ,23 ' - ,•Z3. - 25 25SJose' 119,672 25 229 23 28,812 21. ■5,5 19 -24 7 - 24 _ 24 2,795 20 5 19Jacks 199,115 18 382 11 63,842 12 122 5 32 2 2,507 12 5 11 11,019 15 21 12Seattle 196,2ifl21 390 10 . 50,320 15 100 9 26 5 . T 25 , 25 15,256 10 30 8
'Ssee Table I." ,^Calculated by dividing general expenditures by capital outlay exp'e nditur s.Cities whose Total Borrowing:Total Revenue Ratios were greater than that of New York City. ' Values were less than $0.50. t
TABLE IVPOPULATION GROWTH AND EMPLOYMENT STRUCTURES OF CITIES WITH LARGE BORROWING:REVENUE RATIOS
(EXPRESSED AS PERCENTAGES OF EMPLOYEES ON NONAGRICULTURAL PAYROLLS)^
CityPoDulation
Change:1960-73 Abso- % lute age
Manufacturing
Wholesale/RetailTrade
Services
Transportation/PublicUtilities
ContractConstruction
FinanceInsuranceRealEstate
Government
SanAntonio 168,226 28.6 13.3 24.2 17.1 4.4 4.8 6.3 29.4Cleveland ^197,385 -22.5 34.5 21.4 16.2 6.0 4.1 4.9 12.8Houston 382,018 40.7 19.2 24.5 18.2 8.3 8.9 5.4 11.8San Jose 319,116 • 156.4 32.9 18.8 20.0 4.5 4.5 3.5 15.7Wash.,D.C. - 30,119 - 4.0 3.8 19.6 21.8 5.2 5.9 5.9 37.7Phila. -141,281 - 7.1 30.5 20.5 17.7 5.8 4.8 5.7 14.8Phoenix 198,121 45.1 21.6 25.0 16.8 5.5 6.4 6.9 17.8NYC -135,182 - 1.7 20.9 20.9 20.5 7.8 3.5 10.6 15.8
Employment figures from U.S. Department of Commerce, Brueau of the Census, Statistical Abstract of the United States: 1971, (92nd edition), Washington, D.C.: U.S. Government 'Printing Office, 1971.
Population change calculated from 1973 estimates used in City Government Finances in 197M—5 and the 1960 figures in the Statistical Abstract of the United States: 1971.
37
New York City's large gcjyernmeirt, finance, and service ^jnploynjent, these all had similar employment structures, -However, New York City's finances were much different from the ptheiT e6vSh"cities in'Sne very important*way; the City's" TCtal voliiine of rtoney handled greatly" surpassed, all others.* ’ qn,ly Washington, D-i:. approached New Yprk City's-very'high per ‘capita_levels of revenues, expenditures, and debt (in total amounts no city spent similar amountsT. ^TeW York City's* Jiear default was a repult of its questionable . fiscal tactics and, also the tremendous amounts of money needed for the City to function efficiently:.
It is highly improbable that’’any major dity in the United States will face default for the same rJSasons that New York City did. New, Y o r k City was not" completely "Straightforward in its finanping and tighter fiscal controls existing now(5) should prevent other 'cities fro’nr having the same opportunity to "get into deep trouble. In addition. New York City deals with much latger sums-of money than^any other city, partially because of its very generous employfnent arfd welfare systems. -Since no other city 'approaches New Yoric in this respecSt (exCeJit perhaps-Washingtbn, D.C. in' per capita amounts), none should.have the same fiscal probiems.
1 REFERENCES ‘CITED1. u .S. Department of Commerce. Bureau o'f the Census, pity GOyernmert
Finances in 1974-5, Washington, D.C.: U.S. Government Printing Office,1976.
2'i U.S. Department of Commerce. Bureau of the Census. StatisticalAbstraOt of the Unifed Statefe;' 1971, (92nd edition) Washington, D.C.: U.S. Government Printing'office,' 1971# f
3. United States Congress» .Joint Econpaiip Committee, New York- Ciyg"Financial Crisis; An Evaluation of its EcOhomic impact .and of Proposed Policy Solutions, by Ralph fechlosstein'. Washington, D.C.: GovernmentPrinting Office, "1975,' ^.3.
4. Ibid, p. 24.5. Wall Street Journal, "Tell and Sell," June 30, 1977, p, 1.
g i
t
1
, ' CHAf^SajlfP^JlRNS OF tiIGH STi TUS RESIDEPIAL = X AS*-ILLUSTRATED BY CHICAGO* ‘. * 1 ■>; Ja t i, james'Wfci Newton and Joseph S. Rabianski
State University Go^l^gej Broakppr± and Goergid^ State University
’ INTRODUCTIONs. ^ Varipus studies have examined*the residential patterns'of the upper
-income or higher .status, group-. As a rule, these studies have found-that the. ho.useJipldsj in. this income group have moved, away from the center -of the. city- to ,the urban., fringe.. The flow pattern of' these households- has been debete^ and. .studied for the past 50 years. Burgess (l)i argued that this type p.f family occupies the odter-concentric zones of -an urban area. Conversely.,.-Hpyt (2) argued that this type, of family locates in a^sedtoral or axial pattern in-relationship to the*center of the city.
Recent studies have related these locational tendencies to characteristics of the cities. Schrjore(3) has shown that the Burgess thesis is most oftpn evidenced in the largest and the oldest metropolitan areas. In later studies, researchers have shown that .other characteristics of the metropolitan area such as housing-attributes, the .industrial "base, and the minority- racial composition are variables-affecting the locatidrt of the Ifigher status , household. (4)-
In another body of literature/ researchers have found that the locational choice -of the higher status household Jias'been based on a trade off .between travel costs and locational amenities. The travel costs have bepn measured in the fpym of out-of-pocket expenditures and travel time between, homp and work. In-seyetal studies, the amenities Have been represented by variables puch as the size and age pf,the house, the size- and aesthetic quality of.-the residential lot and its environment, central city .gongeslbion, crime, good sphopls and/or class homogeneity. (5) .These studies are pfedic'ajp^on the theory that as transportation in the cities improved due to the rise of private automobile use and the construction of surfaced streets and major arterials to accommodate the auto, the higher status housphpld,moved away from the center of the city to obtain the locational amenities a% the fringe of the city.'
, * e , . I, rAs IS evident, most of the literature has investigated the movement of the upper income group away from the center of the city. This outward expansion has been described as either a pat'tpr.n .of sectora.!' expansion
1 or a .pattern of zonal expression fBuj-gess) .■ Both imodeEls-ascribe to•'?' Pxiejway directional b^as -away from the een'ter tl{e city by, means, of npw,growth at the margin of either the, sec.tor or theizpne. j:UQMfi.verrf since the‘upper income group has'a higher degree o: , selectivity-in thpirrchoice of residence, it seems reasonable to postualte that they would also have
.than a one-way-.directional, moveigants, iovjatd; the, urban fringe. Th is, .study ^ttempta to, aa.certain whether or not; ths uppet income- groupegn Lbi'ted an alterr a-tivp choice to, s,uch o.U'lyy A'd -growth, namely, resi- i riti,al *expansibi{ at"qr ne^r the cepter pf the. city*- ' ,
, ~ y t -i ftMETHOQOLiOGyjC
In order to test for the existence of this expansion of the upper I urban core,- 64 census .tracts werp chosen for analysis.
traqts JlP.ve hiqtqripally* been asspciatefl j/ith high _ir}come* residential areas within the city of Chicago, The 64 census tracts selected include
39
the "loop" a.rea of .Chicago, the CBD, and the .northyard.,extension along Lake 'Michigan. This 'area conforms 'to the tehfe*t§ expressed t>y Hoyt and others as to the locational''choice 5f wealthy individuals. Specifically, the area is accessible to downtown Chicago with its job market, shopping areas and- cultural, facilities’. It also pro-O-ides easy access to the lake, possesses recreational advantaged associated'with the'lake, ^hd offers the modifying effects of the lake on both summer and winter temperatures.
The initial task of this investigation was to determine which of the census tracts in the selected- area of Chicago possessed the socio-economic characteristics associated with the higher status residential areas. Thqse data deemed to be*pertinent to the study were shbject'ed to orthogonal factor analysis with Varimax rotation: C6) Nine socip'-Otjonomic variables for the 64 census tracts provided the information for-the data matrix. The varimax rotation technique produced factor loadings and factor scores which were used to analyze,the similarity of* the census tracts. Factor loadings identified the cluster of interrelated variables that wefe associated with the higher status factor pattern(7) and- the factor sc6res identified the census tracts that were associated with the clyster of h i g h htatus variables.
EMPIRICAL RESULTSTables 1 and 2 present the factor loadings for the socio-^economic
variables examined in the investigation. Factor I in bdth tables reveals 'a strong relationship among ithose variables that indicate a high status household. The high loadings for managers, professionals, high median income, and percent of persons earning more than $15,000 on Factor I in Table 1 ‘for 1960, and a similar relatidrtship in Table 2 for 1970, conform to past findings that these variables are indicators of the higher socioeconomic groups in an urban community,(8) Therefore, ’actor 1 for both the 1960 and 1970 data was considered- as a high status factor. The proportion of. total variance accoxmted fOr by Factor 1 in both 1960 and 1970 is approximately 55%, and this factor Was'the most significaht in explaining the variation in the data matrix,* 'Since' a major objective of this study was to discern the spa'tial resideiitial patterns of the Upper income households, no attempt ‘was made to account for the groupings in the additional factors that were generated,' '
Tables 3 and 4 indicate the factor scores for thos'e census tracts that were closely associated with thS elite or "high social status' factor. Only factor scores greater than one are significantly associated with the factor ‘grouping. (9”)'
Figure 1 shows the location of the census tracts in 1960 that had factor scores greater thaft on# for the high status factor- The pattern suggests a strong attacIMent to the lake hofth of the core of the ’city.In addition, "Un but 'oni^of the tracts were located in the harbor areas that serve pleasure ciaft.
Figiire' 2- iirUstrat'eS" the location -of census tracts in 1970 tha’t were strongly- tied* tti tWO KlgTi‘'StatUs factor. Eleven census tracts wOre ,identified with' the higher s'tatu# factof in rff7CT urid these eleven tracts included all byt twO of the tfacts associated With 'the l^io high status factor. Most interesting to this investigation is the development and expansion of high income residential areas just north and adjacent to the core, and in the CBD itself.
The •trend for-the-I960’and r970 'period tends to suggest a .few interesting locational developments 'for -the High status residential area6.
40
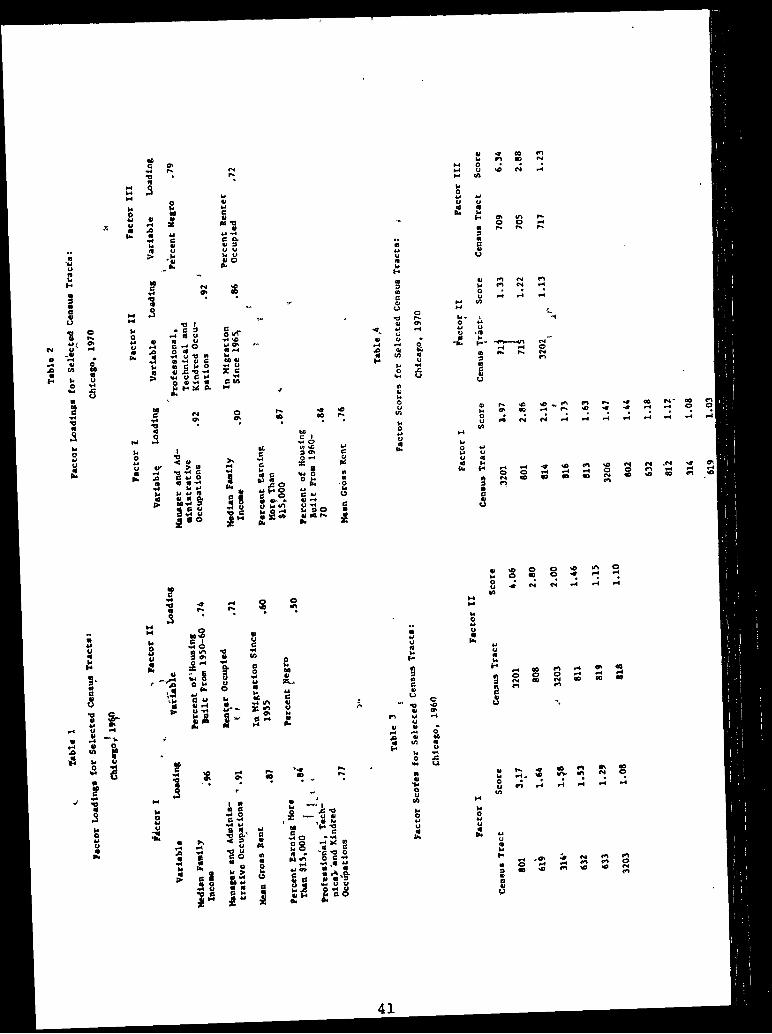

•First, there h^s been a" dlose .attechment to. the scenic harbor areas north ‘9,f the’ CBb. ■\This_t;te'ij,d %upp6rts’',ioafiy of, the previousj findings that the 'Wealthy “cldss seeks out those-'-areas that-possess pleasing residential
as evidenced, by the, Montrose,^aijd Belmoi t Jiarbor' areas. ‘'■However, of'more importance tp' triis- inYestigation/was-the spatial pattern _ ihdicatddjby~>the ^ensua;-tfac1^s*^e^r _t e the i3ownto\ra section.■These "censu^ trac'ts .were ■strq’ngl'y,.assppX,^ed with the high status factor in ib70, but'-Were not identiftfed witlij the upper; i pcqme -group in 1960. The spatial pattern in 1970 offersT evidence that the upper income groups have expanded their residential .locational choices toward, the .center of the city, thus tending'to substan.tiate. thelpiajor 'conteht'iqn of this study that the bi^hpr income residents^ nave .expressed ah alternative to the. ijiore generally ■abcepted centrifugal,:movenfent~expp,unded/,in 'the. literature.
.C.ONCLUSIONS’ The ‘Classical -land** use rip'dels o‘f Burgess and. Hoyt have been applicable for most of this century. However, thVre appears to be a new social-resi-
J'he results of this study tend to indicate ‘tnat iii"1:he' city df hidagd/*^whi.ch se ryedr-as -a laboratory for both theHoyt models, there has beefi a growth of higher status neighbor— hoods both near to. and in the cope of the.urban srea during the 1960-70
period. Thi'S finding*.is no'h a refutation o^ either the Burges.s or'Hoyt bypp.thesis. Their approach''focused on a generalization about residential expansion in a metropolitan area based on aggiregate statistics contrasting the central city and the suburban ring. However, this study examined a specific section of the central city over time and found an inward expansion of higher status neighborhoods instead of outward expansion as. -theorized in previous models.
The above conclusion was also reached by Johnston, in his study of high status households in Christchiprch, New Zealand.(10) He found that a segment of the upper income group, the business elite (mainly company directors), nought residential locations in the urban core.
If the spatial pattern identified in Chicago becomes more universally accepted as an alternative residential mode for the high income social class, the implications suggest the need for the formulation of new (different) land pse policies for the inner city. The success of such policies will necessarily depend on a greater understanding of the forces and preferences of the higher income groups in their desire to re-inhabit the inner core.
REFERENCES CITED1. Ernest W. Burgess and Harvey J. Locke, The Family (New York: AmericanBook Co., 1960), pp. 111-12.2. Homer Hoyt, The Structure and Growth of Residential Neighborhoods in
American Cities (Washington: Federal Housing Administration, 1939),P • 7 6 •3. Leo F. Schnore, The Urban Scene (New York: Free Press, 1965), pp. 201-
4. Avery M. Guest,. "Retesting the Burgess Zonal Hypothesis: The Locationof White Collar workers," American Journal of Sociology. LXVII. Number 6, (May, 1971), p. 1096. ^
5. See R. N. S. Harris, G. S. Tolley, and C. Harrell, "The Residence Site
43

6.
7.
8.
9.
10.
choice " Rfiview, of Economics and StatiB'ties. L, Numbcf 2 (Msy/ 1968)/ DO Vd-4V; Barbara. Murfay) ,"Central Clty topenditurea and Outmigration-to the F r i n g e Land Economics. XLV (November, 1969), pp. 471 74.The technique employed in' this study &as been effectively describedFactor w a l Y g BNorthwestern University' Press7- 197X) f pp. 36S’-94 and pp. 195 9o#^ee also, Harrv H. "Harmah.~Modern Factor Analysis (Chicago: Univer-si-ty of ‘Chicago'* Press, 19^), pp. 304-13.Brian J. L. Berry, "Latent''stri4:ture, of the American Ur)jan System,
in ;Brlan, J . '•Smi'tb, Ci'tv n'asslfic'ation H^dbooK; ^Methods and .Applications (New- York: Wiley-InterScience> 1972), p. 14.Otis Dudley Duncan and-Beverly Duncan, "Residential Distribution and Occupational Stratification," .The American Journal -of, Sociolpay.LX fJuiV, 1954-May, 1955'), p. 495.R. J. Runnel, Applifed Factor Analysis (EWston: . Northyestprn Univer sity Pre^, 1971), p.* 150.R. J. Johnston, "Process of Change ,in the High Status Residential Ateas of Chris-tchuteh,' New'Zealand," New„Xealahd Geograp^r .,XXV (April', 1969X,’ pp. 1-14,.
44

"unified system of settlement" is often advocated «rhepeby functional interrelationships between cities, especially those of suburban towns with the central city, are stressed.(5)
Other measures employed to curtail large city growth have been migration controls, systems of "greenbelts", and use of the bureaucratic decision making structure. Controls over population movements have been ^ployed at tines? labor books, internal passports, and special residency requirements for the large cities were attempts at controlling the pace and the direction of migration streams. The greenbfelt concept, whereby a zone of opeh space would surround citieS, emerged'out of the Moscow Plan. Industrial establishments were to be forbidden In this zone thereby attempting to halt the outward expansion of industry. Less direct approaches have made use of the bureaucratic decision making structure.For example, the placement of additional poVers over "housing and services in the hands of local- city governments rather than industrial ministries is an attempt to restrain*the over-urbanization caused by ministries' desires’■fon locations in the large bities. Laikewise, the requir^ent that national organs such as Go'splan USSR give final approval to investment projects is an attempt to further dissipate the industrial ministries' ability to direct project funds to the larger cities.
SOME EMPIRICAL' OBSERVATIONSDespite the official commitment to control urban growth,' the USSR
appears to be emulating the world-wide trehd of an increasing concentration of the urban population in the Ihrger cities of the hierarchy. Whereas only 36.1% off the'urban population lived in cites larger than 100 ,000 in 1926, 57.1% were in that category by 1974. More specifically, 15.6% of the urban population resided in-Cities-of greater than 500,000'In 1926 and 27.9% in 1974. Obviously the Soviets have not done away with large cities, but such aggregate data must be supplemented by more rsfi^^sd analysis in order to.appraise the-Soviet efforts meaningfully. A nun^er of additional calculations and obsbrvatibns- have therefore been made using the Soviet census materials for 1959 and- 1970i(6)
Further analysis' of the 1959-70 data reveals that 75% of the 36 million increase ih urban inhabitants occurred in cites that exceeded 100->000 in 1970. Previous research has argued that investment flows are biased.foward political capitals because of the merging of political and economic aspects in Soviet society.(7? Therefore, the growth rates of administrative cSpitals versus non-administrative centers were calculated for the 219 cities*exceeding 100,000 in 1970. In the-100,000-500,000 category (187 cities), 76.5% of the political capitals '(75 of 98 cities) grew at a rate exceeding thS national average for all cities. Conversely, only 41.6% of the rlon-capitals (37 6f'89 cities)-^exceeded the national average. Since 31 of the 32 cities in excess of 500,000 were political capitals, a division into twC groups was' unnecessary. Interestingly, only 35.5%. of these political capitals (11 of 31"cities) exceeded the,national growth average.
Since the -larger the city the greater the-difficulty in maintaining high percentage growth rates, the'^absolute data on city population^ were also analyzed. The asSumptioft used was -that a dynamic political capital would, .over"time', increase itS dominance within the administrative unit's urban hierarchy (e.g. MoSdow, if dynamic, would account for a^higher percentage of Moscow Oblast'S urban population 'in 1970 than it did in 1959). zFor the political capitals ih the 100,000-500,^00 range, 77.4% of the • jcities -were found to have incSreased their "percentage of the total adminis- 'trartive unit?s urba'n pdpulation" for the’-1959-70 period; only 45.2% of
46
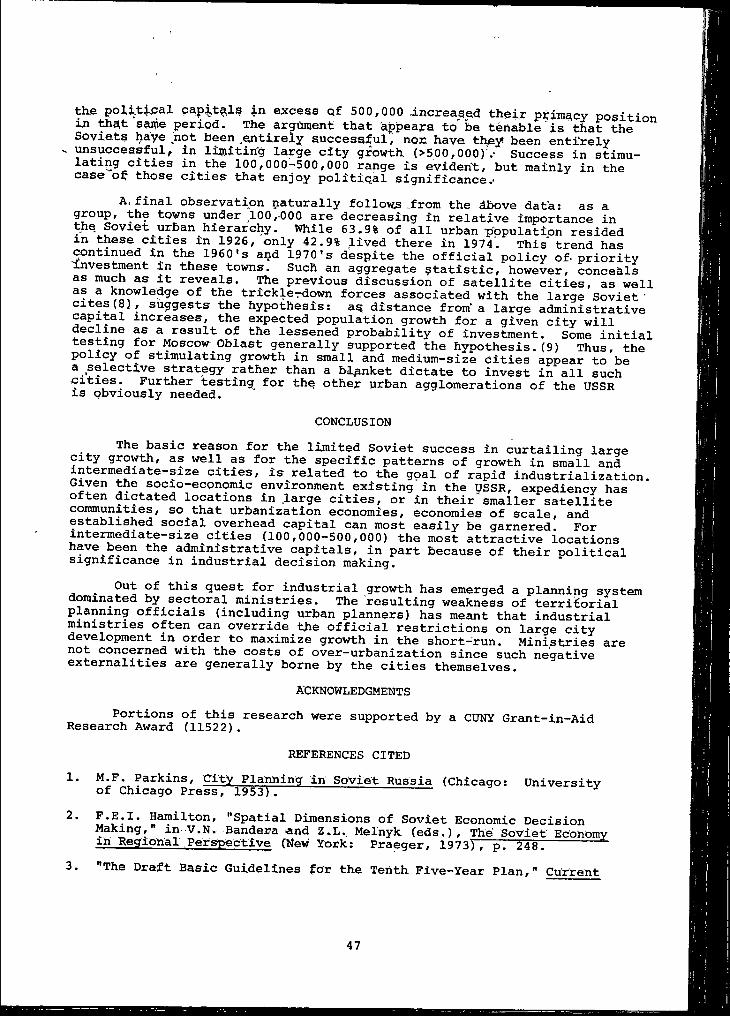
th£ polj..t .cal papx.t^l§ excess qf 500,000 JLncreased theij: primacy position in th^t same period. The argument that appears to be tenable‘is that the Soviets haye not been entirely successful, non have they* been entirely
- unsuccessful, in limiting large city growth (>500,OOO)’.- Success in stimu- cities in the 100,000“500,000 range is eviden't, but mainly in the case of those cities that enjoy politiqal significance^
A,final observation naturally follows .from the above data: as agroup, the towns under 100,000 are decreasing in relative importance in the Soviet urban hierarchy. While 63.9% of all urban population resided in these cities in 1926, only 42.9% lived there in 1974'. This' trend has continued in the 1960's and 1970's despite the official policy of-priority investment in these towns. Such an aggregate statistic, however, conceals as much as it reveals. The previous discussion of satellite cities, as well
Knowledge of the trickle-rdown forces associated with the large Soviet ' cites(8), suggests the hypothesis: as distance from'a large administrativecapital increases, the expected population growth for a given city will decline as a result of the lessened probability of investment. Some initial testing for Moscow Oblast generally supported the hypothesis.(9) Thus, the policy of stimulating growth in small and medium-size Cities appear to be a selective strategy rather than a blanket dictate to invest in all such cities. Further testing for the other urban agglomerations of the USSR IS Qbviously needed.
CONCLUSIONThe basic reason for the limited Soviet success in curtailing large
city growth, as well as for the specific patterns of growth in small and intermediate-size cities, is related to the goal of rapid industrialization. Given the socio-economic environment existing in the USSR, expediency has often dictated locations in .large cities, or in their'smaller satellite communities, so that urbanization economies, economies of scale, and established social overhead capital can most easily be garnered. For intermediate-size^cities (100,000-500,000) the most attractive locations have been the administrative capitals, in part because of their political significance in industrial decision making.
O'it of this guest for industrial growth has emerged a planning system dominated by sectoral ministries. The resulting weakness of terriiEorial planning officials (including urban planners) has meant that industrial ministries often can override t)ie official restrictions on large city development in order to maximize growth in the short-run. Ministries are
*"®^oerned with the costs of over—urbanization since such negative externalities are generally borne by the cities themselves.Acknowledgments
Portions of this research were supported by a CUNY Grant-in-Aid Research Award (11522).REFERENCES CITED
1. M.F. Parkins, City Planning in Soviet Russia (Chicago: Universitvof Chicago Press, 1953).2. F.E.l. Hamilton, "Spatial Dimensions of Soviet Economic Decision
Making, in V.N. Bandera >and Z.L., Melnyk feds.). The’ Soviet Ec'onomv in Regional Perspective (New York: Praeger, 1973)', p. 248.-------
3. "The Draft Basic Guidelines for the Tenth Five-Year Plan," Current
47

,1 4. . Ye.N.5 r^eY-tsik, Rayonnaya plaftlrovriai geo^raficheSkiye aspekty- (Moscow: <Mygl*, 1973)’,• p,- 168; and V.^TPerevenddhtseV, "Need Liitiits be Set on Urban Sprawl?” Current Digest of the Soviet Press. XXI (March 19, 1968) r p. 8-9. ----------------------- '
5. D.G. Khodzhayev and 3.S. IChorev, ' The Conception of a Unified System * of Settlement and the= Planned Regulation of'City Grovrth in the USSR," Soviet Geography: » Review and Translation, XIII (1972), p. 90-98.
6- Itogi vsesoyuznoy perepisl nlse'leniya 1970 goda (Moscow: Statistika,1972), pp. 22-61. '-------^ ----- ----7. G.*A. Huzinec, "•Industrial Investment Flows within the Soviet Urban
Hierarchy," paper presented at the Midwest Slavic Conference, Cleveland, Ohio, 1975.8. Ibid.9. G, Gustafson and G.A. Huzinec, "Influence of Soviet Administrative
Centers upon the Urban Hlerarfchy," paper presented at the First Annual Meeting of the New England Slavic Association, Storrs, Connecticut, 1976.
Digest of the Soviet 'Press, XXyil-(^ari. 14, 1976)., p. 21.
I
48
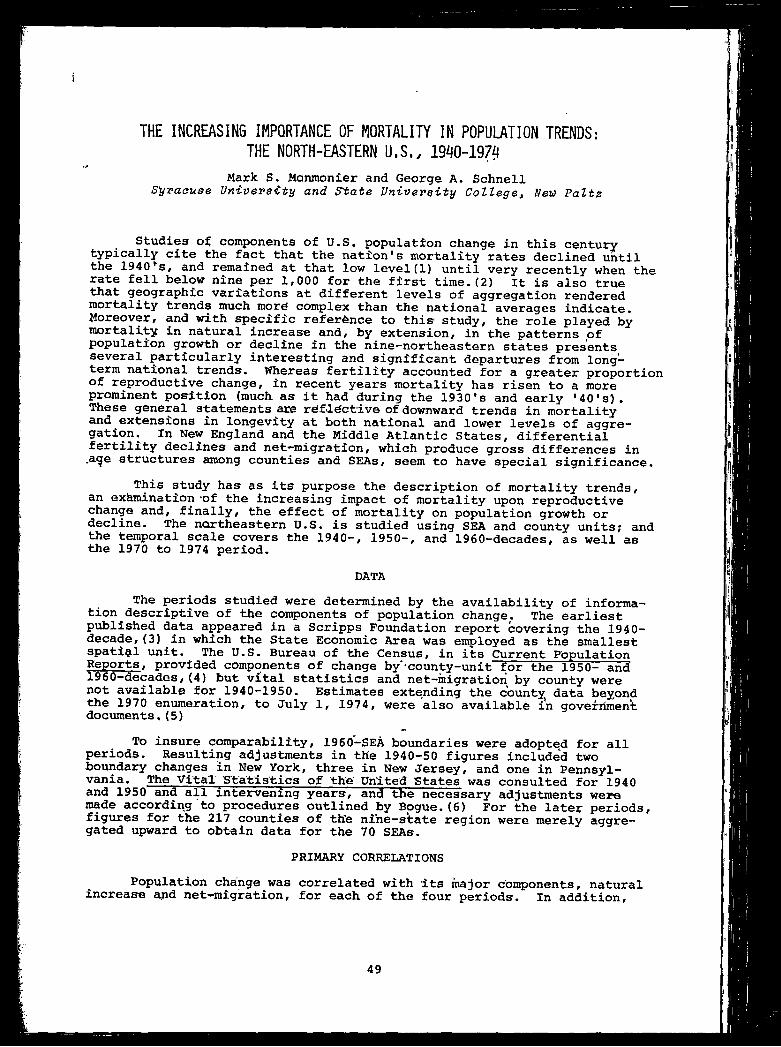
THE INCREASING IMPORTANCE OF MORTALITY IN POPULATION TRENDS: THE NORTH-EASTERN U.S.. 19^0-197^1Mark S. Monmonier and George A. Schnell
Syvaause University and State University College, New Paltz
Studies ot components of U.S. population change in this century typically cite the fact that the nation's mortality rates declined until the 1940's, and remained at that low level(1) until very recently when the rate fell below nine per 1,000 for the first time.(2) It is also true that geographic variations at different levels of aggregation rendered mortality trends much mord complex than the national averages indicate. Moreover, and with specific reference to this study, the role played by mortality in natural increase and, by extension, in the patterns of population growth or decline in the nine-northeastern states presents several particularly interesting and significant departures from longterm natxonal trends. Whereas fertility accounted for a greater proportion of reproductive change, in recent years mortality has risen to a more prominent position (much as it had during the 1930's and early '40'sK These general statements are rdfldctlve of downward trends in mortality and extensions in longevity at both national and lower levels of aggregation. In New England and the Middle Atlantic States, differential fsrtilxty declines and net—migration, which produce gross differences in • 9® structures among counties and SEAs, seem to have special significance.
This study has as its purpose the description of mortality trends, an examination *of the increasing impact of mortality upon reproductive change and, finally, the effect of mortality on population growth or decline. The ncxrtheastern U.S. is studied using SEA and county units; and the temporal scale covers the 1940-, 1950-, and 1960-decades, as well as the 1970 to 1974 period.
DATAThe periods studied were determined by the availability of informa
tion descriptive of the components of population change. The earliest published data appeared in a Scripps Foundation report covering the 1940- decade, (3) in which the State Economic Area was employed as the smallest spatial unit. The U.S. Bureau of the Census, in its Current Population Reports, provided components of change by‘-county-unit for the 1950- and 1960—decades,(4) but vxtal statistics and net-migration by county were not available for 1940-1950. Estimates extending the county data beyond the 1970 enumeration, to July 1, 1974, were also available i'n government documents.(5)
To insure comparability, 1960-SEA boundaries were adopted for all periods. Resulting adjustments in the 1940-50 figures included two boundary changes in New York, three in New Jersey, and one in Pennsylvania. The Vital Statistics of the United States was consulted for 1940 and 1950 and all intervening years, and the necessary adjustments were made according to procedures outlined by Bpgue.(6) For the later periods, figures for the 217 counties of th'e nine-state region were merely aggregated upward to obtain data for the 70 SEAs.
PRIMARY CORRELATIONSPopulation change was correlated with its major components, natural
increase and net-migration, for each of the four periods. In addition.
49

natural incr,ea, e was correlated with’ its su’bcbinponents/ fextil'ity and mortality. Although, for any areal- unit, .change .is the algebraic sum
increase and net-migration, “the spatial distributions of change nd either of its primary components need not be accordant. For examole
correlated with net-migration than„with naLral assume that population movements were a more important determinant of the geographic pattern of change than the net effect of
reproduction and mortality. Thus, these correlations can be used to detect spatial-temporal trends in the ^relative importance of the various components and subcomponents of jChange.» j
,N,et-migration has,,been the major geographic control of population the period at bqthiqounty-.and ,SEA*scales (Table 1).natural increase..has.-beeq both- less emphatic and More
net-migration. These traits are evident for the 1950-reprodyctive change had “a modest geographic population trends; and, for the earlier and later periods. Its effect was inconsequential.. ,
4 ^TABLE 1
PRIMARY -CORRELATIPNS---- T" —______ »_ •
:Period f
Net-bC, Change and-: miaration NatnT-ai
'T ■ ' — ■*Natilral-'Increase alid;
SEAs Counties S'bAs- * Counties SEAsBil. Lli&» Counties4. ./ «
Deaths SEAS. Counties
1940-50 ■ 0.96 n.a. 0.26' n-a 0 .J88 %ir/a “0*. 60“ *n.a1956-*6'o 0.97 t).9'9 O'. 53 0 . 6 8 0.93T
j0.9'4' -.052 -0.49
1960-70 0.96 0.98 0.46 0.56 0.92 0.90 -0.74 -0.731970-74 0.98f 0.98 9 .0.8 Q.16- 0.72 0.67 -0.73 -0.73.Sdurce: VQiuput^a ,Dy authors -
Of-natural increase as an impoTtant* spatial detern^inMt of population, growth or decline.sseems to relate'to the sianifi- thr?07n-^r— a-geographic, correlate of reproductive thSge!^^^" •moW Pa^.^od, natural^increase was more'closely associated With
Moreover, §ince 1950, as the influence"of - of fertn-i?v increase became progressively greater, the-effects^^°^sase and of reproductive change on growth in Stilitv Sd%hi; ’ ate .^ootvunexifected iven-the^reductionants?^^^ concomitant growth in, the.-proportiorii of aged inhdBit-T -C . 1 f, > I
- ' MORTALlTy-FEEtILlT?'JlItlOS C-IIf' ' deaths to births indicates the rela'tive contribution
increase and the demographic equation. As suggestedcounties lid sill 5 r ® 1950-60 amongcounties and SEAs (Table 2) . Reporting -these trends for ten-vear nerlndcj
the effects of the post-war baby boom, which probably deferredra,tio, until sojne time in the .mid-195a's. Table 2 also
^ e. correlations between «aqh' pair of consecutivW- peridd'd '-for
50

yihB oratio. 'The‘lowest correlation., 0.7B for &EAs“iui ht.iha. e-a:esulted aEroiti*-family
I 'JdisrniifciDns -during ’-Woild War II and the rronseguent post-war ftcrease in I asBpfidauiction. It i hoiild she ‘eiophasizBd that the -strongest interperiod ’ sarasoci^ion fa.'BB) invo’l-vas -a .perio'd nf iss^jtiian v e years’ ('1970-74) ,I ^hiih 33t^ia ideciise jovet the --remainder -of the decade -were 'demographic I fleTOiits tto change .drastically.- '
I ' s TTABLE. 2 \( ^TRENDS IN THE -MORTALITY-RERTILITY -RATIO
!
Means (a) Interperiod Coirelations (b),’-SEAS_* * ■iCo unties SEAs ■
---y..... j Counties
1940-30 ?D..3t€ n.aI9£5£)' ^ :D..-4«4 A
0.492 0.78 n.a0.«7 a.850..371 ■0..3E4a.93 0.-85IBSTJOtTSi Ca.-E96 0J(3a7
sSourrET} •Computed ijy Authors■(e)) 'Meaiss :are sfor -aeach erioA.5{h) astserperiod-corxelatiqns-show the-as^ciation between consecutive ,:perj±oas.
. t, SEfc gui ,»l'a3epicts the ■mai^tality--feia:ility xaticns tor-each of thejjeriods aitufliedrf To-facilitate -discussion, ’heighten comparison, and pi^Qi^ltt asa(lieTft-ctreTias,_ the m e categories ,fc03ss Jiuitts) were used Sfor ®Q-1 jpeticSs.^ Hlor ithe iI9CC0—30 decade, the .Tiroostook 'Area in 'Maine was tfhe eerily 3EA 6fco texhibit the *high -fefctility-iow -mortality descriptive tff tthe .llowHst sratio -class (Figure In £L930-6a, the -Aroostook -SEA
ijttoed day ascverel others; Northwestern Wermbnt; Erie, Rennsyivania; «nd ttiveral in tNew Heisey (Figure il-TEn jConsistent -with the previously aneiHsronea cdedtiro in the -mean -EEA Tiiortaliiy-flEErtility ratio 'fpom the
ttc-ftfihe [ESraCNaecade, not cne "BEA was found in the highest xatio class •Jin-JBia:hE2:.a:ffi the-carldfer iten-yeaiMperiodsv -Also-, •fewer-SEAs-^-qualified for the ssenond-shi^hedt category in i9f50—50 than in the previous decade.
SKKD-i!T3 iiecade is the Hast iperiod studied during which any SEA C(axCT3Stadh, JMaiine :and -Naragansett, Rhode island) he'longed in'the iowest , tyttegujgy ‘.(FigurB lltc) . :F-urthe_rmore, the -number of SEAs in the second- dryhest category rhad increased", . y 1=974-, -six -SEAs had suf ficiently high ranortalt^ anr ttow aEertxlity to gualify for the highest-ratio class (Figure IHB).. The tSistrifaution cf these tplaces seems to he the -product of cider rsesiSexA gsQprilHtions., which in turn resulted -from in^igration cf aged or CDUtatfigration cff iyounger inhabitants, hath of which would icontrxbute to teduCTa ilertiiity.. Included 'here are the following SEAs: the -Cape CodIiEEa,*iSttSlaTrtic'City, the'Mohav^k-Adirondack Area, and three SEAs in the ®ennaylvartia snthractte .area. So extreme was the influence of age in the aatikawanna -amd luzerne -county SEAs in Eennsylvania, that deaths exceeded tooffehs dcbr the IF970-T4 jperiod (Figure 1-.D) .
T ^ e n co'llectivdly., these four maps portray a -series of vast demo-
51
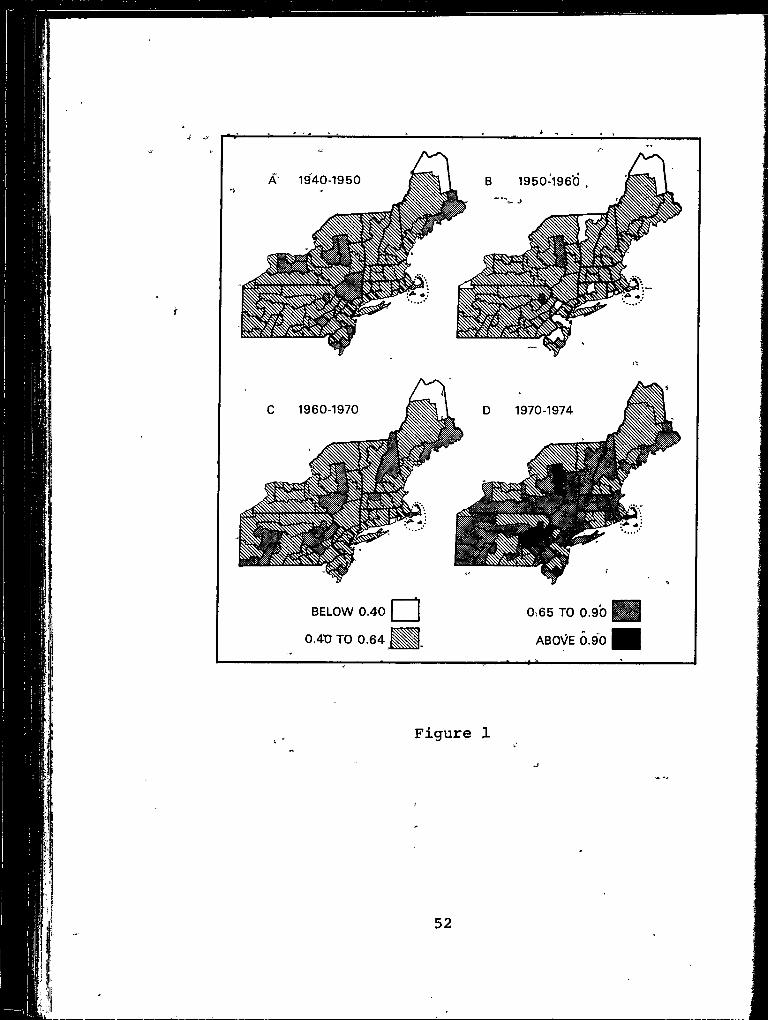
Figure 1
52

graphic changes and, just as importantly, suggest-the degree to which the northeastern states haye declined among the nation's regions. Although a discussion of the specific influences which might have contributed to the Northeast's ills is beyond this paper's scope, this study suggests that lowered fertility, increased longevity, and age-selective migration have conspired to exacerbate faltering economic trends in the region.
REFERENCES CITED1. Carl L. Erhardt and Joyce E. Berlin (eds.). Mortality and Morbidity
in the United States (Cambridge: Harvard University Press, 1974) , p. 3.2. U.S. Department of Health, Education, and Welfare. Public Health
Service. Health Resources Administration. Monthly Statistics Report, Provrsional Statistics. (HRA) 77-1120, Vol. 2§,.No. 1, Paril, 1977,p. 1.
3. Donald J. Bogue, Components of Population Change, 1940-50: Estimatesof Net Migration and Natural Increase for Each Standard Metropolitan Area ahd State Economic ,Area (Oxford, Ohio: Scripps Foundation forResearch in Popylation Problems, and Chicago: University of Chicago,Population Research and Training Center, Studies in Population Distribution Number 12, 1957), pp. 45-47.
4. U.S. Department of Commerce. Bureau of the Census. Current Population Reports. Series P-23, No. 7, 1962, and Series P-25, No. 461, 1971.
5. Idem, Current Population Reports, Series P-25, No. 599 and Series P-26, Nos. 95, 98, 99, 107, 116, 135, 136, and 137, 1975.
6. Bogue, o£. clt., pp. 3-9.
53
PATTERNS OF POPULATION REDISTRIBUTION IN NON-METROPOLITAN NEW YORK AND NEW ENGLAND. 1950-1975Richard F. Lcuub
State University College, Geneseo
Recent migration data for New York and New England reveal a substantial net-outflow from metropolitan areas coupled with a net-inflow to non-metropolitan counties. In this respect the northeast mirrors a national phenomenon of the 1970's: the population revival of ruralAmerica. Of particular interest to the geographer is the patterning or fabric of change taking place within the newly reviving rural territory.In this paper, which uses non-metropolitan counties of New York and New England as units of analysis, it is suggested that a new paradigm or model of the pattern of change is needed to fit the emerging trends of the 1970's. ! ,
t-iEvidence from previous, decades suggests that two fundamental patterns had prevailed within rural regions in the past. The first caij be termed populel^ion centralization4 or-the’-relative'growth of" larger non-metropolitan centers >in contrast to stagnation and decline of the more rural territory. The larger centers were able to attract industry due to agglomeration eco'nomids While the rural’territory suffered by virtue of loss of jobs in agriculture and other primary job sectors. A second pattern was population spillover from metropolitan areas manifested in ever widening zones of ‘commuting and pppulatiOn .growth surrounding urban areas. Thus, an accountings of* jfarm population decline together with an understanding of in(iustLial location trends explained the fabric of change within the more renpvedjrural regions, while examination of expanding commuter sheds describe'd'waves of growth surrounding major urban centers. (1)
The conclusion drawn from more recent data, however, is ,that neither of the foregoing patterns describes population reversal in rural America, for much of the recent growth has accrued to the most rural, least urbanized, of non-metropolitan counties. Moreover, this growth cannot be explained by metropolitan spillover.(2) Some authors suggest, however, that such recent population redistribution patterns cap l?e explained by con- siderihg the residential preferences of an increasingly footloose population. (3) Thus, desirable living locations, rather than change in theprimary or secondary job sectors, become the key to understanding migration patterns. Since residential preference surveys have revealed that rur'al rather than urban environments are more desirable; and it can be assumed that natural amenities and recreational -opportunities are sought, it then follows that the more rural, more sc6nic, resort/recreation oriented counties' should display higher rates of population growth than their more urbanised, featureless, counterparts*. (4) *
f
In order to examine this conclusion, all 1960 nonrSMSA counties in-New England and New York .State are analyzed. Net-migrai;ion estimates expressed as annual percentage rates, and available from census sources, are' treated as dependent variables. Simple correlations between migration rates an.d a series of independent variables, begins to document the nature of change within the region. (Table 1)
Consider first the factor*of metropolitan spillover, measured by both distance to nearest metropolis and percent commuting to nearest metropolis. Correlations with both variables clearly indicate a significant metropolitan influence in the 1950*s and- 1960*s, but in the 1970*s the
54
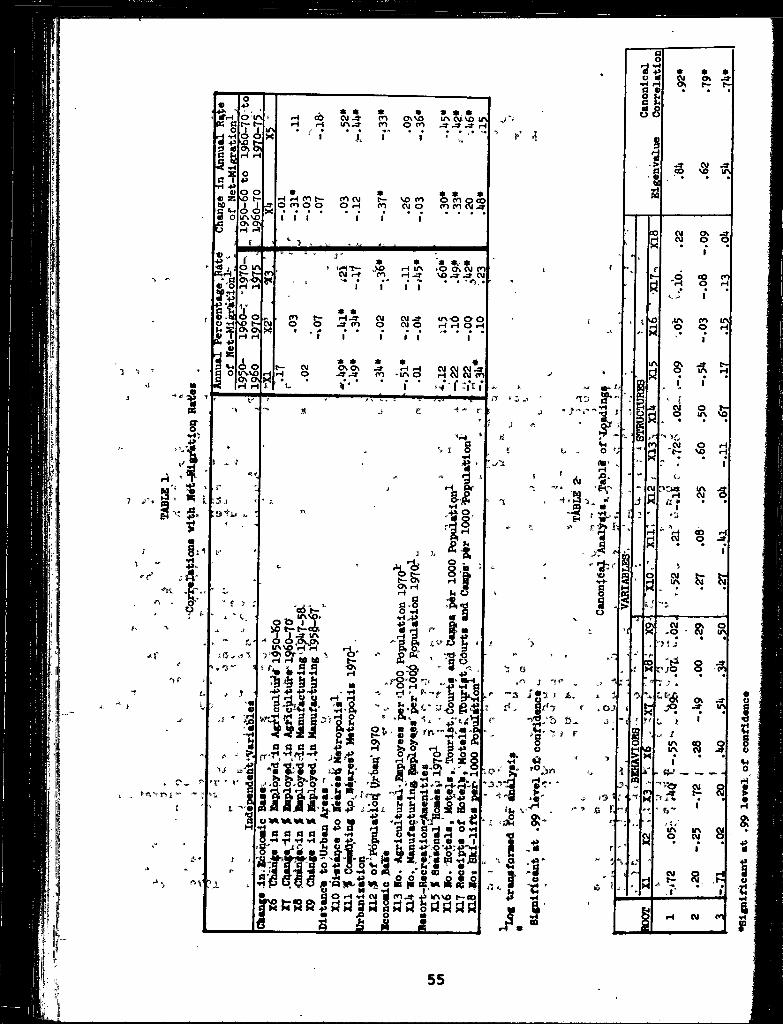
i
4 I p Pc « -O -H^ s
£ p
iSo
4 ^ -I
<s
I
H
s ‘ •| > ^ 5 .
3 * ^
I "
r• _
01
t
^ v :^i
CO
KI .o o
=fp0)
« ss tog
opo o <o t -
Io oITNVDo \ “
O ' U N
f2
o in ^ - * o \1 cn
h - CVJ0 > X
^ Ouvvoo \ o>
^ J
■ t i
i S -r ■
••3- H
J t v P
11. ■'■'¥*9s
1-4 C O n i 3 -nC O
»O n V D
iH fH m - ^ C O 0 C O
‘ r * k r r
. H m h - o cn o or r r
m CM O H
«t—C O
r
V D C O CM O
S Q __CO CO CM -sr
C Oo t ^o
CMo
CM #-r
m «iH
C O
« «OvOv
C O
CMO
«
C O
I ir\ I I I
CM -a* CM O
miH H 'US OI'
51 •» 0 O v CM C O CM
m o O O i-t H O H
38iM f
«C M - ^ C M C O
c6_ . mso>O tD I I ^ t-b-c6fc T I -;»• mo o,Ovj?v') Or H H to to‘ k -H 5^ S a
-P P P -P
o o^%-i ^
> I J Ia d a d,r«rt
d ^ § O *r4 • H ^ P d
dI o
H |f >
:|§'f s8
I j *C -<?\
. r g ' O
»4 U
|S" f5J O
, :'d' ^g « .
P T * P~ U I
'>' -o 6 ’ll• H H Ou
o
C7V
. -a 0-0 o * ■« rlr* r:J rj ■ gJ
II.Si
g i S i « ( — • f n x•fi.» 4? jiSO M
p d p B
8 d d d d a «H•H <H <H <H ,0 • p,G u l f ' S & | „
- a » H 3 •** J! o o « -•I
■ Sia■ S^n
I I .Pi a 9.0\ a « H W , M „ w .» ® P r4- H 1
l i l i e s -85 g-a;?
d < H d • ••H d <H a • • Is i f i f s a- — ♦ O I D • Op o o a o # wg o M 5 ■ « >1
tOMD f M
o ' M ’ r o» ^P 3 | a l 3 a l 3 S 5 3S _ _ S - &
4
it f i j
fe'c
-O,
. X
L
?
—f «.
O
6i. 9m •
f ^I:
.
'•3:;•OT*-
§so
1 €$
I •> f &.- g r ' - J s
' b ' ^ # *" o o
40J
a .p Cl ■r
0 *' SL-
* 5 '
•d
8 5 -
t-3» e r.
' " aI!I "'* 1 A 5
«J P0 m•H iH1g g
•rM
5?
O .H «
• • •CM O nO n t - C -
• •
C DCM «d>NO m
0 CM H CM
c ^0M
r
rC O C O0 Hr
^ * m C O m0 H
r
3 ?
-d'ma1 H
« I 1 1
^ CM 0 ! -
d .m N O
‘SC O .CM 0 HH > - V O I-X ^ •1. 1CM t o s t
rt atmCM• •
A ^c3
CMl A
C OO
{;r ^
a
R r/o
iImm
_
.-t
C M
a
8O N
om
C O
in
C O O CM ^
fii
mCM
8
CM m
5 5
"Sicnificaat at .99 laval of confldanca

Total Saapl*
X950-196O

The-results of the ahalysie ere presented in Table 2, which shows that three toots wdre abstracted, the first and third loading he'avily on 195Q'-.6Q migration rates, and the second loading heavily on 1970-75 rates.A brief interpretation i~s that two underlying patterns of change character ized-the 1950's, the 1960*s represented a transition period, and a new pattern emerged in the 1970's. A short summary of root loadings and their meanings follows:
(11 Root 1 is a decline in agricultural employment factor in the 50's, distinguishing between declining agricultural counties located relatively distant from metropolitan centers, and more viable non-agricultural counties.
(.2) Root 2 is the growth pattern of the 1970's distinguishing between less viable agricultural or manufacturing counties, low in amenities (specifically seasonal homes), and rapid growth areas rich in amenities with high employment in the tertiary sector.
C3) Root 3 distinguishes between declining counties in the 50's characterized by high employment in manufacturing located distant from metropolitan areas, and more viable counties in the 50's located close to metro areas. The more distant counties declined despite modest gains in manufacturing jobs.
As in factor analysis, factor scores can be obtained and mapped from the canonical correlation results. They demonstrate that counties loading negative and high on Root 2, the rapid growth counties of the 70's, relatively rich in amenities, are found in three primary locations: (1) the New England seaboard from Maine to Massachusetts, (2) the White Mountain region of New Hampshire, and (3) the Catskill Mountain region of lower New York State. It is precisely such areas, rich in natural attractions, not close enought to metropolitan regions to be engulfed by the urban environment yet not so remote as to be isolated, that epitomize the emergent pattern of growth in the 1970's.
In conclusion, although this analysis is not specifically oriented to policy issues, it does suggest that from the standpoint of economic planning, creating or maintaining a pleasing residential environment may be one key to enhancing long term viability of traditionally stagnant rural areas.
REFERENCES CITED1. Richard Lamb, Metropolitan Impacts on Rural America, University of
Chicago, Department of Geography Research Paper No. 162 (Chicago: University of Chicago Press, 1975), pp. 185-188.
2. Peter A. Morrison and Judith P. Wheeler, "Rural Renaissance in America Population Bulletin 31 (1976), pp. 1-27.
3. Wilbur Zelinsky, "Nonmetropolitan Pennsylvania: A Demographic Revolution in the Making?," Earth and Mineral Sciences 5 (1975), pp._l-4.
4. J. Zuiches and G. Fuguitt, "Residential Preferences: Implicationsfor Population Redistribution in Non-metropolitan Areas," Commission on Population Growth and the American Future, Volume 5, Population Distribution' and Policy, Part V, Chapter 2 (Washington, D.C.: U.S.Government Printing Office).

5. Brian >T..L. Berry, Essay on Commodity Flows and the Spatial Structure ■ of-the Indian Economy, University of Chicago? Department ot-Geography Research Paper No. Ill (Chicag o:, University of Chicago Press, 1966).
59
ZONES OF LARGE’ S’CALE LENGTH’Barbara H, Stanton’
'ffeu Jprfc- City, New yhrk
Xt has become generally recognized only within the laist twenty years that we opferate within definite limits of personal and social^distance, whidh influence our feelings and reactions. (1) The_, four distance zones identified to date— intimate, personal, social-consultive, and public— have measurable Boundaries, which vary according to culture, but which are present' in'-all cultures, and which constrain bur "behavior.(2) There are indications that, at-a. iarger scale, thepe are additional zonesj as yeb not generally^recognized; which also have definite jneasurabl'e boundaries, and-which also affect our-feelings and, reactions. ’Just as Hall',s ^ones constitute-*the^conceptual framework of proxemics, so it is "possible-that greater study'*6f'these large scale zones of lengths, areas, “gnd-networks may yield a ffamwork'-of 'use to -human -geographers aS weli as' sociologists, architects,, and planners. C3)
.. In- this 'pa er'’‘tRere is room only to describe briefly pne pogsible set of large.scale zones: those of length. We can get’some idea of theeffects of these zones of length, and of the measurements determining them, from observations of seemingly unrelated aspects'ot'behavior and perception. The evidence comes from highly pragmatic -standards for the design of shopping centers, from a sociological field study concerning (among other things) the extent-of casual neighboring, and particularly from cpmjnonly acbepted descriptions of-city streets.
The'”purpose of shdpfsirig center design is to. foster impulse buying. (4) '.Everything.’is made 'as inviting* and easy as possible for the consumer.Rather rigid-design-criteria and leasing provisions to further this end 'Ijave been-developed Pn the basis of experience. For instancer
"The walking distance, between-a car parked at the outer fringb of the parking 'area' and the shops should be 400 feet raaximxm. Try to limit the depth of parking (to) between 300 and 350 feet from the store group."(5)
Or - again;."Care must Be-taken to' avoid lengthening the’ strip (of stores) Beyond a-distance' that people walk comfbrtabiy. Abo'ut 400' is usual, t.hough there are examples of- successful strip centers' of 750 feet and longer."(6)
As'a corollary, a sample'contract for a store occupying space-within- a, large 'shopping center .has a clause stipulating- that, the management of the center shall not le'ase Space within a distance of 750* to another-'store selling similar merchandise. (7) Presumably this i-s to f>rotect ■the 'tirst store owner from the sort of comparison shopping and direct competition J.ikely wKere^r stores -are .clfise eno'ugh -together for' customers to move freely ..back andt forth between*'one and-the-bgher.
These design .crit^riai-ylbifl'two-defirfi'te measurements. One*Is 400', .within which movement aeemSr'.to' taTcb place; easily, and essentifrlly^-without thought. The 'other is 750-' or-a little mbre> beyond which there-is’a
idistincrt sense of distance covered, of separation, and, presumably, a inoticeable decrease in actual competition. The usual explanations^for ^these limits are that, "ladies carrying packages won't walk further than 400'.," and, "people just aren't willing to walk further than 750'."(8)3ut it is hard to suppose that it is the act of walking itself, even when iburdened .with parcels, which becomes suddenly tiring at either distance. Rather, the very definiteness of the measurements, and the widespread recognition of the changes of behavior they mark, indicate that 400' and about 750' stand, in our culture, as ends of zones: that they are definiteboudaries of the sort we are more accustomed to recognize in much shorter personal distances.
This interpretation is supported by observations made by Herbert Cans in a sociological study of a new Levittown, later named Willingboro, in New Jersey. Cans identified lengths along streets which he called "sub-dplocks." These lengths were ten to twelve houses in extent (650' - 500' in that development) and represented the distance within which casual daily neighboring occurred.(9) Obviously there are many other physical and social factors vdiich have an effect on casual neighboring.(10) But
the fact of such a definite outside physical limit, existing without xespect to the number of people in the casual neighboring set, suggests *that these "sub—blocks" are another indication of an underlying perceptual organization with an upper zone boundary in the 700'-800' range.
Probably the best evidence for such zones of length, and for i:he P®^ticular distinctions and distances which mark each zone, can be found in our commonplace descriptions of city streets or blocks. In Manhattan, the crosstown blocks of the Upper East Side, between Fifth Avenue, Madison, Park, Lexington, and Third Avenue (which range in length from 400'-424') are generally taken to be short blocks. On the other hand, the crosstown blocks of the West Side (which range upwards of 760' except where Broadway “Slices them in two) are felt to be noticeably long. This formulation not only accords with the limits found in shopping center design and casual ^®i9hboring, but points to an additional zone of length subdividing the distance between 400' and 750'. For, if even 424' makes a noticeably short block, while a length in excess of 750' constitues a noticeably long one, 'then at some point -between must lie blocks of a normal range of length: ones which -axe simply blocks, not especially noticeable for their length
One of the characteristics of short blocks, discussed by Jacobs, as that, as we walk along them, we can think of combining them to form chains (Jacob's "personal neighborhoods") and networks.(11) In other words, it is easy to imagine joining actual streets only 400' or a little more in length with other short streets to make longer entities. By comparison, blocks even 700' long— 'well within the normal range— seem congilete, and even isolated by their own length. We cannot really imagine these longer streets linking together with each other. While they form a grid on a map, this is a ’paper network only. On the ground, they seem too long to combine. K^erefore, the outside zone limit for a short street can be defined as *the P®iht at which a street no longer can be imagined combining with another street as we walk along it. By implication, both Jacobs and Speer fix 'this ;point at about 500'. (12)
'Thus, 'tentative limits for zones of large scale length would be as shown in Chart 1. These limits start at 10', where social-consultive space ends, for this suggested set of zones is, in many ways, only a further definitton of Hall’s zone of public space. It too is an attempt to descr-ibe and delimit scmie individual perceptions, feelings and reactions as these are triggered by an essentially public landscape.
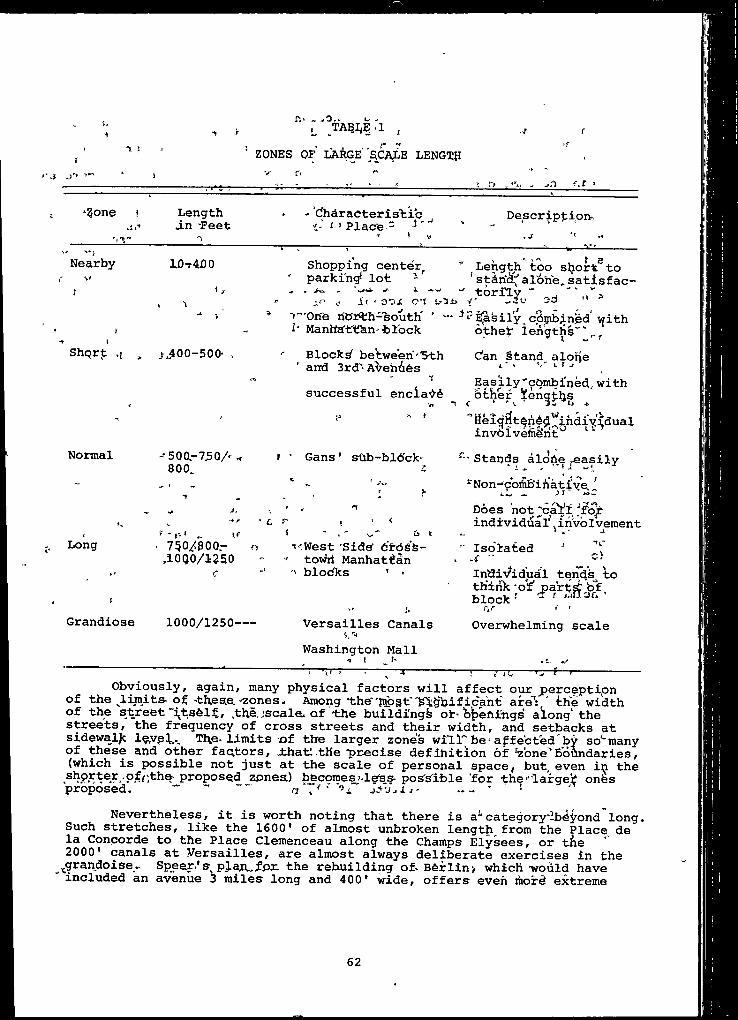
.. I- i
n< - .0.. o ._TA§L|.l , ./ f
fj I ZONES of’ l a r g e 'scale length1 V ^
r. n '*.1 , f.c '^?one f Length
jLn -Feet • ' C^dracterisbic t- • ’ Place " ( ¥
Description.f-J ^
V' ■»-)Nearby
rI
I0t4jD0
1 1
Shopping center , *' Length'too s^ort’to ' parking lot - ' stdh&'alone,, satisfac- . . jk. . '-.i j i 'tori'ly “ . " “ ,,''3
i'- it < OOX C l Si-li* i' -a*-' 00
}** t'-'Orie ntfr'th-'south' ' ■■■
i' Manha'tren--block - Easily cbjnb -ned' ii ith bthef len^thl” ^
Shqrt ,{ ^ jJOO-500- , Blocks betweeh-5th and 3rd"* AVehies Can stand alone1'» \ - i, j
.-I. - 1successful encia^>^<n
Easlly'cbmbi'neti, with other iengtljs
• 1 ■> ■J "’HeigrftenAd ihdi'vt'idualinvolvement''^
Normal ■^500-750/*800._ t ’ Gans * sUb-bldck-c *"*' Stands albpe ,.easily
Long
i.
T■+ rA.
" t’k IP. 750^800- ,1000/1250
f
; ^» , n■ £. f‘ , ' <
n t'-West 'Side d'fdd'e- towil Manhatfan
' blocTcs ’ ■
'Non-'c’ortib'ihatiVe '1.1 _ 1 ■ *Does not y:Slt *fof individual’ .involvement
’■ Iso'lated '. " 0,
Indii^idual tends^ to th'ink 'ot parts: bf block-' fr.t- f '
Grandiose 1000/1250— - Versailles Canals Overwhelming scaleWashington MallI f'------- ;— 'rn---:---- 1----- - i... ^
— I-- TTt-- rr-1 t---------Obviously, again, many physical factors will affect our jperceptipn
of the limits, of ’these.-zones, Among t h e ' l e a n t " are" ,' the width of the street "it,self, ^the jscale. of the bulldi'ngs or-b|)ehrngs" along' the streets, the frequency of cross streets and their width, and setbacks at sidewalk Iqyel,. The> limits nf the larger zones will'' be* affected by so*”many of these and other factors, Jthatl.the'precise definition of ‘zone’Boundaries, (which is possible not just at the scale of personal space, but even in the ,® P. ter -pf/ the- proposed zones) becomes )-lefSs- pos's'ible for the-larget ones proposed. “ ~ a \ !
Nevertheless, it is worth noting that there is a^-category'lb^i^ond'long. Such stretches, like the 1600* of almost unbroken length from the Place de la Conporde to the Place Clemenceau along the Champs Elysees, or tfie 2000* canals at Versailles, are almost always deliberate exercises in the . grandoise.. Speep.'s pj.aiulpr. the rebuilding of-Berlin> which ■would have included an avenue 3 miles long and 400* wide, offers even ihof extreme
62
examples.(131 The effect of such designs is to make eyen individuals in a huge crowd feel at once isolated and insignificant. Any parent who, taking a child to visit our nation's capital, has faced the prospect of walking the (merely) 1000' ‘sttetches along or near the Washington Mall, can attest that even these lengths can be extremely daunting--far more so than the s ame distance interrupted by cross streets.
The .importance of these zjcnes lies in what they x:an tell us of the effect' of landscapes that we Jcnov only from maps,-Tand of plans before we build them. We know that violation of the zones of pur j>ersoDal_space evoke immediate awareness* on ouf p'art, arid frequently involuntary compen- satoyy behavior. (14) The situation, itself intrude^' dn- our thoughtd^'to the ^xpiusiM, of,'most else, at least temporarily. It seems that the case is similar for'zones of large'scale length. Lengths between 400' and 500', because they are noticeably short, call for a conpensatory response. These are the lengths which suppprt -successful street enclaves, those blocks or culs-^e-sac where* so many inhabitants are members of the block assogiation that any non-member is noticed and felt not to be pulling full weigjjtg Between 500' and 75jD'/800' lie those lerigths "that we do'hot "have to notice, which we can ta ;,e for granted without taking special thought.A landscape whiph offers these lengths is like an office which maintains domfortable social-consultive distances. In each environment we can turn our attention to our own concerns and get on with our work. All the other zpnes will.j,^b^c^use of their limits, demand more of our attention on certain dccasions.
It .is _ inherently no more surprising that we should have Unfits almost equally definite and measurable for the larger lengths within which we function as .wall as the shorter ones, and that these limits which define our reactions indicate not just the size but something of the nature of our territpries. Man is, at least in some ways, a territorial animal, and we defgnd what we consider to be our proper space at lengths greater than room scale. (15) When, as is all too common, the inhabited landscape offers only lengths tpo short, whiph we are*unable to combine with other lengths (or areas too small, cut off from*other areas), then we feel, however dimly, cramped and threatened. When, on the other hand, our physical environment reflects the grandiose dr'eams of others, as at Versailles, we feel overwhelmed by 'a disproportionate scale. Our quick awareness of such feelings is an indication of the importance to us of zones of large scale length.
REFERENCES CITED1. Edward T. Hall, The Hidden Dimension (Garden City, N.Y.: Doubleday
and* Company, Inc.", 1966), pp. 126-127.t
'2. Robert Somme.r-, Personal Space; *The BehavioYaT'BksTs' df'DeCsign (Englewood Cliffs, N^.; PrenticerHall Inc., 1969)'/ Chapter 3.
3. Barbara H.. Stan-^on, "What -Is A District?,"’ pappt presented a*£ the American Institute of Planners Confer-Jn *73. '
>■ - r ^
.4. J. Ross ..McKeever, ed- , The CommuriiW Builders Haridbook (Washington,D.C.:‘ Urban Larid Institute, 1968) , p. 313. ^
5. Ibid., p. 344.6. Ibid., p. 321.7. American .Law Institute—American Bar Association, l971> Sample'shopping center-lease.
63
8, McKeeyer, e(3., o^. cit., p. 321.9. Herbert J. Cans, The Levittovmers tChicago; Gelncoe Press, 1970).
10. Terence Lee, "Urban Neighborhood as a Socio-Spacial Schema," reprinted in Harold M. Proshansby, William H. Ittelson, and Leanne G. Rivlin, Environmental Psychology; Man and His Physical Setting (New York: Holt, Rinehart and Winston, Inc., 1970), pp. 349-370.
11. Jane Jacobs, The Death and Life of Great American Cities (New York: Random House, Inc., 1961), Chapter on Short Streets.
12. Albert Speer, Inside the Third Reich (New York: Macmillan. 1970).p. 530.13. Ibid., p. 76.14. > Sommer, 0£. cit., p. 78.15. Oscar Newman, Defensible Spade (New York: Macmillan, 1972).
64
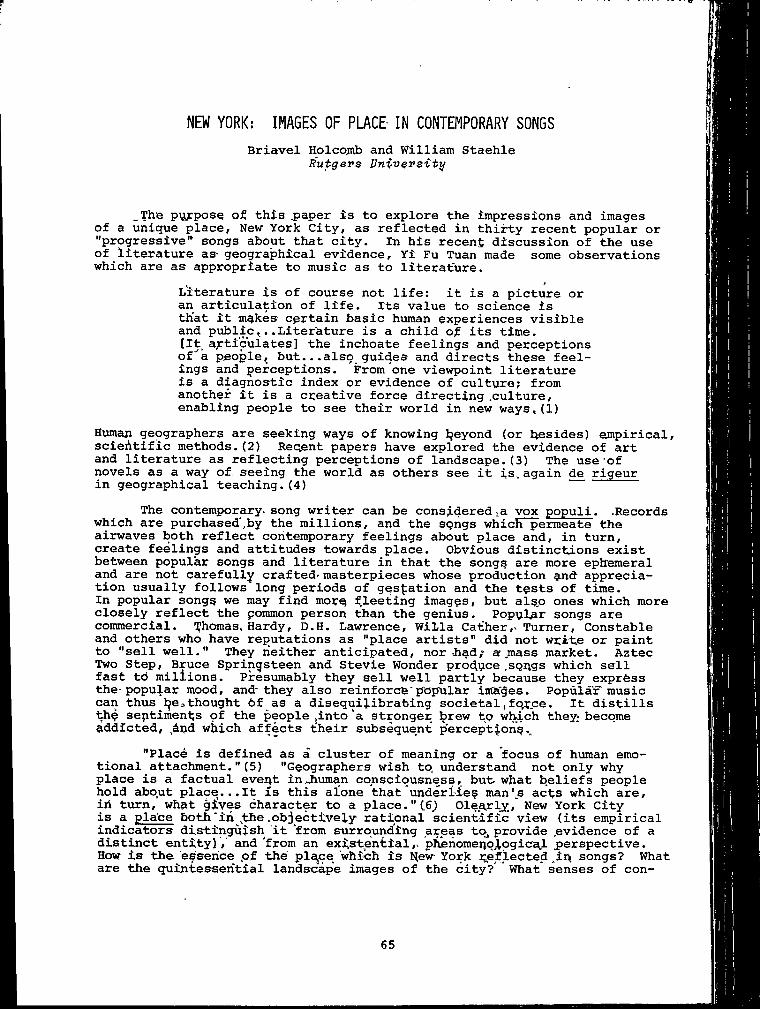
NEW YORK: IMAGES OF PLACE- IN CONTEMPORARY SONGSBriavel Holcomb and William Staehle
Rutgers Univ^raitg
_The piirposa of this .paper is to explore the impressions and images of a unique place, New York City, as reflected in thirty recent popular or "progressive" songs about that city. In his recent discussion of the use of literature as- geographical evidence, Yi Fu Tuan made some observations which are as appropriate to music as to literature.
Literature is of course not life: it is a picture oran articulation of life. Its value to science is that it m^kes certain basic human experiences visible and public,..Literature is a child of its time.[It_ articulates] the inchoate feelings and perceptions of^k people^ but...also guides and directs these feelings and perceptions. From one viewpoint literature is a diagnostic index or evidence of culture; from another it is a creative force directing .culture, enabling people to see their world in new ways,(l)
Human geographers are seeking ways of knowing beyond (or besides) empirical, scientific methods.(2) Recjent papers have explored the evidence of art and literature as reflecting perceptions of landscape.(3) The use'of novels as a way of, seeing the world as others see it is, again de rigeur in geographical teaching.(4)
The contemporary- song writer can be considered-a vox populi. -Records which are purchased,by the millions, and the soiigs which permeate the airwaves both reflect contemporary feelings about place and, in turn, create feelings and attitudes towards place. Obvious distinctions exist between popular songs and literature in that the song^ are more ephemeral and are not carefully crafted- masterpieces whose production end appreciation usually follows long periods of gestation and the tests of time.In popular songg we may find morb fleeting images, but also ones which more closely reflect the common person than the genius. Popyler songs are commercial. Thomas, Hardy, D.H. Lawrence, WiLla Gather,- Turner, Constable and others who have reputations as "place artists" did not wcite or paint to "sell well." They neither anticipated, nor iiad,- ar mass market. Aztec Two Step, Bruce Springsteen and Stevie Wonder produce .sgr gs which sell fast to millions. Presumably they sell well partly because they express the-popular mood, and-they also reinforce" Efop'uiar im'ages. Popular music can thus be,thought of as a disequilibrabing societal(fo.uce. It distills thg septimenbs of the people ,into 'a stronger tg which they; becomeaddicted, dud which affects their subsequent perceptions.,
"Place is defined as a cluster of meaning or a focus of hviman emotional attachment."(5) "Geographers wish to. understand not only why place is a factual eveut in,human consciousness, but- what beliefs people hold about place...It is this alone that underlief man's acbs which are, iii turn, whkt gives character to a place. "C6J Oleatly, New York city is a place both'iii,the.objectively rational scientific view (its empirical indicators distinguish it ‘from surrounding areas to, provide .evidence of a distinct entity) ,' and 'from an existential,, p^iiomenglogica.l perspective.How is the essence pf the pl^ce which is Wew York ;;eflected in songs? What are the quintessential landscape images of the city? * What senses of con-
65

tinuity, attachments, belonging and rootedness in New York are conveyed in popular songs? What qualities ^oes the essence of the place which is New York have?
* * 5 TABLE 1RECENT SONGS ABOUT NEW YORK CITY
# Title Performer
1 Midtown Rush2 Goin! to >New York3 Living for the ‘City4 Manhattan Skyline5 New York ‘Skyline6 Excerpt ‘frOm Living for iiie City7 Stranger in the City8 Pictures of a City9 People of the City10 Nev York City/Home11 New York City You're a Woman12 N6w York, New York13 New York.14 59th’ Street Bridge Song15 Sew -York« Rhythm16 On Broadway17 New York City■18 ‘New York City Blues19 New Y<5rk State of Mind.20 Seventeenth Street21 iJptowri2.2 LullabVe on New York23 talkin' Big AfSple *'7524 DcSes'this'Bus Sto^-at 82nd Street?-25 Itrs hard tb be a Saint in the City 26- Aitterican City Shite 27".- Living 'fof the City28 Talkin' New Yor'k29 In NeW York A^in30 innfer City Blued
Tom Scott & The New York Connection Climax Blues Band Stevie Wonder John Miles_Ga'rland* Jeffreys SteV ie Wonder John Miles King' Crimson Cashman and West J-.F. Murphy and Salt A1 KpperBack* Street Crawler Dreams'Simon and Garfunkle Barry Man!low Eric' Carmen Gil Scott-Heron Cashman an& West^MArk Aimond‘Bank'Gel 'Scott-Heron Loudon Wainwright III Aztec two Step Loudon Wainwright III Bruce^ Springsteen feruce* Springsteen 6ashman and West Stevie Wonder Bob Dylan John'‘ShineSirover'Washington, Jr.
■ \
* Z' 5—:—- * In listening to,'’and reading, the ttandcriptiohs‘of the thirty songs <refefbnced in this paper by the numbers 'shown on the table) f>erhapsthe strongest"fedutrihg theme is the*afeigui€y of attrabtion and repulsion which is felt for New York City. There is a thirsting, longing for the icity:
I 'aihit gonna- rest'tlll I get to llew YqrC. j. _ ,"I Baid I'W-'gdfn^ *to New ^ork. 't'lft qoin' it'I have to walk. (2) 'Yet'I'in drawn‘to you "like a Aoth to^a flame (,11).But the' NeV Ybfk "skyline,' ft’s calling me liortd tonight. (5)I'm taking a Greyhound-'6n the ‘Hudson River Line I'm in' a"*-NeW* York ^ate' of-mincT, 0.9) ^I -don''t know why, put I wish I was In New ‘again. (29)
66

The city also inspires intense-tbpophilia;New York. City, I don' t know wh^/ -J love you.Maybe it's because you'te’anine. C17)I think of her [New; York] , I think of lifers own music, (j?6)
In some cases the topophilic tendencies are so strong’that New York becomes anthropomorphized. New York is a woman, a. destriictive hard bitch; one who entices and tortures but who you can't leave; “ -
Female, feline, feminine, she*'s been making my‘world so bright. (5)New York City won't you breathe on me.Won't you take me in your arms? (10) 'New York City you're a woman.Cold liearted bitch ought to be your name.Well you ain't never loved nobody.Yet I'm drawn to you like a moth to a"flame.I have sup of you in my sorrow, *And I have sinned with you in my shame.But you ain't,never even seen me. New York City,I'm. trying to beat your game.(11)New York City, I don't know why I loye you.Maybe you remind me of myself. (17)f When she was good, it-was oh, so good.You were blessed if she smiled on you.You could be a king if she believed your story.When it was over she laughed at you.(26)
jfNew York's lovers suffer, however, from no illusions. Virtually
every song described the hardness, cruelty, bitterness and depressing nature of New York's environment:
Buildings tower around, me like they're waiting for the kill.(7) Concrete cold face cased in steel.Stark sharp glass-eyed-crack and peel.Bright light scream beam brake and squeal.Red white green white neon wheel.(8)Roaches in the woodwork.The madmen on the run.(12)I'm getting sick of the slums, I'm tired of dodging the bums,Ahd the freaks are freaking me out.(21)This place is cruel, nowherd could be much colder.If we don't change, the world will soon be over.(27)
Despite these stark assessments of the city, the attraction is still there. New York is loved, warts and all! The conclusion of Loudon Wainwright's "Talkin' Big Apple "75" epitomises the attitude:
Sure I know New York is dirty and ugly and fulla cockroaches and gonorrhea and rats and junkies, hookers, rude‘ cab drivers, bad air and bad vibes and unemployment and they don't pick up the garbage. Ah, but its not boring. (23)The absence of ennui is perhaps one-of the main attractions of the
city. Several songs celebrate the feast of stimulation and activities in the'City;
In the funky dives, on the -old West Side- There'-S- always^ something going down. (15)They say- tfrere's always magic in the air. (16)
67

The sounds of the city ,trsn§pqr|; ,yop. around .thp sun.The music of every nation helps make the island one.(171 If you're lookin' for excitemept,You need only look next-|3ppr. (2d)
/^jWplljief's gOf fly a kite,'in Central-Park Go and see a Shakespeare play.,,Have a lot.jOf fun., at Planetari'um ,j And museum adl thq,hlues awpy. , ^Well Rockefe'eler Center, ^nd tde U.N._ too_-.Baby, don't make me wait.I want, to elevate up and down- wi,th youIn' the building of the ^Empire State ..(211 -tWell you can dance at p|ie himelighp, any tipift'pfter nidnight.If you dress up like Marcel Marceau,(22)They got skyscrapers., subway's and a sea of'humanity:Museums, libraries, culture galorp.They got cable T.V.— How could, yop ask for more?And if reality is your cup’ of iqat .They got 42nd street.(23)
Whatever else New York is, it is neither peaceful,- nor dull.Relph, in a compelling discussion of place and placelessness, writes
that "The spirit of a place^lies,in its-landscape."(7) As reflected in popular songs, this does not seem true for New York. Although elements, of New York's landscape are mentioned with some* frequency (skyscrapers, neon, subways, garbage cans) and the overall landscape is encapsulated as a "concrete island" or a "concrete jungle," it is, rather, people and their activities which epitomize, the spirit of the,place. People, in the songs of New York, are .both perpetrators of pain and-fellow sufferers. They, like New York, are replete with antithetipal, qualities. They are Cruel and unfeeling:
People walk right over me, now they don't give a damn.(7)And you won't hear the sounds of laughter,.City people rarely smile.(9)Yes, I live my life with,strangers.And the danger's always there.(15)But if you value your life •Carry a gun and a knife..and,a fork,(22)A junkie steals, a beggar deals,, knows what's ccJmin' next. (26)Now a very,great man once^saidThat some people rob you with a fountain pen.-It don't take too long to find outJust what he is talkin' about.(28)
But they are also loving and caring: , ,Watch them fill-the blind man's cup/ and althpugh they know he sees them, he's always gof enough .(9)Its home to both -tramp ..and a rtist And (ireamers from everywhere,.But most of all ki'nd hearted’ people Whose stories ain't on the air. (17)The psychopathology of urban life is exemplified in these songs. They
sing, though not in Milgram's words, of alienation, anomie, overload and stress. But they also sing o,:f tolerancp:Well you can do -what you want
68

No, its not like Vermont, in New York.(22) and survival:
I'm lost, I'm found. I'm up, I'm down.But somehow I survive.It's got to be the New York City rhythm in my life. (15)
and even hope:Apartments full of hope and second tries.(10)And Mary Lou, she found out how to cope:She rides to heaven on a gyroscope.The Daily News asks her for the dope.She says, "Man, the dope's that there's still hope."(24)Recent punditry concerning the death of New York inspires denial:Like to many others, I found it all too easy To stand off at a distance and criticize.But there ain't nothin' wrong with the city.Just some people been wrong there like everywhere else.(17)And the papers they love to say It's the meanest town in the U.S.A.But I think it's okay. (18)Well, the mayor is a mayor called the Mayor Abe Beame And they dreamed up this here Big MAC scheme.Well that big scheme kinda petered out And President Ford had to bail them out.I don't think his heart was in it though... .Meet a whole lot of people out there that'put’New York down.Course, half them people ain't never been there.So some of that criticism just ain't fair.(23)
Even mourning New York is not unmixed with a glimmer of hope:I never felt so lonely and so helpless.I'm wishing that I didn't know the truth.But they tell me that my friend is dying.Oh, New York City, can you say it ain't true?Can you tell me now before I'm leavin' you?I'd give everything I own just to believe in you...again.(26)"Literature mirrors the ambiguity, ambivalence, irony, paradox, and
misunderstanding that frequently plague real life." (8) These qualities are reflected in the contemporary songs about New York. For one ignorant of, or even unsympathetic to this music, listening to it can evoke images, insights and understanding of the place. New York, New York, it's a helluva town!
REFERENCES CITED1. Yi Fu Tuan, "Literature, Experience and Environmental Knowing,"
chapter XXIII of Environmental Knowing, Gary Moore and Reginald Golledge, Eds. (Stroudburg, Pa: Dowden, Hutchinson and Ross, 1976),p. 260.
2. Nicholas J. Entrikin, "Contemporary Humanism in Geography," Annals of the Association of American Geographers 66 (December, 197ST~,pp. 487-515.
69
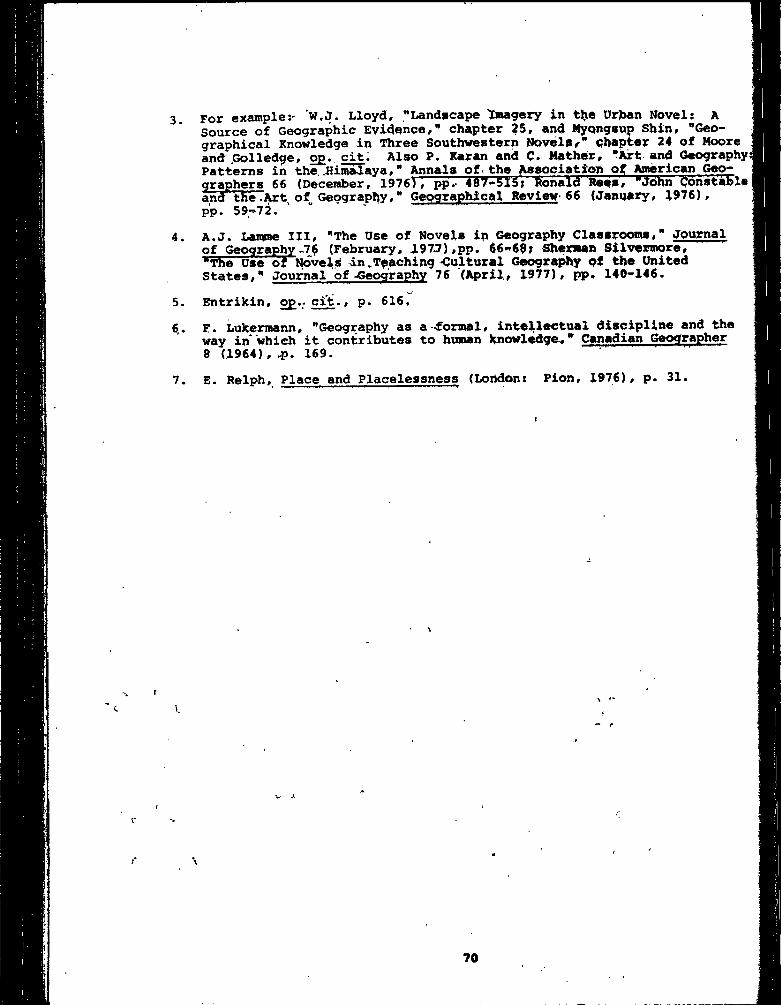
3 For example:- w.J. Lloyd, "Landscape imagery in tl)ie Orjaan Novel: ASource of Geographic Evidence," chapter 25, and Mypngsup Shin, "Geographical Knowledge in Three Southwestern NovelSr" chapter 24 of Moore and Golledge, o£. cit; Also P. Karan and C. Mather, "tet and Geography Patterns in the, .Himalaya, * ^nals of_the Aegociation of M^rican Geo- graphers 66 (December, 1976), pp^ 487-515; Honald Rees, "John Constable and the .^t, of Geography#" Geographical Review- 66 (Jamiary, 1976), pp. 59t72.
4. A,J. Laimae III, "The Use of Novels ip Geography Classrooms," Journal of Geography-76 (February, I97J) ,pp. 66>’68; Sherman Silvermpre,"The Use ofNoveljS in.Teaching Cultural Geography 9t the United States," Journal of -Geography 76 (April, 1977), pp, 140-146.
5. Bntrikin, op., ci't., p. 616.6. F. Lukermann, "Geography as a -formal, intellectual discipline and the
way in which it contributes to human knowl^ge," Canadian Geographer 8 (1964), -p. 169.
7. E. Relph. Place and Placelessness (Loridon: Pion, 1976), p. 31.
s
70

SHIFTING LOWER MANHATTAN GHETTOESEdward Bergman
City University of New York, Lehman College
On Segtember 29, 1976, in "the ‘coiranunity hall of St. Patrick's Church in Lower-Manhattan, M.B. Lee, representing the Chinatown Improvement Counc^;!, and Y.T. Huang, of the Chinese Chamb'er of Commerce, quarrdied bitterly with John Zuccotti and Victor Marrero of the New York City Planning Commission. At isaue was a zoning proposal designed to maintain the character and street ambience of New York's Little Italy, concentrated along
street to the North of Canal. The ordinance would encourage convenience stores and cafes and would end demolition "or changes of the facades of jieighborhood buildings. The Chinese argued that such preservation zoning was r.eactionary, becaus'e Chinatown, traditionally South of Canal Street, was already expanding oveif Canal into Little Italy. The numbers of area Ciijnese are growing rapidly, while many Italians^ are leaving Little Italy. TJle- proposed zoning would be economically disadvantageous to the Chinesp residents and'taerchants’, they argued, because it could hinder the- expansion of the Chinatown street character which attracts tourists- to Chi-nege specialty shops and restaurants.
It is ironic that this quarrel between Chinese and Italians over turf" should have taken place in an old church still dedicated to the
patron saint of Ireland. The church silently testifies that the history of many a New York neighborhood is a series of ethnic replacements. The history of this area and the expansion of Chinatown today well illustrate the kaleidoscopic nature of patterns of immigrant gfiettoes, contemporary street-scene cultural geography, and the political manifestation of cultural geography when local planning and zoning powers are at issue. (1)
Today's Saint Patrick's Church, facing Mott and backing on Mulberry just a few blocks north of Canal, was begun as the Cathedral of New York in 1809. This was^on© year -after Pope Pius VII created the Diocese of New York. The site was then at the edge of the city, surrounded by cornfields and meadows, but already by 1815, when thfe Cathedral was dedicated, the Cathedral ,stood»in the nucleus of an Irish immigrant ghetto. New York's first Bishop was John Connolly, who came over from'Dublin. In the 19th century, Roman Catholics in the United States faced bitter prejudice, and several tinves Protestant- mobs attempted to burn 'dov#n the Cathedral.Stout met of tbe. Ancient Order of Hiberiiians -successfully*'dfefeQded Mew York's Cpthedfal against such attacks in 1835 and agSin in 1844, when Roman Catholic Cathedrals in other-East'Coast icities were put to the torch.
The Catholic Irish were victims of prejudice here, but the' possibility of jQf*? pulled-them anyway. By 1845 New York City*had 70,000-Irish'-residents, about 15 per cent„of -its total population. Earning in Ireland in the late. 1840's and-early 1850's added a push factor, and in I960 New York City^was 25 per cent Irish.- About that time the "Irish had begun to think of building a. larger .Cathedral on some land earlier purchased for a cemetery far uptown, Thg.northerly growth t>f the i:ity4iad developed a 'fashionable neighbortjoqd around.,that si'tev and so -a -new 'cathedral oh Fifth Avenue between 5Qth and ,51st .Streets was-contracted in 1858. That new Saint Patrick's was dedicated as the Cathedral of New York in 1879, and old St. Pat's ,wa§ demoted fro® Qa.thedral* to parish church. The 5 7'years from 1858-7,9-f' however, .saw^vootinuing .expansion of the Irish Lower Ed st Side.In 1363 Irish Cathplics.-purchased the? First Presbyterian-ChUrch,. built in 1841 in a Scottish section neighborhood three-quarters of a mile southeast
71
of old St, Pat's, 'and re^edicated it as the Rotpan Catholic Church of St. Theresa. The Scots had beaten the Irish in moving uptown, to Fifth. Avenue and 11th Street.
Toward the. end of the 19.th century, just as many of the more successful Irish were moving uptown or oyer to Hfell's Kitchen in the West 40's, Italians began to settle near the Irish Lower East Side. By 1900 the congregation of St. Pat's.Church was dbout»one-half Italian. As late as 1909 the pr.e,sident and eleven directors 'of the Saint Patrick's Church Sopi^hy bore Irish names; the twelfth wSs .Mr. Louis De Giiftto, but hy 1914 area It’alians. pverwhelmed Xrish. Little Italy was firmly established along Mulberry and Mott with Mulberry the principal thoroughfare., Meanwhile East European Jews were pouring' into the neighborhoods to
the Fast in the 1880's gnd 1890's in such numbers as to make it the most (Jensely populated urban district in the world. By 1894 the'population reached 936 ,per acre^ In spite, of their poverty, these peopl'e "established over ,500 .synagogues, pnd religious schools, a theatre, 'and., book and newspaper publishers in the area. The number of Roman Catholic communicants at St. Theresa's dwindled. With the passage bf restrictive immigration
1920's, the tide of Jewish immigration stemmed. Jewish ^families eventually moved up the economic ladder and to better'neighborh'dods, but a concentration of Jews and of Jewish institutions remdinhd* in the Lower East Side. Also in the second half of the 19th century, Chinatown was developingto^the South of the Italians and West, of the Jews, with'Mott*Street the principal thoroughfare. The first Chinese had settled in New York in the 1840's, and although Chinese immigration was restricted by the‘Chinese Exclusion Act,of 1882., there were more than 1,000 Chinese' in'>Iew Yo'rk's Chinatown by 1887.
In the late 1960's two demographic changes combined to breach the older ethijic boundaries. One was ths continuing relative emptying-out ,of Italians- and Jews from the Lower East Side to otheh parts of the metropolitan region* Jhe, other was the' sextupling oi Chinese ’immigration to the United States as a result of the new immlgratibn laws of 1965. By the .late 196Q's some-lO,000 immigrants were coming to New York's Chinatown per year.^ The*1970.,census recorded 78,000 Chinese New YCrkers, anff there are probably^^fover 100,000 today, about one'^half of’whom live in Chihatowp.
. Chinqtovifp. cQuld not adequately housei this'inflUk'.^ In WOO th'e official R.lan -for .New York City, described, 34 per cent of'Chinatown' s hdusing’as "dilapi.dated;" Qnly one new residential building had been consttucted since ;i939, jNe\jr Residential construction hasi occurred within the triiditional borders of Chinatown since 1969, but obviously Chinatown has also had to ^expand. Exp.ansion to the North and West “has meant Spillover Into Little Italy,.-and many Italian landmarks ard already^SQrrOunded by Chiri'ese,”or are themselves .changing hands. Bicigalupo-Funeral. Home, at'36 Mulberry", long a Little Italy landmark and •visually familiar td'millidns.'who Saw it in the .movie "The Godfa-t^er" is now-.the JJg Fook Funeral Paflof. The'statue of the. Virgin Mary rwhich iStood in the, winddw iha?s‘been Replaced'by Her cdunter- p r,t, Kw n-ryin,r.-th.e Goddess of Mercy. The cdntefpiece 'of the* Italian re sta,urgnt ,rpw,<pn.Mulbexr,y*«treet is-now the Suri-Mee-'BSan* Spfdxit Company. E^camplep ofc,phanges* in the-street'.scene could‘be multiplied'.
] , Equally fascinating is -the street sce'ne t'd thd East,' as 'Chipatowniexpandsj info the formerly Jewish ghetto.?' The'Church St." Therpsa is still
lettering jnasseS today in English, Xhihese anil Spa£isfi, for-the growing
Hispanic populatign expanding into the area from' the Northeast. Nany Jewish landmarks are being adapted by Chinese. Nurjber 175 East Broadway, a citadel of Jewish thought and culture since 1912 as the home of the Jewish. Daily Forward, has been purchased by a Chinese-merchant, and it is being converted to Chinese community uses. The Forward, the world's only Yiddish daily, has moved uptown to East 33rd Street. Historic 165-67 Henry Street, original home of Rabbi Jacob Joseph School, the first Hebrew parochial school in the United States, in now Chinese-owned and is being converted into apartments for Chinese families. Farther east pn Henry Street, the famous Settlement House still aids the poor and sick, but today its clients are largely Hispanic and black.
It may seem incredible that a single street or single block can be of a distinct character, but all sites mentioned in this paper are within one square mile. Extreme cultural pluralism continues to characterize this part of New York City and provides ample evidence of the historic processed of expansion, contraction and replacement of ethnic ghettoes. It may be doubted whether preservation zoning can counteract these demographic pressures.
REFERENCES CITED1. Modern studies of urban ecology, defined as the competition for space
among ethnic groups, date from work at the Unversity of Chicago school of sociology, including R.E. Park and E.W. Burgess, The City (Chicago; University of Chicago Press, 1925). The contemporary literature is
^ well summarized in Brian Berry and John Kasarda, Contemporary Urban Ecology (New York: Macmillan, 1977) and Emrys Jones, Readings inSocial Geography (Ndw York: Oxford, 1975). Another study of thefriction, maused by historic and continuing replacements of one group by another in one specific neighborhood, as observed here, is Roman A. Cybriwsky, "Social Aspects of Neighborhood Change," Annals of the Association of Mnerican Geographers 68 (March*1978); 17-33. Understanding the historic and kaleidoscopic nature of such displacements and replacements helps understand the stories of inner-city neighborhood turmoil even in our daily newspapers.
73

THE BOUNDARY EFFECT AND THE NIAGARA FRONTIERGregory P. Stein
State University College, Buffalo
The international boundary a’t the Niagara River between New York in the U.S. and Ontario iri Canada presents *an opportunity hot only to study the result of the boundary effect oh -highly populated, highly developed areas on both sides, but also to study the historical process by which
culture began to imbue a natural physical feature, the river with meaning as a boundary. (1)- Thi's study contrasts the culture's which did not see the river ah an apparent boundary, and those that did and do today perceive it as a boundary barrier. It outlines the results of the' boundary process on the nearby areas*, comparing and contrasting physically similar areas.
In making this study, I have applied and adapted vocabulary from John Nystuen, who wrote on boundaries in 1967, and have added some terms of my own.(2) The term reflection, used by Nystuen, describes thb boundary effect in the turning away of a vector by a barrier. This barrier is often seen and represented as a line or an 'edge, e.g. in the case of the international boundary, the end of a thick sovereignty. Nystuert is concerned with permeability, the ability of certain vectors to penetrate a boundary, on a select or qualified basis; the boundary" is in fact semi-permeable. Penetration of a boundary may be divided into two classifications: thoselocal effects which seem to result from mere adjacehcy; and transit, the crossing of the boundary which takes place at a particular poiht or along a certain length of boundary (but which originates or terminates deeper ' ithin the nation state) . We are also obliged to look at the directional aspects of-boundary which are the results of 1) nature, in this case the Niagara River; 2) culture, the historic traditional perception of the boundary itself; and 3) the mode of the vector involved.
One can hypothesize the ultimate boundary situation on the Niagara Frontier as consisting of both elements of exclusivity and permeability.The "boundary is an accepted international boundary which one does not cross unaware; the pldces of crossing are marked by the topography (the river) and the modes available to cross it. Movement* by boat, rail, automobile (and insofar as relevant, air) across the boundary is vitalized and institutionalized by customs and immigration officials, which to some extent create impermeability; there are certain activities and goods, notably liquor, which are affected by this act of crossing the river.Also of course, because what we' donsider th'e‘ security of our persons and property has led to this exclusive'ness of sovereignty, the border is reflective and creates a- zone of avdidance -for psychological reasons.
My study has for research purposes focused on two main formal politi- cal/administrative regions; the Buffalo, New York SMSA, which i^ contiguous with the Niagara River-boundary, and Niagara Region, Ontario, between Lake Ontario and Lake Erie.
The Niagara River, technically a strait, connects Lake Erie- and Lake Ontario. Its flow is fast and made naturally unnavigable by its two hundred foot plunge over the Niagara escarpment at Niagara Falls.
The Niagara^River as" boundary is a part of the European conception of nationality which views sovereignty as exclusively' filling spade and ending abruptly at a mutually recognized line.(3) In pre-European times
74
Indian tribes used- the irjLver a^d its envi<^o^Si .Their spatial patterns were nodal, i.e., centered'bn'villages,' rather than occupying space. Villages were high and off 1;he main routes of transportation in order to be more easily defensible. The river did nqt. serve so much as a boundaryas a medium of connection between the two sbores.
Although it seems probable that the river served as an activity-space bai^rier for .Indians on foot ar\<3'tbeix'non-swimming animal prey, the. Jrpquian language jahd Iroquouian.trib§s flourished on both sides. The
- "^iver seeped not to' ba an important baiyrier jor boundary in..^pre-European cpntaqt times. , ,Wit)i| the comiqg'of the first Europeans, thp ,Erench> thq river took
on a, different paning:* the Fr^epch wete-interested in .connectivity at ascale; . the, riypr was to be traypiec} ,its length from north to south.
.The bepame. a perceive^ barrier to .transition .£tom Lake Ontario toLake Erie. It therefore presented at least two definite locational problems defense of this north-south passage, and a way to get around the falls, a
ThuSj tbp fland near ,the ti'Ypn took ,pn new meaning .and a greater def.^n^ti-op. Fort Niagara was established to guard the north entrance to
u and the. portage aroun<| the Falls. .The French were concerned withlong, .distance travel and protection of this, jiaur-row connection-jifi their string of .nodes on the North Ameripan Frontier-For them the water was a prime transportation. (4>.
* T .rFpr sope fifty-oi^e .years after tjje-American Bevolution, the boundary hardened into ibs present state, of acqeptabjp solidity. At firatv Fort
the eastern side fy£ the river a‘t the entrappe to Lake .Ontario was a gathering^ place for those .fleeing the American revolutionaries-a British outppst on. .the frontier. .These Loyalists the,p funneled to the opposite bank wher^ they .were diffused south- along the-river,..-'settiing «a1s 'dose
possible ta the river-boundary which-was fcgrmalized-tLn 1794- 6... Safely behind the moat-,likq boundary,^ these settlera'-aeparatenessfwaf rdCcentuated by the creation of. the province of Upper Canada „t,separats from iQuebec, in 1791, with its capital at Newark, on the Lake Ontario shore opposite Fort Niagara.
WJien this bopndary^ waSs.aqtf vqly violate^-in the War of -1812, populations were dispersed.^y bjirnings-,qn bqth «fdes, -starting with the American hurning of^ewapk-^ In the end bhe^jBribish .pccupf ejd- Fort Niagara-,, and the Americans ^ r f Epfo^- bflYh sOEEP itb,-tlTeir own; shorjqs; at therriver'-s mouth and. head, xespeqtfvej.y,. Thg%Trpaty pfs-Ghenb set,tl'ed>. th& f>oundary ras it ^ad bq®a, in* the riyer,..
. meantime changes elsewharq in bo>th. OO.untri^'-made -the. NiagaraFront^^^ bouiYlary ,f ess-capcpfosi-yei (gpowfh ha4'''heen'rqfle.qbed,-'or-perhaps mpre.j.acjqprabft.lY'''‘59fiepbej3..-aWhy .brom, aroT pcJ. fh® f rpntier'bQundafby a The capital of Upper Canada (Ontario) was removed from Newark to York (Toronto) a^tridpj af.grqw,th vqctor fhat-jraji-^rom-Nqntrpal.,' aJLppg'the north shore of Lake .pnbar\Q"and poufhjtqs^ b.Qwa;^ Wipdsqr;,* and fi-l-led; .up'the*..southwestern part'of Ontario^^ P^pulafeipn pij-rfhe .western- s^igre-pfifthp Niagara grew at a lesser, rate; immigration from and through New-York:.»declined,' and that spilling over from the direction of Toronto increased. Nodes began to (elaborate away -from, thp rfver.,- ,
St. Catherines, Ontapipy* apme;-ten miles, west of'cthe--Border ;.*igrew rapidly after its founding in 1825, and a string of places grew along the ■WeJ-.land. jPanaJ. vdiiph Jbrayerqed *the Canadian aide from 'Ndrth bo South paral- 1®-Mpgrrthe fliagarq,jj iver. j Other ptringsspf 'plaPUs grew 'along roa'ds oriented
.fvrestr-'bow rd* fhe main Southwes-t-Northeagt .axis'of Cana'dian.'settiement. (5)

Thus, to sonje ijn^ortant extent the Niagara peninsula area of Canada could turn its back on its neighbor.
From 1825 on, Buffalo grew as the terminal of the Erie Canal. Through Buffalo flowed much of the population and commerce to Lake Erie and west. Buffalo grew as the break-in—bulk point of change from canal barges to lake boats. Americans crossed here frequently in the early nineteenth century to take up what often became permanent residence in nearby Canada. The Niagara peninsula of Ontario, of which the present Niagara Region is the larger part, became the home or stopping off point for immigrants from the U.S.-Mennonites, Quakers^ Pennsylvania Dutch, made their first stops in and near St. Catharines, some ten miles inland. Black slaves arrived in Buffalo and other border cities via the underground railroad to take up. freedom in St. Catharines. The border was still perceived as permeable by Americans. Americans went into business across this boundary, often founding and operating local mills and later factories. On the other hand, the nearby New York state market and. the population center at Buffalo provided a strong market for the mixed farms and later fruit farms of the Ontario Peninsula; this obtained until well into the twentieth century.
Even today, the proximity of the large center in Buffalo has created an international spill-over of population into the nearby Niagara Peninsula. Americans have purchased the amenity of much of the Canadian lakeshore for water oriented recreation, to the extent that cottages have cut off the Canadian population from their own shores. It is only in recent years that an increased spirit of nationalism and awareness of this vast summer weekend permeability has grown among Canadians who actively resent this intrusion.
The Niagara River boundary thus presents a case history of the Western idea of nationalism, and its effects on local landscapes. This study of the boundary is now being elaborated in a collaborative study with a Canadian geographer, John Jackson, attempting to present both perspectives on this busy frontier. ^
REFERENCES CITED1. Edward J. Soja, The Folitical Organization of Space (Washington:
Association of American Geographers, Commission on College Geography, 1971), pp. 9-11.2. John D. Nystuen, "Boundary Shapes and Boundary," Peace Research Society
Papers, VII, Chicago Conference (.1967), pp. 107-128.3. Soja, o£. cit.4'. Theodora Vinal, Niagara Portage (Buffalo: Henry Steward, Inc., 1955)pp. 5-9.5. R. Cole Harris and John Warkentin, Canada Before Confederation (New York: Oxford, 1974), pp. 111-168.

DECENTRALIZING POLICE SERVICES:A FEASIBILITY STUDY-dF SYRACUSE. NEW YORKSa’lph ft. Sailiders
Syracuse Vnivey^ity
In Novenibep 1976,t a J:eain'crf four Syracuse .University faculty members was-converted to investigate the advisability of'a comprehensive Syracuse Polve Department (SPD) reorganization, arid to j5rovide a set of recommendations as to what new organization would best suit the needs of the SPD.
next eight months, we evolved a set of organizational alternatives which the police were.urged to evaluate.This paper cannot describe that Entire study, nor even the range
offered, but rathfer isr a reflection on ihat general prpcLs of applied geography, of our study and'xnteracftion witb personnel of the SPD, and perhaps of some intimations of. police thinking on modern police problems.Ti, 1 seemed to be several distinct phases in the work, which areikely to be encountered in any applied work in gepgraphy. These were:
client) statement of the problem, 2) a phase of re-conceptu- aiizetion-, 3) goal formulation, 4-) indentlficatibn of "critical variables,5) formulation alternative solutions, and 6) translation of findings and, recommendations/ .reviewed below in turn.1) Police statement of the problem. What, after ali, were the police looking for. They suggested that research should be carried out to evaluate trie rp^sibUity of the. SPD implementing some form of "zone patrol", a term takgp from* the. notion that modem police thinking' follows a zdrie patrol theo^. Zone patrol theory, perhaps surprisingly, has rather much to say about police zones', but rather little on the subject of "patrol". The corpus of that theory remains elusive..
The police problem was stated in non-scientific and non-bperational terms. The idea of policing "neighborhoods", for example, figured prominently in the language of their original proposal. Readefs of the urban geographical literature on neighborhoods will be familiar with the four or five definitions of that term used by both professionals and laymen.The translation of such terms was called for.
ftnother feature of this first?exposure phase of “the work was important. A certain number of the questions posed in the SPD grant proposal required answers whether or not the team deemed them significant for the reorganization study. The police, for ejcample, needed a statement on the utility of certain census materials for ongoing police work, ftlthough these materials did not integrate well into our study, specific answers had to be obtained.
^®“*-chceptualization. After initial contact, a prolonged phase of reconceptualization took place. This involved principally (i) a rooting out of operational terms and goals, and (ii) probing for meaning in police terms which had no apparent significance. In particular, a certain ambiva-
found in the police position as to*whether an organization should be designed around a predetermined, desirable pattern of deployment on i' to the city, or whether organizational imperatives within theSPD should dictate the pattern of deployment. What was certain was that both ipues were important. This organization/deployment dichotomy, inci-
remarkable resemblance to the structure/process dichotomy within the social sciences and geography in particular. While it might be
77
accurate to rem’arK that -geoglrap’K: Jiais heen unable to fuse together these two aspects \or-views of reality,^ np such ^ux^ry of failure existed within the confihe's of a Specifid applxed'question. The argunient is, one supposes, that the development -o.f 'geographiaal theory remains an important goal for the field. -
In this phase of reconceptualization, we learned that zone patrol theory was an argument for police decision-making decentralization, and that undue, amounts sif anthprity. had acaumulatdd at or rrefar. the top of the
j police-bure^uqpatjic ,hierarchy. This incrqased .volume'Of-‘iTrEontiation flow ..-.T'oc itoughout the, organization, and. delayed deOisionsi;"wh:icrF in many cases •3 jnpt bpar the delay., ‘
Then too, in the middle echelons-tOf> the oommand strUCTtute,^ authority was vested in positions on a temporal basis, in which case the command
» ° .f-iceE .pould nob be held, accountable- for poor'decisions which affected «5 o other than und’er his command. <M6reOver, community leaderswithin the, city- found no simple avenue for rdaching'those with Td’ecision
, making capacity; and the police,non-the .other hand, had“ to-^s'Semble the en-txre corps of middle level officers to meet with non-police officials, on
.-matters, of theirnvutual concern. Command structures-, then, were excessively p^titionpd.» - - i- iIn sum, we .wpre an^iin^ toward a. solution which 'woxtld provide an
r-,, .arearhased. resppnsibiMbv fop decision-makers, »where''debisiohs bore a 24- hour meaning. This is the, "zone." of the zone patrol theory-. We %ere looking for a decentralized police command, which connotes not so much a depen-
,j tralizatiop pf'physical structures (as a.precihct organization implies) but . rather-.pufhing thp, depision-making responsibility dowrf t h e ’'PhaiW of command,
and even into the-street.- An ultimate imEflicatxbn of"-thiiss-argument is that is relieved ofl the-syndrome of "respond-rfefe'r-a'nd-report" to * the, more responsible- position of ."respond.-and-decide"^," ^
. ' * ''3 & 4) In the third and fourth stages of the project,' WhiPhTiii palled goal formulation and measurement of critical variables, different sorts of questions emerged. Namely, what, form of problem'^sPlv'ing •posture do we adopt?- 5ince we were charged with improving, or rrfeking better, or even finding, the'best police organization for the.SPD, it 'tehmad reasonable that we had a problem of-optimization. In simpltr-Janalytical tertts/'this is a problem of the programming Sort (as in linha’f programfnin^, o’ir integer programming) . Such techniques, I might again editorialize, cir'e terribly useful in applied work, not so much as mathematical routines to which data are subjected, but- rather more generally as guides to thinking" about the problem structure.
f-In-this casp, the idea of linear programming-sugge'sts that optimiza
tion .problems proceed by identifying an objective functibn (thte thing to be optimized) and by identifying a set of constraints Within whibh the optimization will take place. This meant that our problem was to minimize the flow of information throughout the police organization, by'minimizing the bureaucratic span betwfeen those involved in the decision, and by minimizing the number of bureaus in which a decision responsibility x§ to be found.As. an illustration qf this latter point, "for example, no feWer than four bureaus had a-hand in decisions concerniriq SPD'cbramunity telations. Among our recommendations was one suggesting a centralization of this function.On the question of manpower deployment, another optimizing task was to be found. The task as we saw it was to optimize the match between' the demand for police services and the deploymeht of the street force in time and space.
But these optimizing solutions were subject to a fairly large number
78
*
of constraints, Qn the deployment side, police are to be deployed into beats, areas which ate thought to be of such size as, to equal the* amount of area -which, one |>atrolling unit daif coyer adequately in an eight-hour watch. The beats i;,deally should be free of barriers' to internal moyement to facilitate rapid response to calls for pdldce assistance. They should furthermore coincide with neighborhood Bo’undaries. The .idea here, incidentally, is that sharpened local area assignments fo'r the patrolling officer would result in a clearer definition of officer responsibility and accountability, and would raise officer interest and morale by allowing him a certain stake in community affairs.. Beats should have equal police workloads, to ensure a,reasonable balance between the time spent responding-to calls,' time used for crime deterrence activities, servihg'warrants, backing up officers in adjacent beats, and so on.
The notion of contiguity is fundamental -to’ the deployment scheme.Each beat is combined with a contiguous on'd to form a- team area or subzone.A team is a ten, or eleven man unit under single command which assumes a 24 hour responsibility for the two-beat airea. CF might noth h*ere that it takes at least 10 men to cover a two-beat area oh a 168 hour work week, allowii\g for a 40 hour work week per man and other routine absences). Thes^.-combined.'-beats, therefore, are further constrained in* that team areas must be formed which exhibit the same favorable properties of those of beats previously described.
A more limited range of constraints on the interhal organizational sid.e. of the project might be described, but as I had father less to do with this aspect of the. reorganization scheme, I can simp'ly-suitmiarize these by noting that internals reorganization, must-.take 'account of a rather natural resistance to change,, since reorganization' of--existing ihstit’utiohs carries threat? to -particular jobs of particular.-peopl'e. Actually, EPb cooperation with team mienihers;--was, better than ekpected, and 'resistance far morfe muted, perhaps because of a genuine belief down the-line that the reorganization could help.
Our reading on these matters was taken from a set of answers to .questj-opaires distributed widely through.-the SPD, and personal interviews with key figures in the organization. On the side of deployment, measurements wcjre -obtained from extraordinarily high quality data on crime and other matters-f which consume patrolman ‘time. For those interested in the measurement question, the demand for police services was measured as the combined police times spent in (i) responding to calls for assistance,(ii), time spent in in.vestigations, ,(iii) time spent in matters of an administrative nature, (iv) patrolling time, (v). time.spent .in gHuior highschool §nd seriior highschool surveillance on a regular basis, _aji ,(vi)f a rather complicated measure of queuing, a measure taking into account- the harrying effect of the piling up of calls at particular times of day in particular locations within the city. These data Were among the most useful in designing the beats and subzones of the city.5) Ip the fifth “phase of the project, the formulation of solutions, two broad thoughts guidedijie structuring of our recommendations! (i) that whatever forms were finally adopted must be easily understood, and simple to administer, and (ii) the solutions should not have an "either/or" or "take it or leave it" tone. Rather, each should represent a particular stage in a final implementation program, so that the department could "evolve" toward a best overall structure and deployment, by phasing in aspects of the total solution, each phase improving the system beyond that which was being replaced.
The appearance of the solutions finally adopted by the project for
79
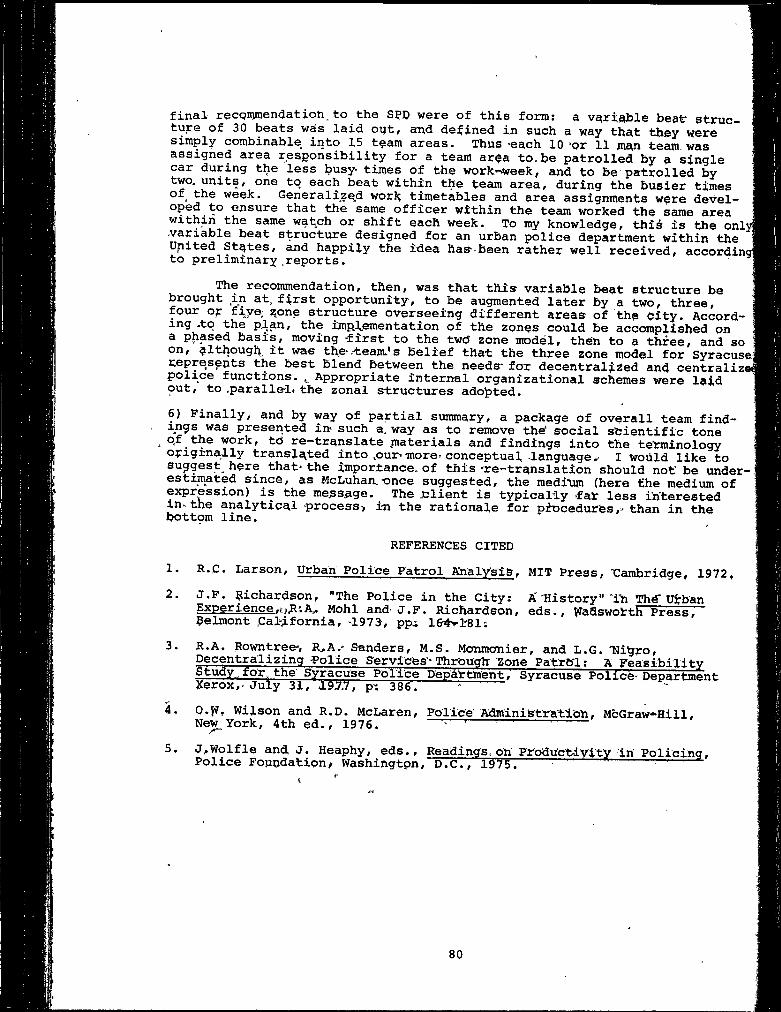
final recqitimendation. to the S?p were of this form; a v^ri.^ble beat structure of 30 beats was laid oyt, and defined in such a way that they wete simply combinable into 15 team areas. Thus-each 10*or 11 man team was assigned area responsibility for a team ar$a to.be patrolled by a single car during the less l?usy- tiroes of the work-week, and to be patrolled by two. units, one to each beat within the team area, during the busier times of the week. Generalize,d work timetables and area assignments w$re developed to ensure that the same officer within the team worked the same area within the same watch or shift each week. To my knowledge, this is the onl ^variable beat structure designed for an urban police department within the United States, and happily the idea has-been rather well received, accordin to preliminary ,reports.
The recommendation, then, was that this variable beat structure be brought in at. first opportunity, to be augmented later by a two, three, four or five, z,one structure overseeing different areas of the City. According -to the p. an, the irop.l.ementation of the zones could be accomplished on a phased basis, moving -first to the twd zone model, thiSn to a three, and so cc, ^IthougA. it was the-.'team.'s Belief that the three zone model for Syracuse represents the best Blend Between the needs* for decentralized and centraliz* police functions. Appropriate internal organizational schemes were laid P'ltf to .paralled. the zonal structures adot>ted.6) Finally, and by way of partial summary, a package of overall team find- in^s was presented in- such a. way as to remove th€? social scientific tone
,the work, td re—translate piaterials and findings into the terminology origina^Lly translated into .our-more, conceptual language.. I wodld like to sujgest^ hare that-the importance, of this -re-translation should not be underestimated since, as McLuhan.once suggested, the meditun {here the medium of expression) is the message. The client is typically -fat less interested in.the analytipal •process> in the rationale for piocedures,-than in the bottom line.
REFERENCES CITED1. R.C. Larson, Urban Police Patrol Analysis, MIT Press, Uzimbridge, 1972,2. J.F. Richardson, "The Police in the City; A"'History"'ill ThO" Utban
ExperienceA-. Mohl and J.F. Richardson, eds., ^fadswotth Press, Helmont jSal-ifornia, -1973, ppi 16i4vl"81;3. R.A. Rowntree-, R,A.- Sanders, M.S. Monmonier, and L.G. Ui^ro,
Decentralizing Police Servic'es-Throughr one Fatrefl; A Feasibility Study for.the Syracuse Poiice Departlnent, Syracuse Police-Department aCerox,-July 31, 197.7, p-. 386. ^
4. Q.yi, Wilson and R.D. McLaren, Police AdministratiGh, McGraw-Hill.Ne\^York, 4th ed., 1976. ' --5. J,Wolfle and J. Heaphy, eds., Readings, on Produ'ctivity in p°licihg.Police Foundation/ Washington, D.C., 1975. ^
80

THE SCHOHARIE COUNTY COOPERATIVE PROGRAf'1: A CASE STUDY IN APPLIED GEOGRAPHYPaul R, Baumann
State Univers^ity College, Oneonta
In 1975 the Schoharie County (New York) Planning -and Development Agency and the Department of Geography, State University College at Oneonta, N?w York, entered into an arrangement called the -Schoharie County Cooperative Program. Under this, several different projects in appl'ied geography have been,_9ndertaken by the -department of geography for the- planning and development agenpy. 'One major project fjas been the development’of a' coUnty- wide computerized environmental, information system. This system" allows the planning'and development agency to "produce detailed maps covering" a wide selection of environmental topics, to determine »the best locations in the'county for various activities based on certain defined conditions, and 'to analyze .the location and spatial distribution of' environmental data.This paper is a report on the development of this information system.*
Schoharie County is a large, rural county located on the nor'thern edge of the 'Ca'tskill Region in Upper New York State. It fapes the problems of high__i}nemploymerit, decline in agricultural proiluction increase in absentee ownership .of land, and demands on its water resources from the New York Metropolitan area. Many planning decisions related to these problems must be" made at the county Level but often these decisions are based only on'empirical information tinted by emotional feelings. Factual information is either .not readily available or not in a format easily interpreted. The major objective of this information system is to provide the county with a means to. ascertain environmental data fast and in a format easily understood so that couiity officials can make informed decisions.
To.pupport the development of this information system under the cooperative'program, the planning and development agency has provided funds through the’ Comprehensive Employment and Traini.ng Act (CETA) fbr two full time positions, and the geography department has furnished technical assistance and"'computer facilities. A.ll worJj on this project has been done at ■the ^e'ograp^y department where an office has been provided for this cooperative' program. The'facilities provided by the department have also included its computer graphics laboratory which has a 30 inch off-line Calcomp Digital Plotter and a 40" x 60" digitizer interfaced, to. a .keypuch. The laboratory also possesses a large software library..
GE0-DATA BANK,This environmental information system consists gf two major components
a geo-data bank and a, computer software system designed .to work in* conduction with the data bank. The geo-data bank is organized tQ contain specific ehvironmen'^a'l data and uses a grid network to* specify th^ geographic JLoca- tion of dcCfa. The data fall into four main categories: topographic, land use, cultural, and soil. These categories and the specific variables associated with them have been determined on the basis of the character and the needs of the county. None of these data have been collected firsthand but have been extrapolated from secondary sources, namely maps The topographic data which consist of elevation, slope, aspect, and rela.tive relief were, acquired from' the United States Geological Survey (USGS) iftaps. at the scale of. 1:24,()00. Actually, only elevation data we i'e collected from the maps; The'other topographical variables were calculated from the elevation data. Land use data Were taken from the land use maps prepared for the
81

Temporary Commission to Study the Catskills.(1) These maps are alsp at the scale of 1:24',000 and cprrespond. in coverage with the USGS maps. These maps are based on data taken from 1^73 aerial photographs. Only area type land use data were taken from these maps and these data strongly reflect both the natural and man-made v’egetation patterns found in the county. Cultural data were acquired from the New York State Department of Transportation (DOT) updated maps of the USGS maps at the scale of 1:24,000. The most recently updated DOT maps covering the county are for the years 1968- 69, Cultural data include such items as roads, cemeteries,' transmission lines, and other man-made features which are relatively 'fixed bn the land- pcape. Soil data have -not been included" yet in tfre'geo*data bank. Under a secpnd^project for thetplannin^ and development agdncy new soil maps ^re bej.n^ made from/the 1969 ^oil survey maps don'e by the Soil Cohbervation Service.(2) These new maps will be at thd scale of 1:24,000 and at the s#mer,coverage >as the USGS maps. Once these new map's are* completed the soil data jtfill be-extrapolated from them rather €han‘frbm thg original soil maps. The data' maintained in this geo-data bank represent basic information needed in much of the work done by the planning and developmfent agency. Also, because^of the- nature of these data, they are not likely to change rapidly; thus, the fpguencfy at which the geo-data bank is built on a uniform'grid network with the basic grid cell being 1/16 km^ or approximately 15-1/2
of cells ccfrresponds to the predefined Universal Transverse Mercator (UTM) geographic reference system."^ 'By employing the UTM system this geo-data bank can be incorporated into'othef information-systems- using this stacndard gtfld network such'as the New York State L a ^ Use and Natural Resources* Inventory.(3) Also, by using the UTM geo- code system it is possible to aggregate grid cells into larger cells such as 1/4 km , 1/2 km , or 1 km . The size of the basic grid cell in this information system provides enough spatial detail in'this rural area to meet most of the requirements of the planning and development agency and allows the overall system to be manageable in respect'to da ta processing operations. To cover the county at this scale approximately 26,500 grid cells are needed. For each grid cell 152 pieces of data relating to the previously mentioned categories of topography, land use, cultural features, and sOii are being collected and placed on a magnetic 'tape-file. Eac|i ’ grid, cell is handled as one record on the tape file and each irecdrd is organized as an array to hold the data pertaining to each cell. Consequent- ly; It IS quite easy to retrieve a certain piece of information for any grid dell. Only the correct UTM geo-codes for the grid cell arid the array element number of the data are needed.
For ease of handling the geo-data bank is organized as ohe large rectagle with its dime'ftsions being determined by the boundaries' of the four sides of the county. The grid network extends across this rectangle to cover areas both inside and outside the county and forms a matrix of 213 rows by 185 columns. All grid cells outside the county, are identified by a fl'ag value in one of the array elements of the grid cell records.. This type of organisational structure makes it possible to expand the geo-data bank to incorporate areas not in the county. In fact, topographical'‘d'ata are available for all grid cells ih the present geo-data bank.
COMPUTER SOFTWAREThe computer sbftware componeilt of this information system consists
of two major computer programs. The first.program vrfiich is, written in COBOL is designed t6 retrieve data' fast and efficiently from the geo-data bank and to create an input data file for the second program. Since an individual file record exists for .each grid cell in the geo-data bank, the nun*er_of input-output operations between the file and the working memory area of the computer ranges in the thousands. Generally computer languages
82

which are scientifically orientated such as FORTRAN do not handle larae numbers of input-output operations efficiently and fast. COBOL, a data processing language, is designed to work'with larg,e amounts of data and to manipulate ddta files requiring numerous input-qutput operations. The inpvlt data file created for the second program"has only 213 records in comparisgg to the 39405 records needed to, cover all the grid cells in the •geo-data bank. - , - ^
This firs-t program aT.so allows certain basic mathematical and condi- , op®^3tions 'to be performed on, one or more of the variables in the
bank. This option allows new variables to be developed from existing variables in the data bank and greatly enhances the potential use of the da-ta 'bank. The mathematical operations include addition, subtraction, division and multiplication. These operations can be performed between an outside constant and a data bank variable or between- two data bank variables. Up to nine sequential mathematical operatiogs can be handled by the program. Conditional operations are designed to allow comparisons to be made between values. These operations are expressed as "greater than',' less than , and "equ'al to". The progra’fh can also handle up to nine steps
of conditional -operations. To illustrate the use of these operations, the planning and development agency recently wanted to identify potential win- 1 the winter deer coJ.lect on heavily forestedslojie^ with southern exposures in order to find food. The geo-data bank
has information on* slope, forest.coverage, and aspect. By using conditional operations it was possible to identify all grid cells which possess all of the following conditions: slopes greater than 10 percent,'forest coveragegreater than 10 percent, and either southern, southeastern, or southwestern exposures.■« U computer program, written in FORTRAN, read-the output fileof the first program and creates a line printer map based" if,,the data from the file. Thi's program has many options common tp otHer inapping programs.It possesses a symbol package which allows a user the op'tion to employ the standard symbol set provided by the program or ,tp develop his own symbol set.. .A text package, permits the user to submit as much, textual material as desired. The legend package is organized to handle up to ten map categories and gives the user the option of four methods for calculating map categories. !phese four methods are: equal interval, arithmetic, geo-metricsi and unequal interval. These' opti,ons give the user cqnsiderable capability in respect to the decision making processes as^cfated with the construction of a map.
On the line printer maps produced by this program, one printer character is equal to 4/5 of a grid cell or 1/20 km2. a one to one rela-
between the map's printer characters and the geo—data bank's grid cells is not .feasible without major map distortion. The dimensions of a printer character are 1/8 of an inch by 1/10 of an inch which makes it an oblong rectagle versus the grid cell which is a square. To accommodate this situation each row on the map has been expanded.
FUTURE DEVELOPMENTSPlans exist to develop additional software for the systep. A program
which would allow a user to examine subareas of the county would be helpful the agency. Many studies and presentations made by the agency deal with
the county. Maps and data covering the entire county are of limited help when the agency has to make such studies and presentations.Another program under consideration would allow maps to be produced on a digital plotter. Maps generated on a digital plotter are not as crude locking in appearance as line printer maps; thus, a person looking at plotter
83
maps might find them easier to relate to than line printer maps. However,I line printer maps cost less and require less computer time tp construct thJ do digital plotter maps. This program might be used only to,-create maps, fJ major presentations and final reports. In addition to this user oriented I software# programs based on environmental models related ,to specific data I in t;he geo-data bank are being considered. These models would,produce i auxiliary information for the geo-data bank. At present, models to simulatj ground water and solar insolation are being explored. Ground water informal tion is neOded to assist' the county in its decisions concerning the demands! on its Water resources and solar insolation data, may help the many non-coun residents wh6 insist on constructing" second homes in very remote sections of thS county where electric facilities are not readily available.
mental stage, it has not been handed oyer to the planning and development I agehcy fot its use yet. Some maps have been produced for the agency by Ithe System but it is too e'atly to draw any conclusions ^bout the impact of I the system' on the planning problems and decisions faced by the atgency and bs county officials. However, the agency seems to be quite plpased with the 1 results thus far provided by the system. Hased on th^ present rate of | development, the geo-data bank and the presently developed-’software along j with documentation should be ready for the agency by next year. The actual! operation of this information system will continue on the college's hardware until the agency finds adequate facilities at the county level to handle ] the system. |
1. New York State College of Agriculture and Life Sciences, Land Use aNatural Resources (LXmR) Maps of the Catskills, done for the Temporary ■ State Commission to Study the' Capskills (Ithaca, New York: Cornell ■University, 1973).
2. O.S. Department of Agriculture, Soil Survey of Schoharie County NewYork (Washington, D. C.: U.S. Governmen-t Printing, Office-, 1969).
3. R.F. Tomlinson, H.W. Calkins, and D.F. Maryle, "The^Land Use and'Natural Resources Inventory of New'York Stete (LUNR)," in ’Computer Handling of
)jeoqraphical Data (The UNESCO Press, 1976).
Since this environmental information system is still in the develop-
REFERENCES CITED
jV
84

IMPLICATIONS OF APPLYING GEOGRAPHYJohn W. Frazier
State University of Sew York, Binghamton
INTRODUCTION"" emerging tren<3 in .contemporary geography is the application of
geographic knowledge and expertise. This trend is being reflected in ai^tll an increased involvement of non-academic geographersdiscipline, an effort by geographic societies and as-
-inroutlef geography and a concomitant ihcreas-ing outlet -for applied geographic -research.(1) while* applied geography® long .history, ,the new trend differs, from the orevious trLition in its
'’anrits Im S method, its-benefits from tnew* technologygeography curricula change. Similar to recent philosophi- thi PPl""®* geography implicitly questions the suitability ofthe controlling -paradigm and seeks to address nan^V questions from.a diif^rent framework. ■ It is the purpose of this paper to examine sqme of-the. implications of this emerging approach. ThisgrapSr?iiS?ng?'""' " examination of the evolu?io^ o-
THE EVOLUTION OF a1>PL]^D GEOGRAPHIC THINKING?F°?H^Phy advocates have .no.ted that the cur;:eht emphasis is
tr^diiion,. pot a jiew departure-. " C2-)«' While'James'hasof; applied gepgpaphy-, (3) the f<s-trong«thSbretical
t h i f J S ^ t L s ,dwarf ed_,agpl-iedt academic^ researph. symptomatic ofthi journals ayay from applied research towardand statistical jnodeling of, the deductive-predictive positivist persuasion clearly left little^ space for -alterna- •tive points of view, and apfiiedwork, like other alternative approaches,
'Ftwm if?. "'?$hods and philosophy did not match the'paradigm, droppedoitpc! +-ho 'Sm P®^®^n, ji.n reporting the evolution of marketing geography, cites the impact on the discipline's publication outlets.
, ■ s- ,A much more timely and accessible medium for marketing geography communications, has been thg i iQ\jrnais (outside geography). .Again,, thq 'geographic.press' .has ? , r provided a relative modicum of help in presenting applied marketing geography. Whatever paradigm is in vogue, our piece of the action has not really fit the pattern.... onfe Would be'har4-pressed to .find very much in (the'-geographic journals)T(4)
v,rf tradition, applied geograp.hy/* was foibed-to existnon-acedemic.'or non-qeographic above,„problem, academic geography became even
Thil f u r S ^ seryipe -towar a this- obvious market.■'Ti widened fhe. gag^between academic apd applied geography, becauseavailable.. This is particularly, surprising* in -Af .increasing soc.j i awareness and demands for social relevance which existed during- the 1^60's,■* ’I ' ' ^
Thlii ''3fes o f - h o w e v p r . , have changed thL situation.expresS^^ largely in terms of cJxsllenges* to the
mbdet. These include the relevance of geographic inquiry and tne role of geographic education. For example, Hurst has suggested "rethink-
85

ing geography"In more general terms geographers should be more concerned with material well being, with the human condition, with equity in resource distribution, with responsiveness of various landscape-forming development, and wiih the harmony of man in his total environment. These kinds of concerns provide a framework within which the analysis of contemporary geographical problems can be undertaken; currently they are not, since they are obscured by the attributes of positivism, particularly the,value of neutrality...(5)
King, from a non-radical viewpoint, has also recently stated th^t we .should not allow,a purist framework to, prevent the addressing of applied gugs- ,tions.(6) Additionally, regarding'thp issue of relevance, the adequacy , of* geography curricula has been questioned and Hdiges, for example, has identified one of 'the' challenges as expanding educational training to a more practical orientation.
...[to] include some practical' experienge as part of the program...not [to] be confused with vocational education.Rather...training on-the-job in addition to, but not in lieu of, his academic training.'(7)
From t h i s view geographic education must permit the discipline to meet changing market demands which clearly require practicality and relevance.
Employment opportunities further dictate changes in geographic education. This ds especially apparent in career opporturiities. in planning and curricula changes have been noted in this regard. The Harrison-L^rsen survey of gedgraphy" departftients' found that departments offering qpurses in planning have doubled in a five year period.(8)_ Further, nearly fifty percent will make applied course-wOrk available'^in the future. This trend, then, also suppdrts the major contention, of this paper: applied geographyis re-emerging, and is evolving due to both philosophical changes within the discipline and the perceived nded to meet market; needs. This trend has a .range .of implications some of which are addressed below,
APPLIED GEOGRAPHY: FUTURE.ACTIONS AND IMPLICATIONS,^ong the ^fdbldmd which gepgraphy faces in the next decade are communication, accouhtctbil’ity and curriculum change.First, it has become clear that a formal communications channel by
which academic and noh-academic geographer^ can effectively exchange ideas and expertise must fevolve. While it is clear tha't attitudes in geography are in the process of change, an adequate outist for applisd research is still needed. The applied geography section of Geographical Review provides a usefu'lf'bPt resttidted space for such dialogue. Clearly, howevep,* some permanent forum, is needed for cbmitjunicatioa, meeting and exchange and^a formal written tecord.- Second,' geographers .who choose to .do applied work must be willing to go be'yond simple description and be willing to make specific recommendations for problem resolution. Such prescription wi^l jjesult in accountability judgements' both by public and private sources, as w§ll as by other academics. As Jumper has noted, this "going to' the well" can be as costly as it is rewarding.(9) Third, geography departments must make decisions regarding the nature of the future curriculum. As indicated aboye^ a number of departments aife 'in the. process of making s.uch ciianges. Departments must bfe careful not to pSrceive the applied geography .trend as
86
necessarily.resulting in.th^ distinct choice of j^rofessional ys, liberal arts education. It would seem beneficialf rather, to carefully select new courses, such as internship practicums, and to modify existing courses to meet necessary changes. A great deal can be accomplished through curriculum adjustment and modification without damaging the liberal arts education.More specifically, a tracking system might be appropriate, whereby the liberal arts curriculum is preserved and a new applied track is instituted.
The few key problems must be dealt with wisely. They are not identified here as opposition to the emerging applied trend, but, rather as key decisions which once made will have long term effects. The identification of their implications is much simpler than providing solutions. If We fail to develop new communication linkages, applied geography will continue to operate on the periphery of the discipline and, thus, will have little additional impact on- the core of geography. The apparent trends, however, indicate that applied geography will continue to gain in impetus and will be a major focus of 1980's geography. Accordingly, those of this new persuasion must be willing to provide careful analysis and prescription because they will be judged by peers and non-academic users of their findings. The implications are greater visibility and growth if these efforts are successful and long term damage if our applied efforts are poorly prepared and presented. Finally we must carefully examine our current curricula in terms of our future needs. Successful modification may generate new interest and adequately serve the liberal arts and career-oriented student. A change to a narrow curriculum might fall victim to the fickle nature of the university and result in damage to both enrollments and the discipline's role in the university.These key problems, then, which are inextricably linked to the emergence of an applied geography, need careful consideration by all geographers.
REFERENCES CITED1. For example, there is now an "applied geography" section included in
The Geographical Review and a new discussion series which is devotedto applied research. S ee Research in Contemporary and Applied Geography, SUNY-Binghamton, Binghamton, New York. In addition, a national applied ' geography conference is to be held May 1-3, 1978 in Binghamton, New York.
2. H.G. Roepke, "Applied Geography; Should We, Must We, Can We?"Geographical Review, Vol. 67 (No. 4, 1977), pp. 481-82.
3. Preston E. James, All Possible Worlds (Indianapolis: The Odyssey Press,1972), p. 383 and 427-453.
4. B.J. Epstein, "Marketing Geography; A Chronicle of 45 Years,"Proceedings of Applied Geography Conference, Vol. 1 (forthcoming, ,1978).
5. M.E. Hurst, "Establishment Geography: or how to be irrelevant inthree easy lessons," Antipode, Vol 5 (No. 2, 1973), pp. 40-59.
6. L. King,, "The Analysis of Spatial Form; Some Theoretical Applied Shortcomings," unpublished paper presented to NSF Seminar, Ann Arbor, 1970; "Alternatives to a Positive Economic Geography," Annals 66 (Np. 1, 1976)- pp. 293-308.
7. H.E. Heiges, "Academics and Practical Geographic Training," The Geograph- ical Survey 5 (No. 3, 1976), p. 3,
8. J.D. Harrison and R.D. Larsen, "Survey Results; Planning in Geography," summary statistics from a mail survey of February, 1975; results distributed upon request.
\
87
9j. S.R. Jumpe;c, ''Gping to the Well," Professional Geographer 27 (November, 1975), pp. 419-425.
88
£

JSTUDENT USE OF STATISTICAL MAPPING UNDER TIME SHARING
Alex Rees ClarkColgate University
Computer mapping has not diffused through geography departments or through university curricula as rapidly as one might have predicted at the time gfeneral mapping algorithms such as SYMAP, GRIDS, CALFORM and others became available. If it is taught at all, map production using computers is still treated as an advanced subject, with the questionable result that upper division or even graduate credit is often given for successful execution of a, few simple computer maps. The simple task of preparation of data sets with strict adherence to prescribed formats takes time from consideration of the meaning of the maps and By itself does nothing to enhance the students' skills of geographical analysis. Thus even in university environ^ ments', credit in computer cartography typically accrues to mechanical skill tather than intellectual development. Ideally the making of maps should be subordinate to their design and interpretation.
Three factors that retard the desirable shift from mechanical to Intellectual aspects of computer cartography are inappropriate computer environments, underdeveloped system software, and (the buck stops here) failure by geographers to make a long-term commitment to development of mapping software and data banks, e.g., digitized base maps. Geography departments have more control over some of these factors than over others.The selection of the computer system must fill the requirements of many disparate users, but the advantages of time sharing for cartography and other computer-assisted instruction CCAI) are manifold. Time sharing allows both immediate feedback and a sense of control which rapidly break down the typical geography student's initial reluctance to use the computer.The computer center should provide at the very least utility programs, with English mnemonics, to copy, concatenate, store and delete programs and data. Sy t'Cm’ statistical programs should, include optional output files (e'.g., residuals from regression) in a form suitable for use by a mapping program.
Geography departments should be prime mover.s, ,not passive users, in the development'of mapping software and digitalized base.maps. The watchword here should be simplicity, especially at the undergraduate level.The goals of geographers who employ computer cartgraphy as ^ CAI tool should be (a) to minimize 'the investment of the student, in study of tJje computer and' (b) to Maxiinize the" utility of each map that is prepared. To accomplish
_ the- latter objective, the’ geography department can assme resppnsibility for maintaining' Jjase maps, and each person who prepares a basp map* should contribute ft to the growing library of digitized maps>. Minimi^atipn of the needi'fcJY'computer knowledge requires p contihuous effort I?y tlje geographer/
j cartographer't’6 ‘interface mapping' algoiithms" with conversational, file-' preparation' programs that handle’ the formatting and. seguencing-'requirements
of OarcK algorithm.' Finally, the selection.^of the mapping pi;ogram3^themselves r should hfe rti de under criteria that favor u4e''‘bY unsophisticated'Students,
even if the versatility of programs inust'be sacrificed. This policy allows the use of computer mapping in the general curriculxim as well as in cartography courses, which dramatically’ increases the proportion of students who become aware of the opportunity and,utility of automated,mapping systems.
> As an 'example' of this approach to Student use of ■compute. mapping, consider the two programs CONMAP (CONversation MAP) and 'PROMAP (PROfile MAP). CONMAP is a desc^dant of the scan-line algorithm CM^P(1| that is fully conversational ahd includes subprograms that prepare base maps and statis-
89

tical data banks, all without any need to know about FORTRAN forma-hcs seguence»^f .operations or any-other nechanical aspect of the procrram 'PROMAP draws block diagrams using profiles of the CONMAP scan lines.' It
CalComjy _:plotter software and a standard hidden line algo- ^ can be pteviewed on a cathode ray device (if available)before plotting. This reduces the number of wasted maps.
in fiau're t^®^®tudent merely follows the steps showngQ ^ata ,values come from the previously stored file callediSstiAd abofi't^n P '°‘ ^°®‘5.-°°"versationally using CONMAP. A demonstration ih« about 20 minutes is sufficient to allow students who have never usedSpear^ i^®Figure^5y" program. Sample output from PROMAP
At Colgate, our library of base maps for jCONMAP/PROMAP now includes""i s.ver.1- other °
built^An Ahif- generations of cartography students have graduallybuilt up this eailection. Students In other classes can specify the name of computer and make maps without any real awareness of
the underlying.preparation. A hlerafchy of readineL ia emplo^d ?o saveftite arrkenrordi^k^ United StatL or New YorkInd student frequently used maps, are kept on magnetic tapeand student assistants can load them onto the system .on short notLe.
The approach to student use of computer cartography described here hae-S students in’i X o d u ^ S cou^sH(including be'gmning cartography) , can have the experience of computer
mapping without _ learning rules of computing. The .initial >barrier\o computing, complexity, iS 'shattered; and if they want to pursue'the’subiectnet,having to teaoh'^computiSs S a d '
c a n \ e " S 4 c ? 2 d t e c S c i e J S ^ r o b S r ^•fore ,?^f°Uraphy'as a substantive part of the cirpi,culum is there-seen aS having less to do with the p'roduction of maps than with thethere^f«°i ^ntoimational 'medium— especi^Uy important wheret ^ singlfei^^cartbgr^^hy course in a liberal arts cLriculum? ?hlrl isn.?e aA f problem-solving work in cartography cours^ to the
classtoom. Maximum benefit obtains, of course, i» all parts of the i o ^ p u S ' ’
.® ^^^P^®ssion-serving side to this approach. StudentsbetOon courses— and -disciplines— for the,..balance, .they strike! -3"' Careen preparation^ -The’ .cartography
integrated intb the geography and jgeneja>-university® prototype for geographic infomatipn systems in
mky^ broaden bhe appeal ef geography in phys-stuSents who-take gepgraphy L e
emphasize cartography.cotaputbr cartography., dispersed -throughout:' theIf S S i g a A - d f f a w a r e n e s s . a m b n g . nonspecialists of\he-Utility or geographical pers^edtives and skills.. ,REFERENCES CITED '“'U
"*“ o^°|l®th Maps on Small Digital Computers," P^ceed^n|s, Association qf ..^erican Geographers,-Vol. 1 (1969),
2. ^CACM. Cdllect'b'd Computer Algorithms. Noi 483, 197,3. r
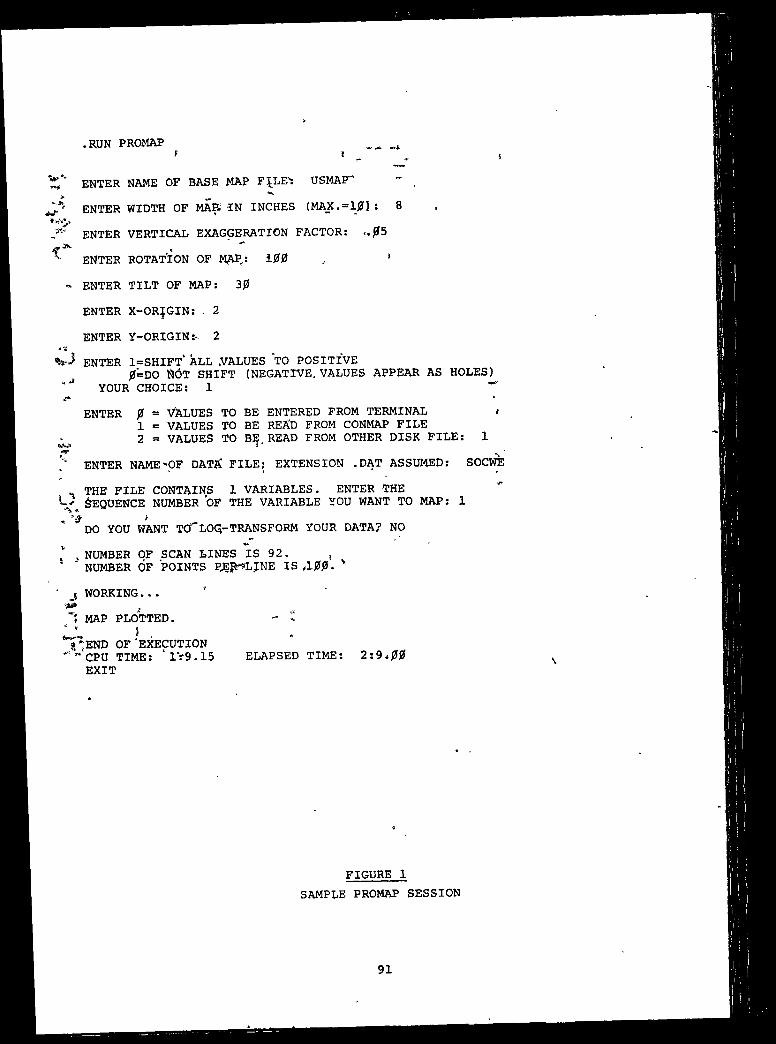
•RUN PROMAPIf i
ENTER NAME OF BASE MAP F LE': USMAF* “enter width of MAB in inches (MAX. = 101; 8ENTER VERTICAL EXAGGERATION FACTOR: ..05
^ ENTER ROTATION OF MAP,: 100 , *- ENTER TILT OF MAP: 30
ENTER X-OR|GIN; , 2 ENTER Y-ORIGIN:- 2ENTER 1=SHIFT* ALL .VALUES TO POSITIVE0=DO {iJOT SHIFT (NEGATIVE. VALUES APPEAR AS HOLES)
■"* YOUR CHOICE: 1ENTER 0 = ■\^LUES TO BE ENTERED FROM TERMINAL i
1 = VALUES TO BE READ FROM CONMAP FILE ‘ 2 = VALUES TO BE READ FROM OTHER DISK FILE: 1nisWi ? '■* ENTER NAME'OF DATA FILE; EXTENSION .DAT ASSUMED: SOCWE*■ '- I
THE FILE CONTAINS 1 VARIABLES. ENTER THE ^QUENCE NUMBER OF THE VARIABLE YOU WANT TO MAP; 1
f* DO YOU WANT TO’"LOQ-TRANSFORM YOUR DATA? NO
NUMBER OF SCAN LINES IS 92. ,NUMBER OF POINTS PJEI LJNE IS ,100. '
• j WORKING... ■MAP PLOTTED. - t!i fT < *I^END OF EXECUTION '"’’CPU TIME; "1V9.15 ELAPSED TIME; 2:9,00EXIT \
FIGURE 1 SAMPLE PROMAP SESSION
91
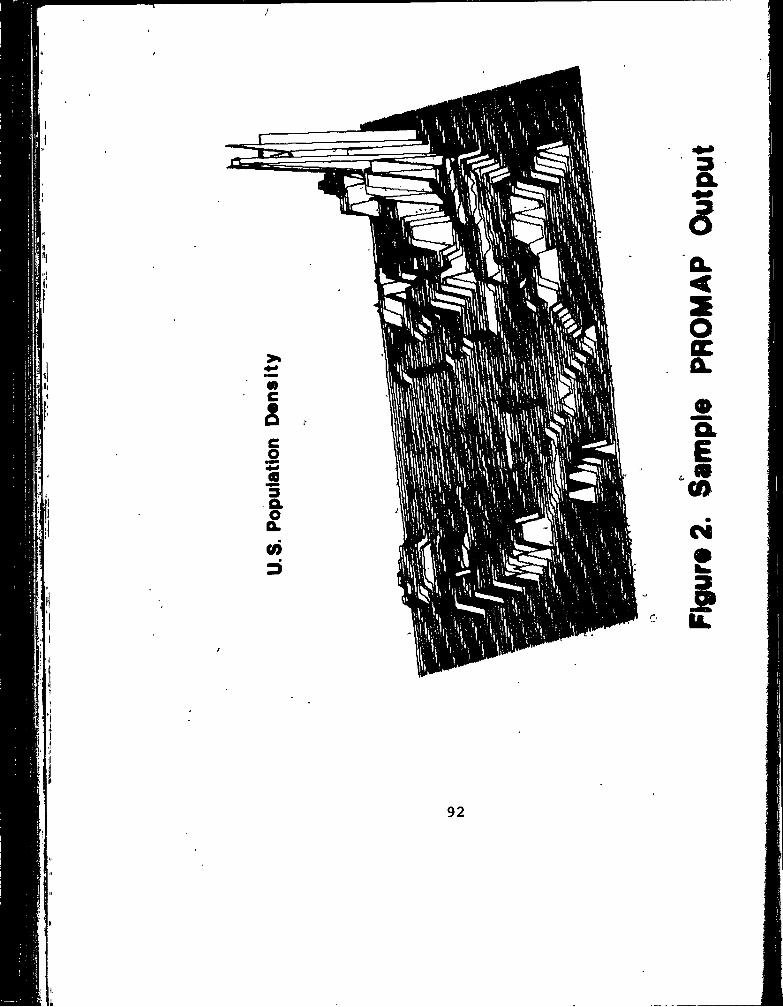
Figu
r«2.
Sa
mpl
e PR
OM
AP
Out
put

A ROLE FOR GEOGRAPHY IN CONTINUING EDUCATIONRobert C. Ztegnenfus
Rutgers, The State University
A privat.e junior college closes in Pennsylvania and in New York state a community coMege g,eographer__^fights the th:feat of retrenchment. These evente have their carbon copies in other localities across the United States as full-time day student enrollments decline slowly or ‘Stabilize in many two and four-year schools. This phenomena, often called "the disappearing student," first became apparent in th§ Eastern United States when'colleges in New York ptate opened for the Fall Semester of -1971. No on^'paid much attention. By the Fall of 1972, the force f ad gathered momentum and diffused into other, states. This time a reaction opcuri^ed# perhaps a predictable one— the administrators blamed the faculty for. "turning off" the students and threatened retrenchment.unless somehow the faculty returned the students, while on the other side of the academic -fence the faculty blamed the administrators for either not "recruiting" to the degree necessary or for preventing the students from having the rights they had demanded years earlier.,Somehow lost in all the verbiage was the inescapable farct that the students were not pres'ent and no fixation of ;,bl,ame -ji uld -change the enrollment statistics.
While the collective paranoia continued., some of the more- thoughtful people bagan to analyze the reasons for the §maHer number of full-time day students. ' Numerous suggestions were made, bvit twp interrelated factors seem to be closer to the crux of the matter than others: smaller highschool graduating classes npw that the large post-Wqrld War II age cohort has passed through the teen years, combined with- an alleged ali'dnatioh of young people from traditional higher, education. I say> "alleged" -advisedly; Kramer's comments point toward reality:
Statistics show 15% unemployment rates, for- humanities and social science graduates, compared to 5% for business gfadfuafes. .. .25% of all B.A.'s, and 30% of social sciences and humanities graduates, use little or none of their training in thei.r actual work situation.(1)
Alienation could probably, be ameliorated. Nothing can be done to change the age structure.. In short, it soon became .apparent to educators that fulltime enrollment would probably, never ag,ain climb as -jrapidly as hhd* been characteristic of the 1960's.
{
The inability to rely almost exclusively uppn th.e numbers of fulltime day students as a basis for building a budget forced administrators and faculty to look elsewhere for the des.ired jiym^ers*- One* of the segments of education -that has thereby been recognized -as a- focus fpr development, at least in many two-year colleges, is continuing, education. Historically, most schools'.had saddled this division with the lowest budget .priority.In curricular considerations' it fared little bptter— courses were usually the sfune ss ihose offered during the' day although usually taught by part- time ins.-t;rucftors. It seems that administrators erroneously assumed that traditional 'day school educational opportunities would meet the demands of an plder and more diverse evening student population. Within the last few years,, many institutions have converted from these old, modes of thought tb new strategies that may help to serve the requirements of this varied clientele.
93
A q^uestipn co.ipps to mind at this point: Is this new emphasis oncontinuing education realistic? Baker and Knerr stated;
e....the demand for adult and continuing education has grown at a faster rate than the population in response to such societal trends as more leisure time, women's liberation, changing job ■requirements, and student's disaffection with the
" traditional, full-time model of higHer education.C2)'t
Moreover/ .this growth may accelerate now that the post-World War II' age cohorts are‘in.>the prime years for additional education even thov^h large nuitdaers already possess a degree. In, combination with the earlier quote from Kramer, perhaps Harper's statement partially 'explains ^hy)
' While no solid data are available, some observers have.the impression that growing numbers- of persons who have bachelor's and advanced degrees are going to community colleges in efforts to improve their job prospects in occupational fields.(3;
I suspect, that to this group could be added the high school q.nd college jdropout since both "would make additional though different dertiarids. ’it would appear that a complex series of social, demographic and economic fattors have created conditions wherein a significant number of individuals could be served'fby-an* enlightened’ appfOacK to continuing education. The necessary ingredient ''is fox faculty members to re'cognize -theSe potential s-{:udents and begin to“.provide peitinent clhSsroom experiences. ‘
-The next question becomes what types of opportunities are appropriate. According to Dr. Eugene F. Fram, Professor of Marketing at Rochester Institute of Technology; tw6 approaches may be utilized by institutions of higher education to provide sdnvices to the people it seeks to serve. The traditional approach of the past has been labelled the product concept whereb'y. the administrators and faculty determirte "What courses (the product) should be'ioffeted to students (the consumers). If the enrollment materializes, everyone assumes that'the correct decisions have been made while the lack of suffioieht^ entoriirteht means the opposite'. Unanswered by this.method is th6' question' of Vhat might the students Have taken if it had been offered? The new approach, coined the marketing concept, answers this questions clearly. In this method, the clientele must be identified and liaisqn established In order, to ’detfetmihe the eventual consumers' precise objectives and requirements. Course offetings are 'then based op their needs and not oh the college's preferences. This system virtually guaran-tees enrollirtent and, therefore, little time is wasted preparing courses or programs that will not be well received. Mention should be made that this approach can.be applied to all sectors of higher edudation and not just cont'iriuing education. (4)
There are at least two major benefits that could acriie to geography by its participation in the continuing education *realm. Fifst, the results might help to" alleviate sonfe of the stigma" associated with, the subject.Large numbers of- adult" Ameribans who. have not experidncqd a ’.ge'ogfaphy course since junior high school would be exposed to an entirely" ditfeirept type of subject 'matter than that' which prevailed in the public schools 'tWol decades ago; this, in itself, would likely Be a revelation. 'I hpve taught eWning students a survey course on num'erous occ 'sio'ns, and oftfen .they literally marvel at the breadth of geog'raphy'S reach". In* addition ,,.,mahy Have* commented, sometimes with a twinge‘of pain, that they* can-6nly* .remehibeir the subject as coloring maps and memorising capi-fcal . ' ’ If 'this'i's .t!e„ perception of geography in the minds of Americans, then geographers cah strife At the
9.4
Itvety Weact these outdated notions by addressing the adults-directly, is fine to each the»"new" geography to full-time students and-see the^” .discipline benfit from improved status as this geneiation matures, yet a more immediate improvement in ‘our ima^e can probably be derived from the •judicious proselytizing of the non-rcollege age students.
A second contribution that might' emhnate from geography’s activist role in continuing education is a demonstration of the utility of the discipline in addressing contemporary problems. This approach assumes that a geographer will do more than just provide an overview of geography’s scope, .as wpuld be the focus of the first contribution. In this second case, a conrse would be' structured to provide insight to the various methodologies that geographers employ in their work and that are also useful in the everyday -world. In an evening class students were asked’to-map the lahd use of an -area and then focus on. the past, present, and future landscape assemblages, 5iy,®n various ..socio-economic and political scenarios.- Such a simple exercise csn easily he:paij,ayed into an exciting, evening of outright debate, which focasea upon-."the* spatial implications of societal activities. During the discussion a student vd:il usually ask the key question: Why doesn't thistype of- analysis occur in more decision-making arenas? This query provides the opportune moment to have students realize that while geographers can perfom these tasks, more informed citizens can also begin to ask pertinent questions of the various agencies and commissions that affect their lives. Hence, this type of activity yields the double reward of displaying geography’s analytical tools and helping the students to understand better the complexity of current issues.'
At this juncture, the reader may wonder how to get the "foot in the door' because if geography's image is as bad as most geographers believe, then the application of the marketing concept may yield a lack of desire for geography,_ -This problem may be resolved by close association with the personnel taking the- pulse of the community. Communication flow should be in two directions: 1) the geographer should develop some feel for the community^eeds and respond to them; 2) the geographer should provide the community with information about geography.
Initially, a,geographer may have to create a market through the use of the two types of courses commonly associated with a continuing education program. One group consists of the already existing credit courses.Probably a fair number of geography courses taught at the introductory level could be presented in modified form and become popular adult education of- fs^^iugs. Examples of changes that could be made include the use of exercises of 'the variety mentioned above and more emphasis on local and regional characteristics. Conversely, some courses may need no revision whatsoever, but nothing in the marketing concept prevents an 'instructor from making the package as enticing as possible or from using currently available courses, assuming a demand can be demonstrated.
The other type of continuing education course may be unfamiliar to a few geographers— the variable credit or non-credit variety that may last a complete semester or only a few weeks. These non-traditional offerings cause all sorts of problems such as forcing creativity in designing a useful product and distor.tlnga teaching load, to name only two. Problem one should not require a debate; either you are or are not interested in doing this type of work. The second poses more serious practical difficulties.For example, teaching load issues rise to the surface almost immediately:"How many students are necessary to offer the course?" "Do I have to teach this course outside my regular hours?" Colleges will need to re-examine past policies and procedures because the provision of different types of courses may require non-traditional guidelines. Inflexibility on the part
95

of the. &dini,ni.p.tjration adhering to a magic class size number may be un- realisli^Q'the first tijrte such a course .is'given, 0n the‘other hand, faculty may -have -to be flexible about the pay schedule. Ifr.the administration is -willing to allo.Wta'n innovative class with few "students then perhaps the instructor shpuld be willing to accept less than the nsusal feSy although this arrangement should be by mutual agreement. Perhaps a sliding scale -would-even, prove-to, be-better-and add an incentive factor.
.There j^onld .seem to -be an ample amount of leeway 'for' ComiSromise on all these issues if -faculty -members and administrators are both' sincerely interested in meeting the-wide range of interests of the groMng'^continuing eduqation sector. If, the administration views this area drtly 'as a moneymaking propojsftion and’ the fa'culty view it Jonly as a Way of preventing ,xetrenphmentthen both are being less than falx. * Collectively;,'colleges must recognize.- that an ever larger number xif students may fit the part-time mode, moi;e so-than the. full-time one. To trerat'this pdtjul'atidn-a's second- class citi.ze.ns will ,be to short-change a- vital segmeift' of -the MSetican popu- latio.n. Geogpraphers could benefit from involvement in cfontirttiilig education by using the-opppt;tunity t(y present the discipline's recent intellectual advanceme/its, agdri -thereby, furthering the cause *of improving geography' s public image.
REFERENCES CITEDt
1. L.F. Knamer, "Lifelong--Learning Comes of Age, pi’anning fbt Higher Education, Vol. 3 (February, 1974), p. 1.
2. C.O. Baker, and A,,D. .Knerr, ^'Continuing Education: -A Key Bay StateStudy," .Planning fort Higher Educatibn, Vol'.-.2 -(-December . . o. 1.“ , -V : 4 ^
3. W.A. Harper.y ";Is'Success Spoiling Community Colleges?"^ ConthlUhity and Junior College Journal, Vol, 46 •(December/January,~ l976T7^^7~2T
.. ' j '4. Notes from a F-acul-ty Workshop Northampton County T rea •Community CollegeAugust, 1974. v
r
?2
i *
O
2 ■*.
a,4'i
i
t
96
WIDOWHOOD. MARRIAGE MIGRATION-AND MARRIAGE PARTNER PREFERENCES IN COLONIAL TLAZAZALCA (MICHOACAN. MEXICO): 1*750-1800Leon I, 'Yacher
Syracuse tniversity ^
Spatial mobility in colonial Spanish America has been largely neglected by historical geographers. Kubler, tl), Mqllafe, (2] and Cook(3) have Remonstrated the'types'*of research that might be done. The potential significance of this aspect of historical population study has been pointed out by several scholars, including MorinC4) .dnd.Jloreno. Toscano.(5)
By conti 'ast, the literature on race mixture in Spanish America is abundant, as indicated by 'MOrnter's introduction to and overview of the to^ic.C61 Hoever, little is known of the geographical distributions of ragial groups, and even less of spatial patterns of racial mixture rates.The present case study deals with these two related topics and-uses'data on widowed.individuals from the parish archives of Tlazazalca in the colonial bishopric of Michoacan, west of Mexico City. These data were also 'employed elsewhere for a more general study of marriage patterns in Tlazazalca.(7)
' THE DATAThe information upon which this paper is based, was found in the
marriage registers (Libros de Matrimonies) of the parish archive of Tlazazalca. For the fifty-year period, 1750-1800, each marriage was coded according to the year, month and day o'f -the ceremony; the. place of marriage; the stated racial category of each spouse; their previous marital status; and their respective places of residence and' birth. The dependability of colonial records has been evaluated by numerous authors, perhaps most extensively by Cook and Borah, who determined that colonial records at 4Jie*parish level were generally accurate and thorough.(8) Complete'accuracy,” of course, is not to be expected because,, for example, common law marriage was practiced, most commonly by the lower social classes. (9)
There are three advantages to examining widows' preferences. First, since remarriages are related*to the frequency of widowhood, a ‘determination of the rate of remarriage in an area might enhance the study of-sex differentials in mortality.
Second^ remarriage -reflects calonial social custoffi , duch~as the degree of marriages between widowed persons and single individuals. Sex differentials^ in remar;riage rates might al.so shed light ojv sexual social bias.
Fipally, apd perhaps mo'st importantly, this^l^ne of inquiry might determine whether remarriage was a significant, indicator of, racif1 preferences, and a mean^ i>y whiph the lower social groups improved their social status. '
MARRIAGE PATTERNS' ,,•V f f X ►* In Tlazazalca, 11.1 percent of* all, males marrying .and 4.7 pgpcent of
temal'e^ marrying had been widowed,^prior to marriage- Table 1 shows the numbers of widows, by sex, for the four major raciaj. groups that were listed in the parish registers. The remaining racial groups had too few individuals
97

to he si,gni,fi.ca,nt. In each of the four principal groups, jijales jremajrried at a higher rate than f©tales: for Spaniards,^ an^ Mestizos, ,iii fact, the■ratfeg wefe greater than 2.5 to. 1.* For widowed and non-wjldotiiM ^artnets combined, however, Spanish brides outnumbered Spanish men' marrying in Tlaza- zalca (.Table 2). While Mestizo'men outnumbered the women of their own group by only 16 Cto produce a male/female ratio of 1.04), among widowed partners the same ratio was 2.77, with men outnumbering women By 23. Among the Mulattoes and Indians, the differences, although significantly different, were not as marked CTable 2).
TABLE 1RACIAL COMPOSITION OF WIDOWED RACIAL. PARTNERS
MALE FEMALE TOTAL
Spanish 184 69 253Mestizo 36 13 49ilulatto 21 13 49Indian 68 36 1.04TOTAL 309 131 440
TABLE 2 MALE/FEMALE, RATIO
.......-
*
RACE TOTAL POPULATION WIDOWED
Spanish' 0.94 2.67Mestizo 1.04 2.77Mulktto 1.07 ,1.62Indian 1.26 1.89
rRemarrying commonly was more accepted in Spanish'society’ for, men than
for women.(10) In fact, in Tlazazalca, 81.2 percent of widowers married single women/ whereas only 55.6 percent^of widoj/s married, single men.(11) These values are^much higher than those found'by Moi;ih in Zac^telcq, Mexico, Where abou't 50 pei'ceht of the widoWers'married',single womep,. and about 25 •percent of" the wi'dbws"married single men. (12) Although the differences between male and female rates are similar in both Tlazazalca and Zacatelco, the lower percentages may have resulted from the situation of the latter parish in a more densely populated region east of Mexico City, where the single individual's choice of a matq was in all probability much better than ih Tlazazalck. Another reason, however,, might have been.a higher death rate in Tlazazalca than fn Zacatelco. The effects of various deseases,6uch as smallpox, has been nbted by various authors.
98
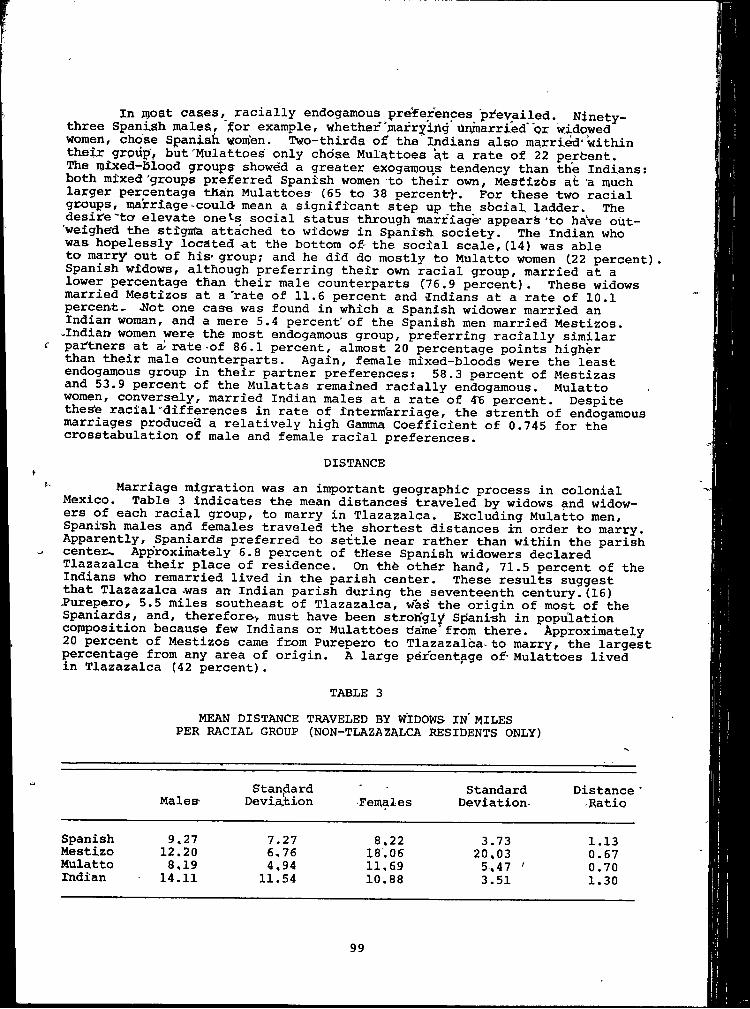
In ;iiost cases, racially endogamous preferences prevailed. Ninety- three Spanish males, ior example, whether‘mafryihg hiynarried'or widowed’’ women, chose Spanish women. Two-thirds of the Indians also married'within their group, but'Mulattoes only chose Mulattoes st a rate of 22 perfcent.The mixed-blood groups showed a greater exogamous tendency than the Indians; both mixed'groups preferred Spanish women to the’ir own, Mestizos at 'a much larger percentage than Mulattoes (65 to 38 percent-}*. For these two racial groups, marriage-could mean a significant step up the sbciai ladder. The desire'tor elevate one*-s social status through marriage* appear^ ‘to have out- 'weighed the stigirta attached to widows in Spanish society. The Indian who was hopelessly located et the bottom of- the social scale, (14) was able to marry out of his- group; and he did do mostly to Mulatto women (22 percent). Spanish widows, although preferring their own racial group, married at a lower percentage than their male counterparts (76.9 percent). These widows married Mestizos at a'rate of 11.6 percent and Indians at a rate of 10.1 percent.. Mot one case was found in which a Spanish widower married an Indian woman, and a mere 5.4 percent’ of the Spanish men married Mestizos. -Indian women were the most endogamous group, preferring racially similar partners at a rate of 86.1 percent, almost 20 percentage points higher than their male counterparts. Again, female mixed-bloods were the least endogamous group in their partner preferences; 58.3 percent of Mestizas and 53.9 percent of the Mulattas remained racially endogamous. Mulatto women, conversely, married Indian males at a rate of 4'6 percent. Despite these racial'differences in rate of intermarriage, the strenth of endogamous marriages produced a relatively high Gamma Coefficient of 0.745 for the crosstabulation of male and female racial preferences.
DISTANCEMarriage migration was an important geographic process in colonial
Mexico. Table 3 indicates the mean distances* traveled by widows and widowers of each racial group, to marry in Tlazazalca. Excluding Mulatto men, Spanish males and females traveled the shortest distances in order to marry. Apparently, Spaniards preferred to settle near rather than within the parish center-. Approxima-tely 6.8 percent of these Spanish widowers declared Tlazazalca their place of residence. On thb othdr hand, 71.5 percent of the Indians who remarried lived in the parish center. These results suggest that Tlazazalca-was an Indian parish during the seventeenth century.(16) Purepero, 5.5 miles southeast of Tlazazalca, was’ the origin of most of the Spaniards, and, therefore-, must have been strongly Sj ani-sh in population composition because few Indians or Mulattbes c'a'ine'from there. Approximately 20 percent of Mestizos came from Purepero to Tlazazalca-to marry, the largest percentage from any area of origin. A large percentage of*Mulattoes lived in Tlazazalca (42 percent).
TABLE 3MEAN DISTANCE TRAVELED BY WIDOWS- IN MILES
PER RACIAL GROUP (NON-TLAZAZALCA RESIDENTS ONLY)
Males Stan.dardDeviaihion Females
StandardDeviation Distance
Ratio
Spanish 9,27 7.27 8,22 3,73 1.13Mestizo 12.20 6,76 18,06 20,03 0.67Mulatto 8,19 4,94 11,69 5,47 ' 0.70Indian 14.11 11.54 10.88 3.51 1.30
99
. tJtjis not sjirpri-sing tha^-t^e m arj distances for-the Indians migraf ,.to JTla_^azal.ca .are higher than tho,a,e d4staoces.c(?f the Spani-arda, *. Fewer .Indians migrated, and tjiosq who did ha<f to come fjrpjfi settlements ■'farther f the immediate yicinity of Tlazazalc.%. The - distances displayed -Jay -.the tots population were similar -to those of-rsmarrie'i widows, except for the India .women, who migrated almos-t fivs mils® less thap, tle. mean distance., -This shorter distance for. Indian .widows, might stem from t ie, ,mal^e/female ratio
2j.: ithe, r.eady, availability of widowers or ..bachelors to the , ows vTOuld not |Jiavs fegud^ed- the -fndian, widow- to search .vefy far
from-her--jhome,, Kgr male coupterp.artIs .migraf-top-field .wasfappreCiably larg It he preferred a racially-endogamops, marriage,; the. Indain*widaWer in sear
generally had to. travel farther- than- an.ilndian widpw, because of the larger ratio of Indian.malesJto .females.Among Mesfjtza widows, the desire to r®iiain endogamous might have
mean distance, rjesfei-zos preferred Spanish women, to the, M®stizas., thereby mak-ing the search fore suitable-spouse lOfiher own' rac|.al-group, more difficult. Among Mulattoes^ th.e male hsd--littl&.iTeed to
could usually find a Spanish bride,^ whereas flulartte women who were not able .to marry their o.wn, married Indians.CONCLUSIONS
• .1. marriage partner ppeferepces and mean- distances, migrated to find a suitable spouse in colonial Tlazazalca, (Suggest that the special .sub- population of widowed individuals- preferred to mariy racially.rendogamously. xne mixed bloods, in most cases, preferred to marry socially upwards, to impove their own standing in., the rather closed society of colonial Tlazazal Proximity also played an important role in migration into the parish center Although Spaniards did not make. up.the majority of, the. Tlazazalca residents, their mean migration- distance was lower than those of the other-groups. Indians migrating constituted a small percentage of all Indians^-marrying in the parish center. Among the mixed-bloods, reversed pattefrns -eitfergCd, howevef. More Mulattoes than Mestizos lived in Tlazazalca, tiut.-their mean migration distances were lower,. The caupes may not Ete. jclear, Jaut'fpartner preferences might be,-responsible for the reversed results. ?
These .results are tentative-. Further .disaggregation and analysii^ of the .data a,? riecessary^ fo explain more fulf-y-the -patterns' found here,. (17)The exact. h®ture--and-,-&j»gnifiqance. of • widowhool can-;only, be hinted, at here. Howqver, given-the-Spanish .moral.-attitud^ to marriage, -ahd the relatively igh mortality- rates.,of; tile (period,' ft -fs -clear- that, widowhood -and ;temarria was a common experience. F-urfrjermqre, -ap examination of. variations through time should be illuminating. For example, an increase in-the rate cf remarriages could perhaps let us monitor the period when diseases hit the area creating the necessity for widows to search out new spouses. These and other topics are being considered as part of an on-going study of marriage migration in colpnial Michoacan.
ACKNOWLEDGMENTSThe .author, would like to thank Dr. Mark S. Monmonier and Dr. David J.
Robinson for their assestance in the earlier versions of this paper. Thanks also go to Mancye Lee Yacber for her hdfeful comments and typing of the paper in its various stage's’ and final form.REFERENCES CITED
1. George Kublef, "Population Movements in Mexico, 1520-1€00," Hispanic American Historical Review 22 C1942), p, 606-43. , ' ----
100

2. Rol^ndQ "The Importance of Migration in the Vlcerpyalty ofPeru," in Population and Economics, ed, P. Deprez CWinnepecf; University of Manitoba Press, 1970), pp. 303-313,
3. Shepborne Cook, "Migration as a Factor in the History of Mexican Populations Sample Data from West Central Mexico, 1793-1950," in Population and Economios, ed, P. Depre^ (Winnepeg; University of Manitoba Press, 19701, pp. 279-302.
4. Claude Morin, "Los Libros Parroquiales como Fuente para la Historia Demografica y Social Novohispana," Historia Mexicaha 21, (1972), p. 407.
5. Alejandra Moreno Toscano, "Econoraia Regional Y Urbanizacion; TresEjemplos de Relacion Entre Ciudades y Regiones en Nueva Espana a Finales del Siglo XVIII," Urbanizacion y Proceso Social en America (1972). no. 191-217. ------------- ---------------------------
6. Magnus MOrner," Race Mixture in the History of Latin America (Boston: Little, Brown & Co., 1967).7. Leon Yacher, Marriage Migration and Racial Mixing in Colonial Tlazazalca
(Michoaoan, Mexico), 1750-1800, Discussion Paper Series 32 (Syracuse: Department of Geography, Syracuse University [July 1977]).
8. Sherborne F. Cook and Woodrow Borah, Essays in Population History, vol.1 (Berkeley: University of California Press, 1971), pp. 1-72.
9. Idem. Essays in Population History, vol. 2 (Berkeley: University ofCalifornia Press, 1974), p. 176.10. Morin, "Los Libros Parroquiales," pp, 407-408.11. Yacher, Marriage Migration and Racial Mixing, p. 9.12. Morin, "Los Libros Parroquiales," p. 407.13. Nicolas Sanchez-Albornoz, The Population of Latin America: A History
(Berkeley: University of California Press, 1974), p. 118. ^14. MOrner, Race Mixture, p. 60,15. Yacher, Marriage Migration and Racial Mixing, pp. 10-11.16. Ramon Lopez Lara, El Obispado de Michoacan en el Siglo XVII (Morelia: Fimax Publishers, 1973), p. 102.17. Yacher, Marriage Migration and Racial Mixing, pp. 15-18s
101

A b s t r a c t s
i
fTHNIC CONSIDERATIONS IN URBAN'ECOLOGICAL FORM:„THE ,EXAMPLE OF HISPANIC-MERICANS,, IN THLHETBOPOLITAN'SOUTHWESTLawrence A. Herzog Syracuse University
signxficance of the Hispanic-Amefican population, whose presence .so dominates the fabric of contemporary.urban life in the‘Southwesternexplored ut'il.j.zing a traditional factorial ecology of two selected
^ tjLes. The persistence of an Anglo-Hispano spatial and cpi>om4,c bipolarity xs regarded as a viable conceptual, foundation upon which th§ ynigue jecological configuration of the American Southwestern metropolis'can be based.
THE EFFECT OF- LARGE-SCALE HOUSING DEVELOPMENTS ON*ABANDONMENTS " ' THE .CASE-OF’STARRElt: CITY ' 1' '. •Ralph L. Urrico arid Michael P. Marciiionx
Rutgers University and East Tennessee State University
For over two decades, the City of New York has witnessed the outmigration of much of its middle-class population, towards the perceived security and tranquility of suburbia. Large, middle-income housing projects have been xntroduced recently, as a means of trying to keep the middle- class within the city. These developments have had profound effects on neighborhood housing and migration patterns. One such development is the Starrett City housing facility in Brooklyn. Investigation of approved application data and resident questionnaires indicate that Starrett <City has attracted a high percentage of its applicants from the three adjacent tfansitionai neighborhoods of East New York, Flatbush, and F:ast Fla'tbush. Wxdspread abandonment and deterioration have bqcome more prevalent since the openxng of Starrett City in early 1975, particularly in East New' Yjjrk. Greater racial change and segregation have taken place in those areas of Brooklyn, which the City itself w.as trying to. save, and maintain.
MINING^AND MIGRATIONRolf Sternberg
Montclair State College
Mining and migration explores the interaction between these two
102
1
processes to identify consequences in terms of a working population's composition. Talent, individual mobility, migrant's s'ge, employment period, and souirce area of migrant are some of the key variables tO- be considered in this analysis. These characteristics are indicative of a population that is patterned initially for a specific purpose. Such an example may be instructive in evaluatiijg the development process in an empty area and serve as a benchmark against vdiich to record subsequent changes. ,
"Mining and migration" analyzes the migration patterns of a limited number of persons in a mining operation in ftmapa, Brazil. The process of change leaves its; imprint* upon the 'land'^ape ^ well' as upon social insti- tutions. The thrust thfe^^analysis emphasizes th^ population compositioa and) its migtation ;£ield' in the icoMi mSngafiese 'mining operations as of mid- 1976. By limiting the stu.dy in space and time, it may be possible to identify population characteristics that are part of the development proce^ in model format. ^
Resource utilization, "development," is not a particularly original idea. What is needed is a better demographic overview of who is involved in this kind of process at what level. The ICOMI'method of demographic accounting allows S systematic analysis of its lafior force and its dependents. Within ICOMI it serves as labor inventory and fo plan for local housing, health cate, education, apd social service'needs; for, these data are usefhl to elaborate a demographi'd development model.
The need for a demographic development model is particularly importai in the Latin American context because large areas remain to become part of the national economies. The ICOMI experience, with slight modifications, may serve other development schemes as model in the quest for economic in' egyat iont> In 'the case of Btazile the dhange§ ha^ their*}theater of action Organization in other afeap^ of Brazil and in Latin America on the threshold of comparable changes could'’study * the ICOMI practices and experiences to achieve projected chcUigeS more effectively.
SOCIAL AND SPATIAL DIMENSIONS OF ABORTION IN A CLEVELAND. OHIO SAMPLENorah F . Henry
State University of'New York at Binghamton
Spatiai dimensions of abortion information dissemination §pd sociodemographic characteristics of a Cleveland, Ohio aborting population are examined here. This study reveals a youthful, unmarried, moderate income, largely uneducated/ Protestant population, similar to other abortion studies. It further indicates great disparities in' flows of abortion-re- lat'ed 'information.
Concerning the abortion decision confidantes included the sex partne mothers, and friends. Clergymen, physicians, friends, libraries, and perso experience served as technique-oriented information sources. Abortion was desired because of marital, financial or educational status; other options were deemed inadequate solution. Interpersonal communication influenced abortion facility selection. Distance and time traveled were short.
103
WHERE WE^ARE-FROM OR'AN OVERVIEW-OF THE ORIGIN OF PH. D'S IN GEOGRAPHYJerry D. Geriach
‘ William Paterson College1
- Studies of th.e origin of Ph.D.'s in geography are relatively un-comnjon.' The. p4rpose :of the paper is to examine the recent origin of Ph.D.'s or professional geographers. The data source for the study was” The Professional Geographer from 1972-1977. Most Ph.D.'s in geography came from two areas, the Great Lakes states and the Far West. The areas that produced the fewest Ph.D.'s were the Mid-east and the Southeast. The major Ph.D. granting schools were in the Midwe^st, the Far West, the Mid-east, and New England. Additionally, there have been changes in the rankings of the major schools as school production rises and falls. The Ph.D. granting schools are now more widely distributed than they were in the 1960's. Finally, the actual number of Ph.D.'s granted in geography has declined since the peak year of 1974. This study indicates that geography in the U.S. will continue to have a Midwestern and Far Western flavor to it.
WALKING TOURS AND STREETMARKER SYSTEMS:-■ A'DEMONSTRATION PROJECT IN NEIGHBORHOOD GEOGRAPHY AND COMMUNITY EDUCATIONJohn C. Muir
Migh Pack Conservation Center, Staten Island
}’, A geijeral problem of the geographic profession Tias''-been a lacfc of
, suggess in popularizing its findings and communicating those 'findiriglb to .-ggnei’41 .audiences. -A pro ject in community‘education cartred obt in the Park Slope district of Brooklyn demonstrates methods to popularize and communicate a study in historical geography on the neighborhood scale.
The district, developed as an elite row house suburb in the late "J;l9€ i'cSnt;uryt. ■,'was p'e^gpivqd ,a's a ii^ng, ,4iusQurf— =-Qr .museum, >iithibtit walls— and three educational modes characteristic of museum programs were utilitzed self-guided walking tours, an illustrSatted guidebook, and a system of 200 informational^. Atteetitfarkers. Topics addressed included sequence occupance and landscape evolution, past environmental perceptions, and evolving social geography, and the- ecology of remnant natural elements. The target audience for the project was exceeded, numbering 2000 local school children and their .teachers, -and 200.0 jlocal ..adults.- , . ’
• . I s'.
tWINE AND-THE^WORLD: -A STIMULUS TO GEOGRAPHIC‘UNDERSTANDING*
Edmund B. Woods State University College, Broakport
This paper reports on a different method to teach geographic prin-

cipals. The principles of location, spatial variation, and areal relationships are ifttroduced'in ,a manner that is somewhat less,.than' exi>licit. The central focus of the class is the subject of wih© Cenology and viticulture). The strategy is to stress the many ways in which wine mey he directly associated with the physical variables of the environment. Geographic principles are pointed out as important relationships needed for understanding rather than as principles which all geographers recognize. This -method lets the • student have a feeling of discovery not always associated with the more traditional methods. The mystery of wine is believed to set up a desire on the part pf the, student to seek out explanations. Exploitation of that motivation is the method used here.
THE JAPANESE GOLF BOOMIf Charles A, Heatwole
P , University of New Xorky Hunter College
In Japan a growing environmental controversy centers upon a rather novel competitor for that nation*^s scarce rural land; the golf course. Although golf has been played in Japan since 1903 it has only become a major pastime within the last decade. Between j.965 and 1976 the .number of golf coufses gte^ irom 356*to 1246. This growth has led to conflict with municipfal and agricultural interests. The tendency,for gplf cburses to' cluster on the peripliery of urban areas has led to a decline in land available for new housing and .caused concern for the future availability of well water.. The impact on agriculture has-been manifested in the conversion of rice-producing acreage to the production of turf, and the wholesale transfer of land from farm to fairway. The total impact has been so severe that 35 of Japan's 46 prefectures have now enacted anti-golf land laws. However, golf's popularity continues to grow; and >the disproportionate political,-and-economic-clout of its enthusiasts jiiakes the iong6vity'and effec^ivenecss of current and future anti-golf, legislation'quite'tentative.
SNOWMOBILE ACTIVITY: -HISTORICAL TRENDS AND SPATIAL DISTRIBUTIONSi
Malcolm Eaxrweather j, State' University.'College, Hlvtttsburgh
The smowmobile industry ■ boomed during the 1960's but the present decade ushered in lean times. Predominantly a leisure oriented activity, snowmobiling is largely restricted to the northern regions of the U.S. with distinct concentrations in the northeastern and north central states where the combination of population density, high snowfall and long winters form the’e' de 'i'Sl ,ingfe^ienC§ 6f fhis spatial patpbrning, , |.-
•i
Special Sessions
THE..WATER RESOURCES OF LONG ISLAND:A CLASSIC CASE OF GEOGRAPHIC LIMITS -- -CHAIRPERSON; Leonard Zobler
Colur.bia University, Barnard College
{SUMMARY
As an essential non-substitutable* good available ii| Ji,mited amounts in urban areas, water is managed as a monopolistic social .utility to, injure its' equitable public distribution. The aim of government policy had been to provide a water supply that does not constrain development. While water is a basic resource input in all areas, in some places, as in Long Island, its supply is especially crucial because of peculiar relations among its uses and the natural and designed hydrologic systems.,
y ( 1 y HOn Long Island, in addition to its usual potable, manufactual, and
waste disposal functions, water also sustains a major part of the regional economy dependent on f-isheries and water-based recreation. Because of the peculiarities of.the local hydrologic cycle; especially the role of ground water, the various uses of water conflict with one another in ways that impair the integrity of the water cycle. The continued economi,c growth of Lpng Island thus is threatened by sel€-induced'water limits, unless ways can be tound to mitigate the counter-productive effeptp of the"Adversary claimants.
The various papers presented in this session will describe the behavior of the natural and disturbed hydrologic cycles, the social and technologic factors responsible 'for disturbance’,' the present and predicted impact levels, and possible avoidance measures.
I
The HVdro Logy of Long I slai^d
■5 Leonard ZoblerColumbia University, Barnard College
Tfie outstanding hydrologic* •feature-bf Lbng’lslahd is a yasL^^under ground wAter reservoir, estimated pojcontairi upwards 'of ^0 trillion gallons
106
of water, with a specific yield of ten percent. The boundaries of thd reservoir are the water table, surface lakes and streams, the underlying consolidated bedrock surface, and the fresh groundwater-salty aroundwater interface. Only the bedrock boundary is fixed; the others depend on the hydraulic balance -between inflow and outflow. Of particular interest are the falling water tables and the onshore movement of the fresh-salt water interface, or the intrusiofi‘of*'s'aflty ^rotmdwater.
The groundwater reservoir has s j; major vertically stratified hydro geologic units, whose extent, thicknessdepth, altitude and hydraulic properties affect ■jSt6tage,,imovem'ent', ' nd discharged Depth to the underlyi bedrock ranges frp^^bout iOO ,_-feet along'the,-northshore to 2000 feet along the southshore. tTfie*aquifer's at^ recharged'by infiltration through the overlying occupied surface, dip towajrd, the southeast, and, depending on the position in the column, contain unconfined and confined water tables.. Prior to 1900 the hydrologic system was in dynamic equilibrium withinflows balancing outflows along pathways whose total annual flux approxi- mated 45 inches of precipitation, per year. The expanding water demands of urbanization and accompanying land use changes have altered the pathways of water and drivq^ the system to -a transientgstate, in additibn to alterin the quality of* the. reservoir and..offshore-water, , <s .Umpacts are (described. Their gdhefal hydtologic
dt,.
WAfER Supply Management in Nassau CountyRussell A'.. Whi«te
City University .of New Jerk, Hunter Coliihe
. the pdst three decadest N^seau County has experienced the mostgrbwth ofthe twelve pounty core and iftner ring segments o tile New Yopk Metropblitan Region. The fourteen million people* o: ’'this'
urban Agglomeration have seldom been plagued by significant problems of potable water su^^ly. gredqgiinent feeling is that,, «f } pv "1 J O ihVA . *■® favors the.,New fXotk Metropolitan RSgioh with substantial reserves, and while, innovations such as cooling towers and desalinization equipment may augment them further, the available water supply within the area, or any of its parts, is more a function of the existing governmental machinery. Political negotiations'^ interpose themselves between the apparently straightforward tasks of locating and building reservoirs, constructing terminals and aqueducts, and completing distribution facilities."
. This simplisti(c approach to water supply in Megalopolis father han being uniquely found in Professor-Wood's otherwise highly respected Work, is typical. prevailing erroneous belief has deterred rational developmentespecially in the areas dependent" upon ground water.
Ten percent of the Region's population live in Nassau County. These people are completely dependent upon ground water for all of their fresh
There is no Region-wide operational plan to rationally integrate and manage ^prfacepand sub.-surfabe waters. There *i^'now shtficient data for at leasj: a signifigant..subgregional plan to'be* fbrmulateci an(3 ‘
107
iih p le ijien ted .
1 rational program may simplistically be divided into cultural and physical approaches. A successful program will employ both. Historically, in the United States, we look to technology rather than social action to
conservation problems. Adequate water can be provided for the residents and industries of Nassau County through purely physical approaches Such solutions will be higher cost if not coupled with Lciaracceptancr of rational use. There are at least six potential alternativertrlinino the ground w^ter reservpir. The most likely solution is the renovation Ind
repharge basins of waste water,. Another likely solution f>?ture js to import water from Suffolk County. In the more distant future, water might be imported from the surface water reservoirs
cfn^" i r o?"" possible solution t h a r L tecSnoSi-waiers A economically feasible, is desalinization of saliLwaters. A fifth solution would requ2,re major technological breakthroughsfe^sible^^tte°conv°^^^°'^’ solution is alsa ndt yet technOlogiLllyresivoir' conversion of Lpng Island Sound into a vast fresh water
Before- meaningful regional water planning can proceed or< succeed thegovernment within the coun?J m S s r S a S to work together or be organized into .one county-wide water board Honefniw
diLndan^^^®'^ Nassau Plan could, serve ap a model for other suburban areas aspend^nt upon- a ground water resource. -j
' ' IJ|rbAn La jd Us e and Hy d r o l o g i c D i s t u r b a n c e
Paul E. KingColumbia University
a Case, study to illustrate .the intricate, relationships between urbanization, water use and disturbance of the' recharge process. Urbanization is defined as the increase in population
concommitant sjyfead of t}ie built environ- historical development of the. area .is reviewed paying attention to the increase in population and economic activity and changes in water consumption. The pattern of development clearly reveals the importance of access to New York City. Distance from the city is a significant factor in explaining the time and intensity of growth. Superimposed on this band structure are a number of local growth areas centered on pr,e-existinq small
assesses the Significance’‘of tlie 1970 "Development Plan implemented by the Nassau and Suff^^k. Regional Planning Board in terms of Its impact on the form and speed of futur.e .urbanization. A conceptual model IS provided which relates growth in general to changes in both population anipolitical organization. These affect the demand for water and the
'^^ffe^ent ways. In addition to disturbing the process ground cpyer anj chapnel\zafion in catchment
t that-urbhq-iz.aiiop cqyld al^p bring expertise and a.manage- ethic which may hold the seeds of more pragriatic and efficient use of the water resource.
108
The I mpact of Wa s t e Wa t e r on Long I sl a n d
Gerald Palevsky City University of New York, City College
Yesterday’s sewage is tomorrow's drinking water! This is particularly true.for. Long .Island.
transpiration >to the atmosphere and the outflow from the subsurface reservoi bo the surrounding salt water area.
was mined' from the' ground water reservoir.. Wide spread construction and urbapiz.ation led to surface-water runoff diversion to the salt water areas. Septic tank effluents, storm water 'recharge basins, sanitary landfill leachate and industrial discharges became significant sources of ground water replenishment. The path from sewage to water supply was becoming very short indeed.
points of treatment, rather than direct discharge to the ground, has improved ground water quality. At the same time this action increased ground water withdrawal, lowered the ground water reservoir, and allowed salt water intrusion in many areas. The point discharge of the treated waste water effluents to surrounding salt water areas and the ocean dumping of the separated solids have produced, other problems.. Rqci^eational boating wastes, oil discharges, dredge' spoil dumping, thermal"polluflon and sewage sludge disposal by both Long Island communities and adjacent political subdivisions affect the recreational uses of the waters around Long Island.
control in the handling and disposal of solid wastes and sludge residues are changing the dreary picture. The use of reclaimed, waste, water to augment and safely replenish the ground water reservoir is now being actively undertaker!. Studies on acceptable, nuisance, free treatment n<3 utilization of solid waste and‘sewage sludges are also under way.,. The ppactipe of conservation, recycle and reclamation is .more than just a vision op-,Long Island— it is a necessity which is coming to friiitiori.
The northern coastrihe*'face 'one *of the largest inland seas within conterminous United States while the southern represent the northeastern leg of, the New ' 'I York Bight and the Atlantic Ocean.
While the geomorphological characteristics of Long Island tend to increase the number of different types of recreations! opportunities, the
Under ideal "natural" conditions, precipitation balanced the evapo-
Aa population densities and standards of living increased, more water
The use of sanitary sewers to collect and convey wastes to centralize'
Newer technologies, more intensive treatment and greater care and
Ma r i n e Rec'r e a t i o n On LoNa I s l a n d - Problemsoand P.r o s p e c t s
Niels' West University Of Rhode Island
T ^ t 1Marine based recteation On Long Island is unique in several ways.
109
island’s physiography has also resulted .in a certain .degree of spatial separation of these activities.. The increased marine related optportunities available on Long Island, the heterogeneous popul^tign oi) the island as well as in the neighboring New York Metropolitan’'area, has,resulted ih emerging user conflicts which are likely to intensify with time. These
ban ,be'divided into the following major classes.: t(l) -between recreational and nsDnrepreational usages (2) within coijpeting marine "recrea— tional actiyites and (3| among users engaging in t,he-ssh>& r^creat-ianal activity. These conflicts are' likely to intensify,' firAti'becaus'e o'f projected increases in leisure time and disposable income ,by a majority^'of the population and secondly because of private ownership of land facing the shoreline, and the inability to provide public access to the beaches. The paper assesses present and future supply and demand in shorebased outdoor recreational activities and facilities on Long Island in light of the Coastal Zone M^nagemenp^ Act of li7.2 and the New York ,Sta .tewid Compirehensive Outdoor Recreational Plan.
Long I s l a n d ' s F i s h e r y Re s p u r c e s :. •> Some P roblems i n . the .Ut i ’l i z a t i o n of De p l e t i n g Renewable Re s o u r c e s
Paul I. MandellColumbia Vnivevsity-, Barnard College
„ ."C, . In tire'Long Is'lancf'Sound and hdjapen't v^at rs expanded, fishery utiliza- -tio-n *and-"the environmental consequences of .urban-industrial’growJ:h come into direct conflict. Now and in the past the carrying capacity of the area's fish,erie_s has suffered severe .dqple^ion .from chemical and biological contam- inantsv' iyitepvphtions in, the hydrologic regime and large-j§cale.>5fioditfications of bathym'et;ric_ and topggrhphip features, .resulting fxom the_,§teady expansion of- residential and industtial activities. This paper considers the extent of thd losses that environmental spi-llovers have imposed upon Long Island's fisheries in the past, the present threat that they pose and certain problems peculiar to the management, of depleting, renewable .resources.
_We* begin by teviewing the'extent^,to which in the past Lqng Island’s fisheries have suffered develgpmfent-induced depletion! Next fo.llows a review of the status of presently exploited" fisheries.' Its emphasis is upon current assessments of existing env^rgnmental threats to their P^o^'^ctivity. Finallywe develop dynamic! Schaefer-type model of the utilization of a fishery suffering depletion due to environmental spillovers and apply this model to the Long Island Sound.oyster fishery..
A Re g i o n a l Analog Hy d r o l o g ic Mo d e l of Long I sl a n d
Grant' Kimmel tJ.S. Geological Survey
The effect of planned sewerage and recharge with reclaimed waste water on the ground-water reservoir on Long Island was evaluated using a
110
I
three-dimensional electric analog model. Population changes, the extent of pro'posed se'wer construction programs, and the volume of expected sewer oubfarr werd u§ed a^ a basi§ 'for stressing the system, for a 20-year period .starring in 1975. Wafer-table declines of up to 5 metres in east-central Nassau Cohnty and 1.8 metres in central Suffolk County were predicted. 'Simulated recharge 'with the expected volume of sewerage was treated in several different patterns starting in 1955. Considerable overrecovery was predicted in ithe middle-c5f the island, but'only partial recovery qf the water table was -predidted in nearshore d'reas alqng the s,outh part of Long Island.* "Predicted streamflow was below the 197 5 average in south-shore steams by 2015, the end of -the modeled period.
Pr e s e r v i n g Pr im e Fa r m l a n d : The S u ffo l k County .Program
David NewtonSuffolk County Cooperative Program
Faced with the steady conversion o'f prime farmlands to non-agricul- , tual, primarily iresidehtial,' uses over the' past three decades,* Suffolk Count| officials have instituted a unique farmland preservation program involving ' the voluntary purchase of development rights. The goal of this program is to save at least 12,000 acres of prime farmland.
Suffolk is New York State's leading agricultural county. Major crops include-potatoes, sod, vegetables, nursery stock, flowers,, and ducks. Over’ half the land" is owned hy non-farmers. The market value of-jfarmJand-ranges upward from $3,500 per acre.
The County's program, developed by a 14-membex ^Vgricultural Advisory ; Committee, Is'baled on Section 247 qf^TIew York's General Municipal Law and i haB'been a\lth6ri;ied by the County Xegisla'fure tinder Local L^w Mo., 19 of 1974. The County has earmarked $60 million* in the capital program ..to purchase development rights over the next four years•
The County solicit! offers from farmland owners. These bids are evaluated and lands not meeting^certain criteria are rejected. Appraisals are made to determine the value of development rights. If the county and owners agree on price, contracts* are signed.
The purchases are financed by ^O-^year municipal bonds, the sa\e of which must be approved by the COjipty Legislatupe.j
The 'initial purchases in the program incompassing 3,800 acres, were scheduled to take place during the summer 1977. f
The program, the first of its type in the nation, has been plagued with political, financial, and adminis^trative difficulties. However, its benefits environmentally, economically' and socially are expected to be substantial.
Ill

Future Exo g enous S o u r c e s of Wat e r for Na s s a u and S u ffo l k
.Co u n t y Long I sl a n d
Robert M. HordonRutgevs, The State University
In terms of water supply planning, Na'ssau and Suffolk County in Long Island constitute one .sub-region of the New York Metropolitan Region. The two counties are entirely dependent on local ground water as a source of supply for the population of over 2.5 million. Consumption of over 255 million gallons per day is approaching the so-called "permissive yield" of the aquifers, especially in the more densely populated Nassau County.Indeed, water supply need projections by the Temporary State Commission of New York. S-ta.t®' indicate a substantial deficit by the year 2020. This need for addition,al water may be accelerated in time by continued water quality deterioration as evidenced by increasing nitrate levels (attributed td'septic s'ys'tenjs and lawn fertilizers) and salinary intrusion. Consequently, consideration is being given to a variety of projects which can supplement or replace existing local supplies. * Briefly, alternative sources include:1] importing w^ter from the Hudson River via an expanded New York City system; *2) -cpnver'y.ng T<ong Island Spund, into a. fresh water'reservoir; and3) de’saliniz'ation."' As of now, tl e most reasonably alternative appears to be the purchase of surface water from New York State in conjunction with a proposed ground water exchange program with New York City during certain seasons.
The contribution of each of these exogenous alternatives will be systematically evaluated with regard to its technologic, economic, and political feasibilities as a potential solution to Long Island's predicted water deficiencies.
ISSUES IN GEOGRAPHIC EDUCATIONORGANIZER AND CHAIRPERSON: Arlene Rengert
West Chester State College
SUMMARYThis special session included the following papers: "Where Are We
From or an Overview of the Origin of Ph.D.'s in Geography," by Jerry D. Gerlach,(1) William Peterson College; "Implementing Program Change: SomeImplications for a Geography Department," by Charles W. Grassel, West Chester State College; "Academic Geography Outside the Classroom: Interns andCommunity Service," by F. Robert Bielski, West Chester State College; "Geography's Role in Continuing Education," by Robert Ziegenfus,(2j Rutgers, the State University; "Defining the Issues in Geographic Education," by Janice J. Monk, University of Illinois; "Student Use of Statistical Mapping Under Time Sharing," by A. Rees Clark, (2) Colgate University; "Walking Tours and Street Market Systems: A Demonstration Project in Neighborhood Geographyand Community Education," by John C. Muir,(l) High Rock Park Conservation
Center, Staten Island; "Wine and the World: A Stimulus to GeographicUnderstanding, by Edmund B. Woods,(1) State University College, Brockport
APPLIED GEOGRAPHY: SOME EXAMPLES AND IMPLICATIONSORGANIZER AND CHAIRPERSON: Martha L. Corry
State University College, Oneonta
SUMMARYThis special panel session included the followinq papers: "Decenta
izing Police Services: A Feasibility^ Study of Syracuse', New "York,byRalph Sanders, (2) Syracuse University; "Geocoding by the U.S. Censui Burea The Evolution of the GBF/DIME System," by Joel Sobel, Gedgraphy’ Division, U.S. Census Bureau; "The Schoharie County Cooperative Program: A CaseStudy in Applied Geography," by Paul *R. Baumann', (2) State University Colie Oneonta; "Implications of Applying Geography," by John -VJ. Frazier, (2)State University of New York at Binghamton; "Concluding Remarks'," by Sarah Myers, American Geographical Society.
1. Abstract published.2. Paper published in its entirety.
113
INSTRUCTIONS FOR PAPERS PRESENTED AT ANNUAL MEETING OF MIDDLE STATES DIVISION. AAGprogram committee for the annual meeting of the Middle Sta<-<=<5
Diyrsxon, AAG, invites members of the Division to preparfaS suLi^ papersof geographical research and are likely to command the attention of a substantial number of fellow geographers Papers bv aradnat-^
and undergraduate students are particularly IncLraSel! AirpSpeS l S S ? « d must be in accordance with the following speqifications: ^ ^ emitted1)
5)
joiSt^JCthSr^ present more than one paper, either as sole or
8 ?°^^l®-spaced original copy of the paper, on standardidentical^copv'^of^Jh^ f bond-quality paper,- and one additional laentical copy of the full paper must be received.
P®P®^ to be eight A double spaced, inaluding references cited,wiih «a h of bibliographical footnotes are permittedwith each article, bub informational footnotes cannot be accepted. Papers exceeding eight pages may not be accepted.
4) The heading for the paper should begin in the upper left-hand corner of the first page, 1-1/2 incLs from the ?op anfleff hand margins, in the following format: title of paper (all
author (caps and lowercase, two lines below affiliation (caps and lowercase, two lines below the name of the author). The main text of the paper should
tion" * ® at^dress or affilia-marai-n of ^® Indented 1-1/2 inches from the left-hand
I? P®P®^' least 1 inch from the right-hand margin,of' ono°' a with paragraph indentation. Center headings,one oJ der only, should be typed entirely in uppercase letters??no^o? ^ ' ®® lines below the lastline of the paragraph which precedes them.Authors who wish to cite references in the text should use a raised numeral following the passage to which it refers. All references should be listed in numerical order under a centered
REFERENCES CITED," following any "ACKNOWLEDGMENTS" the paper. Turabian (4th ed., 1973), excluding
chapter 12, should be followed as a guide to all references.^ Examples:a) Books; Kate L. Turabian, A Manual for Writers of Term
Papers, Theses and Dissertations (Chicago: Universityof Chicago Press, 1973), pp. 78-124.b) Journals: Richard L. Smith, "Reality in Reapportionment,"
Pol^tvoal Annals 52 (January 1972): 412*37.c) Documents; U.S., Department of Commerce, Bureau of the
Census, United States Census of Population; 1960, vol.l, Character-Lstics of the Population, pt. 6, California.
114
6) All essential tables''and/or blacK-and-whl’te line 'drawings (such as maps,, o: graphs) must'be submitted in a format suitable for publication without further processing, preferably as photographic reproductions (positives) or original line drawings with maximum dimensions of 5 by 8 inches. Titles
> should-be placed abovd fables and below line drawings.n,
7) > .Abstraot: A separate one-page double-spaced abstract no longerthan 250 words will be submitted with the paper. It 'shoiild begin with the word "ABSTRACT"’ aUd should be a positive, factdal statement of the substantive‘Content of the paper.
8) Visual-aid requirements and other requests'for equipment mustbe submitted with the contributed papers ’even if only to say that the■requirements are nil.
-9) Accepted’ pa’pers may be published in the Proceedings, but no guarantee of publication dan be offered. Final'decisions on papers to be published will be made by the Proceedings
■ Editorial Review Committee'. Abstracts will be published of those papers not accepted in their enfirpty.
10) The Prd'gram Committee. asks that authors not send material under consideration for publication in the Proceedingsto any other journal or publisher until a decision on the paper has been reached. ' ’
11) Papers and special session proposals should be submitted by 15‘‘July to the incoming President Middle States Division.
/
. 115