Scaling Solar Solar Power financing for private sector ... · Solar Power financing for private...
52
Scaling Solar – Solar Power financing for private sector projects in Emerging Market Karsten Fuelster Country Manager for Germany Austria and Switzerland Hamburg 25-26 April, 2017
Transcript of Scaling Solar Solar Power financing for private sector ... · Solar Power financing for private...

Scaling Solar –
Solar Power financing for private
sector projects in Emerging Market
Karsten Fuelster
Country Manager for Germany
Austria and SwitzerlandHamburg
25-26 April, 2017

2
•2

3
What Is Scaling Solar?
Scaling Solar is a “one-stop-shop” solution for governments to procure grid-tied solar PV rapidly, competitively and with lower transaction costs
First implementation in Zambia was “proof of concept”
Bringing global solar trends to SSA countries (lower tariffs driven by competition)
Scaling Solar: a suite of WBG services/instruments under a single umbrella
Competitive, transparent procurement
WB sector engagement
Standardized, balanced contracts
Competitive financing and risk mitigation instruments (WB Guarantee and PRI)
“Packaged” approach
The challenge:
Large, unmet demand for electricity in SSA
Market scale and high perceived risk
Procurement (delays & uncertainty)
Lack of competition and high transaction costs
The opportunity:
Good solar energy endowment in SSA
Solar PV is quick to build and cost-competitive
Private investors’ interest
A Market Failure – creating an Opportunity A WBG Solution: Scaling Solar

4•6•4
●
●
●
●
●
●
●
●

5
How Does It Work in Practice?
Project Preparation
Tender Process & Award
Construction
& OperationBid Preparation
1 2 3
Financial Close
4 5
• Technical and economic analysis for optimal size and location of PV plants
• Site investigation
• Legal & regulatory analysis
• Standard tender documents
• Standard project documents
• Attachment of stapled financing, insurance and credit enhancement
• Request for qualification
• Bidder consultation
• Request for proposals
• Proposal review and award
• Signing of project documents
• Finalization of equipment,construction and operation contracts
• Final project approvals
• Finalization of loan agreements, insurance and risk management
• Construction
• Commissioning
• Operation
6 to 12 months 6 months 6 months
• Several WBG instruments brought together under a single product offering
• Client governments would engage in a single mandate to access the “one-stop-shop”

6•7•6

7•7

8•12•8

9•9

10
What Have We Achieved So Far?
• Broad market recognition in Africa: 1,000 MW+ under development, 5 mandates in 4 countries (Zambia x 2, Senegal, Ethiopia, Madagascar) and active discussions in many more
• First implementation in Zambia validated concept: lowest tariff in Africa to date, faster than anywhere else on the continent
• Strong momentum to roll out outside of Sub Saharan Africa (e.g. Tunisia, Afghanistan, Cambodia…etc.)
Ethiopia
Kenya
Mandated
In Active Discussion
Zambia
(Up to 600MW)*
Senegal
(Up to 200MW)Nigeria
The Sahel Region
“These are the lowest solar power
tariffs seen to date in Africa, and
among the lowest prices for solar
anywhere in the world – a game
changer for Zambia and other
countries in the region facing
electricity shortages”
- PV Magazine, Jun 15, 2016
“[The Scaling Solar Program] reduces risk to
investors with a suite of guarantees…the IFC
offers low-priced loans; the World Bank
guarantees that governments will buy the power
generated by the projects; and the group's
Multilateral Investment Guarantee Agency offers
political insurance in case of a war or civil
unrest.”
- Scientific American, Nov 2, 2016
Madagascar
(30 – 40MW)
Ethiopia
(Up to 500MW)
“The drive to create new markets will
also require new guarantee instruments
and a sharp focus on programmes that
can be scaled for maximum impact. The
World Bank Group’s Scaling Solar is one
example.”
- World Economic Forum, Jan 11, 2017
“Senegal follows Zambia in
joining WBG's Scaling Solar
program”
“The effort will bring a
needed injection of
electricity to Senegal, where
just over half the population
has access to electricity”
- Bloomberg, Feb 10, 2016
* Including Zambia Round 1 of up to 100MW and Zambia Round 2 of up to 500MW, with first phase of up to 200MW
Kenya
Tanzania

11
Scaling Solar Tender Results in Zambia
6.0c/kWh non-indexed is equivalent to an average in current dollars over contract life of 4.7c/kWh
Neoen Site Enel Site
Neoen / First Solar 6.0150 6.1350
ENEL Green Power 7.7989 7.8390
Access / EREN Zambia 1 8.2879 8.9509
MULILO Zambia PV1 Consortium 8.4000 8.4000
EDF Energies Nouvelles 10.0400 9.9850
SEP / AVIC Intl 10.6000 10.6000
Projects were developed and tender was prepared and executed to conclusion in 9 months

12
Scaling Solar in Zambia
Quality sponsors, competitive tariff and speed of implementation
• Round 1: 76MW from two winning bids
• Round 2: up to 500MW (planned) with the 1st Phase of 200MW just launched
• WBG value-added:
• IFC Advisory
• WB guarantees and sector engagement
• IFC Financing: IFC A loan + IFC-Canada Climate Change Program financing
• IFC mandated lead arranger for balance financing
Round 1 Location Round 1 Highlights
Winning Sponsors(selected out of 48 bidders)
Neoen + First Solar
Enel Green Power
Tariff US¢6.0/kWh US¢7.8/kWh
Size 48MW 28MW
Time to Market
• Launch of prequalification – Oct. ‘15• Bid submission and selection – May ‘16• PPA signing – Nov. ‘16• Financial close (expected) – Apr. ’17• Commercial operation (expected) –
Dec. ‘17

13
Name Title Phone Numbers Email
Karsten Fuelster Principal Investment
Officer
+49 69 74348250
+49 170 90 22 605
THANK YOU!
FOR FURTHER INFORMATION CONTACT:
Webpage: www.scalingsolar.org

IFC’S ACTIVITIES IN THE
POWER SECTOR

Table of contents
IFC in the Power Sector – Overview
IFC’s Track Record in the Power Sector – Regions and Projects
IFC’s Track Record in the Power Sector – Power Sub-Sectors
IFC’s Value-Add in Power Transactions
16
25
31
38

16
IFC in the Power Sector
Overview
16

17
IFC Power SectorIFC is a Leading Investor in the Emerging Markets Power Sector
• IFC’s FY2016 Power gross commitments amounted to US$2.0 bn (9% CAGR since 2012)
• IFC’s FY2016 Renewable Energy* gross commitments amounted to US$1.0 bn (53% of IFC Power)
IFC Invests in:
• Generation – 40,000+ MWs to date
• Transmission – 13 investments to date, including financing of greenfield private transmission assets
• Distribution – 36 investments to date, reaching > 160 million customers
• Early stage start ups in the renewable energy space
• Financial intermediaries (banks, PE funds) who reach smaller assets/companies
• Platforms, HoldCos and sub-sovereign entities with regional or global footprint
Note: All Renewable Energy Generation and Energy Efficiency projects are accounted for
17

18
East Asia & the Pacific
1%
Sub-Saharan Africa35%
Europe & Central Asia
25%
South Asia15%
Middle East & North Africa
24%
FY2016 Power HighlightsIFC Gross Commitments of US$2.0 Billion
Solar Generation
9%
Wind Generation
13%
Hydro Generation
9%
Thermal Generation
57%
Other (Holding Companies, Distribution)
12%
Note: IFC year-end is June 30th
FY2016 Commitment Activity: US$2.0 billion invested, including US$850 million for IFC’s own account and
US$1.1 billion of mobilization
FY2016 Power Commitment Activity by Region
(incl. mobilization)
FY2016 Power Commitment Activity by Sector
(incl. mobilization)
18

19
Latin America & the Caribbean
21%
East Asia & the Pacific
8%
Sub-Saharan Africa15%
Europe & Central Asia
20%
South Asia17%
Middle East & North Africa
19%
FY2016 Power HighlightsIFC Committed Balance of US$5.8 Billion
Solar Generation
12%
Wind Generation
15%
Hydro Generation
22%Biomass and Geothermal
3%
Thermal Generation27%
Distribution8%
RE via Funds/FIs/Hold Cos9%
Other (Holding Companies, Utilities, EE)4%
Note: IFC year-end is June 30th
Total Committed Balance by Region
IFC Power
Total Committed Balance by Sector
IFC Power
FY2016 Committed Portfolio: US$5.8 billion of committed debt and equity as of June 2016. Power
represents 43% of US$13.4 billion committed debt and equity in all Infrastructure
19

20
Far-reaching experience arranging and financing complex power projects worldwide
IFC’s Global Power Footprint
Select power projects recently financed by IPP across the globe*
Turkey EnerjiSA $990 mLender / Arranger,
2008, 2011
Georgia Shuakhevi $284 mLender / Arranger /
Investor, 2015
Iraq MGES Power $375 mLender / Arranger /
Investor, 2016
Turkey Akfen Energy $100 m Investor, 2016
Europe / Middle East
South
AfricaAbengoa CSP $413 m
Lender / Arranger
2012, 2015
Nigeria Azura $276 m Lender / Arranger, 2014
Senegal Cap des Biches $100 mInvestor /
Arranger, 2015
Africa
Region
Mainstream
Africa$23 m Investor, 2016
Africa
Asia
India Ostro Energy $180 mLender /
Arranger, 2016
PakistanChina Three
Gorges$125 m Investor, 2015
Bangladesh United Power $21 m Lender, 2016
*Amounts represent total financing committed and mobilized by IFC
Panama Penonome $300 mLender /
Arranger, 2014
Honduras SunEdison $147 mLender /
Arranger, 2014
Costa Rica Reventazon $100 m Lender, 2014
Mexico Aura Solar $75 mLender,
Arranger, 2014
Latin America
20

Global clients are half our business
• We have long-term partnerships with key clients
• We have been partnering with renewable energy companies
expanding into emerging markets
• We help clients access capital at project, holdco and corporate
levels and via capital markets
“Local” clients are becoming regional / global
• Local power companies invest in their own country
• Local power companies expand into other emerging markets
• Local industrials expand into the power sector
• Our local clients are becoming a larger share of our business as
market reform increases opportunities for private investment in
the power sector
We work with emerging renewable energy companies
• We have supported newly started local renewable energy firms,
as they begin to build their first projects
We work with sub-sovereign entities and governments to create
vehicles for private participation
21
IFC’s Clients in the Power SectorDiverse Clients Trust IFC as a Power Sector Partner
21

• Developing countries have a clear need to power economic growth and to improve the quality of life of their citizens (e.g. access
to lighting and communications)
• Need to diversify generating sources and where possible, deploy indigenous power rather than using foreign exchange to
import fuel
• Climate change and environmental concerns tied to use of coal, gas and oil fired power generation persist
• As capital costs decline, solar, wind and other forms of renewable energy present increasingly attractive opportunities for private
investors in emerging markets
IFC’s Case For RenewablesFueling Growth and Combating Climate Change
IFC’s Commitment Activity in Renewable Energy
3
22

The Asset
2016 Best Energy/Renewable Energy Deal of the Year – Gulpur - Pakistan
2016 Best Energy/Renewable Energy Deal of the Year – Tenaga Generasi - Pakistan
African Banker Awards
2016 Infrastructure Deal of the Year – Azura Edo IPP (nominee)
2013 Deal of the Year – Umeme - Uganda
Infrastructure Investor
2015 Middle East Deal of the Year – Jordan Seven Sister
Middle East Solar Industry Association Awards
2014 Commercial Advisor of the Year – 7 Solar PV Projects - Jordan
Project Finance International
2014 Global Multilateral of the Year
2013 Latin America Power Deal of the Year – Alto Maipo - Chile
2013 Latin America Solar Deal of the Year – San Andres – Chile
Infrastructure Journal
2015 Asia Pacific Hydropower Award – Gulpur - Pakistan
2014 IJGlobal Middle Eastern Renewables Award
23
IFC’s Track Record in the Power SectorRecent Award Winning Recognition from the Market
•2323

24
From Patient Equity to
Long Term Debt Sector Expertise
Country Risk
Mitigation
Environmental &
Social Risk
Management
Advisory
Services
EQUITY
Up to 20% in project or
company
Start-up equity / co-
developer (IFC
InfraVentures)
SUB-DEBT
Terms tailored to meet
project needs
DEBT
Long Maturities Tailored
to Project Needs
Fixed/Floating Rates,
Local Currencies
Flexible Amortization
Profile
Syndication/Mobilization
from commercial banks
and DFIs
Deep sector
knowledge gained
from experience
In-house
Engineers:
In-house Market
Expertise
In-house
Regulatory
Expertise
Government
Relations
Neutral broker
Role
World Bank
Synergies
Partial Credit
Guarantees
(PCG)
MIGA
Coordinated
approach
across WBG
services
• MIGA PRI
• IDA PCG
Environmental and
Social Best
Practices
Equator Principles
Modeled after IFC
Standards
Governance
Private sector
perspective to
governments
Introductions +
matchmaking
Cross-border
support + Sector
knowledge
Access to Donor
Funding/Con-
cessionary
Support
Coordination/Car-
bon Finance
Programs to
assist client,
including: Local
Supplier
Development,
Corporate
Governance,
Community
Development
Funding
IFC’s Value-Add in Power Transactions
24

25
IFC’s Track Record in the Power Sector
Regions and Projects
25

• 2015 First platform company investment with a Chinese SOE going outside its
market (CSAIL, Pakistan)
• 2012 First smart grid investment (Kalkitech, India)
• 2011 India's first private transmission company (Powerlinks)
• 2010
• First international commercial bank project financing for wind in China (CWP)
• Early stage equity solar investments in Thailand (SPC)
• 2009
• Pre-IPO equity investment in partially privatized vertically integrated
geothermal company, with subsequent corporate loans in the Philippines
(PNOC-EDC)
• First grid tied solar PV investment in India (Azure)
• 2007 First IPPs in country (Magat Hydro - Philippines)
• 2006 First private small hydro in China (Zhongda)
• 2005 First merchant/quasi-merchant hydros in India (Allain Duhangan)
• Local currency: First power project in local currency by a multilateral in China
(Guangzhou Development Industry Holdings, 2005)
26
IFC’s Track Record in the Power SectorPioneer Investments in Asia
26

27
Ostro Energy (India): Renewable platform company promoted by Actis, which is building two
wind farms with an aggregate capacity of up to 197.4 MW, in the state of Andhra Pradesh
India. Actis is well-known to IFC. Together they have 8 co-investments globally across sectors
with a strong pipeline of projects.
Azure Karnataka (India): Three greenfield solar power plants of respectively 40 MW, 50MW &
40MW in Karnataka, India under a 25-year PPA. This project is part of a government of
Karnataka solar program with a target of installing 2,000 MW of private sector solar projects by
2021. IFC has an existing relationship with Azure through equity and debt investments.
FRV Solar (Jordan): 50MW solar PV power plant developed by Fotowatio Renewable
Ventures B.V. The project is amongst the four that have been awarded under Round II of the
solar energy EOI process that was initiated by the government of Jordan. It follows last year’s
successful investments by IFC in 7 projects in the country (‘Jordan Seven Sisters’), which
represented 90 MW of the 200 MW capacity awarded under Round I.
Jordan
IFC: US$ 21.2 mn
Mobilized: US$ 25.6 mn
Feb 2016
India
IFC: US$32 mn
Mobilized: US$82 mn
Dec 2015
India
IFC: INR 4.0 bn
Mobilized: INR 12.0 bn
May 2016
IFC’s Track Record in the Power SectorRecent RE Investments in Asia
27
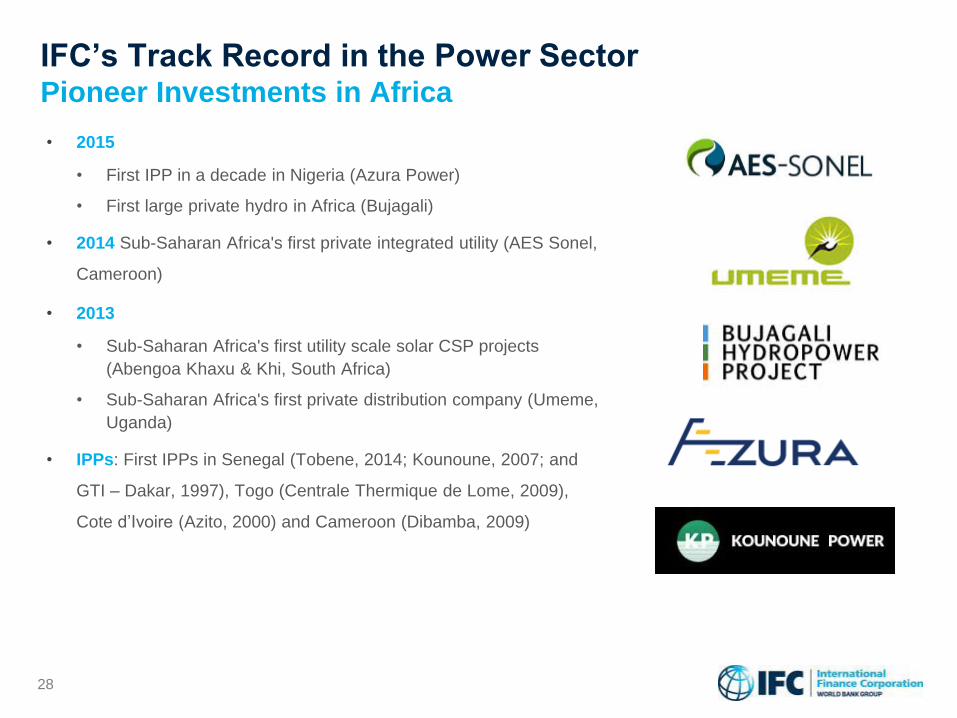
• 2015
• First IPP in a decade in Nigeria (Azura Power)
• First large private hydro in Africa (Bujagali)
• 2014 Sub-Saharan Africa's first private integrated utility (AES Sonel,
Cameroon)
• 2013
• Sub-Saharan Africa's first utility scale solar CSP projects
(Abengoa Khaxu & Khi, South Africa)
• Sub-Saharan Africa's first private distribution company (Umeme,
Uganda)
• IPPs: First IPPs in Senegal (Tobene, 2014; Kounoune, 2007; and
GTI – Dakar, 1997), Togo (Centrale Thermique de Lome, 2009),
Cote d’Ivoire (Azito, 2000) and Cameroon (Dibamba, 2009)
28
IFC’s Track Record in the Power SectorPioneer Investments in Africa
28

• 2016 First equity investment in a CCGT asset in Iraq (Unit Investment)
• 2015
• First equity investment in Turkish power sector (Gama Enerji)
• First privately financed grid connected solar PV projects in MENA, innovative
structuring approach to simultaneously close seven separate deals (Seven Sisters
program, Jordan)
• 2013 First private distribution company in Pakistan (Karachi Electric)
• 2012 First internationally financed wind IPP in Pakistan (Zorlu)
• 2011
• First transborder power export project from Georgia to Turkey (Paravani)
• First wind project financed under a market based support mechanism (EDPR
Romania)
• 2009
• First wind farm project financings in Bulgaria (AES)
• First international commercial bank project financing for wind in Turkey (Rotor
Elektrik)
• First hydro IPP in Pakistan (84MW Laraib)
• First electricity disco privatization in Jordan (EDCO)
• 2008 First merchant plant financing in Turkey (Enerjisa)
29
IFC’s Track Record in the Power SectorPioneer Investments in EMENA
29

• 2015
• The largest wind farm in Central America (Penonome, Panama)
• First private wind farm in Jamaica (BMR Wind)
• Largest solar PV plant in Latin America and largest merchant solar PV plant in the world (Luz del Norte in
Chile)
• 2013
• First utility scale solar PV project in Mexico (Aura Solar)
• First IPO of a Brazilian private power company (CPFL)
• 2011
• Landmark geothermal project financings in Nicaragua (San Jacinto)
• First wind farm project financings in Mexico (Eurus and La Mata-La Ventosa)
• Merchant HPP: First merchant/quasi-merchant hydros in Chile (2007 Hidromaule and 2005 La Higuera)
• IPPs: First IPP in Mexico (Merida III, 1998)
• Transmission: Lender to first privatizations in Peru (ISA, 2002), Bolivia (TDE, 2002) and Chile (Transelec, 2003)
• Local currency: First power project financing in local currency by a multilateral in the region (Brazil)
30
IFC’s Track Record in the Power SectorPioneer Investments in Latin America
30

31
IFC’s Track Record in the Power Sector
Power Sub-Sectors
31

32
IFC Experience:
105 investments with a total capacity of 23,000 MW. Latest projects include:
Nigeria
Azura Edo IPP 450 MW
OCGT plant
US$80 mn debt
US$178 mn mob.
2015
Bangladesh
Bibiyana II 341MW
CCGT plant
US$75 mn debt
2015
Iraq
MGES Power 500MW
CCGT plant
US$250 mn
debt&equity
US$125 mn mob.
2016
Senegal
Tobene 96 MW
HFO fired
US$38 mn debt
US$87 mn mob.
2015
Senegal
Cap des Biches 53MW
HFO fired
US$9 mn equity
US$91 mn mob.
2016
IFC Power Sub-SectorsMajor Investor in fossil-fuel based Thermal Generation
* as of July 2016.
IFC Approach:
• Increased focus on natural
gas
• Climate friendly measures,
e.x. energy efficiency, gas
flaring reduction
• Diesel and heavy fuel oil
where limited alternatives
exist
32

33
Vietnam
GEC 78MW
Run-of-river
US$10 mn equity
2016
South Africa
Gulpur 102MW
Run-of-river
US$50 mn debt
US$72 mn mob.
2015
Armenia
Vorotan 402MW
Reservoir
US$13 mn
debt&equity
2015
Pakistan
CSAIL 2GW
US$125 mn equity
2014
Turkey
Karaca 78MW
Reservoir
US$44 mn debt
2016
IFC Power Sub-SectorsExtensive Track Record in Hydro Power Generation
* as of July 2016.
IFC Approach:
• Increased focus on natural
gas
• Climate friendly measures,
e.x. energy efficiency, gas
flaring reduction
• Diesel and heavy fuel oil
where limited alternatives
exist
IFC Experience:
87 investments with a total capacity* of 7,100 MW. Latest projects include:
33

34
Panama
Penonome 215MW
US$99 mn debt
US$204 mn mob.
2014
India
Green Infra 242MW
US$55 mn debt
US$110 mn mob.
2015
Pakistan
Gul Ahmed 50MW
US$15 mn
debt&equity
US$36 mn mob.
2015
* as of July 2016.
IFC Power Sub-SectorsLeading Investor in Wind Power in Emerging Markets
India
Ostro Energy 198MW
US$30 mn debt
US$120 mn mob.
2016
Brazil
Enel Wind 342MW
US$200 mn debt
US$300 mn mob.
2014
IFC Experience:
50 investments with a total capacity* of 3,600 MW. Latest projects include:
IFC Approach:
• Products that optimize
leverage, e.g. deferrable
subordinated debt that take
more wind risk layered on
top of senior debt
• Can mobilize concessional
financing where appropriate
• We understand new
regulatory support
mechanisms bundling of
small hydros
34

IFC Power Sub-SectorsIncreasing Focus on Solar Power Generation
35
South Africa
Abengoa Xina 100 MW
CSP
US$43 mn debt
2014
India
Acme Solar NSM 100MW
Solar PV
US$33 mn debt
US$65 mn mob.
2014
India
Azure Karnataka 130MW
Solar PV
US$30 mn debt
US$70 mn mob.
2015
Honduras
SunEdison HON3 82MW
Solar PV
US$46 mn debt
US$81 mn mob.
2014
Jordan
Seven Sisters 90MW
Solar PV
US$80 mn debt
US$116 mn mob.
2014* as of July 2016.
IFC Experience:
77 investments with a total capacity* of 1,600 MW. Latest projects include:
IFC Approach:
• Utility-scale plants
• Best-in-class start up
developers
• Developing relationships
with suppliers
• Can mobilize concessional
financing where appropriate
• We understand new
regulatory support
mechanisms and regulatory
support risk
35

36
Philippines
EDC
US$83 mn debt
2009
Nicaragua
San Jacinto 36MW
US$50 mn debt
US$140 mn mob.
2011
Philippines
Energy Dev II 5MW
US$75 mn debt
2011
* as of July 2016.
IFC Power Sub-SectorsExperience in Geothermal Power Generation
IFC Approach:
• Understand the sector-
specific challenges of
resource risk and long
project cycle
• Innovative structuring
allowing for stage
disbursement to full
resource completion
• Exploring ways to finance
resource development
• In-house technical expertise
• Mobilization of concessional
financing where appropriate
IFC Experience:
• Investments in Nicaragua and Philippines
• Corporate finance. Project finance of integrated (steam + plant) and
plant-only projects
• Experience with both equity and debt financing
36

37
Kenya
KPLC
US$50 mn debt
2013
Turkey
AkCez II
US$106 mn debt
US$58 mn mob.
2015
Brazil
Equatorial
US$99 mn equity
2013
* as of July 2016.
IFC Power Sub-SectorsExperience in Transmission and Distribution
IFC Approach:
• Financing capital
expenditure programs for
distribution companies,
including recently privatized
companies – e.g. Sedas
(Turkey), Umeme (Uganda),
CEZ (Albania), EVN
(Macedonia) and rural
electrification concessions –
e.g. Comasel (Senegal)
• Financing of greenfield
private transmission assets
– e.g. Powerlink (India) and
privatized transmission
assets (e.g. TDE, Bolivia)
IFC Experience:
36 distribution and 13 transmission investments*. Latest projects include:
37

38
IFC’s Value-Add in Power Transactions
38

IFC Approach:
• Bring the entire financing package to the
table through own account investment
and / or mobilization
• Equity Mobilization through the Asset
Management Company (part of the
WBG): US$ 8.7 billion AUM as of
September 2015
• Debt Mobilization through Managed
Colending Portfolio Program (MCPP) or
syndication
IFC Experience:
From 2010 to 2015, IFC mobilized over US$8.0 billion for power investments
from commercial lenders and DFIs
39
IFC’s Value-Add in Power TransactionsMobilization of Capital
Iraq
MGES Power
Mobilization
US$125 mn
2016
India
Ostro Energy
Mobilization
US$120 mn
2016
Senegal
Cap des Biches
Mobilization
US$91 mn
2016
Brazil
Enel
Mobilization
US$300 mn
2014
Mexico
Eurus
Mobilization
US$375 mn
2010
39

40
IFC’s Value-Add in Power TransactionsIFC InfraVentures as Project Co-Developer
IFC InfraVentures Approach:
• US$150 million fund to provide
development capital to infrastructure
projects, mainly in IDA (low-income)
countries (*)
• Up to US$8 million in cash and “sweat”
for projects in early stages of
development
• Act as co-developer for such projects,
adding value by:
• experienced staff working
alongside the sponsor, helping
structure the project and
increase bankability and equity
investors’ appetite
• giving access to the World
Bank’s global presence and
knowledge of local environments
(*) For a list of IDA countries, see http://www.worldbank.org/ida/borrowing-countries.html
Nepal
Upper Trishuli-1
216MW Hydro
US$500 mn
Project cost
2012
Kenya
Kipeto 100MW
Wind
US$320 mn
Project cost
2013
Georgia
CEI 400MW
Hydro
US$700 mn
Project cost
2011
Senegal
Tobene 96MW
HFO fired
US$165 mn
Project cost
2014
Nigeria
MBSO 120MW
Solar
US$240 mn
Project cost
2015
IFC Experience:
40

• In energy projects change in regulation is a
key risk (feed-in tariffs, tax credits, etc)
• IFC provides
• Assessment of stability and
predictability of a country’s regulatory
framework
• Support for increased competition and
fair market access
• Support in case of regulatory changes
• Experience in market reform efforts leads to
deep in-house power market expertise
• Teams work for governments and companies
from either side of the “Chinese wall”
• We leverage our relationship with the World
Bank (IBRD)
41
IFC’s Value-Add in Power TransactionsLocal Regulatory Frameworks and Market Reforms
Argentina
• At the request of the Secretariat of Energy, helped draft the PPA for the first
renewable power auction under the new Renewable Electricity Law in Argentina
• In coordination with the World Bank, helped prepare a USD 500 million PRG to
guarantee potential termination events for 1,000 MW of renewable energy
projects
• At the request of the Secretariat of Energy, helped review the FODER Trust
Joinder Agreement (payment scheme), RFP (bid documents) and the
compatibility of both documents with the PPA and PRG
• Targeting 2-3 renewable energy projects for USD 150 mm in IFC A-loans and
additional mobilization from bilateral banks and commercial banks to support
Argentina’s new renewable energy program
Mexico
• Actively participated providing comments and feedback to Mexico’s new
Electricity Law and its regulations
• Presented in several workshops best-practice on the workings of deregulated
markets to the Secretariat of Energy, Regulator, System Operator and Industrial
Groups
• Designed and structured the first wholesale and retail aggregator to
commercialize power and green certificates under Mexico’s new deregulated
power sector with the hope to help offload contractual commitments from the
State Owned Utility (CFE)
• Targeting investments in renewable power and CCGTs under hybrid contractual
and merchant schemes under the new deregulated scheme
IFC ExperienceIFC’s View on Regulatory Frameworks
41

Annex
42

IFC: A MEMBER OF THE WORLD BANK GROUP
Conciliation
and
arbitration of
investment
disputes
Guarantees
of foreign
direct
investment’s
non-
commercial
risks
Interest-free
loans and
grants to
governments
of poorest
countries
Loans to
middle-income
and credit-
worthy low-
income
country
governments
Solutions in
private sector
development
IBRDInternational
Bank for
Reconstruction
and
Development
IDAInternational
Development
Association
IFCInternational
Finance
Corporation
MIGAMultilateral
Investment
and Guarantee
Agency
ICSIDInternational
Centre for
Settlement of
Investment
Disputes
4343

Providing Development Solutions … Customized To Meet Client Needs
A member of the World Bank Group
Provides debt and equity investment, risk-
management, advice, resource mobilization
AAA credit rating; nearly 60-year history in
emerging markets
Present in 100 countries
IFC is the largest global development institution focused exclusively
on the private sector in developing countries.44

Loans
Equity
Trade Finance
Syndications
Blended
Finance
- Project and Corporate Financing
- On-lending through intermediary institutions
- Direct equity investments (up to 20% of company’s equity)
- Private equity funds
- Guarantee of trade-related payment obligations of
approved financial institutions
- Capital mobilization to serve developmental needs
- Over 60 co-financiers: commercial banks, fund, and DFIs
- Concessional funds are blended with IFC’s own resources
to finance initiatives & achieve impact that would
otherwise be unattainable
Derivatives &
Structured
Finance
- Interest rate, Currency, or Commodity-price hedges
provided to clients
- Credit guarantees and Structuring Advice
45
FY 2016:
US$8.1 billion
committed
FY 2016:
US$2.6 billion
committed
FY 2016: Average
outstanding balance
of US$2.8 billion
FY 2016: US$7.7
billion syndicated
FY 2016: US$117
million committed
Providing Development Solutions … Broad Product Range in Investment Services
45

46
Latin America & the Caribbean
24%
East Asia & the Pacific21%
Europe & Central Asia19%
South Asia13%
Sub-Saharan Africa12%
Middle East & North Africa
9%
Other2%
FY2016 IFC HighlightsIFC Own Commitments of US$11.1 Billion
Financial Markets40%
Infrastructure16%
Agribusiness & Forestry
10%
Consumer & Social Services
9%
Oil, Gas & Mining8%
Manufacturing7%
Telecom. & Information5%
Funds5%
Note: IFC year-end is June 30th
FY2016 Commitment Activity: US$18.9 billion invested in 344 projects and 78 countries, including
US$11.1 billion for IFC’s own account and US$7.7 billion of mobilization
Current Trends: Equity investments are an increasing priority, from 5% of commitments in 2008 to 23% in FY2016
Increasing focus on Sub-Saharan Africa, increasing from 1% of commitments in 2008 to 12.6% in
FY2016
Focus on large transformational engagements
FY2016 Commitment Activity by RegionFY2016 Commitment Activity by Sector
46

47
IFC – Infrastructure & Natural Resources
Overview
47
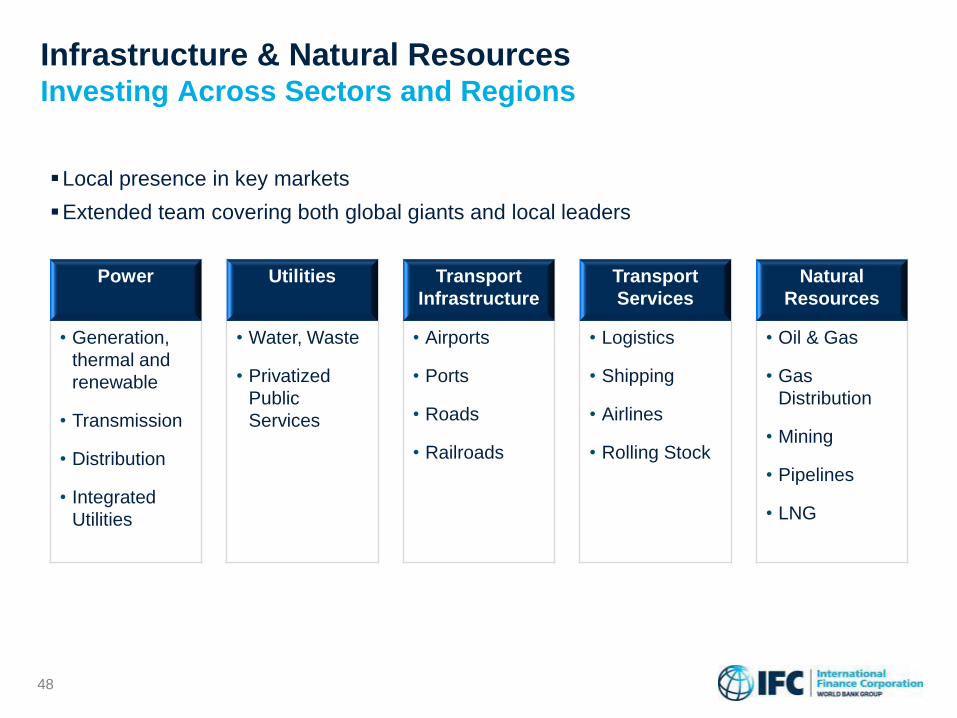
Power Utilities Transport
Infrastructure
Transport
Services
Natural
Resources
• Generation,
thermal and
renewable
• Transmission
• Distribution
• Integrated
Utilities
• Water, Waste
• Privatized
Public
Services
• Airports
• Ports
• Roads
• Railroads
• Logistics
• Shipping
• Airlines
• Rolling Stock
• Oil & Gas
• Gas
Distribution
• Mining
• Pipelines
• LNG
Local presence in key markets
Extended team covering both global giants and local leaders
48
Infrastructure & Natural ResourcesInvesting Across Sectors and Regions
48

49
Latin America & the Caribbean
12%
East Asia & the Pacific28%
Sub-Saharan Africa18%
Europe & Central Asia
18%
South Asia6%
Middle East & North Africa
15%
World3%
FY2016 Infra HighlightsIFC Own Commitments of US$2.6 Billion
Electric Power32%
Transportation23%
Oil, Gas & Mining31%
Utilities9%
Other5%
Note:
- IFC year-end is June 30th
- The charts represent IFC Own Account Commitment Activity
FY2016 Commitment Activity: US$6.5 billion invested, including US$2.6 billion for IFC’s own account and
US$3.9 billion of mobilization
FY2016 Committed Portfolio: US$13.3 billion
FY2016 Commitment Activity by Region
(Own Account)
FY2016 Commitment Activity by Sector
(Own Account)
49

50
List of IFC InvestmentsWind Power Generation
* As of July 2016.
Project Subsector Region CountryIFC Investment
($ million)
Power Share
($ million)
Mobilization
amount
($ million)
Total Power
Share and
Mobilization
($ million)
Infrastructure
Project CountMW IDA
Debt, Equity
or Both
InfraV-Kipeto Wind Sub-Saharan Africa Kenya 1.9 0.0 0.0 0.0 0.0 0.0 0.0 Debt
Ostro Andhra Wind South Asia India 29.5 29.5 120.0 149.5 1.0 96.6 0.0 Debt
Metro Power - B Wind Middle East and North Africa Pakistan 0.0 0.0 22.5 22.5 1.0 50.0 1.0 Debt
Ostro AP Wind Wind South Asia India 30.8 30.8 0.0 30.8 1.0 100.9 0.0 Debt
FY16 Subtotal 62.1 60.2 142.5 202.7 3.0 247.5 1.0
Rudine WPP Wind Europe and Central Asia Croatia 24.9 24.9 31.1 56.0 1.0 34.2 – Debt
BMR Wind Wind Latin America and the Caribbean Jamaica 10.0 10.0 – 10.0 1.0 34.0 – Debt
Gul Ahmed Wind Wind Middle East and North Africa Pakistan 14.9 14.9 36.4 51.2 1.0 50.0 1.0 Both
Green Infra Wind Wind South Asia India 55.2 55.2 110.0 165.2 1.0 242.4 – Debt
Enel Wind Brazil Wind Latin America and the Caribbean Brazil – – 108.5 108.5 – – – Debt
DJ Energy Wind South Asia India – – 55.3 55.3 – 106.3 – Debt
Uttar Urja Wind Wind South Asia India – – 44.5 44.5 – 85.5 – Debt
Dawood TGL Wind Middle East and North Africa Pakistan 29.5 29.5 44.0 73.5 1.0 49.5 1.0 Both
Penonome Wind Wind Latin America and the Caribbean Panama 99.0 99.0 - 99.0 1.0 215.0 – Debt
FY15 Subtotal 233.5 233.5 429.8 663.2 6.0 816.8 2.0
Tafila Rate Swap Wind Middle East and North Africa Jordan 2.7 2.7 – 2.7 1.0 – – Debt
Tafila Wind Wind Middle East and North Africa Jordan 69.1 69.1 151.7 220.8 1.0 117.0 – Debt
Metro Power Wind Middle East and North Africa Pakistan 25.8 25.8 – 25.8 1.0 50.0 1.0 Both
InfraV-Indo Wind Wind East Asia and Pacific Indonesia 2.0 2.0 – 2.0 1.0 – – Debt
InfraV-Ivicom Wind Europe and Central Asia Serbia 3.5 3.5 – 3.5 1.0 – – Debt
Enel Wind Brazil Wind Latin America and the Caribbean Brazil 200.0 200.0 100.0 300.0 1.0 342.3 – Debt
DJ Energy Wind South Asia India 27.5 27.5 – 27.5 1.0 85.0 1.0 Debt
Jath Power (NSL) Wind South Asia India 12.0 12.0 – 12.0 1.0 40.0 1.0 Debt
Uttar Urja Wind Wind South Asia India 22.2 22.2 – 22.2 1.0 85.0 1.0 Debt
FY14 Subtotal 364.8 364.8 251.7 616.5 9.0 719.3 4.0
Bhilwara Captive Wind South Asia India 7.5 7.5 – 7.5 1.0 20 1.0 Debt
Bhilwara R'ts 3 Wind South Asia India 1.0 1.0 – 1.0 1.0 – 1.0 Equity
InfraV-Lamuwind Wind Sub-Saharan Africa Kenya 3.0 3.0 – 3.0 1.0 – 1.0 Debt
InfraV-Singida Wind Sub-Saharan Africa Tanzania 4.0 4.0 – 4.0 1.0 – 1.0 Debt
Inox Rajasthan Wind South Asia India 50.0 50.0 – 50.0 1.0 100 1.0 Debt
NSL Wind Wind South Asia India 18.4 18.4 – 18.4 1.0 75 1.0 Debt
NSL Power Wind South Asia India 5.0 5.0 – 5.0 – – – Debt
Amakhala Wind Wind Sub-Saharan Africa South Africa 70.7 70.7 – 70.7 1.0 134 – Debt
Amakhala Swap Wind Sub-Saharan Africa South Africa 2.8 2.8 – 2.8 1.0 – – Debt
InfraV-Kipeto Wind Sub-Saharan Africa Kenya 2.0 2.0 – 2.0 1.0 – 1.0 Debt
Jelinak Wind Europe and Central Asia Croatia 20.1 20.1 30.4 50.5 1.0 30 – Debt
FY13 Subtotal 184.5 184.5 30.4 214.9 10.0 359.4 7.0
Bhilwara Wind Wind South Asia India 14.0 14.0 – 14.0 1.0 50 1.0 Debt
NSL Power Wind South Asia India 20.0 20.0 – 20.0 1.0 28 1.0 Equity
Pestera Power Wind Europe and Central Asia Romania 39.0 39.0 14.1 53.1 1.0 90 – Debt
Zorlu Pakistan Wind Middle East and North Africa Pakistan 38.1 38.1 – 38.1 1.0 56 1.0 Debt
Techno Wind Wind South Asia India 4.7 4.7 – 4.7 – – – Debt
InfraV-Renovatio Wind Europe and Central Asia Moldova 3.0 3.0 – 3.0 1.0 – 1.0 Debt
Sibenik WPP Wind Europe and Central Asia Croatia 24.8 24.8 43.4 68.2 1.0 44 – Debt
Cernavoda Power Wind Europe and Central Asia Romania – – 22.1 22.1 – – – Debt
FY12 Subtotal 143.6 143.6 79.6 223.2 6.0 267.3 4.0
Cernavoda Power Wind Europe and Central Asia Romania 60.8 60.8 – 60.8 1.0 138 – Debt
EDF La Ventosa Wind Latin America and the Caribbean Mexico 28.9 28.9 102.5 131.5 1.0 68 – Debt
Senok WindEnergy Wind South Asia Sri Lanka 1.9 1.9 – 1.9 1.0 10 1.0 Equity
Enerjisa-II 1 Wind Europe and Central Asia Turkey 27.6 27.6 165.6 193.2 0.2 119 – Debt
China WindPower Wind East Asia and Pacific China – – 95.0 95.0 – – – Debt
FY11 Subtotal 156.1 156.1 363.1 519.2 5.2 471.4 3.0
Grand Total 1,144.6 1,142.7 1,297.1 2,439.8 39.2 2,881.7 21.0
China WindPower Wind East Asia and Pacific China 55 55 – 55 1.0 201 – Debt
Eurus Wind Latin America and the Caribbean Mexico 71 42.6 – 42.6 0.5 250 – Debt
FY10 Subtotal 126.0 97.6 - 97.6 1.5 451.0 -
AES Kavarna Wind Europe and Central Asia Bulgaria 51.8 51.8 – 51.8 1.0 156 – Debt
Rotor Elektrik Wind Europe and Central Asia Turkey 71.51 71.51 – 71.51 1.0 135 – Debt
Norvind Wind Latin America and the Caribbean Chile 30.75 30.75 – 30.75 1.0 50 – Debt
FY09 Subtotal 154.1 154.1 - 154.1 3.0 341.0 -
Grand Total 1,424.6 1,394.3 1,297.1 2,691.5 43.7 3,673.7 21.0
48

51
List of IFC InvestmentsSolar Power Generation
Project Subsector Region CountryIFC Investment
($ million)
Power Share
($ million)
Mobilization
amount
($ million)
Total Power
Share and
Mobilization
($ million)
Infrastructure
Project CountMW IDA
Debt, Equity
or Both
InfraV-MBSO Solar Sub-Saharan Africa Nigeria 1.5 1.5 – 1.5 1.0 – 1.0 Debt
FRV Solar Jordan Solar Middle East and North Africa Jordan 21.2 21.2 20.6 41.8 1.0 50.0 – Debt
Azure_PV_40MW Solar South Asia India 9.2 9.2 – 9.2 1.0 40.0 – Debt
Azure_Raj_40MW Solar South Asia India 9.2 9.2 – 9.2 1.0 40.0 – Debt
Azure Sunrise Solar South Asia India 11.5 11.5 – 11.5 1.0 50.0 – Debt
FY16 Subtotal 52.5 52.5 20.6 73.1 5.0 180.0 1.0
CTIF OGE Solar Sub-Saharan Africa Tanzania 3.4 1.7 - 1.7 0.5 - 0.5 Debt
Luz del Norte Solar Latin America and the Caribbean Chile 60.0 60.0 – 60.0 1.0 141.0 – Debt
Adenium Jordan-1 Solar Middle East and North Africa Jordan 11.3 11.3 12.1 23.4 1.0 10.0 – Debt
Adenium Jordan 2 Solar Middle East and North Africa Jordan 11.3 11.3 12.1 23.4 1.0 10.0 – Debt
Adenium Jordan 3 Solar Middle East and North Africa Jordan 11.3 11.3 12.1 23.4 1.0 10.0 - Debt
Azure Clean Solar South Asia India 13.9 13.9 - 13.9 1.0 40.0 - Debt
Acme Solar NSM 1 Solar South Asia India 6.4 6.4 - 6.4 1.0 20.0 - Debt
Shamsuna PV Solar Middle East and North Africa Jordan 8.0 8.0 8.7 16.7 1.0 10.0 - Debt
Shamsuna Swap Solar Middle East and North Africa Jordan 0.2 0.2 - 0.2 1.0 - - Debt
Arabia One Solar Solar Middle East and North Africa Jordan 10.5 10.5 10.5 21.1 1.0 10.0 - Debt
Jordan Solar One Solar Middle East and North Africa Jordan 14.4 14.4 11.5 25.9 1.0 20.0 - Debt
Falcon PV Solar Middle East and North Africa Jordan 12.5 12.5 15.5 28.0 1.0 21.0 – Debt
Acme Solar NSM 2 Solar South Asia India 6.4 6.4 – 6.4 1.0 20.0 – Debt
Acme Solar NSM 3 Solar South Asia India 6.4 6.4 – 6.4 1.0 20.0 – Debt
Acme Solar NSM 4 Solar South Asia India 6.4 6.4 – 6.4 1.0 20.0 – Debt
Acme Solar NSM 6 Solar South Asia India 7.1 7.1 - 7.1 1.0 20.0 - Debt
CTIF OGE Solar Sub-Saharan Africa Tanzania 5.9 5.9 2.5 8.4 1.0 – 1.0 Debt
Azure CCPS-Rights2 Solar South Asia India 3.7 3.7 – 3.7 1.0 – – Debt
Azure Rights H Solar South Asia India 10.0 10.0 41.7 51.7 1.0 – – Debt
Abengoa CSP Xina Solar Sub-Saharan Africa South Africa 43.1 43.1 – 43.1 1.0 100.0 – Debt
AST Rights II Solar South Asia India 3.1 3.1 – 3.1 1.0 – – Debt
Adenium Holdco Solar Middle East and North Africa Jordan 12.0 12.0 – 12.0 1.0 – – Debt
Aura Solar II Solar Latin America and the Caribbean Honduras 25.7 25.7 64.3 90.0 1.0 61.0 1.0 Debt
Arabia One Swap Solar Middle East and North Africa Jordan 0.4 0.4 – 0.4 1.0 – 1.0 Debt
Valle Solar PV Solar Latin America and the Caribbean Honduras 30.0 30.0 60.5 90.5 1.0 70.0 1.0 Debt
Adenium 1 Swap Solar Middle East and North Africa Jordan 0.4 0.4 – 0.4 1.0 – 1.0 Debt
JSO Rate Swap Solar Middle East and North Africa Jordan 0.8 0.8 – 0.8 1.0 – 1.0 Debt
Adenium 2 Swap Solar Middle East and North Africa Jordan 0.4 0.4 – 0.4 1.0 – 1.0 Debt
Adenium 3 Swap Solar Middle East and North Africa Jordan 0.4 0.4 – 0.4 1.0 – 1.0 Debt
Falcon PV Swap Solar Middle East and North Africa Jordan 0.5 0.5 – 0.5 1.0 – 1.0 Debt
Gaia Equity Solar Middle East and North Africa MENA Region 25.0 25.0 – 25.0 1.0 – 1.0 Equity
SunEdison HON3 Solar Latin America and the Caribbean Honduras 45.7 45.7 – 45.7 1.0 80.8 1.0 Debt
SunEd HON3 Swap Solar Latin America and the Caribbean Honduras 1.2 1.2 - 1.2 1.0 - 1.0 Debt
FY15 Subtotal 397.9 396.3 251.5 647.7 32.5 683.8 12.5
Acme MP (25 MW) Solar South Asia India 12.0 12.0 - 12.0 1.0 25.0 1.0 Debt
ACWA Power OZZ Solar Middle East and North Africa Morocco 10.0 10.0 – 10.0 1.0 160.0 – Both
Sunergise Equity Solar East Asia and Pacific EAC Region 2.0 2.0 – 2.0 1.0 - – Equity
Azure CCD3 Solar East Asia and Pacific India 3.0 3.0 – 3.0 1.0 - 1.0 Equity
Korat 1 RI Solar East Asia and Pacific Thailand 0.2 0.2 - 0.2 1.0 - - Equity
Nakhon 1 RI Solar East Asia and Pacific Thailand 0.1 0.1 - 0.1 1.0 - - Equity
Sakon 1 RI Solar East Asia and Pacific Thailand 0.1 0.1 - 0.1 1.0 - - Equity
La Huayca II Solar Latin America and the Caribbean Chile 14.3 14.3 18.5 32.8 1.0 29.1 - Debt
SunEdison CAP Solar Latin America and the Caribbean Chile 65.0 65.0 - 65.0 1.0 100.0 - Debt
SunEdison MER Solar Latin America and the Caribbean Chile 37.5 37.5 - 37.5 1.0 50.7 - Debt
InfraV-SSOMali Solar Sub-Saharan Africa Mali 1.4 1.4 – 1.4 1.0 – 1.0 Equity
Chint/Sun Edison Solar South Asia Nepal 0.0 – 18.0 18.0 – – – Debt
SPC Korat 2 Solar East Asia and Pacific Thailand 0.6 0.6 – 0.6 – – – Debt
SPC Loei 1 Solar East Asia and Pacific Thailand 0.7 0.7 – 0.7 – – – Debt
FY14 Subtotal 146.9 146.9 36.5 183.4 11.0 364.8 3.0
49

52
List of IFC InvestmentsHydro Power Generation
50