Scaling and spatio-temporal properties of power-grid ...
16
DLR Institute of Networked Energy Systems Scaling and spatio-temporal properties of power-grid frequency: An open database Special Track: Modelling Dynamics of Power Grids > Scaling and spatio-temporal properties of power-grid frequency > Leonardo Rydin Gorjão DLR.de/ve • Slide 1 Forschungszentrum Jülich - IEK-STE Institute of Energy and Climate Research Systems Analysis and Technology Evaluation Karlsruhe Institute of Technology Institute for Automation and Applied Informatics
Transcript of Scaling and spatio-temporal properties of power-grid ...

DLR Institute of Networked Energy Systems
Scaling and spatio-temporal properties of power-grid frequency: An open database
Special Track: Modelling Dynamics of Power Grids
> Scaling and spatio-temporal properties of power-grid frequency > Leonardo Rydin GorjãoDLR.de/ve • Slide 1
Forschungszentrum Jülich - IEK-STEInstitute of Energy and Climate ResearchSystems Analysis and Technology Evaluation
Karlsruhe Institute of TechnologyInstitute for Automation and Applied Informatics
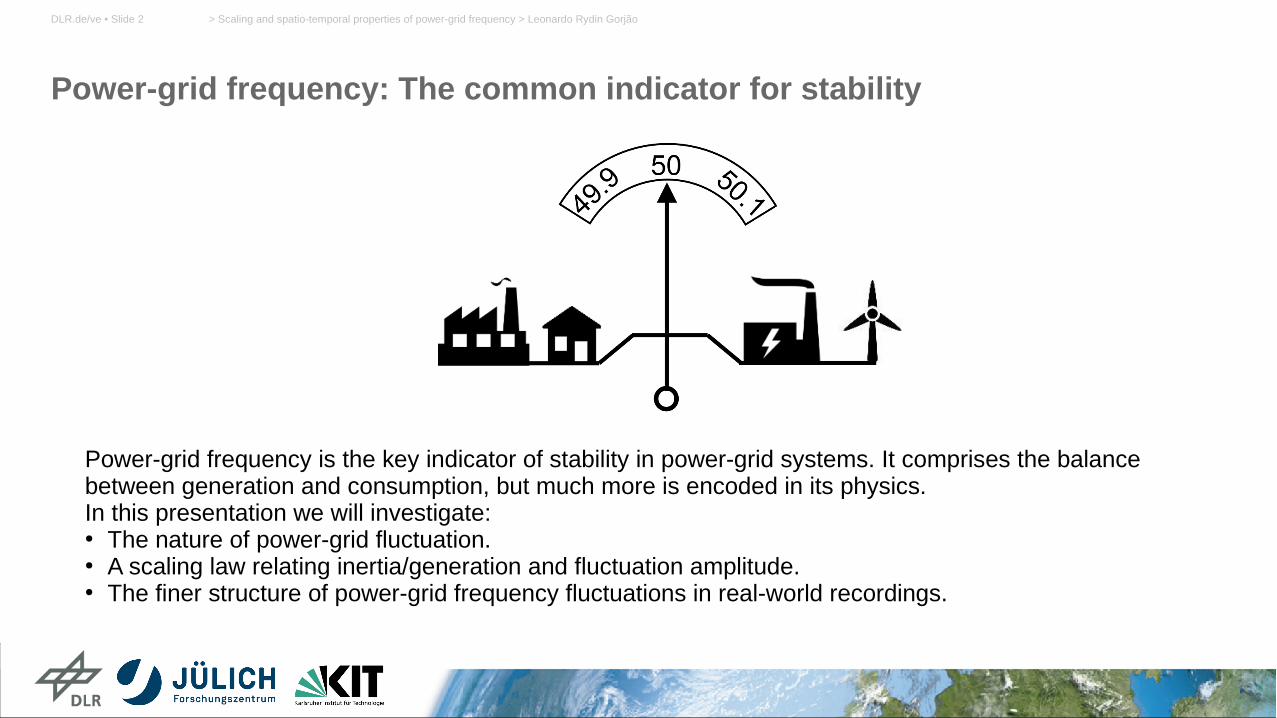
Power-grid frequency: The common indicator for stability
> Scaling and spatio-temporal properties of power-grid frequency > Leonardo Rydin GorjãoDLR.de/ve • Slide 2
Power-grid frequency is the key indicator of stability in power-grid systems. It comprises the balance between generation and consumption, but much more is encoded in its physics.In this presentation we will investigate:● The nature of power-grid fluctuation.● A scaling law relating inertia/generation and fluctuation amplitude.● The finer structure of power-grid frequency fluctuations in real-world recordings.

Extant power-grid frequency recordingsExcerpts February 2019
> Scaling and spatio-temporal properties of power-grid frequency > Leonardo Rydin GorjãoDLR.de/ve • Slide 3
0 30 60 90 120 150 180
t [min]
−60
−30
0
30
60
f−f r
ef[m
Hz] Continental Europe
0 30 60 90 120 150 180
t [min]
−160
−80
0
80
160 Great Britain
0 30 60 90 120 150 180
t [min]
−140
−70
0
70
140 Nordic Grid
Continental Europe Great Britain Nordic Grid
Three recordings from 11th of February 2019, from midnight.
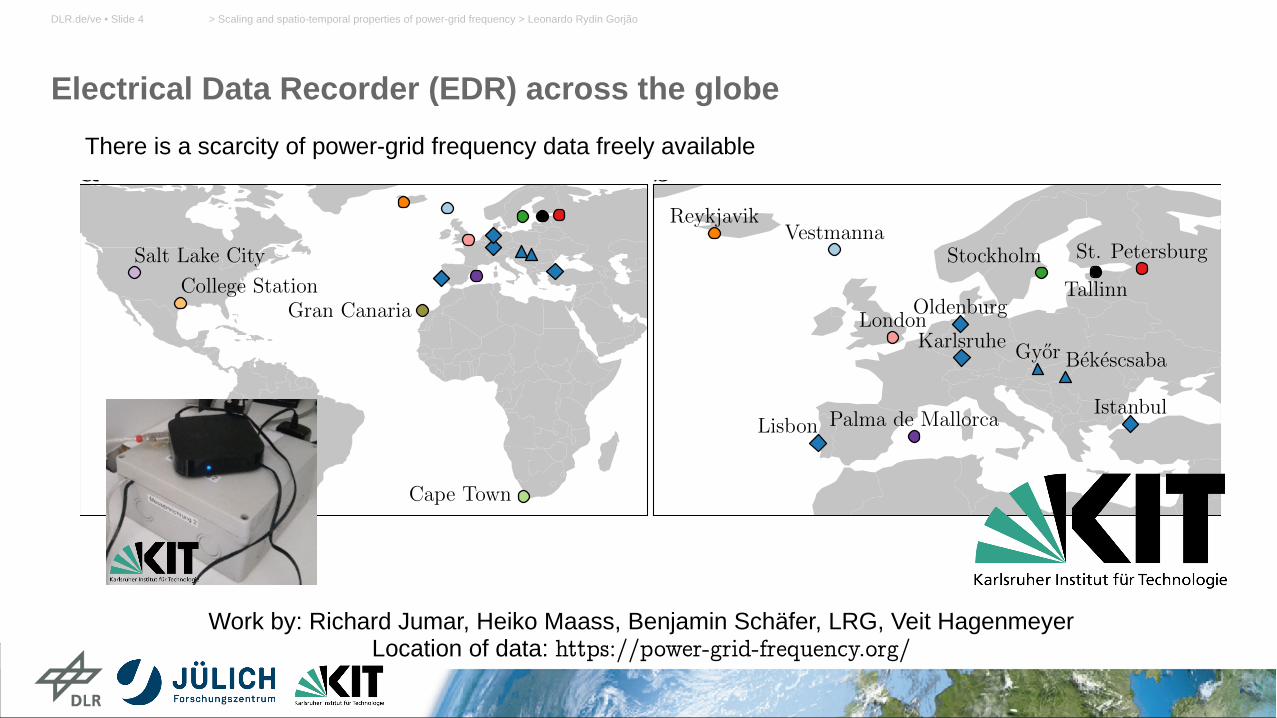
Electrical Data Recorder (EDR) across the globe
> Scaling and spatio-temporal properties of power-grid frequency > Leonardo Rydin GorjãoDLR.de/ve • Slide 4
Work by: Richard Jumar, Heiko Maass, Benjamin Schäfer, LRG, Veit HagenmeyerLocation of data: https://power-grid-frequency.org/
There is a scarcity of power-grid frequency data freely available
Gran Canaria
Salt Lake City
College Station
Cape Town
Karlsruhe
Oldenburg
LisbonIstanbul
ReykjavikVestmanna
Palma de Mallorca
London
Tallinn
Stockholm St. Petersburg
BekescsabaGyor
a b

Electrical Data Recorder (EDR) across the globeExcerpts of the power-grid frequency recordings
> Scaling and spatio-temporal properties of power-grid frequency > Leonardo Rydin GorjãoDLR.de/ve • Slide 5
17 recordings, over 12 synchronous areas
0 15 30 45 60
t [min]
−200
−100
0
100
200
f−f
ref
[mH
z]
Islands
FO IS ES-GC ES-PM
0 15 30 45 60
t [min]
−200
−100
0
100
200
Continents
SE GB DE EE
0 15 30 45 60
t [min]
−200
−100
0
100
200
Others
ZA RU US-TX US-UT
c d e
FO: Faroe IslandsIS: IcelandES-GC: Spain, Gran CanariaES-PM: Spain, Palma de Mallorca
SE: SwedenGB: Great BritainDE: GermanyEE: Estonia
ZA: South AfricaRU: RussiaUS-TX: USA, TexasUS-UT: USA, Utah

Electrical Data Recorder (EDR) across the globeStatistical properties of the recordings
> Scaling and spatio-temporal properties of power-grid frequency > Leonardo Rydin GorjãoDLR.de/ve • Slide 6
FO: Faroe IslandsIS: IcelandES-GC: Spain, Gran CanariaES-PM: Spain, Palma de Mallorca
SE: SwedenGB: Great BritainDE: GermanyEE: Estonia
ZA: South AfricaRU: RussiaUS-TX: USA, TexasUS-UT: USA, Utah
−10 −5 0 5 10∆fτ/στ [mHz]
10−1
102
105
PD
F∆f τ
IslandsISτ = 1 s
τ = 10 s
−10 −5 0 5 10∆fτ/στ [mHz]
10−1
102
105
ContinentsSEτ = 1 s
τ = 10 s
−10 −5 0 5 10∆fτ/στ [mHz]
10−1
102
105
OthersRUτ = 1 s
τ = 10 s
1 2 3 4 5 6 7 8 9 10
τ [s]
100
101
102
103
Exc
ess
Ku
rtos
isκ−
3
IS FO ES-PM ES-GC
1 2 3 4 5 6 7 8 9 10
τ [s]
100
101
EE SE GB DE
1 2 3 4 5 6 7 8 9 10
τ [s]
100
101
RU US-TX US-UT ZA
a b c
d e f

Power-grid frequency: A stochastic approach
> Scaling and spatio-temporal properties of power-grid frequency > Leonardo Rydin GorjãoDLR.de/ve • Slide 7
We can precise an SDE for the “bulk” angle and “bulk” angular velocity
where is the primary control, is the secondary control, is the power mismatch,and dW is an uncorrelated Gaussian noise with amplitude . We can write a Fokker–Planck equation (for = 0)

Power-grid frequency: A scaling law
> Scaling and spatio-temporal properties of power-grid frequency > Leonardo Rydin GorjãoDLR.de/ve • Slide 8
Take that the stochastic noise present is a sum of i.i.d Gaussian distributed random variables
which results in a relation†
or strictly from the diffusion:
With the number of nodes and an estimator
†Schäfer, B., Beck, C., Aihara, K., Witthaut, D., Timme, M. Non-Gaussian power grid frequency fluctuations characterized by Lévy-stable laws
and superstatistics, Nature Energy 3(2):119–126, 2018, doi:10.1038/s41560-017-0058-z

Power-grid frequency: A scaling law
> Scaling and spatio-temporal properties of power-grid frequency > Leonardo Rydin GorjãoDLR.de/ve • Slide 9
This results in:
or strictly from the diffusion:
FO: Faroe IslandsIS: IcelandES-GC: Spain, Gran CanariaES-PM: Spain, Palma de Mallorca
SE: SwedenGB: Great BritainDE: GermanyEE: Estonia
ZA: South AfricaRU: RussiaUS-TX: USA, TexasUS-UT: USA, Utah

The finer details in the same synchronous areaSynchronised recordings in the Continental European grid
> Scaling and spatio-temporal properties of power-grid frequency > Leonardo Rydin GorjãoDLR.de/ve • Slide 10
4 recordings with the EDR, +2 recording from the Hungarian TSO MAVIR.From 2019-07-09 to 2019-07-15, with a 1 second sampling.
19:45 20:00 20:15 20:30 20:45
time [min]
−60
−30
0
30
60
90
f−f
ref
[mH
z]
Oldenburg Karlsruhe Istanbul Lisbon
0 10 20 30 40 50 60
t [s]
−20
−10
0
10
20 Oldenburg Karlsruhe Istanbul Lisbon
l↔.
. ∆fτ=4sRoC
oF
a b
Increment statistics:

The finer details in the same synchronous areaSynchronised recordings in the Continental European grid
> Scaling and spatio-temporal properties of power-grid frequency > Leonardo Rydin GorjãoDLR.de/ve • Slide 11
Is there more to the nature of stochastic fluctuation?
−2
−1
0
1
2
RoC
oF[m
Hz
s−1]
R2 = 1.000
Oldenburg vs. Karlsruhe
R2 = 0.955
Istanbul vs. Karlsruhe
−2 −1 0 1 2
RoCoF [mHz s−1]
−2
−1
0
1
2
RoC
oF[m
Hz
s−1]
R2 = 0.985
Lisbon vs. Karlsruhe
−2 −1 0 1 2
RoCoF [mHz s−1]
R2 = 0.933
Lisbon vs. Istanbul
e f
g h
−20
−10
0
10
20
∆f τ
[mH
z]R2 = 0.720
Oldenburg vs. Karlsruhe
R2 = 0.011
Istanbul vs. Karlsruhe
−20 −10 0 10 20∆fτ [mHz]
−20
−10
0
10
20
∆f τ
[mH
z]
R2 = 0.178
Lisbon vs. Karlsruhe
−20 −10 0 10 20∆fτ [mHz]
R2 = 0.003
Lisbon vs. Istanbul
a b
c d

Quantifying fluctuations
> Scaling and spatio-temporal properties of power-grid frequency > Leonardo Rydin GorjãoDLR.de/ve • Slide 12
different amplitudesuncorrelated correlated correlated
different amplitudes identical amplitudes
a b c
Applying Detrended Fluctuation Analysis (DFA): we can obtain a fluctuation function for a segment with length :
comprises solely the variance of the increments

Quantifying fluctuationsRegime of amplitude synchronisation
> Scaling and spatio-temporal properties of power-grid frequency > Leonardo Rydin GorjãoDLR.de/ve • Slide 13
101 102 103 104
` [s]
100
101
102
103
104
F2(`
)
Oldenburg
Karlsruhe
Istanbul
Lisbon
Bekescsaba
Gyor
For a detailed analysis of DFA, see: Meyer, P. G., Anvari, M., Kantz, H. Identifying characteristic time scales in power grid frequency fluctuations with DFA, Chaos: An Interdisciplinary Journal of Nonlinear Science 30:013130, 2020, doi:10.1063/1.5123778
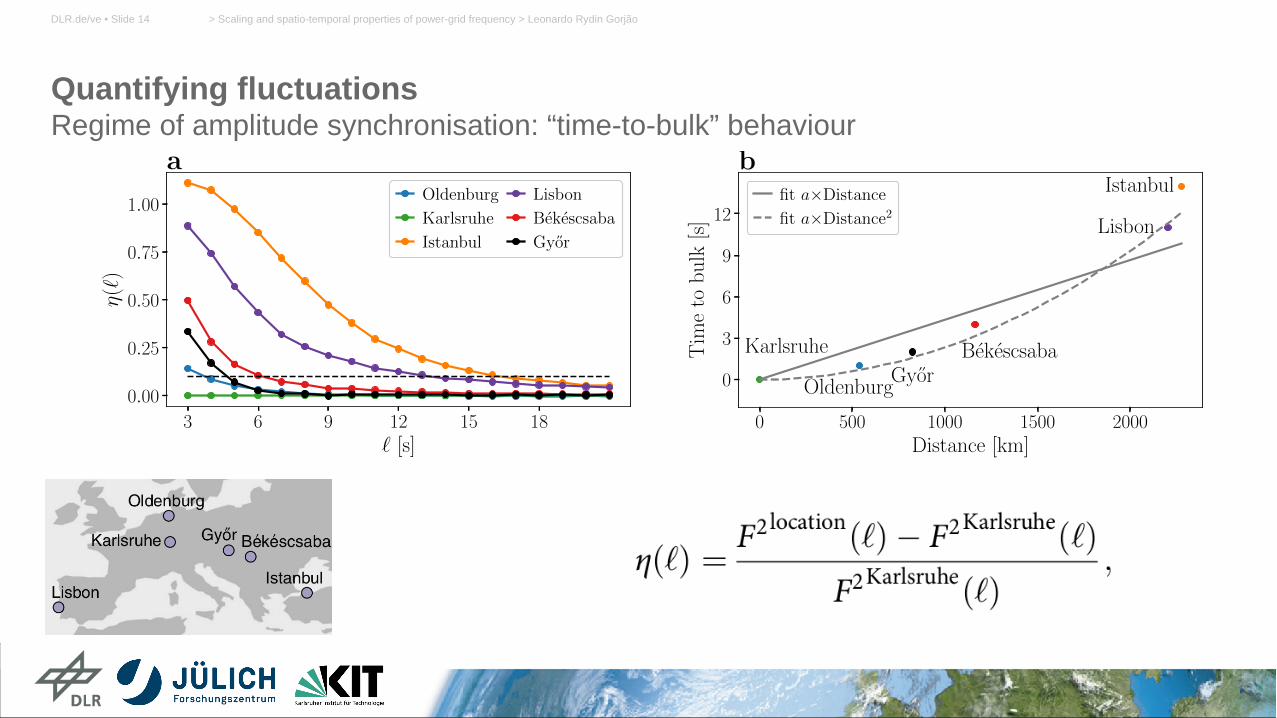
Quantifying fluctuationsRegime of amplitude synchronisation: “time-to-bulk” behaviour
> Scaling and spatio-temporal properties of power-grid frequency > Leonardo Rydin GorjãoDLR.de/ve • Slide 14
3 6 9 12 15 18
` [s]
0.00
0.25
0.50
0.75
1.00
η(`
)
Oldenburg
Karlsruhe
Istanbul
Lisbon
Bekescsaba
Gyor
a
0 500 1000 1500 2000
Distance [km]
0
3
6
9
12
Tim
eto
bu
lk[s
]
Oldenburg
Karlsruhe
Istanbul
Lisbon
BekescsabaGyor
fit a×Distance
fit a×Distance2
b
Envoi: Space and time correlations
> Scaling and spatio-temporal properties of power-grid frequency > Leonardo Rydin GorjãoDLR.de/ve • Slide 15
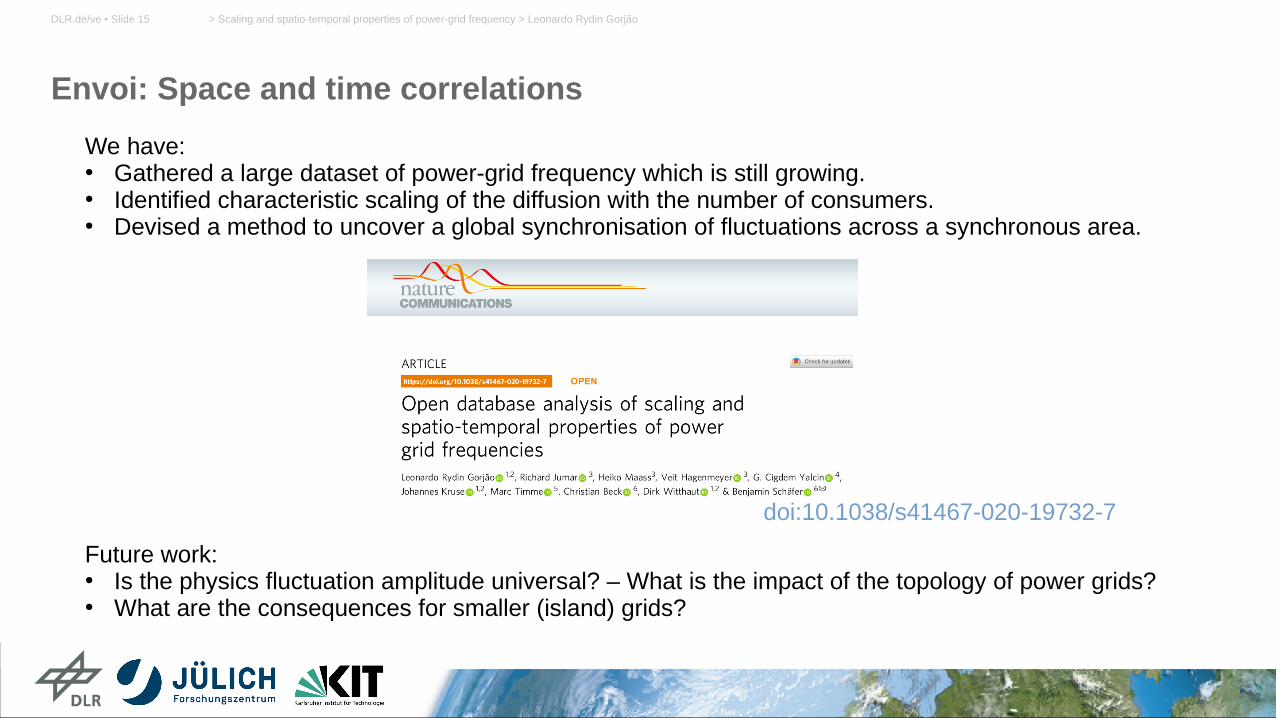
We have:● Gathered a large dataset of power-grid frequency which is still growing.● Identified characteristic scaling of the diffusion with the number of consumers.● Devised a method to uncover a global synchronisation of fluctuations across a synchronous area.
doi:10.1038/s41467-020-19732-7
Future work:● Is the physics fluctuation amplitude universal? – What is the impact of the topology of power grids?● What are the consequences for smaller (island) grids?

Funding and support
> Scaling and spatio-temporal properties of power-grid frequency > Leonardo Rydin GorjãoDLR.de/ve • Slide 16
Thank you for your attention
Funding: the German Federal Ministry of Education and Research (grant no. 03EK3055B) and the Helmholtz Association (via the joint initiative “Energy System 2050 – A Contribution of the Research Field Energy”, the grant “Uncertainty Quantification – From Data to Reliable Knowledge (UQ)” with grant no. ZT-I-0029 and the grant no. VH-NG-1025). This work was performed as part of the Helmholtz School for Data Science in Life, Earth and Energy (HDS-LEE). This project has received funding from the European Union’s Horizon 2020 research and innovation programme under the Marie Skłodowska-Curie grant agreement No 840825.