scale-up method theory and history - University of...
51
The Network Scale-Up Method: Background and Theory H. Russell Bernard and Christopher McCarty University of Florida February, 2009 © 2009 H. Russell Bernard and Christopher McCarty Suggested citation: Bernard, H. R. and C. McCarty 2009. The Network scale-up method: Background and theory. +URL where found.
Transcript of scale-up method theory and history - University of...

The Network Scale-Up Method: Background and Theory
H. Russell Bernard and Christopher McCartyUniversity of Florida
February, 2009© 2009 H. Russell Bernard and Christopher McCarty
Suggested citation: Bernard, H. R. and C. McCarty 2009. The Network scale-up method: Background and theory.
+URL where found.
The network scale-up team
H. Russell Bernard (Univ. of Florida)Peter D. Killworth (Southampton Oceanography Centre)†Christopher McCarty (Univ. of Florida)Eugene Johnsen (UC-Santa Barbara)Gene A. Shelley (Georgia State Univ.)

Finding the distribution of the number of people whom people know
Our objective is to understand the basic components of social structure. One quantity that seems important to us is the number of people whom people know.
We call this c
This number has a distribution, of course, and it probably changes across societies.
1984 Peter D. Killworth, H. R. Bernard, and C. McCarty. Measuring Patterns of Acquaintanceship. Current Anthropology 25:381–97.
1988 H. Russell Bernard, Peter D. Killworth, Michael J. Evans, Christopher McCarty, and Gene A. Shelley. Studying Social Relations Cross Culturally. Ethnology 27:155–791990 H. Russell Bernard, Peter D. Killworth, Christopher McCarty, Gene A. Shelley, and Scott Robinson. Comparing Four Different Methods for Measuring Personal Social Networks. Social Networks 12:179-215

A primitive model
We can derive this number from an assumption.
Let t be the size of a population (e.g. the U.S.), and let e be the size of some subpopulation within it. We assume that the fractional size p = e/t of that subpopulation also applies to any individual’s network, other things being equal.That is, everyone’s network in a society reflects the distribution of subpopulations in that society.Bibliography in notes, below and at end
The scale-up method to estimate c
To test this, we ask a representative sample of people to tell us how many people they know in many sub-populations whose sizes are known:
e.g., diabetics, gun dealers, postal workers, women named Nicole, men named Michael
1998 Killworth, P.D., E.C. Johnsen, C. McCarty, G.A. Shelley, and H.R. Bernard. A Social Network Approach to Estimating Seroprevalence in the United States. Social Networks 20:23-50. 1998 P. D. Killworth, C. McCarty, H. R. Bernard, G. A. Shelley, and E. C. Johnsen. Estimation of Seroprevalence, Rape and Homelessness in the U.S. Using a Social Network Approach. Evaluation Review 22:289–308.
Do people answer accurately?
This works only if people can and do answer our questions accurately and we recognized early on that this was a problem.We expect that continued research on this problem will improve the estimates of hard-to-count populations.
2006 Killworth, P. D., C. McCarty, E. C. Johnsen, H. R. Bernard, and G. A. Shelley. Investigating the variation of personal network size under unknown error conditions. Sociological Methods and Research 35:84-112.

A maximum likelihood estimate of an individual’s network size:
∑∑
=
=•= L
j j
L
j iji
e
mtc
1
1
where there are L known subpopulations. (Here i is the individual, who knows mij in subpopulation j.)Network size is (the sum of all the people you say you know in some subpopulations of known size, divided by the total size of those subpopulations) times the population within which the subpopulations are embedded. Killworth, P. D., C. McCarty, H. R. Bernard, G. A. Shelley, and E. C. Johnsen. Estimation of Seroprevalence, Rape and Homelessness in the U.S. Using a Social Network Approach. Evaluation Review 22:289–308.

Estimates of c are reliable
This doesn’t deal with the problem of informant accuracy, but the estimates of c for the U.S. are very stable. Across seven surveys, we consistently find an average network size of 290 (sd232, median 231).And 290 is not an average of averages. It’s a repeated finding.
Is 290 is an artifact of the method?
We test this in three ways. (1) Make the estimates using a different method.(2) Experiment with parameters and see if the outcome varies in expected ways.(3) Compare values of c across populations of known relative sizes.

Reliability I
(1) In one survey, we estimated c by asking people how many people they know in each of 17 relation categories – people who are in their immediate family, people who are co-workers, people who provide a service – and summing. This summation method once again produced a mean for c of 290.
McCarty, C., P. D. Killworth, H. R. Bernard, E. Johnsen, and G. A. Shelley. Comparing Two Methods for Estimating Network Size. Human Organization 60:38–39

Reliability II: Change the data
(2) We changed reported values at or above 5 to a value of 5 precisely. The mean dropped to 206, a change of 29%. We set values of at least 5 to a uniformly distributed random value between 5 and 15. We repeated the random change (5 – 15), but only for large subpopulations (with >1 million). The mean increased to 402, a change of 38% -- in the opposite direction.

Reliability III: Survey clergy
(3) We surveyed a national sample of 159 members of the clergy – peoplewho are widely thought to have large networks. Mean c = 598 for the scale-up method Mean c = 948 for the summation method

So, 290 is not a coincidence
1. Two different methods of counting produce the same result.2. Changing the data produces large changes in the results, and in the expected directions. 3. People who are widely thought to have large networks do have large networks.

Something is going on
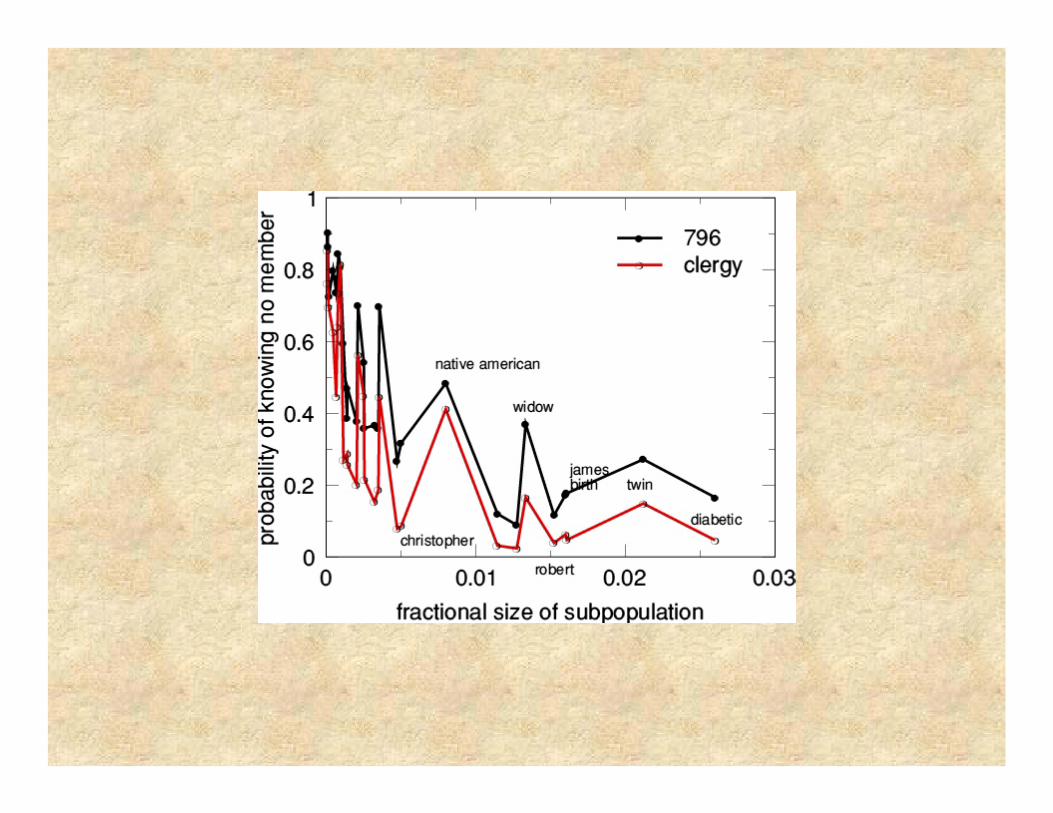
This next slide shows the probability, for two of our surveys, of knowing no one in each of 29 populations of known size, by the actual size of those populations.The two distributions track, except for the expected offset.
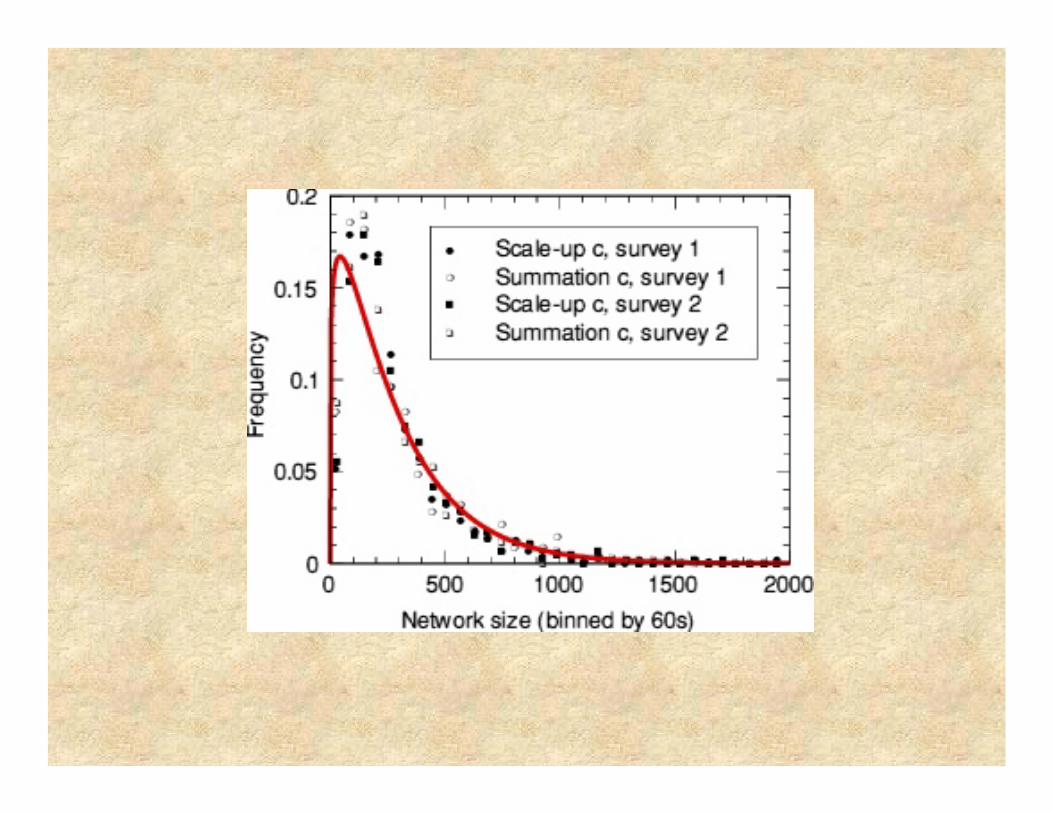
The distribution of c
Here is the graph of the distribution of network size:

Reliability vs. validity
We are measuring something, and we are doing so reliably, but if our model works, then we ought to be able to use it to estimate the populations whose sizes are not known.We can create a maximum likelihood estimate for the size of an unknown subpopulation based on what all respondents told us and our estimates of their network sizes – roughly speaking, inverting the previous formula.

Can we predict what we know?
We can test this by seeing how well we do on the 29 populations of known size. In fact, the overall result is encouraging, but we don’t estimate some known-size populations well:

r =.79 … rises to .94 without the outliers

Over- and under-estimation
There is a tendency for people to overestimate small populations (<2 million) and to underestimate large ones (>3 million). The two largest populations are people who have a twin brother or sister and diabetics.These are highly overestimated. Without these two outliers, the correlation rises from r = .79 to r = .94
Stigma vs. not newsworthy
Being a twin or a diabetic is neither stigmatizing, nor newsworthy.
From ethnographic evidence, personal information about close co-workers or business associates can take a decade or more to be transmitted ... and in the case of being a twin or a diabetic, may never be transmitted.
1990 Gene Anne Shelley, H. R. Bernard, and P.D. Killworth. Information Flow in Social Networks. J. of Quantitative Anthropology 2:201–25. 1995 Shelley, G.A., H. R. Bernard, P. D. Killworth, E. C. Johnsen, and C. McCarty. Who Knows Your HIV Status? What HIV+ Patients and Their Network Members Know About Each Other. Social Networks , 17, 189-217. 2006 Shelley, G. A., P. D. Killworth, H. R. Bernard, C. McCarty, E. C. Johnsen, and R. E. Rice. Who knows your HIV status II: Information propagation within social networks of seropositive people. Human Organization 65:430-444.

Another encouraging result
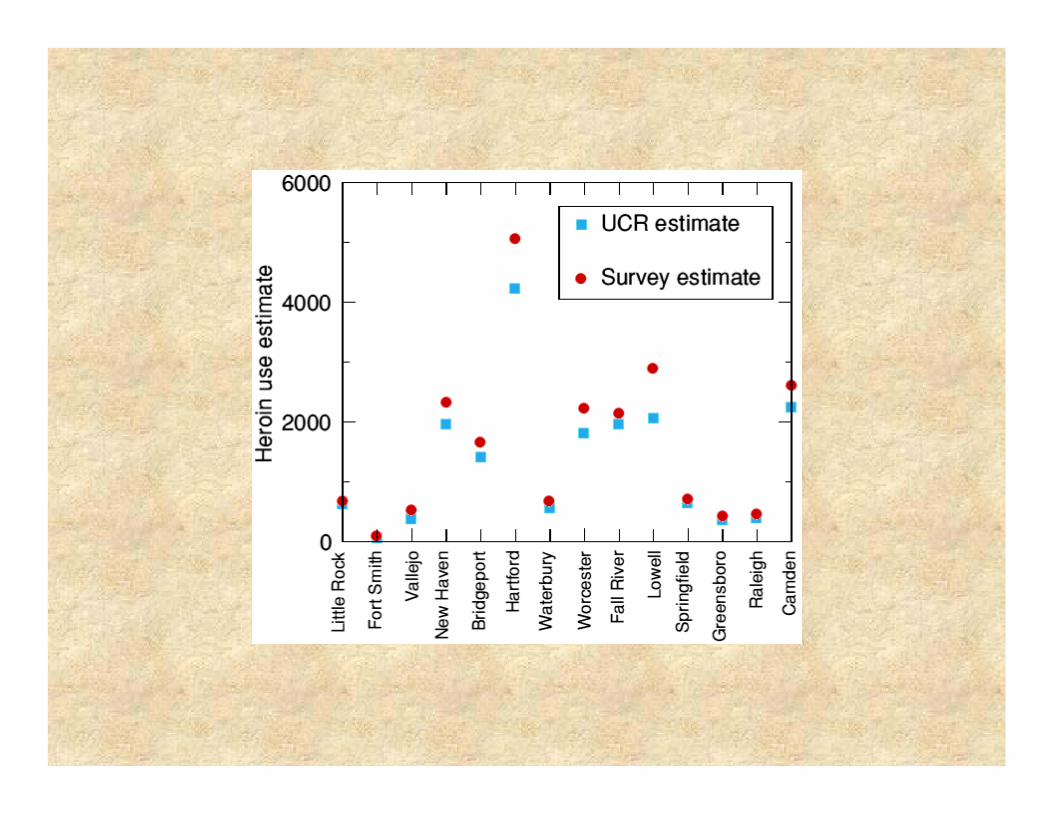
Charles Kadushin ran a national survey to estimate the prevalence of crimes in 14 cities, large and small, in the U.S.
He asked 17,000 people to report the number of people they knew who had been victims of six kinds of crime and the number of people they knew who used heroin regularly.
2006 C. Kadushin, P. D. Killworth, H. Russell Bernard, and A. Beveridge. Scale-up methods as applied to estimates of heroin use. Journal of Drug Issues 36:417-440.
Here are the estimates for the number of heroin users in each of the 14 cities, along with the estimates from the UCR.
It’s less expensive, but …
The fact that we track well with official estimates means only that we have a much, much less expensive way to get at these estimates – not that the estimates are correct. And estimates of other crimes in those 14 cities did not track so well.

Reliability, validity, and accuracy
So, while definitely reliable and perhaps valid, our estimate of network size (and its distribution) is not sufficiently accurate. There are at least three sources of inaccuracy: transmission effects, barrier effects, and informant reporting.

Compromising assumptions
1. Transmission effects: Everyone knows everything about everyone they know. 2. Barrier effects: Everyone in t has an equal chance of knowing someone in e.3. Inaccurate recall. People don’t recall accurately the number of people they know in the subpopulations we ask them about.
The accuracy problem is discussed earlier.

Network physical barriers
Oklahomans know more Native Americans than Floridians do.
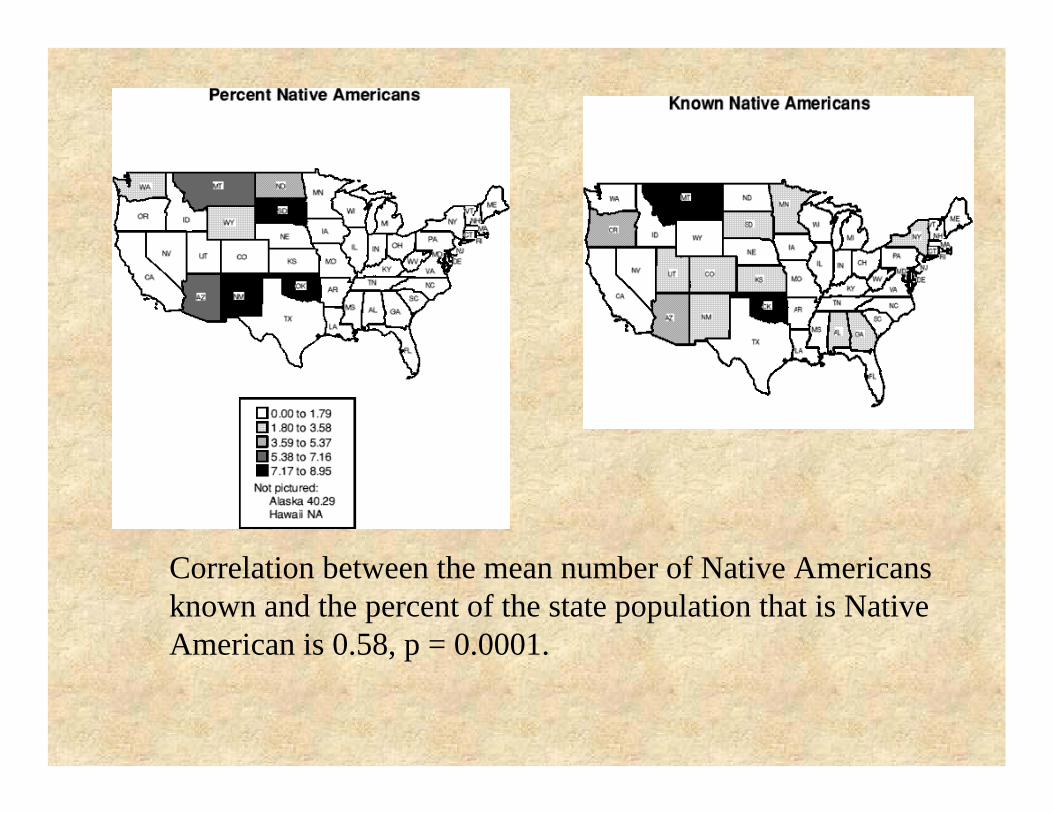
Correlation between the mean number of Native Americans known and the percent of the state population that is Native American is 0.58, p = 0.0001.
Network social barriers
Race (Black may know more diabetics than White people do.)Gender (Men may know more gun dealers than women do.) Even first names are associated with the barrier effect. We address the barrier effect by using a random, nationally representative sample of respondents.However, using the method on specific populations may still lead to incorrect estimates.

The transmission effect
We study transmission bias by asking people why they do or do not tell their network members various things about themselves. We recruited 30 people who were members of one of the known populations used in the network scale-up method.

Interview egos and alters
In the interview, we randomly selected male and female first names proportionate to their representation in the 1990 US census.For each of 25 hits, the respondent provided some information about the alter, including the alter’s phone number. Total=30x25=750.
We contacted 220 of 750 named alters and asked them things about themselves and about ego.

Population % who knew
% who did not know
Respondents # of alters
Am. Ind. 100 0 2 12Diabetic 55 45 6 44Birth in last 12 mos. 93 7 3 27Gun dealer 92 8 1 12Member of JC’s 58 42 1 12Dialysis 88 12 5 26Business in last 12 mos. 75 25 4 16Postal worker 100 0 1 10Has twin 88 12 2 24Widowed <65 97 3 4 38

Findings from the alter study
It is much easier to know that someone is a kidney dialysis patient than it is to know that they are a diabetic.Diabetes is much less visible.

Some things are easy to get right
99% know their alters’ marital status.Egos know how many children 89% of their alters have.98% know the employment status of their alters.

Some things are harder to know
When asked about the number of siblings the alter has, egos say they don’t know 52% of the time. Egos say they know the state in which 70% of their alters were born, but only 57% of the reports (ego’s and alter’s) agree on this.

Some people withdraw
Gene Shelley found that people who are HIV+ withdraw from their network in order to limit the number of people who know their HIV status. Eugene Johnsen confirmed this by showing that HIV+ people have, on average, networks that are one-third the global average.
1995 Johnsen, E. C., H. R. Bernard, P. D. Killworth, G. A. Shelley, and C. McCarty. A Social Network Approach to Corroborating the Number of AIDS/HIV+ Victims in the U.S. Social Networks 17:167–87. 1995 Shelley, G.A., H. R. Bernard, P. D. Killworth, E. C. Johnsen, and C. McCarty. Who Knows Your HIV Status? What HIV+ Patients and Their Network Members Know About Each Other. Social Networks , 17, 189-217. 2006 Shelley, G. A., P. D. Killworth, H. R. Bernard, C. McCarty, E. C. Johnsen, and R. E. Rice. Who knows your HIV status II: Information propagation within social networks of seropositive people. Human Organization 65:430-444.

Can we account for these errors?
Can we use this kind of information to tweak the model?We tried to develop weightings for classes of characteristics about subpopulations …classes like “things that carry a strong stigma” and “things that carry a moderate stigma” and “things that just don’t come up in conversation.”While we found some signals like these, we don’t know how to know whether two populations require the same weighting.
We tried correcting inaccuracy empirically by changing the way we collect and adjust data, but this did not produce good results. Can we make adjustments using a model?

A theory of transmission bias
Assume that people report correctly what they know.The comparison of the data from clergy and others shows that whatever the errors are, they are consistent.

Most Americans know a Christopher
It’s likely that you know at least one Christopher
That is, the probability of knowing NO Christophers is close to zero.
Twins are likely to be underreported. But what’s the truth? How can we draw the curve on that jagged diagram so that the true values are represented?

Suppose people report accurately
In other words, given the structure of that diagram, we decided to trust our informants and assume that they are reporting correctly what they know.It’s just that what they know is incorrect.That jaggedy curve doesn’t tell us where the curve would be if people responded honestly to correct information instead of honestly to incorrect information.

This means adjusting the x-axis rather than the y-axis
Suppose that widows don’t tell half the people they know about their being a widow. The 0.13 on the x-axis would remain the same but the number that people would be responding to would be .013/2.To make the x-axis the effective size of that population, we would slide it to the left while the y-axis would remain the same.

Of course, we have no idea what the transmission error might be – that’s what we tried in vain to get with weightings.We only know that if the numbers remain the same on the y-axis and we make up the effective sizes on the x-axis, the jaggedy line would go.

Killworth did this analytically by satisfying certain mathematical properties. We know the probability of knowing none and also of knowing just one person in a subpopulation. These have to be related mathematically, which leads to a well-defined set of values for the effective subpopulation.We can then compute the predicted distribution of c. This next diagram shows that we may be on the right track.
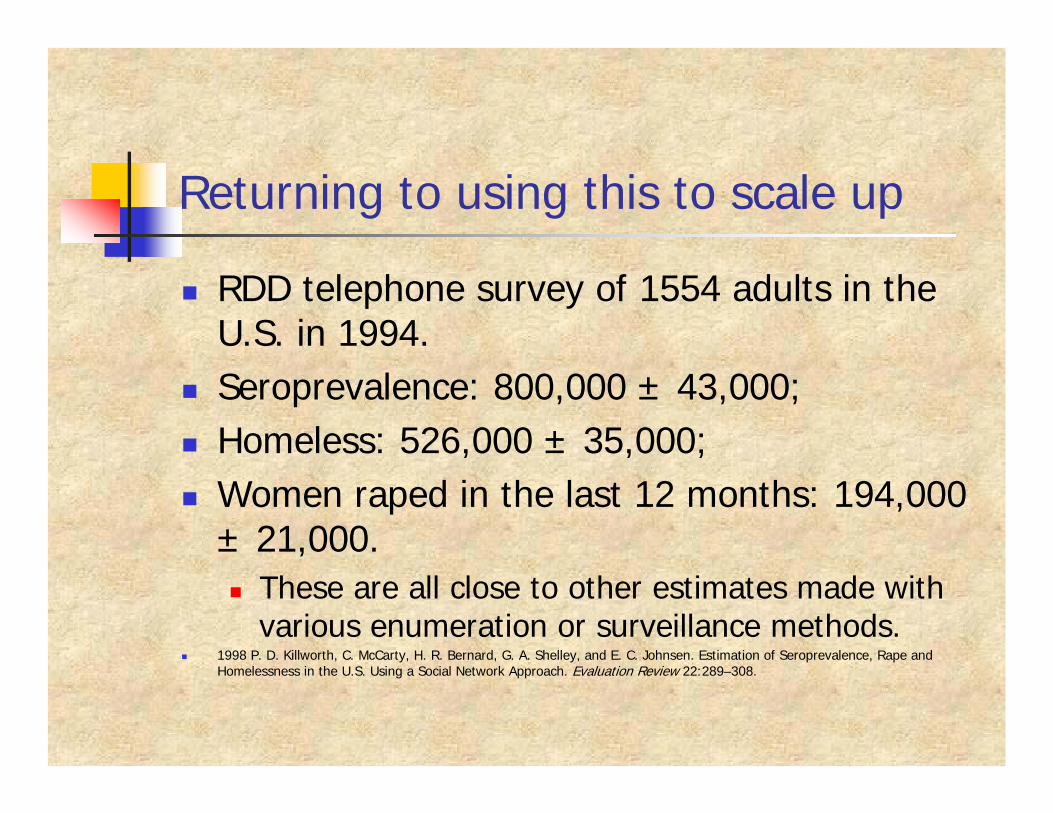
Returning to using this to scale up
RDD telephone survey of 1554 adults in the U.S. in 1994.Seroprevalence: 800,000 ± 43,000;Homeless: 526,000 ± 35,000;Women raped in the last 12 months: 194,000 ± 21,000.
These are all close to other estimates made with various enumeration or surveillance methods.
1998 P. D. Killworth, C. McCarty, H. R. Bernard, G. A. Shelley, and E. C. Johnsen. Estimation of Seroprevalence, Rape and Homelessness in the U.S. Using a Social Network Approach. Evaluation Review 22:289–308.

Next steps
Each improvement of the model produces incremental improvement in estimating population sizes.The key is collaborative effort among modelers, survey researchers, and ethnographers.