
Scale-Up Experiments - economics.stanford.edu · Scale-Up Experiments∗ Jonathan M.V. Davis†,...
39
Scale-Up Experiments * Jonathan M.V. Davis † , Jonathan Guryan ‡ , Kelly Hallberg § , Jens Ludwig ¶ March 16, 2018 Abstract Most randomized controlled trials (RCT) of social programs test interventions at modest scale. While the hope is that promising programs will be scaled up, we have few successful examples of this scale-up process in practice. Ideally we would like to know which programs will work at large scale before we invest the resources to take them to scale. But it would seem that the only way to tell whether a program works at scale is to test it at scale. Our goal in this paper is to propose a way out of this Catch-22. We first develop a simple model that helps clarify the type of scale-up challenge for which our method is most relevant. Most social programs rely on labor as a key input (teachers, nurses, social workers, etc.). We know people vary greatly in their skill at these jobs. So social programs, like firms, confront a search problem in the labor market that can lead to inelastically-supplied human capital. The result is that as programs scale, either average costs must increase if program quality is to be held constant, or else program quality will decline if average costs are held fixed. Our proposed method for reducing the costs of estimating program impacts at large scale combines the fact that hiring inherently involves ranking inputs with the most powerful element of the social science toolkit: randomization. We show that it is possible to operate a program at modest scale n but learn about the input supply curves facing the firm at much larger scale S × n by randomly sampling the inputs the provider would have hired if they operated at scale S × n. We build a simple two-period model of social-program decision making and use a model of Bayesian learning to develop heuristics for when scale-up experiments of the sort we propose are likely to be particularly valuable. We also present a series of results to illustrate the method, including one application to a real-world tutoring program that highlights an interesting observation: The noisier the program provider’s prediction of input quality, the less pronounced is the scale-up problem. * Acknowledgments: This paper was made possible by the generous support of the Abdul Latif Jameel Poverty Action Lab (J-PAL), Chicago Beyond, the Polk Bros Foundation, and the William T. Grant Foundation. For vital assistance in making this intervention possible we thank Barbara Algarin, Rukiya Curvey-Johnson, Antonio Gutierrez, Alan Safran and the staff of the Chicago Public Schools and SAGA Innovations, as well as the Crown Family Foundation, the Lloyd A. Fry Foundation, and the IMC Charitable Foundation. For help accessing administrative data we thank the Chicago Public Schools, Jeffrey Broom, Sarah Dickson, Kylie Klein, and Stacy Norris. For outstanding help with project fieldwork and data assembly and analysis, we thank Valentine Gilbert, Rowan Gledhill, Nathan Hess, Zachary Honoroff, Julia Quinn, Catherine Schwarz, Hannah Shaw, Maitreyi Sistla, and John Wolf. For his excellent assistance with the development of the translation exercises we thank Juchi Pratt. For their very helpful suggestions and comments we thank Esther Duflo, Joe Hotz, John List, Sendhil Mullainathan, Jesse Rothstein, Jesse Shapiro, Don and Liz Thompson, and seminar participants at Duke University and the 2016 FEW conference. The views expressed herein are those of the authors and do not necessarily reflect the views of the National Bureau of Economic Research, or any other funder or data provider. All opinions and any errors are our own. † University of Chicago [email protected] ‡ Northwestern University and NBER [email protected] § University of Chicago [email protected] ¶ University of Chicago and NBER [email protected] 1
Transcript of Scale-Up Experiments - economics.stanford.edu · Scale-Up Experiments∗ Jonathan M.V. Davis†,...
Scale-Up Experiments∗
Jonathan M.V. Davis†, Jonathan Guryan‡, Kelly Hallberg§, Jens Ludwig¶
March 16, 2018Abstract
Most randomized controlled trials (RCT) of social programs test interventions at modestscale. While the hope is that promising programs will be scaled up, we have few successfulexamples of this scale-up process in practice. Ideally we would like to know which programs willwork at large scale before we invest the resources to take them to scale. But it would seem thatthe only way to tell whether a program works at scale is to test it at scale. Our goal in this paperis to propose a way out of this Catch-22. We first develop a simple model that helps clarify thetype of scale-up challenge for which our method is most relevant. Most social programs rely onlabor as a key input (teachers, nurses, social workers, etc.). We know people vary greatly in theirskill at these jobs. So social programs, like firms, confront a search problem in the labor marketthat can lead to inelastically-supplied human capital. The result is that as programs scale,either average costs must increase if program quality is to be held constant, or else programquality will decline if average costs are held fixed. Our proposed method for reducing the costsof estimating program impacts at large scale combines the fact that hiring inherently involvesranking inputs with the most powerful element of the social science toolkit: randomization.We show that it is possible to operate a program at modest scale n but learn about the inputsupply curves facing the firm at much larger scale S × n by randomly sampling the inputs theprovider would have hired if they operated at scale S × n. We build a simple two-period modelof social-program decision making and use a model of Bayesian learning to develop heuristicsfor when scale-up experiments of the sort we propose are likely to be particularly valuable. Wealso present a series of results to illustrate the method, including one application to a real-worldtutoring program that highlights an interesting observation: The noisier the program provider’sprediction of input quality, the less pronounced is the scale-up problem.
∗Acknowledgments: This paper was made possible by the generous support of the Abdul Latif Jameel PovertyAction Lab (J-PAL), Chicago Beyond, the Polk Bros Foundation, and the William T. Grant Foundation. For vitalassistance in making this intervention possible we thank Barbara Algarin, Rukiya Curvey-Johnson, Antonio Gutierrez,Alan Safran and the staff of the Chicago Public Schools and SAGA Innovations, as well as the Crown FamilyFoundation, the Lloyd A. Fry Foundation, and the IMC Charitable Foundation. For help accessing administrativedata we thank the Chicago Public Schools, Jeffrey Broom, Sarah Dickson, Kylie Klein, and Stacy Norris. Foroutstanding help with project fieldwork and data assembly and analysis, we thank Valentine Gilbert, Rowan Gledhill,Nathan Hess, Zachary Honoroff, Julia Quinn, Catherine Schwarz, Hannah Shaw, Maitreyi Sistla, and John Wolf. Forhis excellent assistance with the development of the translation exercises we thank Juchi Pratt. For their very helpfulsuggestions and comments we thank Esther Duflo, Joe Hotz, John List, Sendhil Mullainathan, Jesse Rothstein, JesseShapiro, Don and Liz Thompson, and seminar participants at Duke University and the 2016 FEW conference. Theviews expressed herein are those of the authors and do not necessarily reflect the views of the National Bureau ofEconomic Research, or any other funder or data provider. All opinions and any errors are our own.†University of Chicago [email protected]‡Northwestern University and NBER [email protected]§University of Chicago [email protected]¶University of Chicago and NBER [email protected]
1

1 Introduction
Economists and other social scientists increasingly use randomized controlled trials (RCTs) to help
inform policy decisions. This process typically begins by testing interventions at modest scale,
with samples never more than a few thousand – and more typically in the hundreds, if not far
less (Al-Ubaydli et al., 2017b).1 The hope is that evidence from these RCTs will help the public
sector develop similarly-successful large-scale versions of these programs. Yet as argued by Ron
Haskins, President Bush’s Senior Advisor for Welfare Policy, even with RCTs where “promise has
been shown ... we struggle to scale up the programs we know to have impacts.”2
Perhaps in part because academics are rarely involved in the scale-up process, we have relatively
little scientific evidence about the nature of the scale-up problem or its remedies. What research
there is tends to focus on treatment heterogeneity, and how demand for the program by different
types of clients may change as scale increases in ways that affect average program impacts.3 But
there are other challenges too, on the provider (or “supply”) side.4 One key supply-side challenge
was noted by the distinguished sociologist Peter Rossi 30 years ago: “Given that a treatment is
effective in a pilot test does not mean that when turned over to YOAA [Your Ordinary American
Agency], effectiveness can be maintained . . . There is a big difference between running a program
on a small scale with highly skilled and very devoted personnel and running a program with the1For example, the most influential early-childhood RCTs in the United States, Perry Preschool and Abecedarian,
provided services to only about 50 children each in a single study site (Campbell et al., 2002; Schweinhart et al.,2005). The Nurse Family Partnership (NFP) home-visitation program was tested with a few hundred new mothersin three different cities (Olds, 2006). Even the most well-known social experiments in the US, such as the RANDHealth Insurance experiment, the Negative Income Tax experiments, or the Moving to Opportunity experiment, atmost have a few thousand study subjects.
2Former President Bill Clinton made a similar observation: “Nearly every problem has been solved by someone,somewhere...we can’t seem to replicate [those solutions] anywhere else.” Haskins: https://spotlightonpoverty.org/spotlight-exclusives/fighting-poverty-requires-evidence-based-policymaking/ Clinton: https://ssir.org/articles/entry/going_to_scale
3Previous studies essentially try to model the structure of the heterogeneity in treatment response, in order tobetter forecast average program effects when delivered to larger, more representative program populations (Andrewsand Oster, 2017; Campbell and Stanley, 1963; Cook and Campbell, 1979; Cronbach and Shapiro, 1982; Heckman andVytlacil, 2005, 2007; Hedges and O’Muircheartaigh, 2011; Tipton, 2013; Stuart et al., 2011). Part of the challengemay be due to variation across client populations in their willingness to comply with policy interventions (Al-Ubaydliet al., 2017a).
4In addition to the problem of inelastically-supplied inputs used by social programs, which is the focus of our ownpaper, previous research has mentioned other potential problems that providers may face including the difficultiesprograms may face in managing and preserving the organizational culture for a larger program, or general equilibriumeffects in which the market price or value for the outcome produced changes as more of it is supplied; see for example(Al-Ubaydli et al., 2017b; Banerjee et al., 2017). Below we consider the relationship between those challenges andthe one we consider.
2
lesser skilled and less devoted personnel that YOAA ordinarily has at its disposal” (1987).5
There is an economic explanation for this. As Summers (2003) noted: “When we use evidence
from small interventions to advocate significantly greater public expenditure, we must recognize
that we will run into some combination of diminishing returns and higher prices as we scale up
programs. It is difficult to quantify this decrease in benefits and increase in costs, but almost
certainly, large-scale programs will have lower rates of return than those measured for small-scale
programs” (p. 287).
While the challenge created by inelastically supplied program inputs obviously does not explain
every scale-up problem, it seems relevant for many important cases. Consider one canonical example
from education: class size. The Tennessee STAR experiment randomized 11, 600 students in grades
K − 3 into small or large classes. Teachers were also randomly assigned to classrooms, so teacher
“quality” was held constant. The experiment was so important partly because class size is one of
the biggest drivers of education budgets, and has been the topic of a great deal of policy debate
and of research within the economics of education. The STAR data suggested that reducing class
sizes by one-third increased test scores by 0.15 standard deviations (SD), with even larger gains
(0.24 SD) for African-American students (Mosteller, 1995; Krueger, 1999; Krueger and Whitmore,
2001; Schanzenbach, 2006).
These findings helped motivate California in the 1990s to spend $1 billion a year to reduce K−3
class sizes by a third statewide. But the statewide impacts were estimated to be just one-third to
one-half those from STAR (Jepsen and Rivkin, 2009). Treatment heterogeneity does not seem like
a promising explanation because the estimated effects in California were (at least in the first few
years) smaller in the high-poverty, mostly minority schools where benefits were the largest in the
STAR demonstration. The explanation offered by Jepsen and Rivkin (2009) is that California had
to hire an extra 25, 000 new teachers the first two years of implementing the policy, which led to
an influx of inexperienced, uncertified teachers. The consequences of this were compounded by the
decision of many experienced teachers who had been working in disadvantaged schools to leave for
new openings in more affluent districts. The result was a decline in teacher quality that partially
offset the benefits of reduced class-sizes.
Despite the potential importance of upward-sloping supply curves for program scale-up, this5https://www.gwern.net/docs/1987-rossi
3

possibility has not had much impact on economic research in practice. Table 1 shows most program
evaluations to date implicitly assume the benefit-cost ratios they estimate at small scale will hold
at larger scale. Of the 48 program evaluations published in leading general-interest or applied
micro-economic journals between 2005 and 2015, just one mentions the possibility that inelastic
supply for any program inputs could cause the program’s benefit-cost ratio to be different at large
versus small scale.6 None of these 48 studies has anything to say about what the benefits versus
costs of the intervention might actually be at large scale. Even the excellent benefit-cost analysis
of class-size reduction by Krueger (2003), which noted the possibility that “The quality of teachers
could decline (at least in the short run) if class size is reduced on a wide scale” (p. F59), wound
up in practice having to calculate benefits and costs at the scale the STAR demonstration was
implemented.7
Perhaps one reason studies do not account for possible supply-side impacts from scaling up
programs is the intrinsic difficulty of quantifying this phenomenon. We would ideally wish to
inform decisions about whether to scale a program by drawing on evidence for how the program
works at large scale. But the only way we can generate evidence about whether the program works
at large scale, it would seem, is by scaling it up.
Our goal in this paper is to propose a way out of this Catch-22. We first develop a simple model
that helps clarify the type of scale-up problem for which our method is useful. Most social programs,
like the teaching example above, essentially involve hiring a person to work with a client: Social
workers counsel the distressed; police work with crime victims and other community members;
lawyers assist the indigent; mentors counsel young people; doctors and nurses treat patients. We
know from a large body of social science research that people vary in their effectiveness at these
tasks, or put differently, vary in their skill. This means that social programs, like firms, confront a
search problem in the labor market that leads to inelastically-supplied human capital. Any program
that relies on at least one input that is inelastically supplied will, so long as there are not increasing
returns to scale, experience increasing costs per unit of output as scale increases, holding output
quality constant, or will have declining quality holding average costs constant. The shape of the6The journals we reviewed were the American Economic Review, Quarterly Journal of Economics, Journal of
Political Economy, Journal of Labor Economics, Journal of Human Resources, and the Journal of Public Economics.We define an article as a “program evaluation” if it measures the effect of a specific intervention.
7Kerwin and Thornton (2017) evaluate full and reduced cost version of a literacy program in Uganda in hopes ofdetermining how well the impacts may scale.
4

supply curve for any given input will depend on the accuracy of the provider’s prediction of input
quality at the hiring stage, how input quality as defined by the provider is valued by the rest of the
market, and the distribution of input quality within the population.
This simple model has several other relevant implications. The optimal mix of inputs for a
social program may be very different at small versus large scale. In addition, if some programs
depend more than others on inelastically-supplied inputs, the rank-ordering of social programs in
terms of their benefit-cost ratios may depend on the target scale of the program’s operations. For
example, at small scale, in-person tutoring might yield better results than any on-line instructional
technology because the tutors help motivate and inspire students in a way that the technology does
not. But as the scale increases, the program may no longer be able to find such inspiring tutors
at the same wage and will have to hire somewhat less inspiring tutors, so the value of the tutors
declines with scale. Therefore, the benefit-cost ratio of on-line tutoring may exceed that of the
in-person tutoring at a large scale, even if the value of in-person tutoring far exceeds that of on-line
tutoring at small scales. Of course, acting on these insights requires some way to measure impacts
not just at small scale, but at large scale as well.
Our proposed solution to the challenge of estimating program impacts at large scale relies on the
most basic (and powerful) element of our social-science toolkit: random sampling. We start with
the observation that hiring inherently involves the ranking of inputs. Our method merely requires
that the firm records these rankings. We show that it is then possible to operate a program at some
modest scale, n, but learn about the input supply curves facing the firm up to an arbitrarily larger
scale, say S×n, by randomly sampling inputs to hire from the provider’s rank-ordered list of inputs.
That is, instead of hiring the top-ranked inputs that the provider would choose at scale n, identify
the set of inputs the provider would hire if they were to operate at scale S×n and randomly sample
from that list. This adds a bit of sampling uncertainty relative to actually operating at scale S×n,
but in exchange greatly reduces the cost - and hence increases the feasibility- of understanding
how program input quality and prices would change at much larger scales. When the impacts of
individual workers are observable, this experimental design yields estimates which are informative
about input quality at every scale between 1 and S × n. One can determine which inputs would
be utilized at any of these scales because the program records its rankings of all inputs up to scale
S × n. Moreover, with some functional form assumptions one could even learn something about
5

input supply beyond scale S × n.
We build a simple two-period model of social-program decision making and use a model of
Bayesian learning to develop heuristics for when scale-up experiments are likely to be particularly
valuable. The primary benefit of the sort of scale-up experiment we propose is to reduce the variance
of the program provider’s beliefs about the level of worker human capital at large scale. This will
be relatively more valuable when the provider’s prior about the elasticity of human capital with
respect to scale is more dispersed, as may occur when a social program is new, and/or is making
relatively large changes in scale, and/or has few close substitutes in the outputs it produces.
Note that our proposed method for scale-up experiments also helps solve the problem of dis-
entangling “supply” versus “demand” effects on program effectiveness – that is, the role played by
changes in the way the program is delivered as it scales, versus the role played by changes in the
type of program recipient served as scale increases. Under our proposed scale-up experiment, the
pool of participants served is as if the program were delivered at scale n while average inputs are
used as if the program is delivered at scale S × n. The simplest version of our approach could not
tell us exactly what would happen at scale S × n because there would be demand-side changes
in program participant characteristics when actually operating at the much larger scale.8 But in
principle we could support the same sort of scale-extrapolation on the demand side by using what-
ever rank-ordering providers have of potential program participants to do the same type of random
sampling on the demand side.9 Carrying out demand-side and supply-side scale-up experiments
together may be particularly useful in applications where client-and-provider match quality may
be important.
We also present a series of empirical results that help illustrate our proposed scale-up experi-
ment method. We first present simulation results that demonstrate the tradeoff between cost and
sampling uncertainty, and also highlight the flexibility of the approach to account for various con-
straints that inevitably come up when carrying out RCTs in the real world. We then present the8Allcott (2015) documents “site-selection bias,” where the probability a program is adopted at a site is correlated
with the site specific impact, in Opower conservation programs. Al-Ubaydli et al. (2017a) note that one reasonthe marginal clients may benefit less as a program expands is reduced willingness to comply with the program’sconditions.
9In many social policy applications prospective clients may be rank-ordered by providers based on some assessmentof client risk or expected benefit from the program; in other cases clients are served on a first-come, first-serve basis,which also creates a rank-ordering. In those cases the same sort of random sampling approach we propose here couldbe carried out on the “demand” (client) side.
6
results of a translation task run on Amazon’s Mechanical Turk, which illustrates both how the
quality of inputs at a given price change as scale increases (or equivalently how the price needed
to maintain a given input quality changes with scale), and the value of our scale-up experiment for
avoiding an unexpected decline in program quality (or increase in program costs) as the program
is taken to scale. We conclude with the results from a personalized educational intervention we
have been studying in Chicago - SAGA tutoring - where we have the provider’s rank-ordering of
tutor quality from the hiring stage and have randomly assigned Chicago public school students
to tutors.10 We find that tutor “value-added” actually does not decline at all with the provider’s
rank-ordering of tutors at the time they were hired, which highlights an interesting implication
of our framework: The noisier the provider’s prediction of input quality, all else equal, the less
pronounced is the scale-up problem.
The insights that motivate our proposed scale-up experiments also suggest a new parameter
that could be estimated as part of many RCTs: the correlation between employee rank-order in the
hiring process and employee “quality” or value added. This statistic can be calculated whenever
employee value-added can be estimated, even in applications where a full-blown scale-up experiment
is not possible, and provides one simple summary statistic for the degree to which inelastic labor
supply might be a challenge for the scale-up of that program.
2 Conceptual Framework
In this section, we develop a simple model to illustrate a few basic insights that are typically
ignored in practice in the program evaluation literature and in the social policy community more
generally. We first show program effects will scale at a slower rate than the program’s size, so
long as the production function does not have increasing returns to scale, if at least one input is
inelastically supplied. Second, we show that heterogeneous inputs of the sort that are so central to
social programs (i.e. personnel) are generally inelastically supplied.10SAGA Innovations tutoring was originally delivered by Match Education of Boston. In 2015, executives from
Match Education spun off from Match to form SAGA Innovations, an independent enterprise that aims to bring thistutoring model into traditional public school systems across the country. We refer to the program as SAGA tutoringthroughout for ease of exposition.
7

2.1 Benefit-cost ratios will fall if even a single input is inelastically supplied
Suppose a social program is given a contract to serve n participants at a cost of m dollars per
participant. The program’s total impact is given by ∆ = p × F (H(L;w),K) where F (·) is a
constant returns to scale production function which takes workers’ human capital, H(L;w), and
capital, K, as inputs, and p is the market price or social value of whatever output the program
produces. We assume the program knows F (·).11 Other firm objective functions are of course
possible. For example, programs may seek to maximize total impact subject to some quality floor
set by their funders, where the program’s future funding might be jeopardized if output quality in
the current period falls below the floor. We return to this below in our empirical results.
The program chooses its inputs and the wage in order to maximize its net impact ∆−wL− rK
in the present period subject to the constraints of its contract, where we assume capital is perfectly
elastically supplied at a price of r, the firm chooses a wage w to pay workers, and human capital
is potentially inelastically supplied. The quantity of human capital depends on both the number
of workers hired and the wage. This yields an average impact of ∆/n with a benefit-cost ratio of
p× F (H(L;w),K)/(wL+ rK).
As Table 1 shows, program evaluations often make the implicit assumption that this benefit-cost
ratio can be maintained if a program’s scale increases. However, our simple set up makes clear , so
long as a production function does not have increasing returns to scale, the average program effect
can only be maintained at the same average cost at all scales when all inputs are perfectly elastically
supplied. If any inputs are inelastically supplied, average costs must increase with program size in
order to maintain the same average effect. Therefore, benefit-cost ratios will decline when even a
single input is inelastically supplied.
Moreover, the rate at which average program effects fall with scale holding costs constant (or
average costs rise holding program quality constant) will depend on a program’s relative utilization
of inelastically-supplied versus elastically-supplied inputs. Therefore, policymakers may be better
off scaling a program that yields modest returns at a small scale but utilizes elastically-supplied
inputs over one that has larger returns at small scale but relies more on inelastic inputs.11In practice, the program may only estimate ∆ by way of a randomized controlled trial.
8
2.2 Search for heterogenous inputs creates inelasticity
The previous subsection showed that inelastically supplied inputs cause average program effects to
decline as a program scales if average costs are held constant. Here we show that the provider’s
search for heterogeneous inputs is one source of this type of inelasticity. We suppose in what
follows that capital is homogeneous, but workers provide heterogeneous quantities of human capital.
Potential workers’ human capital is distributed according to density g(h;w) when the wage is w.
Since the program may screen applicants using the information acquired during the hiring
process, the distribution of hired workers’ human capital depends on the program’s ability to
accurately assess applicants’ human capital in addition to g(·). Of course the program provider
often does not know workers’ precise human capital at the hiring stage, but instead must rely on
a potentially noisy signal of each applicant’s true human capital:
h̃i = hi + εi,
where εi are assumed to be independent across applicants with variances σ2i which are unknown
to the program. If the program hires L workers at a wage w its human capital is given H(L;w) =∑Li=1 hi. We assume the program observes hi for each hired worker when impacts are realized.
If σ2i = 0 for all i then the program has perfect information about the relative ranking of
applicant quality and hires the L best applicants. In this case, human capital of hired workers is
given by:
H(L;w;σ2 ≡ 0) = h(|A|) + . . .+ h(|A|−L+1),
where h(1) ≤ . . . ≤ h(|A|) is the ordered set of applicants’ human capital levels. In the more general
case, when the program has imperfect information, the human capital of hired workers is:
H(L;w) = hh̃(|A|)+ . . .+ hh̃(|A|−L+1)
,
where hh̃(1), . . . , hh̃(|A|)
is the set of applicants’ human capital levels ordered according to h̃i.
This analysis implies that input quality, and by extension average costs, will be more elastic
9
with respect to program scale when a program is better at hiring the best workers. To see this,
observe that the elasticity of human capital with respect to program size n is:
γHn = dH/dn
H̄.
H̄ is the average human capital of workers hired at scale n and dH/dn is the human capital of the
marginal worker hired if the program’s scale increases to n + 1. When the program has perfect
information, it is necessarily the case that each worker supplies at least as much human capital
as the subsequently hired worker. This becomes less likely as the program’s signal-to-noise ratio
about worker productivity declines.12
While no simple model can explain every aspect of the scale-up challenge, we believe this model
is relevant for a large number of important applications. One reason is because of the importance of
skilled labor for so many social programs, combined with the large body of social science evidence
of substantial variation in worker effectiveness in many occupations such as teaching (Chetty et al.,
2014), medical care (Fletcher et al., 2014), policing (Rozema and Schanzenbach, 2016), and law
(Abrams and Yoon, 2007). A second reason is that the organizational or management challenges
that providers face as they grow, noted by Banerjee et al. (2017) and Al-Ubaydli et al. (2017b)
among others, can often be thought of as stemming from variation across workers in either their
ability to work with a given level of supervision or their commitment to the organization’s mission.
This is a problem that could in principle be solved in many cases by increasing wages, in order to
try to keep employee skill or commitment constant.13
3 Scale-Up Experiments
In this subsection, we propose a solution to the Catch-22 described in the introduction: when
deciding which programs should be scaled, we want to understand their impacts when implemented12The shape of the supply curve for labor inputs to a given program will additionally depend on how the human
capital valued by the program is distributed within the population, and how this human capital is valued by therest of the labor market. If for example the program has a unique output and production function that relies ona worker skill that is independent of what other programs (or private-sector firms) value, all else equal elasticity ofhuman capital with respect to program size will be lower than if the program valued the same type of workers asother employers.
13Alternatively a program could increase the program budget share devoted to managers as scale increases; in thiscase one could think of there being an upward sloping supply curve in what we might term “adequately monitoredor managed workers.”
10

at large scale. But how do we do that other than by implementing the program at large scale?
3.1 The Basic Idea
We showed in Section 2 that hiring inherently involves rank-ordering inputs in terms of their
predicted productivity. In order to hire the most productive or high-human-capital workers, the
program must form an explicit (or at least implicit) ranking of all applicants. So long as the
program is willing to document this rank-ordering, it will be able to predict which workers it
would hire at an arbitrary scale S × n without ever operating at that scale. The program can
then estimate how worker quality evolves with scale by randomly sampling the number of workers
needed to operate at scale n from the set of workers it would hire if operating at scale S × n. This
provides an opportunity for a program to reduce its uncertainty about how its impact will scale
before making the decision to scale.
Formally, let {h̃1,w, h̃2,w, . . .} denote the human capital levels of the set of applicants to the social
program when the wage is w, ordered according to the program’s signal of their quality. When
operating optimally, the program will hire the subset {h̃j,w}L(n)j=1 . This hiring strategy maximizes
the expected quality of inputs utilized by the program, yields an unbiased estimate of the program’s
impact at this scale and is informative about individual and total human capital up to scale n.
Alternatively, a program can learn about its expected impact at an arbitrary scale by running
a Scale-Up Experiment.
Definition 1. In a Scale-Up Experiment for an arbitrary scale S × n, a program randomly hires
L(n) workers from the larger subset of applicants {h̃j,w}L(S×n)j=1 at a rate of 1
L(S×n) .
This experimental design yields an unbiased estimate of average human capital at scale S × n,
is informative about how human capital changes with scale of up to S × n, and, if inputs are
homogeneous of degree one with respect to the program’s scale, yields an unbiased estimate of the
program’s impact at scale S × n.14 This additional information comes at the cost of obtaining a
somewhat noisier estimate of the program’s input quality at scale n and requiring the program
to operate suboptimally at its actual scale n since the program is choosing not to utilize the best14In general, this design yields an upper bound on the average impact at scale S × n. This is because a constant
returns to scale production function is concave in each of its inputs and Jensen’s Inequality implies that for a concavefunction, the function of the expectation is less than or equal to the expectation of the function.
11

inputs it could have hired to operate at scale n.
As an illustration of the potential value of a scale-up experiment, consider the hypothetical
“worker quality curve” in Figure 1. This figure shows the marginal worker’s quality as a function
of the number of workers hired by a hypothetical social program that will be considered in more
depth in subsection 4.1. Suppose the program will be implemented at a scale requiring 50 workers
as part of an RCT which will inform whether or not the scale of the program should be increased
to a level requiring 500 workers. If the program hires the 50 best applicants, the average worker
quality in the RCT will be 2.30. However, the average worker quality at the scale requiring 500
workers is 44 percent lower. Consequently, the RCT will overstate the program’s impact at the
larger scale. But if the program randomly hires 50 workers from the set of 500 workers it would hire
at the larger scale, the RCT will provide evidence about the program’s impact using an unbiased
estimate of worker quality at the scale of interest.
This design can be generalized in a number of ways. In some cases, like when recruitment
is done via an online platform, the program may be able to also randomize what wage workers
are promised. The program could then randomly vary wages and randomly sample workers from
applicant pools expecting different wages to identify H(S × n;w) for each wage. This additional
information comes at the cost of noisier estimates of average human capital at a given program
scale and wage.15
The design can also be easily adapted to incorporate more sophisticated sampling methods like
stratification, as discussed further below, and in principle could even be used to estimate elasticity
of human capital beyond scale S×n through extrapolation if we are willing to make some functional
form assumptions. The obvious concern is the possibility that the shape of the supply curve changes
beyond scale S × n. This possibility can never be entirely ruled out, so interpolation up through
scale S × n will always yield the most reliable information. But we can at least test how well
our functional form assumptions would hold up through scale S × n; that is, we can estimate the
functional form of the input supply curve up through scale (S−k)×n and see how well extrapolation
of that curve up through scale S × n fits the data.15While there are no federal labor laws prohibiting paying workers different wages for the same work as long as
the differences are not systematically related to a protected class, a potential cost of this type of wage experiment iscreating discontent among workers.
12

3.2 When to Run Scale-Up Experiments
In this subsection, we extend our model to examine the conditions under which it is optimal for
a program provider to carry out a scale-up experiment. The social program’s problem of learning
about input supply curves is similar to private-sector firms trying to learn the demand curves
for their products. As a result, our discussion builds on Mirman et al. (1993) who study price
experimentation by a monopolist who is uncertain about demand.
We assume a risk neutral social program operates for two periods. In the first period, the
program serves n individuals at a cost of m per participant. The program must decide whether to
operate as usual or to run a scale-up experiment about its impact at scale S × n while operating
at scale n. In the second period, the program can choose to operate at scale n or to expand its
scale to S × n participants, still at a cost of m per participant. The program aims to maximize its
total impact across these two periods. For simplicity, assume the program does not discount. As in
Section 2, the program’s impact is given by ∆ = p×F (H(L(N);w),K(N)) where L(N) and K(N)
are the program’s demand functions at an arbitrary scale N . Given its choice in each period, the
program chooses the quantity of its inputs according to these demand functions.
The program anticipates that its average human capital may be elastic with respect to its scale.
Specifically, it believes its average human capital at scale N and wage w is given by: H(L(N);w) =
H(L(n);w) − β1{N = S × n}. The program is uncertain about both the value of H(L(n);w),
average human capital at small scale n, and β, the reduction in average human capital if the
program increases its scale to S×n. Its priors over H(L(n);w) and β are N (µ0, ρ20) and N (b0, s2
0),
respectively. Together, these imply the program’s prior over average human capital at scale S × n,
H(L(S × n);w), is N (µ0 − b0, ρ20 + s2
0).
In the final period, the program operates as usual at scale n if it is not offered the larger
contract. If offered the larger contract, the program chooses its scale to maximize its expected net
impact in the current period given its beliefs:
V2(µ, ρ2, b, s2) ≡ maxs∈{S×n}
{∫ ∞−∞
F (h,K(n))1ρφ(h− µ
ρ)dh− wL(n)− rK(n),∫ ∞
−∞F (h,K(S × n)) 1√
ρ2 + s2φ(h− µ− b√ρ2 + s2 )dh− wL(S × n)− rK(S × n)},
13

where φ is the standard normal density. The first and second term in the maximum function are
the expected value of the program’s output at scale n and S × n given the program’s beliefs after
the first round, respectively.
In the first period, the program chooses whether to operate as usual at scale n (e = 0) or to run
a scale-up experiment of the sort we propose here (e = 1). The firm makes its first-period choice
in order to maximize its total net expected impact across both periods:
maxe∈{0,1}
V1(e;mu0, ρ20, b0, s
20),
where the first period value function equals is the sum of the expected value of the program’s output
in the first and second periods.
If the program chooses not to experiment (e = 0), the expected value of the program’s first and
second period output is given by:
V1(0;mu0, ρ20, b0, s
20) =
∫ ∞−∞
F (h,K(n)) 1ρ0φ(h− µ0
ρ0)dh− wL(n)− rK(n)
+ EH,β,0[V (µ, ρ2, b, s2))],
where the first term in the summation is the expected value of the program’s output if it operates
normally at scale n in the first period. The second term is the expected value of the program’s
output given the information it acquired in the first round and its second period decision. In this
case, the program’s new information in the first period is an estimate of its human capital at scale n,
H̄(L(n)), with expected standard error ρ√L(n)
. Because its priors are normal, the program updates
its belief about the mean of H(L(n);w) using a variance weighted average of the new estimate and
the mean of its prior. In expectation, the posterior mean is:
µ(H̄(L(n))) = L(n)L(n) + 1H̄(L(n)) + 1
L(n) + 1µ.
The expected posterior variance is:
ρ2(H̄(L(n))) = ρ2
L(n) + 1 .
14

The program does not observe any information about β and so its posterior over H(L(S × n);w)
becomes N (µ(H̄(L(n))− b0, ρ2(H̄(L(n))) + s20).
If instead the program chooses to experiment in the first period (e = 1), the expected value of
the program’s first and second period output is given by:
V1(1;mu0, ρ20, b0, s
20) =
∫ ∞−∞
F (h,K(n)) 1√ρ2
0 + s20
φ(h− µ0 − b0√ρ2
0 + s20
)dh− wL(n)− rK(n)
+ EH,β,1[V (µ, ρ2, b, s2))].
The first term is the expected value of the program’s output in the first period it it operates at
scale n using the average human capital from scale S × n. Because the program runs a scale-up
experiment in the first period, it observes an estimate H̄(L(S × n)) of its human capital at large
scale S × n with expected standard error√
ρ20+s2
0L(n) . Therefore, the program expects to update its
prior given the estimate H̄(L(S × n)) to:
µ(H̄(L(S × n)))) = L(n)L(n) + 1H̄(L(S × n)) + 1
L(n) + 1µ,
ρ2(H̄(L(S × n))) = ρ20 + s2
0L(n) + 1 .
This information is also informative about the average human capital at scale n, H(L(n);w), and
the reduction in average human capital from scaling, β. The posterior for the elasticity term β is:
fβ|H̄(L(S×n))(b|H̄(L(S × n))) =fH0(L(n))(H̄(L(S × n))− b)fβ0(b)∫∞
−∞ fH0(L(n))(H̄(L(S × n))− t)fβ0(t)dt,
where fH0(L(n)) and fβ0 denote the densities for the programs’ priors over H(L(n);w) and β.
Similarly, its H(L(n);w) posterior is:
fh|H̄(L(S×n))(h|H̄(L(S × n))) =fH0(L(n))(h)fβ0(H̄(L(S × n))− h)∫∞
−∞ fH0(L(n))(t)fβ0(H̄(L(S × n))− t)dt.
This analysis highlights that scale-up experiments are potentially valuable because they provide
information about impacts at scale S×n without requiring the program to actually operate at this
15
scale.16 By running a scale-up experiment instead of operating normally in the first period, the
program can reduce the variance of its beliefs about the level of human capital at scale S × n byL(n)L(n)+1s
2 in expectation. This highlights that the benefit of the scale-up experiment is larger when
its prior about the elasticity of human capital with respect to scale, β, is more dispersed. Prior
information is likely to be more dispersed when a social program is new, and/or is making big
changes in scale, and/or has few close substitutes. For example, a social program that provides
sandwiches to the homeless is likely far more certain about the cost of increasing its scale than a
more unique program relying on more specialized inputs, like the Harlem Children’s Zone.
Moving beyond our model, which we have kept as simple as possible for clarity, there are a
few other situations where the information derived from a scale-up experiment is relatively more
valuable. First, the value of the experiment’s information increases with the time horizon over
which the program may operate, since the program can use the information in all future periods.
Second, if an input is costly to adjust, like unionized workers, this information will reduce the risk
of the program getting stuck with more workers than it needs if it were to go to scale and then
revert back to the small scale. This could easily be incorporated into our model by considering
a longer time horizon and assuming the program must continue to utilize its inputs for a certain
number of periods. Third, when the program’s future funding is contingent on having a sufficiently
large benefit-cost ratio, the experiment will be particularly valuable because it reduces the risk of
losing funding if the program goes to scale. In some cases, funders may be unwilling to invest the
resources needed to scale a program because it is too risky. In this case, the program may only
ever be able to obtain the funding required to increase its scale if it can provide evidence that it
will continue to be cost effective at larger scales.
There are two primary costs associated with running a scale-up experiment. First, the program
potentially operates sub-optimally in the period it runs the scale-up experiment because it does not
utilize the best set of inputs: F (E[H(L(S×n))],K(n)) ≤ F (H(n),K(n)) and this equality is strict
if human capital is not perfectly elastic. Second, the program receives less information about the
distribution of human capital at scale n. Intuitively, the program’s human capital at scale S × n
is a noisy estimate of its human capital at scale n since it is mixed with information about β. In16Of course the scale-up experiment is only valuable if its choice about what scale to operate at in the second period
depends on realization of the results of the experiment. If instead the program were to find it optimal to operate atn or S × n for all possible human capital realizations, the scale-up experiment has no potential value.
16

practice, a third cost is that the social program potentially needs to also dedicate more resources to
recruitment. This final cost is outside the scope of our model since we have assumed the program
observes a signal of all workers’ human capital.
4 Empirical Applications
In this section, we present a series of results that illustrate the benefits, costs, and flexibility of
our proposed method for scale-up experiments. We begin with some simulations before turning
to an empirical example: a language translation task on Amazon’s Mechanical Turk (mTurk),
which highlights the magnitude of the decline in program quality that can result as scale increases
without increasing input prices. We also present results from a real-world application where we
have a non-profit tutoring program provider’s rank-ordering of tutors based on predicted quality at
the time of hiring, as well as measures of each tutor’s “value added” once hired. It turns out that
the non-profit in our application has little or no predictive power in assessing input quality at the
hiring stage, at least over the range of inputs that the organization actually hired. This application
demonstrates the interesting observation that there should not be much decline in program quality
as scale increases in cases when providers have difficulty predicting “input quality.”
4.1 Simulation Exercises
In this subsection, we present a concrete illustration of the potential benefits and costs of scale-up
experiments and variants of the simple design presented in the previous section. For this exercise,
imagine an educational program was shown to have a benefit-cost ratio far exceeding one at a
scale requiring 50 instructors. In light of these encouraging results, policymakers are interested in
providing enough funding to increase the program’s scale by a factor of 10.
Suppose that true instructor quality is given by Q∗, which is measured on some dimension of
student achievement. We assume Q∗ is normally distributed and has been standardized into Z-score
form, so Q∗ ∼ N (0, 1). The organization’s prediction of instructor quality at the hiring stage is
given by Q = Q∗ + ε. We assume initially that ε ∼ N (0, 0.4).
Suppose further that the organization screens 1, 000 applicants. Figure 1, which was discussed
above, shows workers’ marginal productivities as a function of their rank in the true productivity
17

distribution. Figure 2 shows the distribution of actual and predicted tutor quality at the hiring
stage (Q) from a single replication of this simulation. Moving from right to left, the dotted lines
indicate the sets of tutors the program would hire at scales requiring 50 and 500 tutors, respectively.
Note that among the set of hired tutors average predicted quality Q is higher than true quality Q∗:
at a scale of 50 average predicted quality is 2.62 compared to an average actual quality of 2.21,
while at a scale of 500 average predicted and actual quality are 1.41 and 1.17, respectively. This
occurs because the firm picks applicants with high predicted Q, which could be due to high true
quality (Q∗) or due to an extreme draw with respect to noise (ε).
Across 5, 000 replications of this simulation, the average instructor quality of the 50 strongest
applicants is Q∗ = 2.17, or more than 2 standard deviations above the average of the overall
applicant pool. In contrast, the average instructor quality of the 500 strongest applicants, 1.18, is
nearly 50 percent lower.
Now, suppose the program ran a scale-up experiment by randomly hiring 50 of the top 500
applicants. The average instructor quality among these 50 instructors is an unbiased estimate of
the average quality from actually hiring all 500 instructors - that is, randomization works. The
scale-up experiment yields this estimate at 10% of the cost of hiring the 500 instructors directly.
This reduction in program expenses comes at the cost of increasing the standard errors of the
estimates. The standard error around our estimate from a scale-up experiment is 0.086, or about
9 percent of a standard deviation in our achievement metric. This is about three times larger than
the standard error of 0.034 around the estimate if we had instead hired all 500 tutors.
We can also address a different sort of cost from our approach that is somewhat subtle, but
which was highlighted by our model above and may be relevant in many real-world applications.
The non-profit partner or the policymaker sponsoring the program may notice that the set of
people served by a program will benefit more when the 50 instructors are hired by having the
non-profit pick the 50 best people, rather than through some sort of random sampling scheme. The
tradeoff here is between reducing short-term impact (smaller average effect on the people actually
served with these 50 instructors) in exchange for information that can help guide the design of a
larger-scale version of the program, and hence (hopefully) greater long-term impact.
One way to reduce the short-term cost is through stratified sampling: Suppose the non-profit
gets 2,000 applications, uses the paper files to identify the top 1,000, and would like to estimate
18

the average quality of the 500 workers predicted to be best. Instead of randomly selecting which
50 applicants to hire, the program can use a stratified approach. A very simple version of this
would be to select the 25 best applicants with probability 1 and then randomly select the other 25
instructors from the remaining 475 workers ranked in the top 500 with probability 25/475. The
weighted average instructor quality is 1.180 (SE = 0.104), very similar to what we get from actually
hiring 500 instructors.17 But the unweighted average instructor quality - that is, the average quality
of instructors across individuals served during the scale-up experiment - is 1.76. This is almost 50
percent higher than the average worker quality using simple random sampling.18
These simulation exercises demonstrate scale-up experiments can substantially reduce the costs
of studying how programs would fare as their scale increases at the cost of somewhat more sampling
uncertainty. The design is flexible enough to be adapted to address many real-world constraints
that come up in carrying out small, medium or large-scale field experiments in practice.
4.2 An empirical application: mTurk translation task
We now present results from an experiment conducted on Amazon’s Mechanical Turk (mTurk) to
demonstrate how the results of our scale-up experiment are informative about how input quality
varies with scale at two different input price levels, in an application using real workers.
Imagine a social program that assists refugees with immigration paperwork by providing access
to online translators. The program is anticipating an influx in demand (say in response to the
global Syrian refugee crisis, or changes in US immigration policies). The program would like to
maintain the same quality of its translations at a larger scale, so it is interested in determining the
wage which would attract a larger pool of workers of the same average quality. To this end, the
program is considering whether to increase its scale and whether it is necessary to raise wages in17Specifically, this estimate places weights of 1/20 and 19/20 on the average quality of the top 25 workers and
remaining workers, respectively.18Screening more applicants can also be costly, but there is room for further cost savings by using random sampling.
Suppose for example that the program receives 2, 000 applications and intends to interview the 1, 000 applicants thatpassed an initial screen. If the program randomly selected 100 applicants from that group of 1,000 to interview,rank-ordered the interviewed pool and selected the top 50 applicants in this random applicant pool, the averageinstructor quality at a scale of 50 is still an unbiased estimate of what the program would get from actually hiring500 instructors. A simulation with 5,000 replications shows that the estimated average quality from this procedure isclose to the average quality of the top 500 instructors, with the estimate of 1.175 versus the estimate based on all 500teachers of 1.178. But interview expenses are 80% lower. The cost of randomly sampling at both the interviewing andhiring stage, rather than just randomly sampling at the hiring stage, is to further increase sampling uncertainty: thevariance in our estimate for true tutor quality, Q∗, increases to 0.106, a 23% increase over that from just randomlysampling at the hiring stage.
19

order to maintain its net impact.
We designed an mTurk “Human Intelligence Task” (HIT) with this hypothetical social program
in mind. All participants were paid to complete an application screen which included 10 multiple
choice German-English translation questions, randomly selected from a set of 32 potential questions.
We chose a German-English translation task to balance the desire for there to be some mTurk
workers who actually spoke the language against the concern that we might have too many highly-
skilled foreign-language speakers to not see any variation in translator quality over the feasible
range of our experiment. Half of participants were randomly invited to complete a second test with
20 questions drawn from a pool of 67 additional questions.19 The multiple choice questions were
based on translations in publicly available parallel corpora from Linguatools and Global Voices.
We hired workers for this task at two different wage rates. In our “high-wage” treatment,
participants were paid $2 for completing the pre-test and $4 for completing the post-test. In
our “low-wage” treatment, participants were paid $0.50 for completing the pre-test and $1.50 for
completing the post-test.20 Between January and March 2017, 351 HITs in the high wage treatment
were completed by 329 workers and 249 HITs in the low wage treatment were completed by 249
workers. About half of these workers completed the 20 question post-test: 171 workers in the high
wage treatment and 123 workers in the low wage treatment. A total of 110 workers participated in
both the high- and low-wage treatments.21
Figure 3 shows the predicted quality at each applicant-rank up to 250 for the two wage levels.
Each quality curve shows the expected share of questions answered correctly on the post-test as a
function of the participant’s rank on the pre-test.22 As economic theory would predict, expected
quality is higher at each pre-test rank in the high-wage treatment arm. Within each wage level,
expected quality declines with pre-test rank, but very slowly. The estimated elasticity of translator19Participants were not told selection was random. Specifically, they were told: “Based on this [pre-]test, you may
also be invited to complete a second test.”20The pre- and post-test were included in a single HIT on mTurk. The wage for completing the pre-test was the
posted wage for the HIT, but the HIT description included a note that workers could be paid the post-test rate as abonus.
21Specifically, 250 workers completed the high wage treatment between February 16th, 2017 and February 19th,2017. The low wage treatment was run in two batches. 100 workers completed the task on January 2nd, 2017 and250 more workers completed the task between February 16th, 2017 and March 19th, 2017.
22We estimate each of these quality curves by regressing the logarithm of the percentage of post-test questionsanswered correctly on the logarithm of the rank on the pre-test. The figures show the predicted percentage correctfrom each of these regressions. This specification assumes the elasticity of quality with respect to the number oftranslators is constant.
20
quality with respect to the number of translators is about -0.001 at both wages with a standard
error of about 0.0005. This elasticity implies a 1 percent increase in the number of translators is
associated with a 0.001 percent decline in average worker quality. The absolute level of translator
quality in our mTurk data is obviously quite low throughout the entire range we study here, but
that is not central to the key point we intend to illustrate with our example.
These data highlight the magnitude of the potential value to a program provider of carrying
out a scale-up experiment. Suppose for instance that the program initially operated with, say,
25 translators who were each paid $1.50 per translation exercise. Using the 14 workers randomly
selected to take the post-test whose performance on the low-wage pre-test ranked among the top
25,23 we estimate average translator quality, as measured by the share of items correctly translated,
is 0.33 (SE = 0.04). If the social value of each correctly done translation is $p the provider’s net
social value is ($p× 0.33× 25)− ($1.50× 25).
In planning how to best scale in anticipation of the influx in demand, say by 10-fold, the
program can run several versions of a scale-up experiment. Specifically, it can randomly select 25
workers from the top 250 applicants in the low or high-wage pools,24 or it can randomly sample a
total of 25 workers from both applicant pools, say 13 and 12 workers from the low and high wage
applicant pools, respectively. These experiments vary in their target estimands, in the precision of
their estimates and, in their costs. We simulate 5, 000 draws from each of these three approaches
by drawing workers from our mTurk applicant pools. The low wage scale-up experiment costs the
program no more than its small scale implementation and estimates that average translator quality
will be 0.28 (0.019) at a scale of 250 workers. The main cost of this experiment is realizing the 15
percent drop in translator quality. In contrast, the high wage experiment increases the program’s
costs by 167% and yields an estimate of average worker quality at a scale of 250 workers paid at
the high wage of 0.325 (0.024).25 This suggests the program can avoid almost all of the decline in
quality by raising its workers’ wages. The third approach has the advantage of yielding estimates of
average worker quality at a scale of 250 translators at both the low and high wage. Specifically, the
hybrid scale-up experiment estimates translator quality will be 0.283 (0.027) at the low wage and23Because of ties on the pre-test, the set of the “top 25” applicants includes 38 individuals.24Technically, there are only 249 applicants in the low wage applicant pool.25Another potential benefit of offering a higher wage is easier recruitment. At the high wage, we were able to
recruit 250 workers to complete our mTurk HIT in about three days. In contrast, it took ten times longer, about 31days, for us to recruit 250 workers to complete our low wage HIT.
21
0.326 (0.037) at the high wage. The trade-off for getting two estimates from a single experiment
is a 40 to 50 percent increase in the standard errors compared to the experiments drawing from a
single applicant pool.
The low-wage only experiment suggests average translator quality will be 0.28 with 250 trans-
lators paid the low wage. This suggests about a 15 percent reduction in translator quality. The
program will find it optimal to increase its scale when 250(0.28p − $1.50) ≥ 25(0.33p − $1.50).
This is the case if p ≥ 5.9. Otherwise, the provider’s net impact decreases at the larger scale.
The high wage scale-up experiment implies average translator quality will barely decline compared
to average quality at a small scale with a low wage, 0.325 compared to 0.33, when 250 trans-
lators are paid the high wage. But maintaining this quality requires a substantial increase in
wages. The program will prefer increasing its scale to 250 translators paid the higher wage when
250(0.325p− $4) ≥ 25(0.33p− $1.50), or p ≥ 13.18. The hybrid wage experiment provides similar
estimates of average translator quality at both wages, on average, but with about 50 percent more
variability across particular draws of the experiment.
4.3 Another empirical application: SAGA Tutoring
We now present some results from a real-world empirical example: a personalized educational
intervention that we have been working to study in Chicago, delivered in the form of small-group
instruction - that is, tutoring.
The main innovation of the math tutoring program we study is to substantially reduce the
costs of intensive one-on-one or two-on-one instruction. We have long known that small-group
instruction is the best way to teach anyone anything, since among other things it makes individu-
alizing instruction so much easier (see for example Bloom (1984)). The intervention we examine,
which was developed by the Match charter school in Boston originally and is now delivered by a
new non-profit (SAGA Innovations), recognized that the instructional “technology” of tutoring is
quite different from that of a classroom and requires far less formal training or on-the-job learning.
Instructors are people who are willing to spend 10 months doing public service at relatively low
wages ($19,000 plus benefits). This makes the high dosage of the tutoring model feasible from a
cost perspective. Previous studies of this intervention yield encouraging results at moderate scale
(see Fryer (2014) and Cook et al. (2015)). Can similar benefits be achieved at large scale?
22
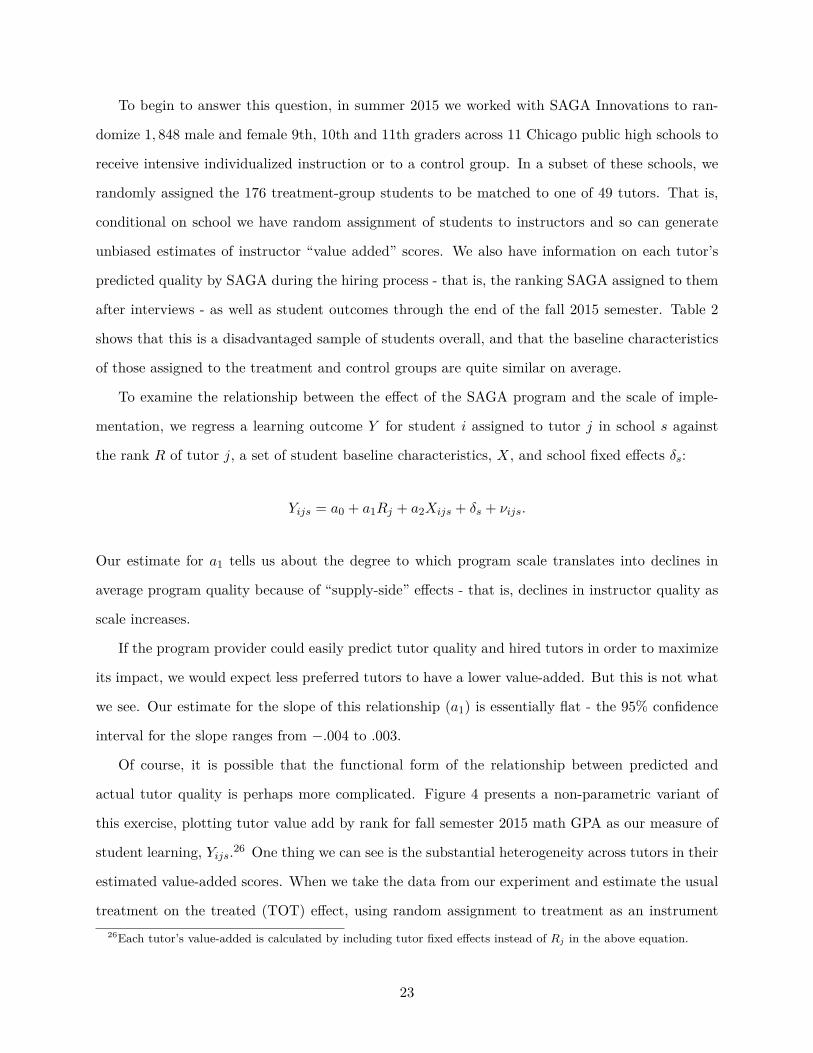
To begin to answer this question, in summer 2015 we worked with SAGA Innovations to ran-
domize 1, 848 male and female 9th, 10th and 11th graders across 11 Chicago public high schools to
receive intensive individualized instruction or to a control group. In a subset of these schools, we
randomly assigned the 176 treatment-group students to be matched to one of 49 tutors. That is,
conditional on school we have random assignment of students to instructors and so can generate
unbiased estimates of instructor “value added” scores. We also have information on each tutor’s
predicted quality by SAGA during the hiring process - that is, the ranking SAGA assigned to them
after interviews - as well as student outcomes through the end of the fall 2015 semester. Table 2
shows that this is a disadvantaged sample of students overall, and that the baseline characteristics
of those assigned to the treatment and control groups are quite similar on average.
To examine the relationship between the effect of the SAGA program and the scale of imple-
mentation, we regress a learning outcome Y for student i assigned to tutor j in school s against
the rank R of tutor j, a set of student baseline characteristics, X, and school fixed effects δs:
Yijs = a0 + a1Rj + a2Xijs + δs + νijs.
Our estimate for a1 tells us about the degree to which program scale translates into declines in
average program quality because of “supply-side” effects - that is, declines in instructor quality as
scale increases.
If the program provider could easily predict tutor quality and hired tutors in order to maximize
its impact, we would expect less preferred tutors to have a lower value-added. But this is not what
we see. Our estimate for the slope of this relationship (a1) is essentially flat - the 95% confidence
interval for the slope ranges from −.004 to .003.
Of course, it is possible that the functional form of the relationship between predicted and
actual tutor quality is perhaps more complicated. Figure 4 presents a non-parametric variant of
this exercise, plotting tutor value add by rank for fall semester 2015 math GPA as our measure of
student learning, Yijs.26 One thing we can see is the substantial heterogeneity across tutors in their
estimated value-added scores. When we take the data from our experiment and estimate the usual
treatment on the treated (TOT) effect, using random assignment to treatment as an instrument26Each tutor’s value-added is calculated by including tutor fixed effects instead of Rj in the above equation.
23
for program participation, we see an average TOT effect across all tutors of 0.49 points on a 0-4
GPA scale. The vertical axis in Figure 4 shows the difference in the value added of each individual
tutor (relative to the school-specific mean for that tutor’s school) on the same 0 to 4 GPA scale.
We can see that there is tremendous variation across tutors in value-added, spread out across a
band of nearly 2 full points on the GPA scale. The x-axis in this figure is each tutor’s predicted
quality - that is, their rank according to SAGA as predicted during the hiring process. Therefore,
even when we estimate the relationship between tutors’ initial ranking and actual value-added non-
parametrically we see little evidence for a downward sloping relationship between tutor rank-order
and tutor value-added, at least over the range of program operations that we can test with these
data.27
Given the promising results at moderate scale shown in Fryer (2014) and Cook et al. (2015),
SAGA is very likely to be given the opportunity to increase the scale of its operation. Without the
results of this scale-up experiment, SAGA and its funders would face a risky decision about how
to go about this scale up. SAGA potentially may have insisted on scaling slowly, or even resisted
scaling at all, because of the risks of having a fully scaled RCT upend the initially positive findings.
By running a scale-up experiment instead of going directly to a larger scale, SAGA greatly reduced
its uncertainty about worker human capital at large scale. Since tutor quality winds up not varying
much over the scale of tutors studied here, SAGA can have greater confidence that its estimated
impact at moderate scale will not decline because the program is being delivered by lower quality
tutors at the larger scale.
While the main purpose of this empirical exercise is to illustrate how our approach can be used
to estimate the elasticity of input quality to program scale, the specific substantive finding here is
also interesting. It turns out that the program provider’s prediction of tutor quality is mostly all
noise, at least within the set of tutors that they actually hired. This means that within this range
of current operations, as the provider dialed up or down the program scale there would be little
change in average input quality. Perhaps counter-intuitively, the worse the provider’s assessment
of input quality at the hiring stage, the less severe is the scale-up challenge. When the employer27The results are also similar if we exclude data from some of the lowest-ranked tutors who wound up quitting
during the fall semester, and (we believe) were replaced by much higher-quality tutors. In principle, this would biasour results in the direction of attenuating the relationship between the start-of-the-year tutor’s predicted quality rankby SAGA and the end-of-the-semester value-added estimate. But in practice the results are little changed.
24

cannot predict worker quality, the workers it hires at small scale are just a random sample of the
workers it would hire at larger scale.
5 Conclusion
Alinea is the best restaurant in Chicago, one of only twelve restaurants in the US to earn a Michelin
3-star rating, and widely considered to be one of the top restaurants in the world. Imagine asking
the question: “Could we take Alinea to scale? Could we open an Alinea in Memphis, Tennessee, and
San Diego, California, and St. Louis and Boston and New York and Philadelphia and Baltimore
and Atlanta?” Thinking about this question immediately makes clear that a central challenge -
if not the central challenge - would not be about whether customers are fundamentally different
across cities in ways that would affect their appreciation for high-end restaurant fare. The real
challenge instead is very clearly: How and where would we find enough skilled chefs and wait-staff
to run these restaurants? How and where would we get enough of the necessary ingredients?
The same challenge is frequently relevant when scaling up social programs. What at first
glance appears to be a long laundry list of different potential challenges to successfully scaling up
a social program are actually different versions of the same underlying problem: some “inputs” to
a program are in limited supply. To buy more of these inputs - teachers, program administrators,
program facilities - at larger and larger scale while holding quality constant will require increasing
the price paid for these inputs. Put differently, many important inputs to social programs have
what economists would describe as an “upward sloping supply curve.” This framework also helps
fundamentally re-orient our thinking away from the simple yes/no question “Does this program
scale?” to the ultimately much more constructive question “What cost-per-participant is required
to scale this program?”
The main contribution of our paper is to propose a method that lets us learn about how the cost
and quality of a program change as scale greatly increases without having to incur the full costs of
actually running the program at that much larger scale. The trick is randomization. We usually
think of random assignment as a key to successfully identifying whether a program works as part
of some impact evaluation - we randomly assign people to either get some program (“treatment”)
or not (“control”), just as in a randomized trial in medicine. But it is also possible to use random
25
assignment to learn how the program would work (or what would be required to make the program
work) at 5, 10, 50 or 100 times the actual scale at which it is operated by rank-ordering inputs
(teachers, tutors, etc.) and then randomly selecting inputs from that quality-ranked list.
We provide some initial illustrative empirical examples in the paper about how the procedure
works in practice, and that also illustrate the link between the severity of the problem we identify
and the degree to which input quality is predictable in advance. But our larger goal is to help
stimulate more work on the economics of scale-up. There are at present remarkably few examples
of programs that have been tested at small scale and then successfully taken to much larger scales,
and to the extent to which the field has thought about what breaks down during scale up it has
largely focused on issues related to treatment heterogeneity. Our paper highlights that there are
other basic challenges as well, and lays out a framework to begin empirically studying them.
References
Abrams, D. S. and Yoon, A. (2007). Understanding High Skill Worker Productivity using Random
Case Assignment in a Public Defender’s Office.
Al-Ubaydli, O., List, J. A., LoRe, D., and Suskind, D. (2017a). Scaling for Economists: Lessons
from the Medical Literature. Journal of Economic Perspectives, 31(4).
Al-Ubaydli, O., List, J. A., and Suskind, D. L. (2017b). What can we learn from experiments?
Understanding the Threats to the Scalability of Experimental Results. American Economic
Review, 107(5):282–286.
Allcott, H. (2015). Site Selection Bias in Program Evaluation. Quarterly Journal of Economics,
130(3):1117–1165.
Andrews, I. and Oster, E. (2017). Weighting for External Validity. NBER Working Paper Series,
23826.
Banerjee, A., Banerji, R., Berry, J., Duflo, E., Kannan, H., Mukerji, S., Shotland, M., and Walton,
M. (2017). From Proof of Concept To Scalable Policies: Challenges and Solutions, with an
Application. Journal of Economic Perspectives, 31(4).
26

Bloom, B. S. (1984). The 2 sigma problem: The search for methods of group instruction as effective
as one-on-one tutoring. Educational Researcher, 13(6):4–16.
Campbell, D. and Stanley, J. (1963). Experimental and quasi-experimental designs for research.
Houghton Mifflin Company, Boston, MA.
Campbell, F., Ramey, C., Pungello, E., Sparling, J., and Miller-Johnson, S. (2002). Early Childhood
Education: Young Adult Outcomes From the Abecedarian Project.
Chetty, R., Friedman, J. N., and Rockoff, J. E. (2014). Measuring the Impacts of Teachers II:
The long-term impacts of teachers: Teacher Value-Added and Student Outcomes in Adulthood.
American Economic Review, 104(9):2633–2679.
Cook, P. J., Dodge, K., Farkas, G., Roland G. Fryer, J., Guryan, J., Ludwig, J., Mayer, S., Pollack,
H., and Steinberg, L. (2015). Not too late: Improving academic outcomes for disadvantaged
youth.
Cook, T. and Campbell, D. (1979). Quasi-Experimentation: Design & Analysis Issues for Field
Settings. Houghton Mifflin.
Cronbach, L. and Shapiro, K. (1982). Designing evaluations of educational and social programs.
Jossey-Bass, San Francisco, CA.
Fletcher, J. M., Horwitz, L. I., and Bradley, E. (2014). Estimating the Value Added of Attending
Physicians on Patient Outcomes. NBER Working Paper Series, 20534.
Fryer, R. G. (2014). Injecting Charter School Best Practices into Traditional Public Schools:
Evidence from Field Experiments. Quarterly Journal of Economics, 129(3):1355–1407.
Heckman, J. and Vytlacil, E. (2005). Structural Equations, Treatment Effects, and Econometric
Policy Evaluation. Econometrica, 73(3):669–738.
Heckman, J. J. and Vytlacil, E. J. (2007). Econometric Evaluation of Social Programs, Part
II: Using the Marginal Treatment Effect to Organize Alternative Econometric Estimators to
Evaluate Social Programs, and to Forecast Their Effects in New Environments. In Handbook of
Econometrics, volume 6B, pages 4875–5143.
27
Hedges, L. V. and O’Muircheartaigh, C. (2011). Improving generalizations from designed experi-
ments.
Jepsen, C. and Rivkin, S. (2009). Class Size Reduction and Student Achievement: The Potential
Tradeoff between Teacher Quality and Class Size. The Journal of Human Resources, 44(1):223–
250.
Kerwin, J. T. and Thornton, R. (2017). Making the Grade: The Trade-off between Efficiency and
Effectiveness in Improving Student Learning.
Krueger, A. B. (1999). Experimental Estimates of Education Production Function. The Quarterly
Journal of Economics, 114(2):497–532.
Krueger, A. B. (2003). Economic Considerations and Class Size. The Economic Journal,
113(February):F34–F63.
Krueger, A. B. and Whitmore, D. M. (2001). The Effect of Attending a Small Class in the Early
Grades On College-Test Taking and Middle School Test Results: Evidence From Project Star.
The Economic Journal, 111:1–28.
Mirman, L. J., Samuelson, L., and Urbano, A. (1993). Monopoly Experimentation. International
Economic Review, 34(3):549–563.
Mosteller, F. (1995). The Tennessee Study of Class Size in the Early School Grades. The Future
of Children, 5(2):113–127.
Olds, D. (2006). The nurse-family partnership: An evidence based preventive intervention. Infant
Mental Health Journal, 27:5–25.
Rozema, K. and Schanzenbach, M. (2016). Good Cop , Bad Cop: An Analysis of Chicago Civilian
Allegations of Police Misconduct.
Schanzenbach, D. W. (2006). What have researchers learned from Project STAR? Brookings Papers
on Education Policy, pages 205–228.
Schweinhart, L. J., Montie, J., Xiang, Z., Barnett, W. S., Belfield, C. R., and Nores, M. (2005).
The High/Scope Perry Preschool Study Through Age 40. Technical report, High/Scope Press.
28
Stuart, E. A., Cole, S. R., Bradshaw, C. P., and Leaf, P. J. (2011). The use of propensity scores
to assess the generalizability of results from randomized trials. Journal of the Royal Statistical
Society, Series A(Part 2):369–386.
Summers, L. H. (2003). Comment. In Heckman, J. J., Krueger, A. B., and Friedman, B. M., editors,
Inequality in America: What Role for Human Capital Policies?, pages 285–291. The MIT Press,
Cambridge, MA.
Tipton, E. (2013). Improving generalizations from experiments using propensity score subclassifi-
cation: Assumptions, properties, and contexts. Journal of Educational and Behavioral Statistics,
38:239–266.
29

6 Tables and Figures
Figure 1: Example Worker Quality Curve
Notes. This figure shows marginal worker quality as a function of the number of workershired for a hypothetical social program.
30

Figure 2: Simulation Results
Notes. This figure shows the distribution of actual and predicted tutor quality at thehiring stage (Q) from a single replication of the simulation in subsection 4.1. Theblack and gray bars show the distributions of true and perceived quality, respectively.Moving from right to left, the dotted lines indicate the sets of tutors the program wouldhire at scales requiring 50 and 500 tutors, respectively.
31
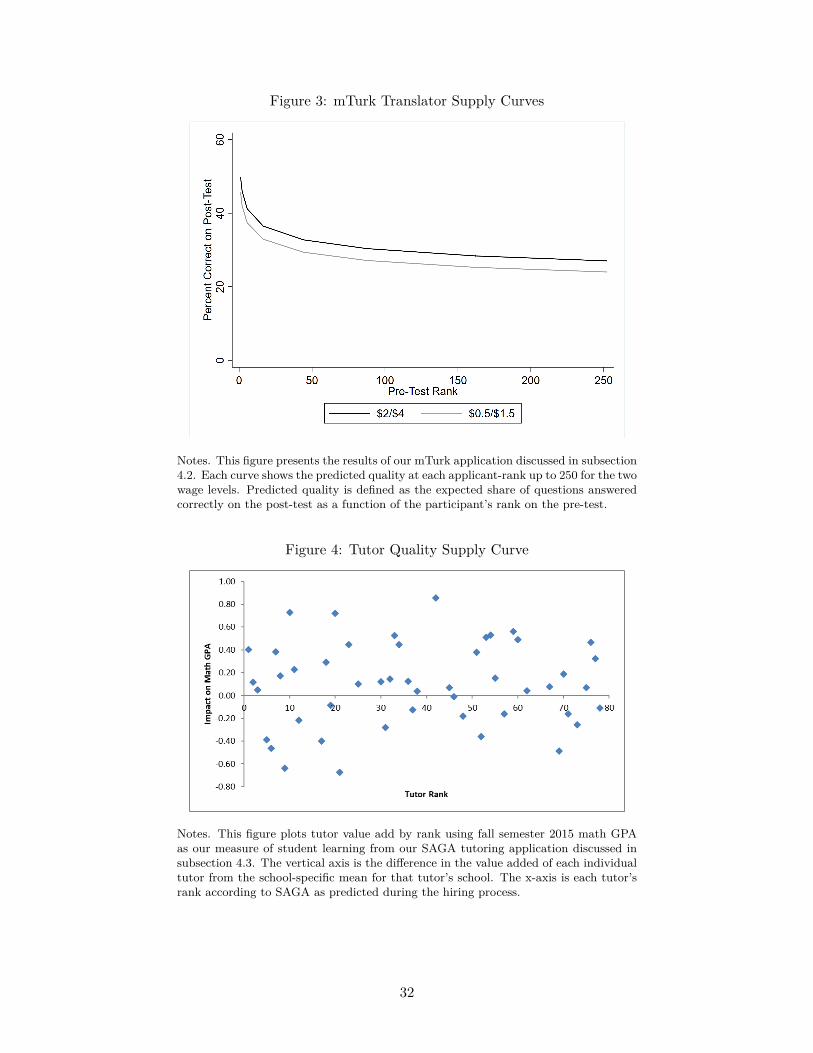
Figure 3: mTurk Translator Supply Curves
Notes. This figure presents the results of our mTurk application discussed in subsection4.2. Each curve shows the predicted quality at each applicant-rank up to 250 for the twowage levels. Predicted quality is defined as the expected share of questions answeredcorrectly on the post-test as a function of the participant’s rank on the pre-test.
Figure 4: Tutor Quality Supply Curve
Notes. This figure plots tutor value add by rank using fall semester 2015 math GPAas our measure of student learning from our SAGA tutoring application discussed insubsection 4.3. The vertical axis is the difference in the value added of each individualtutor from the school-specific mean for that tutor’s school. The x-axis is each tutor’srank according to SAGA as predicted during the hiring process.
32
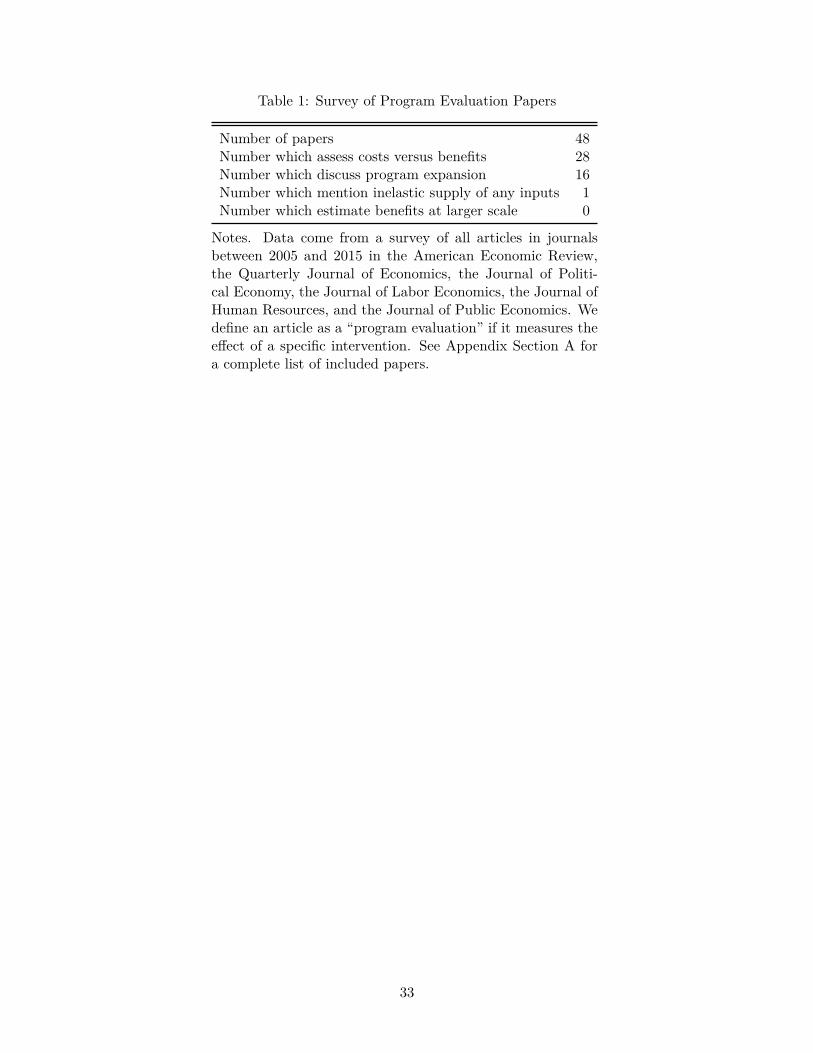
Table 1: Survey of Program Evaluation Papers
Number of papers 48Number which assess costs versus benefits 28Number which discuss program expansion 16Number which mention inelastic supply of any inputs 1Number which estimate benefits at larger scale 0
Notes. Data come from a survey of all articles in journalsbetween 2005 and 2015 in the American Economic Review,the Quarterly Journal of Economics, the Journal of Politi-cal Economy, the Journal of Labor Economics, the Journal ofHuman Resources, and the Journal of Public Economics. Wedefine an article as a “program evaluation” if it measures theeffect of a specific intervention. See Appendix Section A fora complete list of included papers.
33
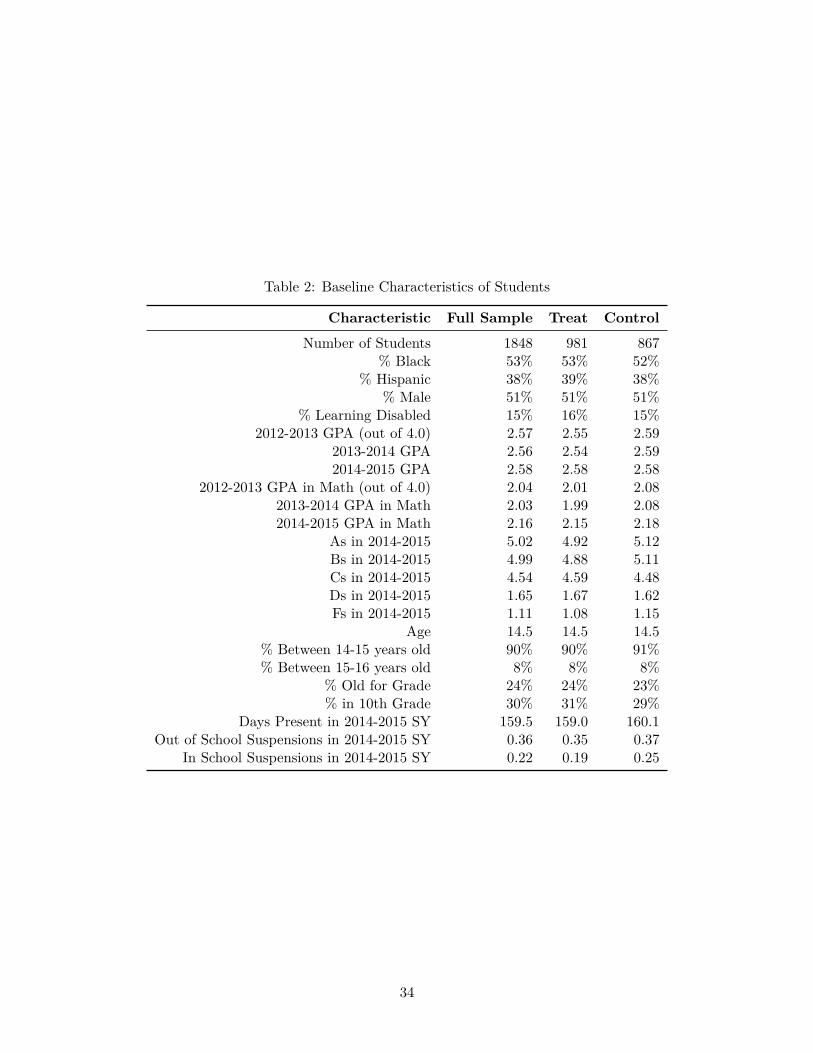
Table 2: Baseline Characteristics of Students
Characteristic Full Sample Treat ControlNumber of Students 1848 981 867
% Black 53% 53% 52%% Hispanic 38% 39% 38%
% Male 51% 51% 51%% Learning Disabled 15% 16% 15%
2012-2013 GPA (out of 4.0) 2.57 2.55 2.592013-2014 GPA 2.56 2.54 2.592014-2015 GPA 2.58 2.58 2.58
2012-2013 GPA in Math (out of 4.0) 2.04 2.01 2.082013-2014 GPA in Math 2.03 1.99 2.082014-2015 GPA in Math 2.16 2.15 2.18
As in 2014-2015 5.02 4.92 5.12Bs in 2014-2015 4.99 4.88 5.11Cs in 2014-2015 4.54 4.59 4.48Ds in 2014-2015 1.65 1.67 1.62Fs in 2014-2015 1.11 1.08 1.15
Age 14.5 14.5 14.5% Between 14-15 years old 90% 90% 91%% Between 15-16 years old 8% 8% 8%
% Old for Grade 24% 24% 23%% in 10th Grade 30% 31% 29%
Days Present in 2014-2015 SY 159.5 159.0 160.1Out of School Suspensions in 2014-2015 SY 0.36 0.35 0.37
In School Suspensions in 2014-2015 SY 0.22 0.19 0.25
34

A Table I Papers
Abeberese, Ama Baafra, Kumbler, Todd J., and Linden, Leigh L. (2014). Improving Reading Skills
by Encouraging Children to Read in School: A Randomized Evaluation of the Sa Aklat Sisikat
Reading Program in the Philippines. The Journal of Human Resources, (49):3611-633
Abramovsky, Laura, Battistin, Erich, Fitzsimons, Emla, Goodman, Alissa, and Simpson, Helen.
(2011). Providing Employers with Incentives to Train Low-Skilled Workers: Evidence from the UK
Employer Training Pilots. The Journal of Labor Economics, (29):1153-193
Altonji, Joseph G., Huang, Ching-I, and Taber, Christopher R. (2015). Estimating the Cream
Skimming Effect of School Choice. The Journal of Political Economy, (123):2266-324
Angrist, Joshua, Bettinger, Eric, and Kremer, Michael. (2006). Long-Term Educational Con-
sequences of Secondary School Vouchers: Evidence from Administrative Records in Colombia.
American Economic Review, 96(3):847-862
Avitabile, Circo. (2012). Does Information Improve the Health Behavior of Adults Targeted by a
Conditional Transfer Program?. The Journal of Human Resources, (47):3785-825
Baker, Michael, Gruber, Jonathan, and Milligan, Kevin. (2008). Universal Child Care, Maternal
Labor Supply, and Family Well-Being. The Journal of Political Economy, (116):4709-745
Barnett , Steve, Belfield, Clive R., Nores, Milagros, and Schweinhart, Lawrence. (2006). The
High/Scope Perry Preschool Program. The Journal of Human Resources, (41):1162-190
Barrow, Lisa, Brock, Thomas, Richburg-Hayes, Lashawn, and Rouse, Cecilia Elena. (2014). Paying
for Performance: The Education Impacts of a Community College Scholarhsip Program for Low-
income Adults. The Journal of Labor Economics, (32):3563-599
Behrman, Jere R., Parker, Susan W. and Todd, Petra E. (2011). Do Conditional Cash Transfers
for Schooling Generate Lasting Benefits? A Five-Year Followup of PROGRESA/Oportunidades.
The Journal of Human Resources, (46):193-122
Behrman, Jere R., Parker, Susan W., Todd, Petra E., and Wolpin, Kenneth I. (2015). Aligining
Learning Incentives of Students and Teachers: Results from a Social Experiment in Mexican High
Schools. The Journal of Political Economy, (123):2325-364
Bhattacharya, Jayanta, Currie, Janet, and Haider, Steven J. (2006). Breakfast of Champions? The
35

School Breakfast Program and the Nutrition of Children and Families. The Journal of Human
Resources, (41):3445-466
Burghardt, John, Schochet, Peter Z., and McConnell, Sheena. (2008). Does Job Corps Work?
Impact Findings from the National Job Corps Study. American Economic Review, 98(5):1864-86
Card, David, Michalopoulos, Charles, and Robins, Philip K. (2005). When financial work incentives
pay for themselves: evidence from a randomized social experiment for welfare recipients. The
Journal of Public Economics, (89):15-29
Chin, Aimee, N., Daysal, Meltem, and Imberman, Scott A. (2013). Impact of bilingual education
programs on limited English proficient students and their peers: Regression discontinuity evidence
from Texas. The Journal of Public Economics, 107():63-78
Cornwell, Christopher, Mustard, David B. and Sridhar, Deepa J. (2006). The Enrollment Effects
of Merit-Based Financial Aid: Evidence from Georgia’s HOPE Program. The Journal of Labor
Economics, (24):4761-786
Davis, Lucas W. (2008). The Effect of Driving Restrictions on Air Quality in Mexico City. The
Journal of Political Economy, (116):138-81
Decker, Paul T., O’Leary, Christopher J., and Wandner, Stephen A. (2003). Cost-Effectiveness of
Targeted Reemployment Bonuses. The Journal of Human Resources, (40):1270-279
Drago, Francesco, Galbiati, Roberto, and Vertova, Pietro. (2009). The Deterrent Effects of Prison:
Evidence from a Natural Experiment. The Journal of Political Economy, (117):2257-280
Duncan, Greg J., Ludwig, Jens, and Pinkston, Joshua C. (2005). Housing mobility programs
and economic self-sufficiency: Evidence from a randomized experiment. The Journal of Public
Economics, (89):1131-156
Duncan, Greg J. and Sojourner, Aaron J. (2013). Can Intensive Early Childood Intervention
Programs Eliminate Income-Based Cognitive and Achievement Gaps?. The Journal of Human
Resources, (48):4945-968
Dyke, Andrew, Heinrich, Carolyn J., Mueser, Peter R., Troske, Kenneth R., and Jeon, Kyung-
Seong. (2006). The Effects of Welfare-to-Work Program Activities on Labor Market Outcomes.
The Journal of Labor Economics, (24):3567-607
36

Engberg, John, Epple, Dennis, Imbrogno, Jason, Sieg, Holger, and Zimmer, Ron. (2014). Evaluat-
ing Education Programs That Have Lotteried Admission and Selective Attrition. The Journal of
Labor Economics, (32):127-63
Ferreyra, Maria Marta. (2007). Estimating the Effects of Private School Vouchers in Multidistrict
Economies. American Economic Review, 97(3):789-817
Figlio, David, Rush, Mark, and Yin, Lu. (2013). Is It Live or Is It Internet? Experimental Esti-
mates of the Effects of Online Instruction on Student Learning. The Journal of Labor Economics,
(31):4763-784
Filmer, Deon and Schady, Norbert. (2014). The Medium-Term Effects of Scholarships in a Low-
Income Country. The Journal of Human Resources, (49):3663-694
Frisvold, David E. (2015). Nutrition and cognitive achievement: An evaluation of the School
Breakfast Program. The Journal of Public Economics, 124():91-104
Fryer, Roland G. Jr. (2011). Financial Incentives and Student Achievement: Evidence from
Randomized Trials. The Quarterly Journal of Economics, 126(4):1755-1798
Fryer, Roland G. Jr. (2013). Teacher Incentives and Student Achievement: Evidence from new
York City Public Schools. The Journal of Labor Economics, (31):2373-407
Gayer, Ted and Gormley Jr., William T. (2005). Promoting School Readiness in Oklahoma: An
Evaluation of Tulsa’s Pre-K Program. The Journal of Human Resources, (40):3533-558
Glewwe, Paul, and Rutledge, Laine, and Wydick, Bruce. (2013). Does International Child Spon-
sorship Work? A Six-Country Study of Impacts on Adult Life Outcomes. The Journal of Political
Economy, (121):2393-436
Goodman, Sarena F. and Turner, Lesley J. (2013). The Design of Teacher Incentive Pay and
Educational Outcomes: Evidence from the New York City Bonus Program. The Journal of Labor
Economics, (31):2409-420
Graversen, Brian Krogn and van Ours, Jan C. (2008). How to help unemployed find jobs quickly:
Experimental evidence from a mandatory activation program. The Journal of Public Economics,
92(10):2020-2035
Greenberg, David H. and Robins, Philip K. (2008). Incorporating nonmarket time into benfit-cost
37

analyses of social programs: An application to the self-sufficiency project. The Journal of Public
Economics, 92(3):766-794
Ham, John C., Imrohoroglu, Ayse, and Song, Heonjae, and Swenson, Charles. (2011). Government
programs can improve local labor markets: Evidence from State Enterprise Zones, Federal Empow-
erment Zones and Federal Enterprise Community. The Journal of Public Economics, 95(7):779-797
Hotz, V. Joseph, Imbens, Guido W., Klerman, Jacob A. (2006). Evaluating the Differential Ef-
fects of Alternative Welfare-to-Work Training Components: A Reanalysis of the California GAIN
Program. The Journal of Labor Economics, (24):3521-566
Hoynes, Hilary Williamson and Schanzenbach, Diane Whitmore. (2012). Work incentives and the
Food Stamp Program. The Journal of Public Economics, 96(1):151-162
Hsieh, Chang-Tai and Urquiola, Miguel. (2006). The effects of generalized school choice on achieve-
ment and stratification: Evidence from Chile’s voucher program. The Journal of Public Economics,
(90):81477-1503
Husain, Muna, Millimet, Daniel L., and Tehernis, Rusty. (2010). School Nutrition Programs and
the Incidence of Childhood Obesity. The Journal of Human Resources, (45):3640-654
Jackson, C. Kirabo. (2010). A Little Now for a Lot Later: A Look at a Texas Advanced Placement
Incentive Program. The Journal of Human Resources, (45):3591-639
Jackson, C. Kirabo, Johnson, Rucker C., and Persico, Claudia. (2015). The Effects of School
Spending on Educational and Economic Outcomes: Evidence from School Finanace Reforms. The
Quarterly Journal of Economics, 131(1):157-218
Jacob, Brian A., Kapustin, Max, and Ludwig, Jens. (2014). The Impact of Housing Assistance
on Child Outcomes: Evidence from a Randomized Housing Lottery. The Quarterly Journal of
Economics, 130(1):465-506
Just, David R. and Price, Joseph. (2013). Using Incentives to Encourage Healthy Eating in
Children. The Journal of Human Resources, (48):4855-872
Lavy, Victor and Schlosser, Analia. (2005). Targeted Remedial Education for Underperforming
Teenagers: Costs and Benefits. The Journal of Labor Economics, (23):4839-874
Litschig, Stephan and Meller, Marian. (2014). Saving Lives: Evidence from a Conditional Food
38

Supplementation Program. The Journal of Human Resources, (49):41014-1052
Maestas, Nicole, Mullen, Kathleen J., and Strand, Alexander. (2013). Does Disability Insurance
Receipt Discourage Work? Using Examiner Assignment to Estimate Causal Effects of SSDI Receipt.
American Economic Review, 103(5):1797-1829
Messer, Dolores, Schwerdt, Guido, Woessmann, Ludger, and Wolter Stefan C. (2012). The impact
of an adult education voucher program: Evidence from a randomized field experiment. The Journal
of Public Economics, 96(7):569-583
Milligan, Kevin and Stabile, Mark. (2007). The integration of child tax credits and welfare:
Evidence from the Canadian National Child Benefit program. The Journal of Public Economics,
(91):1305-326
Muralidharan, Karthik and Sundararaman, Venkatesh. (2011). Teacher Performance Pay: Exper-
imental Evidence from India. The Journal of Political Economy, (119):139-77
39