Scalable Resolution Display Walls Abstract Introduction
17
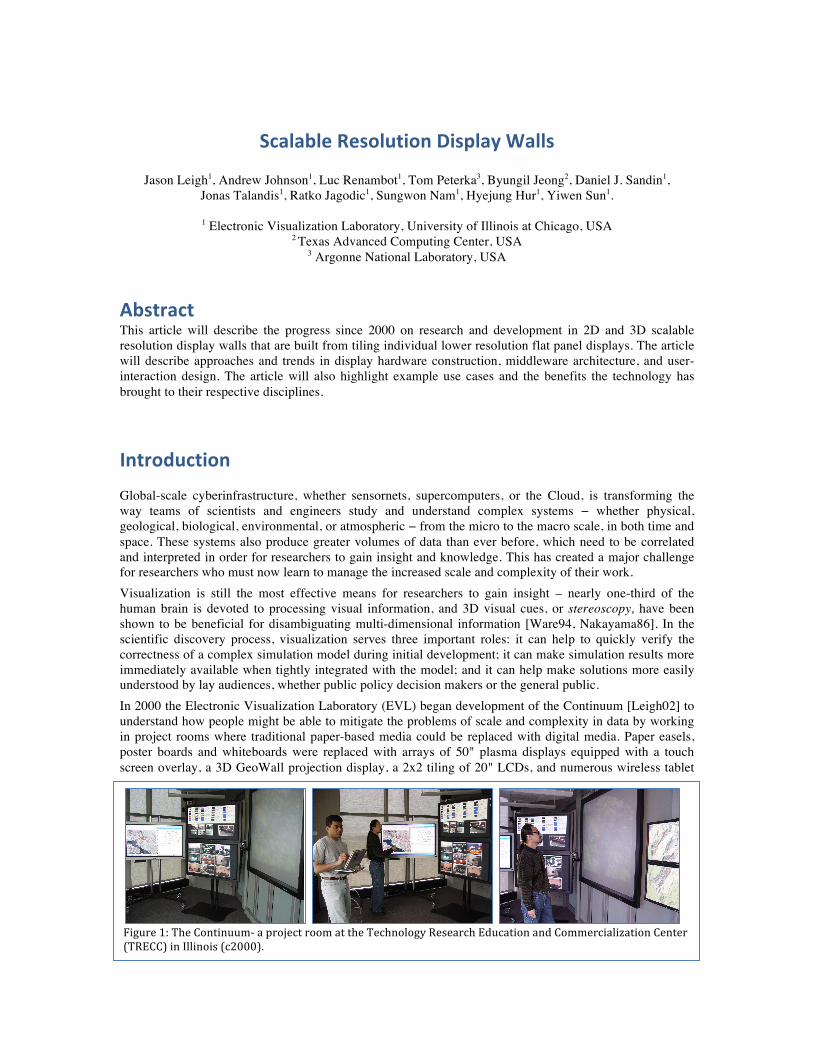
Scalable Resolution Display Walls Jason Leigh 1 , Andrew Johnson 1 , Luc Renambot 1 , Tom Peterka 3 , Byungil Jeong 2 , Daniel J. Sandin 1 , Jonas Talandis 1 , Ratko Jagodic 1 , Sungwon Nam 1 , Hyejung Hur 1 , Yiwen Sun 1 . 1 Electronic Visualization Laboratory, University of Illinois at Chicago, USA 2 Texas Advanced Computing Center, USA 3 Argonne National Laboratory, USA Abstract This article will describe the progress since 2000 on research and development in 2D and 3D scalable resolution display walls that are built from tiling individual lower resolution flat panel displays. The article will describe approaches and trends in display hardware construction, middleware architecture, and user- interaction design. The article will also highlight example use cases and the benefits the technology has brought to their respective disciplines. Introduction Global-scale cyberinfrastructure, whether sensornets, supercomputers, or the Cloud, is transforming the way teams of scientists and engineers study and understand complex systems − whether physical, geological, biological, environmental, or atmospheric − from the micro to the macro scale, in both time and space. These systems also produce greater volumes of data than ever before, which need to be correlated and interpreted in order for researchers to gain insight and knowledge. This has created a major challenge for researchers who must now learn to manage the increased scale and complexity of their work. Visualization is still the most effective means for researchers to gain insight – nearly one-third of the human brain is devoted to processing visual information, and 3D visual cues, or stereoscopy, have been shown to be beneficial for disambiguating multi-dimensional information [Ware94, Nakayama86]. In the scientific discovery process, visualization serves three important roles: it can help to quickly verify the correctness of a complex simulation model during initial development; it can make simulation results more immediately available when tightly integrated with the model; and it can help make solutions more easily understood by lay audiences, whether public policy decision makers or the general public. In 2000 the Electronic Visualization Laboratory (EVL) began development of the Continuum [Leigh02] to understand how people might be able to mitigate the problems of scale and complexity in data by working in project rooms where traditional paper-based media could be replaced with digital media. Paper easels, poster boards and whiteboards were replaced with arrays of 50" plasma displays equipped with a touch screen overlay, a 3D GeoWall projection display, a 2x2 tiling of 20" LCDs, and numerous wireless tablet Figure 1: The Continuum a project room at the Technology Research Education and Commercialization Center (TRECC) in Illinois (c2000).
Transcript of Scalable Resolution Display Walls Abstract Introduction
Scalable Resolution Display Walls
Jason Leigh1, Andrew Johnson1, Luc Renambot1, Tom Peterka3, Byungil Jeong2, Daniel J. Sandin1, Jonas Talandis1, Ratko Jagodic1, Sungwon Nam1, Hyejung Hur1, Yiwen Sun1.
1 Electronic Visualization Laboratory, University of Illinois at Chicago, USA
2 Texas Advanced Computing Center, USA 3 Argonne National Laboratory, USA
Abstract This article will describe the progress since 2000 on research and development in 2D and 3D scalable resolution display walls that are built from tiling individual lower resolution flat panel displays. The article will describe approaches and trends in display hardware construction, middleware architecture, and user-interaction design. The article will also highlight example use cases and the benefits the technology has brought to their respective disciplines.
Introduction Global-scale cyberinfrastructure, whether sensornets, supercomputers, or the Cloud, is transforming the way teams of scientists and engineers study and understand complex systems − whether physical, geological, biological, environmental, or atmospheric − from the micro to the macro scale, in both time and space. These systems also produce greater volumes of data than ever before, which need to be correlated and interpreted in order for researchers to gain insight and knowledge. This has created a major challenge for researchers who must now learn to manage the increased scale and complexity of their work. Visualization is still the most effective means for researchers to gain insight – nearly one-third of the human brain is devoted to processing visual information, and 3D visual cues, or stereoscopy, have been shown to be beneficial for disambiguating multi-dimensional information [Ware94, Nakayama86]. In the scientific discovery process, visualization serves three important roles: it can help to quickly verify the correctness of a complex simulation model during initial development; it can make simulation results more immediately available when tightly integrated with the model; and it can help make solutions more easily understood by lay audiences, whether public policy decision makers or the general public. In 2000 the Electronic Visualization Laboratory (EVL) began development of the Continuum [Leigh02] to understand how people might be able to mitigate the problems of scale and complexity in data by working in project rooms where traditional paper-based media could be replaced with digital media. Paper easels, poster boards and whiteboards were replaced with arrays of 50" plasma displays equipped with a touch screen overlay, a 3D GeoWall projection display, a 2x2 tiling of 20" LCDs, and numerous wireless tablet
Figure 1: The Continuum-‐ a project room at the Technology Research Education and Commercialization Center (TRECC) in Illinois (c2000).
computers. Users could write directly on a digital whiteboard, they could manipulate the documents with a wireless tablet computer, and they could communicate with distant colleagues using a multi-site video conferencing system. The GeoWall system enabled them to view scientific data in 3D while a tiling of 2x2 LCDs enabled them to view 2D data such as high-resolution maps. The target audiences for the Continuum were scientists and engineers who routinely had a need to collaborate with one another to interpret large quantities of disparate types of data. This kind of workspace leverages the traditional benefits of warrooms, which have been shown to increase productivity by as much as two-fold [Teasley00], and amplifies them with interactive computing connected to high-speed networks. Based on this research EVL predicted that, as technologies become more affordable, seamless and infinitely tileable displays will be used in a broad range of areas including marketing and finance, entertainment, and education, to name a few. This paper will discuss some of the challenging technical issues of scalable resolution display walls (SRDWs). The paper will begin with a discussion of the computing and networking infrastructure needed to construct walls of nearly arbitrary size and resolution. Then it will describe the software systems needed to build applications for the wall. The paper will also describe approaches for interacting with SRDWs and also highlight case studies of how a variety of user communities have used them. Lastly this paper will discuss issues that arise when attempting to enable seamless stereoscopic 3D on these walls.
Hardware In 2000, a special issue of “IEEE Computer Graphics and Applications” [CGA00] called “… onto the wall – Large Displays” covered the early work in this space. Editors Thomas Funkhouser and Kai Li selected papers that mostly focused on how to build large-display systems using sets of screens, projectors, cluster of computers, and graphics software to drive them. Most of the papers addressed computer system design, calibration and blending of projectors, human-computer interaction, remote visualization, and content design. A few early adopters of these technologies generated use case studies, in the car industry and the “office of the future” initiative for example. Five years later, Gordon Kurtenbach and George Fitzmaurice edited an issue of the magazine on the same topic [CGA05]. They wrote: “the emergence of large displays holds the promise of basking us in rich and dynamic visual landscapes of information, art, and entertainment”. The technologies described in the papers in this issue were still mostly tiling of projectors. However, a significant shift in the computer industry occurred: the emergence of powerful gaming graphics cards and PC clusters. This was a shift from specialized high-end computers (for computation and graphics) to off-the-shelf components driven by the consumer market. A single PC today can drive multiple displays using Graphics Processing Units (GPU) with several video outputs and/or several GPUs at the same time. Standard applications can now run unmodified on such systems with high-resolution. At the same time, HDTV has become widely available in the consumer market with HD plasma and LCD TVs. In the professional market 4-Megapixel LCD panels have been introduced (Apple 30” LCD at 2560x1600 pixel resolution) and 4K projectors have become available (Sony SXRD 4K 4096x2160 pixel resolution). The introduction of these new technologies requires the re-examining of past assumptions about SRDW hardware design.
Evolution of the hardware Graphical computer systems designed to drive large high-resolution displays have significantly evolved over the years, as a result of converging trends from the high-performance computing community and the consumer gaming market.

Computer Systems Initial systems consisted of a large graphics supercomputer (often manufactured by SGI) with custom graphics cards driving Cathode Ray Tube projectors. The CAVE (4-wall stereoscopic room) [Cruz-Neira93] and large visualization walls (often three to four projector systems) were designed this way: for instance, the CAVE first unveiled at the SIGGRAPH’92 conference consisted of four Electrohome video projectors each driven by a Silicon Graphics Onyx each with a Reality Engine graphics system. The advent of powerful personal computers (sustained by Moore’s law’s predicted increase in power and density) and the development of Beowulf clusters and Grid computing software packages offered new opportunities. Affordable PC clusters could be equipped with powerful consumer graphics cards from the gaming market. This led to the design of large projection systems with commodity video projectors like the “Scalable Display Wall” at Princeton University and the “Office of the Future” at the University of North Carolina at Chapel Hill. As LCD panels also became commodity devices, they replaced the projectors. Though LCDs possessed large borders, they were overall easier to maintain than projectors. A complementary trend is the component parallelization inside today’s computer: while the frequency race has slowed down in the industry, CPUs have become increasingly parallel utilizing multi-core technology. A 2011 workstation has as many as 12 cores (or 24 hardware threads), with many more planned in the manufacturers roadmaps. Similarly, GPUs employ a parallel computing architecture with hundreds of processing units, and fast PCI-express communication lets system integrators build systems with multiple GPUs and network interfaces. Large memory capacity is also available with increasing chip density. Overall, yesterday’s cluster is becoming workstation, with tens of concurrent tasks accessing large amounts of memory, driving several GPUs and accessing high-bandwidth networks. It is therefore now possible, and more practical, to build a large high-resolution wall driven by a single computer. One such example is the “Cyber Commons” wall at EVL, an 18-Mpixel display designed for science and education built around 18 near-seamless LCD panels driven by one single PC (three GPUs output six dual-link DVI signals which are multiplexed over eighteen single-link DVI cables using six Matrox TripleHead2Go multi-display adapters).
Figure 2: The CAVE Virtual Reality Environment (c1992).
Figure 3: The LambdaVision- the 100 Megapixel LCD wall was built from 55 20-inch LCD panels and driven by a cluster of 30 computers (c2005).

Networking While initial systems in the 90s used shared-memory within a graphics supercomputer to drive large displays, networking technologies became essential to manage and control a cluster of PCs. Slow networks by today’s standards, 100Mbits LANs, were initially used to synchronize systems and share user interaction events with the rendering nodes. Gigabit Ethernet networks and then specialized networks (Myrinet, etc) provided enough bandwidth (and in some cases lower latency) to share more data and change the programming models of these displays. Infiniband, popular in the High Performance Computing community, with its high-bandwidth and low-latency proved useful: high-bandwidth meant convenient access to large stored datasets to be rendered, while low-latency was useful for user interaction and synchronization. However, in 2003 technology specialists noticed a change in trends concerning optical networking and envisioned a world where wide-area bandwidth would become almost infinite (relative to local bandwidth) and would surpass the capacity of any single end-point, with exponential capacity growth in the core of the network (with DWDM optical network technology) and falling price of 10Gbps network interface (at the endpoints). This is the premise of the National Science Foundation’s OptIPuter project [Smarr08]. OptIPuter’s goal has been to enable researchers to easily interact with large-scale data objects and communicate via high-definition video with colleagues, whether local or remote, as easily as the Web makes it easy to access small data. The OptIPuter network was thought of as an optical overlay to the standard shared Internet, so that individual researchers could tightly couple computational resources over dedicated multi-gigabit optical networks. Such data superhighways are needed because the shared Internet and the World Wide Web are engineered to interactively handle megabyte-sized objects, whereas today’s scientific instruments generate gigabyte- to terabyte-sized datasets [Smarr08]. One outcome of the OptIPuter project was to scale up an end-user device from a single PC, appropriate for the shared internet, to a SRDW driven by low-cost commodity PC clusters and connected to an optical network (termed an OptIPortal) – to provide a greater pixel display area, storage, compute power, and I/O bandwidth, while maintaining personal interactivity [Smarr07]. To manage the information on OptIPortals, visualization middleware called SAGE, the Scalable Adaptive Graphics Environment [Jeong06], was developed. SAGE is essentially an operating system that lets users launch distributed visualization applications on remote clusters whose outputs are then streamed directly to OptIPortals of variable size, where they can be viewed and manipulated. [Renambot08]. Not only reserved to the scientists, this model is available today to everyone through the use of “cloud computing” where services are hosted by providers (such as Amazon, Google, Microsoft, etc.) on distributed data centers located around the globe. When interacting with colleagues and manipulating datasets, users leverage high-performance services (computation, storage, networking, rendering) while receiving only processed results (documents, graphs, images, videos) over low-bandwidth channels to his/her endpoints. Improvement in networking bandwidth to the end-points will improve the quality of the user experience, from mobile devices to the largest high-resolution wall display.
Figure 4: Cyber-Commons at the Electronic Visualization Laboratory– an 18-Megapixel Scalable Resolution Display Wall (c2009).

The Computing Node After the era of the graphics supercomputer (mainly shared-memory SGI machines), intense developments were focused on PC clusters equipped with high-frequency processors. This led the processor industry to a “power wall” where a single 3GHz chip could not be air-cooled, even with powerful fans. Simpler and smarter chips were designed which opened two avenues: on the one hand building systems with a very large number of nodes using simpler chips (like IBM with Blue-Gene) supported by very fast interconnection networks, and on the other hand building systems with fewer nodes but each one including multiple simpler processors on a single chip (like Intel with multi-core processors or Nvidia with hundreds of simple graphics processor cores onto a single chip). While both approaches are explored by scientists to provide the highest-end systems in the world (toward peta and exa-scale computing), the concentration of resources inside a single box has been very useful when designing and building a large display wall. Today, a single PC node can provide a sizeable amount of computing resources (multi-cpu multi-core systems with hardware threading support), a combination of fast and large amount of storage (large spinning hard drives and fast SSDs devices), several high-end GPUs, and several multi-10Gbps network interfaces (QDR Infiniband or dual-10G Ethernet). A growing trend is also to use the GPUs for both computation and graphics, using a hybrid programming approach leveraging both multi-core processors and GPUs appropriately. The parallelism of such systems (many CPU cores, many GPU cores, deep memory hierarchies, several network interfaces, several level of storage) results in complex resource allocation problems for the programmer [Vishwanath08]. However, it presents many benefits for the end user, in this case a domain scientist, having to manage only a single computer (or just a few) instead of a large cluster.
The Displays Initial wall displays were built around expensive and bulky CRT projectors. While low intensity, they were relatively high resolution and also highly configurable. Driven by a growing market for projectors in boardrooms to show “powerpoint” presentations, CRT projectors were eventually replaced by LCD and DLP projectors, which were lower in cost and smaller in form factor. These projectors presented however many challenges when used in groups (heat, maintenance, color accuracy, uniformity, control, high-contrast, etc.). Numerous efforts were made to use these inexpensive projectors. Although the initial cost of installation was relatively low, the high maintenance cost made them impractical for long-term use on large scale walls. The innovation in LCD technology expanded the design space, especially with desktop LCD panels (or consumer LCD high-definition TVs). LCD panels work reliably for tens of thousands of hours, are easily aligned in terms of color and geometry, and are easy to mount into tiled arrays. The only disadvantage was the thick borders / mullions around them. Early adopters found them to be invaluable for viewing high-resolution imagery such as satellite images, but found them problematic for displaying textual information as the thick borders tended to occlude text in ways that made it difficult to read. What was needed were flat panel displays with no borders or very small borders. To satisfy this demand display manufacturers (e.g. NEC, Sharp, Samsung, etc.) finally introduced in 2009 LCD panels with borders on the order of 2.5 to 3.5mm per side, often referred to as seamless or near-seamless displays. While still expensive (from $5,000 to $10,000 a panel), they provided the first opportunity to build SRDWs with non-intrusive borders. The first generation of these displays had a resolution of 1366x768 per panel. The next generation provided full 1920x1080 HD resolution.
Middleware In order to drive a collection of displays as if it were one unified display some form of middleware (either implemented as hardware or software) is needed to interface between the user’s application and the graphics hardware that drives the displays. While an application could conceivably drive the graphics hardware directly, the use of middleware has the advantage that it enables a broader range of applications to operate on displays regardless of resolution or tiling configuration. One can classify tiled display middleware as window managers such as DMX (Distributed Multihead X) [DMX] and SAGE (Scalable Adaptive Graphics Environment) [Jeong10], or as parallel graphics rendering frameworks such as Chromium [Humphreys02], Equalizer [Eilemann09], CGLX (Cross-Platform Cluster

Graphics Library) [Doerr11], DCV (Deep Computing Visualization) [IBM05] and ICE-T (Image Composition Engine for Tiles) [Kenneth03]. Tiled display window managers enable users to run and interact with multiple applications at the same time, as in a typical multi-tasking operating system, whereas parallel rendering frameworks are designed to enable an application to maximize the use of a display wall’s resolution. DMX provides a single unified X Window desktop by coupling multiple X servers on multiple machines. In DMX a master node distributes X Window primitives to other client nodes which render the graphics. This allows users to view and control general X applications on a tiled display in the same way as they do on a desktop computer environment. In contrast SAGE routes streams of pixels that may come from multiple disparate and concurrently running remote applications. SAGE provides a user-interface that enables multiple users to interact with the windows on the wall simultaneously, which makes better use of a large scale tiled display. In Chromium, a server intercepts OpenGL command streams from an OpenGL application and routes them to the intended display client nodes for rendering. IBM’s Deep Computing View (DCV) is a proprietary solution that has a similar set of functionalities to Chromium. Equalizer and CGLX are similar in that they run a copy or part of the application codes on the display client nodes, but Equalizer offers a more scalable and flexible approach in which a user can combine various parallel rendering algorithms, such as sort-first or sort-last [Molnar94], and support multi-screen configurations such as CAVEs or display walls. ICE-T is a sort-last parallel rendering framework that can redistribute the composited image fragments for a tiled display. The main advantage of Chromium and DMX over other approaches is that they enable conventional desktop graphics applications to run on a tiled display without modifying the underlying application code. However, this application transparency only extends as far as supporting OpenGL (Chromium) and X11 (DMX) applications. On the other hand, SAGE can support a wider range of applications with minimal code change, since it fetches and streams pixels from applications. Furthermore SAGE permits multiple applications to appear on the tiled display wall at the same time. Equalizer also requires some application code modification. In its simplest mode Equalizer runs an Equalizer-enabled OpenGL application executable on each client node in a manner similar to CGLX. ICE-T provides API calls to perform sort-last image compositing and image data redistribution for a tiled display. ParaView and VisIt [VisIt], two widely used parallel visualization tools, use ICE-T for image compositing. Both Chromium and DMX have limited scalability because in each its single data source (server) can become a bottleneck as the number of display client nodes increases. Equalizer and CGLX show better scalability than Chromium because each rendering client directly reads data from the data source (e.g. the file system) in parallel. Chromium also provides a parallel application interface for sort-last rendering, but it loses its main advantage, application transparency, in this mode. Chromium generally shows good performance with fill-rate limited applications running in retained mode (i.e. graphics data are streamed once in the beginning and follow-on streams are mostly control messages). However, even in the best case, Chromium is out-performed by Equalizer as the number of rendering clients increases [Eilemann09]. While the maximum tiled display dimension DMX supports is 4x4 (16 display client nodes), SAGE is designed to support much larger tiled displays (e.g. 15x5 tiles driven by 27 display client nodes). Since SAGE can route pixel streams from multiple application nodes to tiled display nodes, it does not have the single data source bottleneck. SAGE’s uniqueness lies in that it supports distant collaboration among multiple endpoints equipped with tiled displays connected by high-speed networks. It enables users to share their scientific visualization at an extremely high-resolution with remote collaborators while communicating with each other via multi-point high-definition video and audio streaming to their tiled displays. Chromium has been integrated with VNC [Richardson98] to support remote visualization and collaboration [Ahern08] and DCV also supports remote visualization streaming using VNC. However, in their approaches, a remote client can only be single desktop computer rather than a tiled display.

Historically, computer clusters were used to drive scalable tiled display walls. With the advent of “multi-headed” graphics cards such as AMD’s Eyefinity, NVIDIA’s Scalable Visualization Solutions, and Matrox’s Display Wall Controller, it is possible to support over a dozen displays from a single PC. Driving a tiled display with a single computer greatly reduces the cost of ownership and maintenance of a tiled display wall. Furthermore it enables applications to run natively, thereby eliminating the need to parallelize them. On the other hand driving a high-resolution wall with a single computer introduces significant challenges in resource management. In particular, the Operating System must be able to intelligently align the cores of a CPU, the available network capacity, bus bandwidth, and GPU resources to respond to the real time interactions of multiple users attempting to manipulate content on the wall at the same time. The prioritization of system resources would not necessarily be based on fastest job completion time such as in prior approaches [Etsion04, Evans93, Zheng10], but rather on which windows are the largest on the wall, which ones are least occluded by other windows, and which ones are being interacted with by a user. Work to develop such a multi-user interaction-based resource manager is currently underway in the design of the next generation of SAGE, called SAGE-Next. In order to adequately control systems resources, SAGE-Next uses the concept of Rails [Vishwanath08], which enables the alignment of specific cores and memory caches of a CPU, system interrupts, and the network interfaces, on an application basis - in essence providing them with the notion of “Quality of Service”.
User Interaction The goal of constructing rooms equipped with SRDWs is to create information spaces that cover our field of view, allowing multiple remote or collocated people to work together to create a shared representation made up of a variety of inter-related digital artifacts that are easily created, manipulated, and persistently stored. SRDWs empower users to better cope with information intensive tasks because they enable more information to be juxtaposed simultaneously. They also have the potential to promote more natural physical navigation of the content, and improve spatial performance when users are analyzing high-resolution datasets. But perhaps most importantly, the intersection of large size and high resolution makes them excellent collaborative workspaces, not too dissimilar from traditional paper-based warrooms or project rooms that have been found to provide up to a two-fold improvement in the productivity of its users [Teasley00]. However, the cited potential benefits of the SRDWs can only be achieved through the design of user-interfaces that are informed by the way people work in environments surrounded with content. Prior research has shown that previously well-established desktop interaction techniques generally do not scale to larger displays [Ball05, Czerwinski06], motivating the need for new approaches. For large display walls, prior efforts were directed at addressing the issues of target acquisition, cursor tracking, gesturing and pointing, mostly with single users in mind. However, given that vast quantities of content can potentially be posted on the display walls, there is a need for approaches to help multiple users, especially those working in teams, to easily and concurrently manipulate and organize the content. In this regard, the user-interface design in SAGE [Jagodic10] embodies the most comprehensive understanding of the problem to date. SAGE makes the following assumptions about the way users work in front of SRDWs.
• Distributed – User interfaces can be automatically displayed and interacted with across any number of displays, driven by any number of machines.
• Scalable – As the size and resolution of scalable displays varies significantly, it is imperative that the interaction system adapts to the target display size and resolution from the perspective of visibility and usability.
• Multi-user – Generally, empowering every user with control minimizes social barriers for participation by eliminating the need to request control or interfering with other users. This in turn promotes discussion and fosters collaboration. Additionally, individual control facilitates task division among group members, potentially increasing group performance through a greater degree of parallelism.
• Multi-modal – Given the numerous potential applications of scalable displays, it is unlikely that a single input modality will satisfy interaction requirements of every use case. The choice of

interaction modality depends on the number of potential users, the target display size and the mobility of users in front of the display.
Interaction Zones Various devices such as touch input, Gyromouse, trackpad, six degree-of-freedom tracked wand, Nintendo’s Wiimote, Microsoft Kinect, and wireless laptops/tablets, have all been examined as possible candidates for interacting with SRDWs. Observations of users suggest that as the distance between the user and the wall increases, so too does the preference for indirect interaction increase (Figure 5). For example, when a user is up-close to the wall, it is most convenient to be able to reach out with one’s hand and directly touch the image on the wall, whereas a user who is seated far from the wall would prefer to manipulate the information on the wall using the mouse pointer on their laptop to remotely control a pointer on the wall.
Display Space Management Mostly-overlapping windows on traditional desktop displays become mostly-visible windows on SRDWs, meaning that the problem of window switching now gives way to the problem of window organization. Compounded by the fact that large screen real estate will inevitably entice users to juxtapose more information, one must examine better ways to help users organize this information into meaningful arrangements. SAGE provides a number of features toward this end. For example SAGE provides resizable horizontal and vertical partitions for dividing the wall into smaller workspaces that can be managed independently. A tiling feature will automatically keep windows within a specified workspace organized in a logical grid, or an ordering that minimizes windows crossing over physical display mullions. SAGE also enables the current content on the wall to be saved to enable users to continue working at a later time, or to restore the state of the collaboration in the event of a computer or power failure.
Figure 5: Suitable modalities of interaction for four major interaction zones in front of a Scalable Resolution Display Wall.
Figure 6: A user partitions on the work space in SAGE by drawing wall dividers with his finger.

Supporting Collaborative Work Work in SRDWs closely mirrors the kinds of activity found in traditional paper-based warrooms and project rooms. Collaboration is amplified due to two factors: users are able to collectively externalize and organize all the relevant information; and users maintain a constant spatial awareness of the information and the experts in the room. Observations of users in SAGE revealed the following:
• Partitioning the Display Space - Partitioning the display space was frequently employed to designate individual workspaces for each user and to spatially categorize information.
• Individual Organization Preferences - Users seemed to embrace the ability to organize their own display space without interfering with others, and if we allow them to exercise their individual preferences they are more likely to adopt wall displays as a collaborative medium.
• Sense of Ownership - During collaborative work users seem to respect each other’s window ownership and personal space, even if not explicitly defined. This suggests that social protocols may be sufficient for coordinating control among groups of users.
• Supporting Reorganization – When users are engaged in analysis or sensemaking tasks, viewing information arranged in different logical arrangements can bring about different perspectives - a phenomenon often referred to as the Rashomon Effect [Heider88].
• Structure vs Freedom - Although automatic layout features are very useful in structuring the environment, users will always want the freedom to fine-tune the layout to exactly fit their needs.
• Organization Learning Curve - Display space organization became a necessary part of the workflow, however it is evident that using the space effectively is a skill to be learned. Perhaps the system can monitor the state of the display and assist with organization given any meta-data that might be available about the content being displayed.
• Offline Preparation – Users also have a need to prepare for meetings ahead of time by scripting the presentation from their desktop or laptop computers using a virtual template of the SRDW.
Voice Command A much less examined modality for interacting with SRDWs is through the use of voice commands. Voice commands are most effective when recognition accuracy is high, when they do not require the user to memorize a vocabulary or grammar, and when it takes less time to utter the verbal command than to perform the action through direct manipulation. Articulate is a system that attempts to interpret natural language queries to automatically produce appropriate visualizations of data. This is compelling for controlling SRDWs because it can provide a rapid means of creating data plots and other more advanced visualizations without requiring the user to struggle with yet another user-interaction device. The use of a natural language interpreter enables the user to issue commands without conforming to a rigid grammatical structure, and a graph reasoner enables the system to make an educated guess as to the type of visualization that best answers the user’s query. The approach de-emphasizes the physical manipulations needed to create a desired graph, so that the user can focus on asking questions about the data. Initial studies of the system showed this indeed to be true. Users took less time to accurately produce a desired graph using Articulate than a more familiar tool, Microsoft Excel [Sun10].
Achieving 3D Thus far SRDWs have primarily displayed 2D content. With the advent of 3D-capable LCD displays it is likely that all displays in the future will provide a 3D display capability essentially for free in the same way that stereo and surround sound audio are a standard feature of all audio/visual systems today. In the early 1990s, stereoscopic head-mounted displays (HMDs) and immersive CAVEs [Cruz-Neira93] cost from tens of thousands to one million dollars; today a 3D television costs as little as a thousand dollars. The holy grail of stereoscopic computer displays is autostereoscopy - the ability to show stereoscopic images without requiring the user to wear any form of mediating glasses. Autostereo displays work by presenting the viewer with a vertically interleaved set of left and right eye stereoscopic images, and then using either vertical strips of plastic lenses or a physical line screen barrier separated by a small gap. This allows separate left and right eye images to be presented to the viewer without requiring them to wear any form of eyewear, such as those used in HMDs or the CAVE. One drawback of this technique is that when a
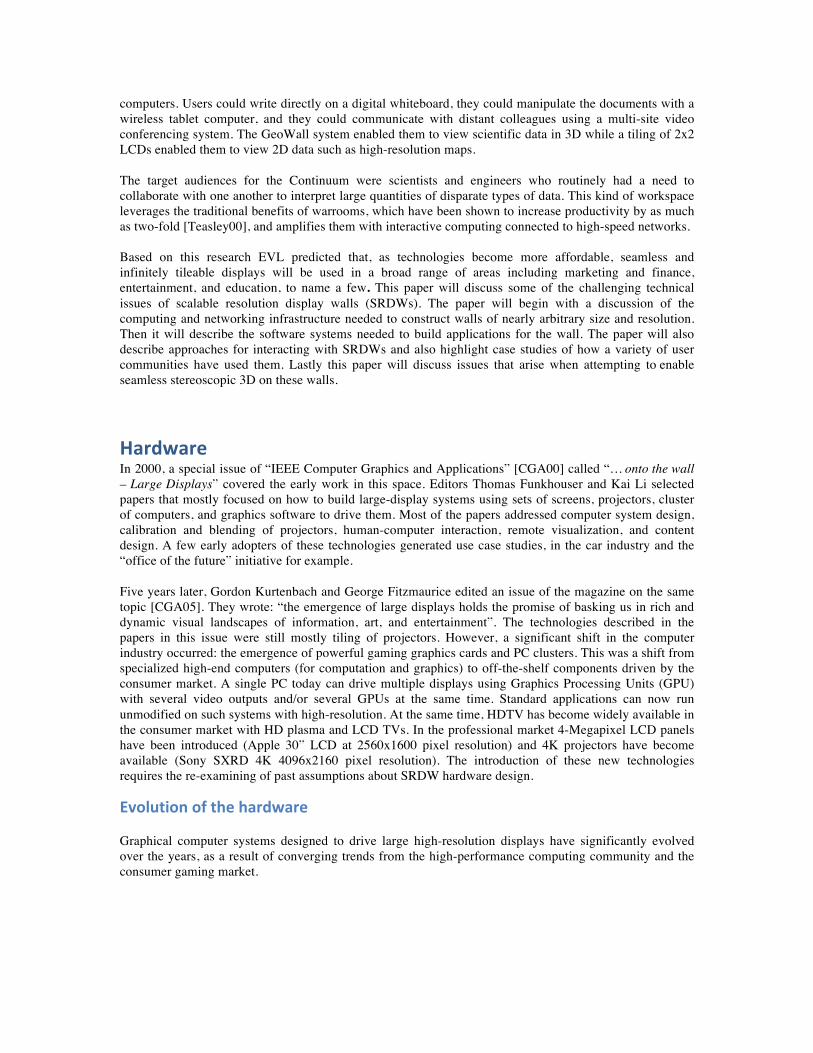
viewer moves his/her head an opposite pair of images can potentially be presented to the viewer creating reversed stereo (also known as pseudo-stereo). To compensate for this, head tracking systems such as the ones used in the CAVE, or camera-based tracking systems, were used to track the viewers head to ensure the correct set of left/right eye images were presented to the viewer. To support multiple viewers, multiple views must be simultaneously projected from the display. Approaches for this include: spatial multiplexing - where the total resolution of the display is split between multiple views; multi-projector - where an array of projectors simultaneously project multiple views onto a special transmissive or reflective screen; or time-sequential - where a single very fast display device creates multiple views that are synchronized with a secondary optical component (such as a ferroelectric liquid crystal shutter) that directs the images to the appropriate zones in space. At the present time, the only practical approach is spatial multiplexing, as the approach can take advantage of new and higher density LCD displays. One significant drawback of autostereo displays is that at least half the horizontal resolution of a display is lost in order to present both left and right eye images. This has led some researchers to develop high-resolution autostereo SRDWs using either a tiling of LCD panels or an array of horizontally placed projectors [Martin00]. In the former case a barrier-screen-based system called Varrier used a 7x5 tiling of 21" LCD panels, providing an autostereo resolution of 3000x6000 [Sandin05], pictured in Figure 7. Shortly after the invention of the Varrier, a major breakthrough was achieved whereby a screen could display both autostereoscopic and monoscopic content within sub-windows on a single screen. Known as the Dynallax (for Dynamic Parallax barrier), this particular approach replaced the static Varrier barrier screen with an LCD panel that could be dynamically controlled to draw lines that are any width and pitch, as well as regions with and without the line screens (and hence regions with and without the stereo effect) [Peterka07].
Whereas Varrier was designed to provide autostereo for a single viewpoint, the Dynallax technique has been shown to be able to potentially support multiple views. The ability to present multiple views simultaneously allows more than one viewer to see autostereoscopic images at the same time. This is important if autostereo is to ever become a practical mainstream display device. Commercial products are also beginning to emerge, albeit still at a very low resolution. For example Philips’ WOWzone system consists of a tiling of 3x3 42-inch 1920x1080 LCDs that provides nine views at an effective autostereo resolution of 640x3240 pixels per eye.
Whereas it will take many years for autostereo to be perfected to the point that they are practical commercial products, it is possible in the interim to develop high quality stereoscopic SRDWs using passive stereo techniques, such as in the Next Generation CAVE [Leigh07,09; DeFanti10]. The goals in selecting a display technology for the NG-CAVE 3D environment are scalable resolution, high brightness and contrast, thin borders, and
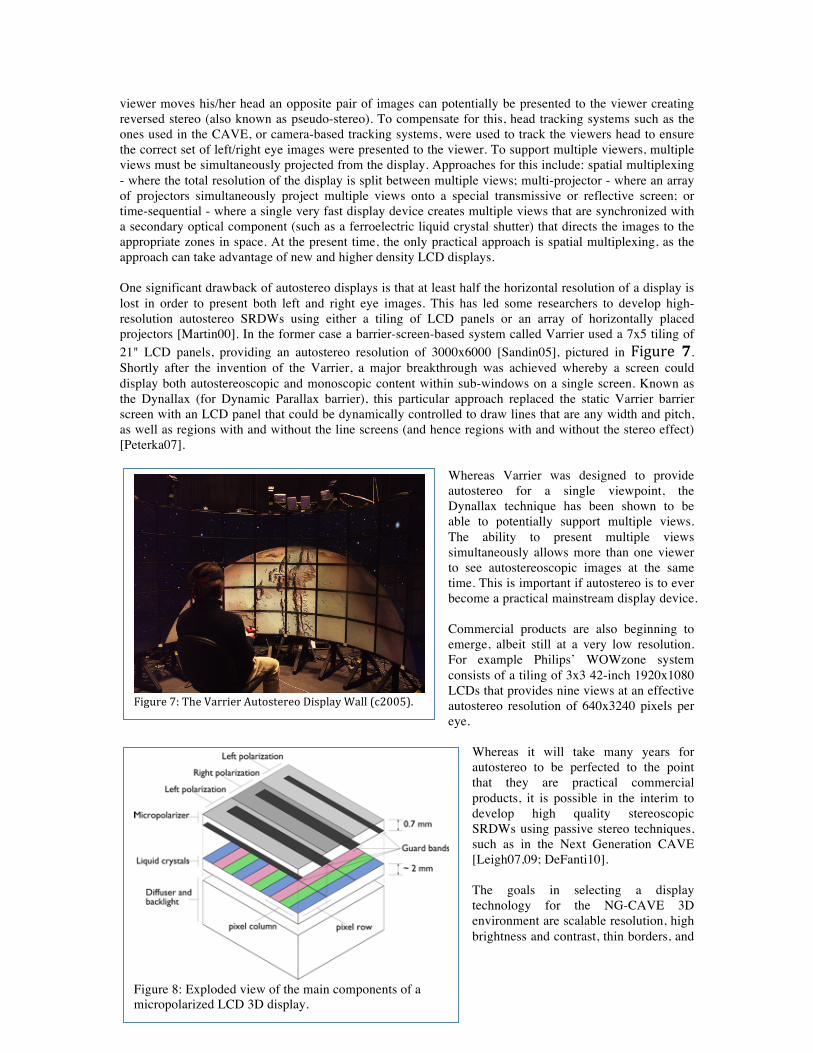
Figure 8: Exploded view of the main components of a micropolarized LCD 3D display.
Figure 7: The Varrier Autostereo Display Wall (c2005).

low maintenance. These factors argue for using LCDs, especially given the emergence of ultra-thin bezels (<4mm per side). Several 3D technologies for LCDs were considered and passive micropolarized stereo was determined to offer the best combination of image quality and practicality. A micropolarizer is a thin (0.8 mm) overlay that polarizes each pixel row in alternate directions, as in Figure 8. Its strengths are simple construction, compatibility with thin-bezel displays, commercial availability, and good image quality normal to the display surface as well as off-axis in the direction parallel to the micropolarizer lines. Its main drawback is image crosstalk in the direction perpendicular to the micropolarizer lines. Several configurations have been tested, including finished products as well as in-house bench assembly of a micropolarizing sheet from Arisawa [Arisawa11] on top of LCD displays from two manufacturers. All
displays were 46-inch, 1920 x 1080, with a pixel pitch of 0.530 mm. The micropolarizing sheet consists of rows of alternating retarders, further separated by black lines called guard bands, on a glass substrate. When the micropolarizer is registered with the pixel grid, alternate pixel rows are polarized oppositely and are visible in each eye.
The percentage of crosstalk is the amount of light, intended for one eye, entering the other eye. While zero crosstalk is ideal, in practice 2-5% is very good, and 5-8% is
acceptable. Three test patterns were used for quantitative evaluation (see Figure 9) in addition to qualitatively evaluating virtual scenes of 3D objects. The full-field pattern consists of a black image for one eye and white for the other and is used for registering the micropolarizer overlay with the LCD pixel rows. Both angular and positional registration are easily found by adjusting the orientation and location of the overly in order to create full, uniform fields that maximize the contrast between the white and black channels. The cross-hatch test pattern consists of white diagonal bars in opposite directions, angled up for one eye and down for the other eye, and is used to measure crosstalk photometrically by aiming a spot-meter at four different regions in the pattern. If region 0 is black in both channels, region 1 is black in the “signal” channel and white in the crosstalk channel, region 2 is white in the signal channel and black in the crosstalk channel, and region 3 is white in both channels, then the crosstalk is (I1 – I0) / (I2 – I0), where In is the intensity in region n. The process is repeated for each eye, and the results are averaged.
The Weissman test pattern is a visual gradient consisting of varying gray-scale reference bars [Weissman11], and crosstalk is visually compared to a reference pattern. The percentage crosstalk for each set of reference lines has been pre-computed and is read directly from the chart. Accurate results require color and contrast to be matched among displays, and there is also some subjectivity when different individuals view the pattern. In practice, the pattern is accurate to a range of values (for example, between 2-4%), and the center of that range was recorded.
LCD Type Cross-hatch
Pattern Crosstalk
Weismann Pattern
Crosstalk
Average Crosstalk
Bonded Brand X 2% 2% 2%
Unbonded Brand X 5% 3% 4%
Unbonded Brand Y 10% 4% 7%
Table 1: The LCD panels are evaluated using two test patterns. Bonded / unbonded refers to whether a commercial finished product was evaluated versus our bench assembly LCD, without an optical bond.
Full-field Pattern
Cross-hatch Pattern
Weissman Pattern
[Weissman 2011]
Left Eye
Right Eye
Figure 9: Test pattern used to register micropolarizer overlay with pixel grid (Full-field) and two test patterns to measure crosstalk (Cross-hatch and Weissman).

Table 1 shows the results of the crosstalk measurements on three LCD displays and demonstrates that overall crosstalk levels are acceptable. A good optical bond can improve crosstalk by a factor of two, as the first and second rows (bonded vs. unbonded) of Figure 9 show. It is believed that different pixel substructure, brightness and contrast account for the differences between the second and third rows (unbonded display models). Our tests indicate that thin-bezel micropolarized displays are a viable direction for the development of the NG-CAVE display technology. More commercial models have become available since these tests were conducted, and those will be evaluated as well. One limitation of micropolarized displays is that cross-talk increases dramatically when viewing off-center in a direction perpendicular to the micropolarizer lines. Tests showed a cutoff at approximately 15-20 degrees. This must be considered when designing tiled walls and CAVEs. For example, a wall spanning an 8-foot high space would need to be viewed from 12 feet away in order for the top and bottom of the display to have acceptable crosstalk. Taller spans or closer viewing distances can be mitigated by tilting the top and bottom rows. Another approach that is being investigated is to shift or bias the micropolarizer overlay so that the micropolarizer rows are centered with pixel rows relative to the off-axis line of sight rather than relative to the normal direction of the screen. To the best of our knowledge, this approach has not appeared in prior literature. Several configurations of Next Generation CAVEs using these ideas are illustrated in Figure 10 below.
Use Cases SRDWs are proliferating rapidly in universities, national laboratories as well as industry. For example in 2011 over 70 sites around the world had adopted the technology and are using SAGE to drive them [SAGE].
Antarctic Exploration ENDURANCE is a NASA funded project that sent a robotic submersible under ice-covered West Lake Bonney in the Taylor Valley of Antarctica to gather data about the three-dimensional biochemical structure of the interior of the lake, and to create high-resolution sonar maps of the bottom of the lake and the face of Taylor Glacier at the end of the lake. Biochemical data, camera data, and sonar data from the robot was collected in the fall of 2008 and fall of 2009. EVL’s high-resolution walls were used for several activities during this project.
Figure 10: Possible designs for the Next Generation CAVE.
Figure 11: The ENDURANCE teams used EVL’s high-resolution walls to juxtapose multiple datasets for data validation and analysis.

Mission Planning The science and engineering team members viewed full-resolution Quickbird satellite photos of the Taylor Valley and Lake Bonney on the wall in the months before the mission. The members of the team who had been to the lake before were better able to brief the new members of the expedition on what to expect and discuss possible locations to place the camp and melt holes on the surface of the lake. Data Validation The science and engineering team members used the EVL cyber-commons in April 2010 to look at all the data collected from both deployments. Validating the data required simultaneous viewing of tables of data, graphs of the data, and the geographic location and times of the data collection points, which was easy given the size and resolution of the cyber-commons wall. Linking these representations together allowed aberrations in the graphs to be easily located in time and space and decisions could be made on whether the data was valid. Research and Analysis The science team used the high resolution walls to easily integrate a full-resolution Quickbird satellite photo of Lake Bonney taken during the mission with full-resolution photographs taken by the robot from beneath the surface of the lake looking upwards through the ice to determine the amount of small debris present at different points in the lake, which affects the amount of light that is transmitted through the ice, which affects the biochemical properties. The wall allowed the science team to see both context and detail simultaneously and made it easier to see overall patterns. The processing of the sonar data for the bottom of the lake and the glacier face was complicated due to a concentrated salt layer in the lake. Various sets of parameters were used to generate a final sonar point cloud and to convert it into a polygonal mesh. The science team used the cyber-commons in April 2011 to simultaneously display visualizations of the results from the different sets of parameters to better compare and contrast them and pick the most appropriate set of values. In May 2011 the science team returned to analyze the data using the wall to simultaneously show multiple representations of the data to better discuss and understand the underlying phenomena in the lake. The wall helped externalize and share the mental models of the biochemical processes that individuals were using.
Classrooms of the Future As with most universities, the University of Illinois at Chicago has multimedia classrooms with a projector and computer. These standard multimedia rooms are not well equipped for courses in areas such as Visualization, Visual Analytics, Computer Graphics, Interaction, or Video Game Design. For these courses it is important to have multiple screens of notes, code, and examples available, and its impossible to do that with a single projection screen. These standard multimedia rooms also make it difficult to teach courses with remotely participating classrooms or speakers. They typically do not have enough bandwidth for high quality video conferencing, and not enough screens to simultaneously show the remote site and the shared topic of discussion. In order to address this need in 2004 EVL converted one of our large meeting rooms into a classroom space for 40 students, and it has been evolving since that time with increasing numbers of screens. In the summer of 2009 we installed a 6x3 tiled LCD wall of thin-border 46” digital signage displays with a total resolution of 18 megapixels driven by a single PC with 20 gigabits of networking capability. The room also contains ambient microphones for the class, dedicated mikes for speaker, and multiple high definition cameras for remote sessions. In the summer of 2010 we added a touch screen to the wall allowing interaction with content on the wall at the wall itself in addition to using a gyromouse, or a laptop. The wall acts like a traditional classroom that had multiple sliding blackboards or whiteboards for increased space to give context to the current discussion, but with the advantages of being able to bring up digital media on those screens. The single computer driving the display makes support simple. The small borders mean text is always readable.
In the last two years six faculty members have taught ten different courses in this room including courses in computer science, high-energy physics, and art & design, and three of those courses were taught with remote participants. The wall is typically divided into sections for classwork, and different courses divide
the wall in different ways. Local courses typically break the wall into three parts with 1/3 for the current notes in powerpoint or html format, 1/3 for a variety of related images, movies, or pdf documents to give context, and 1/3 for a Wacom tablet streamed to wall as a whiteboard. Students can add to the discussion by dragging and dropping images, pdf files, or movies onto the main screen and pointing at media on the wall via their laptops. Social constraints are effective in limiting the potential anarchy. During student project presentations the wall is typically broken into two parts with the students presenting from their laptop on half, while the other half hold images of the different project solutions the class has come up with allowing the rest of the class to compare and contrast them. Remote courses typically break the wall into two parts with half for the current notes shared between the sites and half for the remote site in high-resolution video. There is also considerable ad hoc use of the wall. Groups of students in the Visual Analytics and Video Game Programming courses use the wall to brainstorm different visual and interaction ideas by sketching with the streaming Wacom whiteboard on part of the wall, and streaming their laptop screens to windows on the wall to display previous solutions or related material from the web. Similarly groups of graduate students brainstormed ideas for their research projects using the streaming whiteboard for drawing while posting related pdf papers on the wall ���. We also saw groups of PhD students studying for the computer science qualifying exam by putting multiple exams and answers along with related web pages on the screens for discussion. Surveys of 30 students showed that 2/3rds liked it better than a single computer projector, and half thought it much better than one or more whiteboards or blackboards. 2/3rds thought visibility of information was much better than in traditional classrooms, and half thought it was much better in helping them follow their lectures.
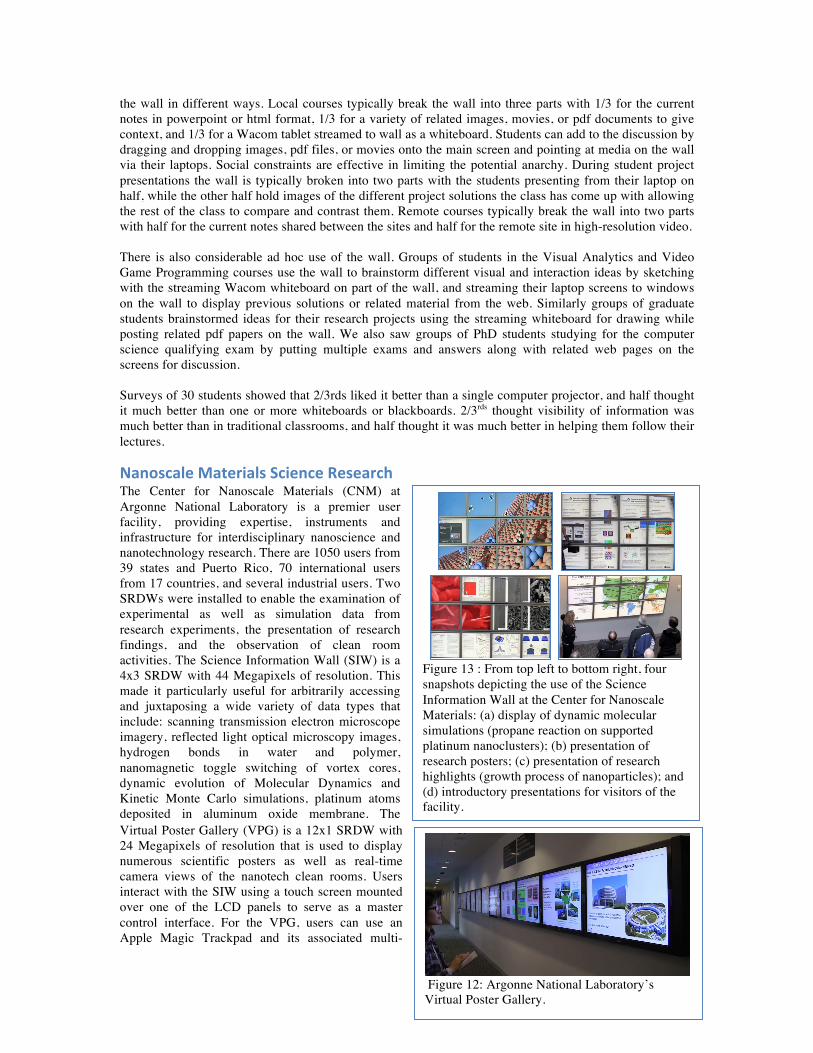
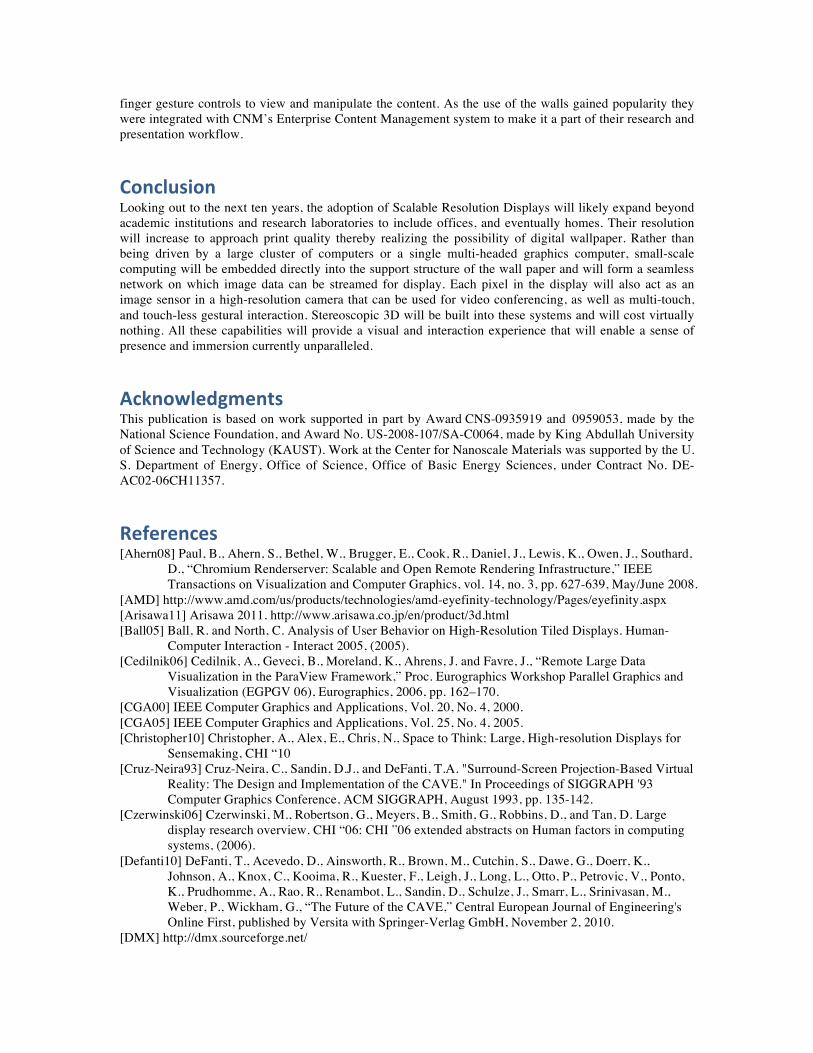
Nanoscale Materials Science Research The Center for Nanoscale Materials (CNM) at Argonne National Laboratory is a premier user facility, providing expertise, instruments and infrastructure for interdisciplinary nanoscience and nanotechnology research. There are 1050 users from 39 states and Puerto Rico, 70 international users from 17 countries, and several industrial users. Two SRDWs were installed to enable the examination of experimental as well as simulation data from research experiments, the presentation of research findings, and the observation of clean room activities. The Science Information Wall (SIW) is a 4x3 SRDW with 44 Megapixels of resolution. This made it particularly useful for arbitrarily accessing and juxtaposing a wide variety of data types that include: scanning transmission electron microscope imagery, reflected light optical microscopy images, hydrogen bonds in water and polymer, nanomagnetic toggle switching of vortex cores, dynamic evolution of Molecular Dynamics and Kinetic Monte Carlo simulations, platinum atoms deposited in aluminum oxide membrane. The Virtual Poster Gallery (VPG) is a 12x1 SRDW with 24 Megapixels of resolution that is used to display numerous scientific posters as well as real-time camera views of the nanotech clean rooms. Users interact with the SIW using a touch screen mounted over one of the LCD panels to serve as a master control interface. For the VPG, users can use an Apple Magic Trackpad and its associated multi-
Figure 13 : From top left to bottom right, four snapshots depicting the use of the Science Information Wall at the Center for Nanoscale Materials: (a) display of dynamic molecular simulations (propane reaction on supported platinum nanoclusters); (b) presentation of research posters; (c) presentation of research highlights (growth process of nanoparticles); and (d) introductory presentations for visitors of the facility.
Figure 12: Argonne National Laboratory’s Virtual Poster Gallery.
finger gesture controls to view and manipulate the content. As the use of the walls gained popularity they were integrated with CNM’s Enterprise Content Management system to make it a part of their research and presentation workflow.
Conclusion Looking out to the next ten years, the adoption of Scalable Resolution Displays will likely expand beyond academic institutions and research laboratories to include offices, and eventually homes. Their resolution will increase to approach print quality thereby realizing the possibility of digital wallpaper. Rather than being driven by a large cluster of computers or a single multi-headed graphics computer, small-scale computing will be embedded directly into the support structure of the wall paper and will form a seamless network on which image data can be streamed for display. Each pixel in the display will also act as an image sensor in a high-resolution camera that can be used for video conferencing, as well as multi-touch, and touch-less gestural interaction. Stereoscopic 3D will be built into these systems and will cost virtually nothing. All these capabilities will provide a visual and interaction experience that will enable a sense of presence and immersion currently unparalleled.
Acknowledgments This publication is based on work supported in part by Award CNS-0935919 and 0959053, made by the National Science Foundation, and Award No. US-2008-107/SA-C0064, made by King Abdullah University of Science and Technology (KAUST). Work at the Center for Nanoscale Materials was supported by the U. S. Department of Energy, Office of Science, Office of Basic Energy Sciences, under Contract No. DE-AC02-06CH11357.
References [Ahern08] Paul, B., Ahern, S., Bethel, W., Brugger, E., Cook, R., Daniel, J., Lewis, K., Owen, J., Southard,
D., “Chromium Renderserver: Scalable and Open Remote Rendering Infrastructure,” IEEE Transactions on Visualization and Computer Graphics, vol. 14, no. 3, pp. 627-639, May/June 2008.
[AMD] http://www.amd.com/us/products/technologies/amd-eyefinity-technology/Pages/eyefinity.aspx [Arisawa11] Arisawa 2011. http://www.arisawa.co.jp/en/product/3d.html [Ball05] Ball, R. and North, C. Analysis of User Behavior on High-Resolution Tiled Displays. Human-
Computer Interaction - Interact 2005, (2005). [Cedilnik06] Cedilnik, A., Geveci, B., Moreland, K., Ahrens, J. and Favre, J., “Remote Large Data
Visualization in the ParaView Framework,” Proc. Eurographics Workshop Parallel Graphics and Visualization (EGPGV 06), Eurographics, 2006, pp. 162–170.
[CGA00] IEEE Computer Graphics and Applications, Vol. 20, No. 4, 2000. [CGA05] IEEE Computer Graphics and Applications, Vol. 25, No. 4, 2005. [Christopher10] Christopher, A., Alex, E., Chris, N., Space to Think: Large, High-resolution Displays for
Sensemaking, CHI “10 [Cruz-Neira93] Cruz-Neira, C., Sandin, D.J., and DeFanti, T.A. "Surround-Screen Projection-Based Virtual
Reality: The Design and Implementation of the CAVE." In Proceedings of SIGGRAPH '93 Computer Graphics Conference, ACM SIGGRAPH, August 1993, pp. 135-142.
[Czerwinski06] Czerwinski, M., Robertson, G., Meyers, B., Smith, G., Robbins, D., and Tan, D. Large display research overview. CHI “06: CHI ”06 extended abstracts on Human factors in computing systems, (2006).
[Defanti10] DeFanti, T., Acevedo, D., Ainsworth, R., Brown, M., Cutchin, S., Dawe, G., Doerr, K., Johnson, A., Knox, C., Kooima, R., Kuester, F., Leigh, J., Long, L., Otto, P., Petrovic, V., Ponto, K., Prudhomme, A., Rao, R., Renambot, L., Sandin, D., Schulze, J., Smarr, L., Srinivasan, M., Weber, P., Wickham, G., “The Future of the CAVE,” Central European Journal of Engineering's Online First, published by Versita with Springer-Verlag GmbH, November 2, 2010.
[DMX] http://dmx.sourceforge.net/
[DMX] Xdmx: Distributed multi-head X project, http://dmx.sourceforge.net/ [Doerr11] Doerr, K. and Kuester, F., “CGLX: A Scalable, High-Performance Visualization Framework for
Networked Display Environments,” IEEE Trans. Visualization and Computer Graphics, Volume 17 Issue 3, May 2011.
[Eilemann09] Eilemann, S., Makhinya, M. and Pajarola, R., “Equalizer: A Scalable Parallel Rendering Framework,” IEEE Trans. Visualization and Computer Graphics, May 2009, pp. 436–452.
[Etsion'04] Etsion, Y., et al. “Desktop scheduling: how can we know what the user wants?” Proceedings of the 14th international workshop on Network and operating systems support for digital audio and video, Cork, Ireland, 110-115, 2004.
[Evans'93] Evans, S., et al. “Optimizing Unix resource scheduling for user interaction.” Proceedings of the USENIX Summer 1993 Technical Conference on Summer technical conference - Volume 1, Cincinnati, Ohio, 1993.
[Heider88] Heider, K., “The Rashomon Efffect: When Ethnographers Disagree,” American Anthropologist, March 1988, Vol. 90 No. 1, pp. 73‐81.
[Humphreys02] Humphreys, G., Houston, M., Ng, R., Frank, R., Ahern, S., Kirchner, P. and Klosowski., J., “Chromium: A Stream-Processing Framework for Interactive Rendering on Clusters,” Proc. SIGGRAPH, ACM Press, 2002, pp. 693–702.
[IBM05] IBM Systems and Technology Group, “IBM Deep Computing Visualization Technical White Paper,” http://www-03.ibm.com/servers/deepcomputing/visualization/downloads/dcv%techwp.pdf, 2005.
[Jagodic10] Jagodic, R., Renambot, L., Johnson, A., Leigh, J., and Deshpande, S. Enabling multi-user interaction in large high-resolution distributed environments. Future Generation Computer Systems, (2010), 1-10.
[Jeong06] Jeong, B, Renambot, L., Jagodic, R., Singh, R., Aguilera, J., Johnson, A. & Leigh, J., “High-Performance Dynamic Graphics Streaming for Scalable Adaptive Graphics Environment,” Proceedings of Supercomputing 2006 (SC06), November 2006.
[Jeong10] Jeong, B., Leigh, J., Johnson, A., Renambot, L., Brown, M., Jagodic, R., Nam, S., Hur, H., “Ultrascale Collaborative Visualization Using a Display-Rich Global Cyberinfrastructure,” IEEE Computer Graphics and Applications, Vol. 30, No. 3, pp. 71-83, May/June 2010.
[Kirsh95] Kirsh, D., The intelligent use of space, Artif. Intell., 73, (1-2), pp. 31-68, 1995 [Leigh02] Leigh, J., Johnson, A., Park, K., Nayak, A., Singh, R. and Chowdry, V., “Amplifed
Collaboration Environments”, VizGrid Symposium, Tokyo, November 2002 (www.vizgrid.org) [Leigh07] Leigh, J., Johnson, A., Renambot, L., Sandin, D., DeFanti, T., Brown, M., Jeong, B., Jagodic, R.,
Krumbholz, C., Svistula, D., Hur, H., Kooima, R., Peterka, T., Ge, J., Falk, C., “Emerging from the CAVE: Collaboration in Ultra High Resolution Environments,” Proceedings of the First International Symposium on Universal Communication, Kyoto, Japan, June 14-15, 2007, pp. 96-99.
[Leigh09] Leigh, J., Johnson, A., Renambot, L., “Advances in Computer Displays,” Advances in Computers, Vol. 77, Elsevier/Morgan Kaufman, pp. 58-79 (2009).
[Martin00] Martin, G. J., Smeyne, A. L., Moore, J. R., Lang, S. R., Dodgson, N. A., "Three-dimensional visualization without glasses: a large-screen autostereoscopic display", Proc. SPIE 4022, Cockpit Displays VII: Displays for Defense Applications, 26th-28th Apr 2000, Orlando, Florida.
[Molnar94] S. Molnar, M. Cox, D. Ellsworth, and H. Fuchs, “A Sorting Classification of Parallel Rendering,” IEEE Computer Graphics and Applications, vol. 14, no. 4, pp. 23-32, 1994.
[Nakayama86] Nakayama, K. and Silverman, G.H., (1986), “Serial and Parallel Processing of Visual Feature Conjunctions,” Nature 320, pp. 264-265.
[Peterka07] Peterka, T., Kooima, R.L., Girado, J. I., Ge, J., Sandin, D.J., Johnson, A., Leigh, J., Schulze, J., DeFanti, T. A., “Dynallax: Solid State Dynamic Parallax Barrier Autostereoscopic VR Display”, Proceedings of the IEEE Virtual Reality Conference 2007(VR'07), Charlotte, NC, 03/10/2007 - 03/14/2007.
[Renambot08] Luc Renambot, Byungil Jeong, Hyejung Hur, Andrew Johnson, Jason Leigh, “Enabling high resolution collaborative visualization in display rich virtual organizations,” Future Generation Computer Systems, Volume 25, Issue 2, February 2009, pp. 161-168.
[Richardson98] Richardson, T., Stafford-Fraser, Q., Wood, K. and Hopper, A., "Virtual Network Computing", IEEE Internet Computing, Vol.2 No.1, Jan/Feb 1998 pp33-38.

[SAGE] Scalable Adaptive Graphics Environment www.sagecommons.org. [Sandin05] Sandin, D., Margolis, T., Ge, J., Girado, J., Peterka, T., DeFanti, T. The Varrier
Autostereoscopic Virtual Reality Display, ACM Transactions on Graphics, Proceedings of ACM SIGGRAPH 2005, 07/30/2005 - 08/04/2005.
[Smarr08] Larry Smarr, Maxine Brown, Cees de Laat, “Special section: OptIPlanet – The OptIPuter global collaboratory,” Future Generation Computer Systems, Volume 25, Issue 2, February 2009, pp. 109-113.
[Sun10] Sun, Y., Leigh, J., Johnson, A. and Lee, S., “Articulate: A Semi-automated Model for Translating Natural Language Queries into Meaningful Visualizations.” In proceedings of 10th International Symposium on Smart Graphics, Banff, Canada, 2010, pp. 184-195.
[Teasley00] S. Teasley, L. Covi, M. Krishnan, and J. Olson, “How does radical collocation help a team succeed?” In proceedings of CSCW'00 (Philadelphia, Dec. 2-6), ACM Press, New York, 2000, pp. 339-346.
[Vishwanath08] Vishwanath, V., Leigh, J., Shimizu, T., Nam, S., Renambot, L., Takahashi, H., Takizawa, M., Kamatani, O., “The Rails Toolkit (RTK) - Enabling End-System Topology-Aware High End Computing,” IEEE Fourth International Conference on e-Science, eScience, 2008, pp. 309-316.
[Visit] VisIt- https://wci.llnl.gov/codes/visit/home.html [Ware'94] Ware, C. and Franck, G., “Viewing a Graph in a Virtual Reality Display is Three Times as Good
as a 2D Diagram,” Proceedings of IEEE Visual Languages, 1994, pp. 182-183. [Weissman11] Michael A. Weissman, Andrew J. Woods, “A simple method for measuring crosstalk in
stereoscopic displays,”in Proceedings of SPIE Stereoscopic Displays and Applications XXII, Vol. 7863, 786310 (2011).
[Zheng'10] Zheng, H. and Nieh, J. 2010. RSIO: automatic user interaction detection and scheduling. Proceedings of the ACM SIGMETRICS international conference on Measurement and modeling of computer systems, New York, New York, USA, 263-274.