SC School Board’s Association Cindy Van Buren, Ph.D. Division of School Effectiveness September 5,...
18
SC School Board’s Association Cindy Van Buren, Ph.D. Division of School Effectiveness September 5, 2014
-
Upload
elizabeth-simon -
Category
Documents
-
view
215 -
download
1
Transcript of SC School Board’s Association Cindy Van Buren, Ph.D. Division of School Effectiveness September 5,...

SC School Board’s Association
Cindy Van Buren, Ph.D.
Division of School EffectivenessSeptember 5, 2014

Division of School Effectiveness Office of Educator Services – Mary Hipp Office of Instructional Practices and
Evaluations – Briana Timmerman Office of School Leadership – Bruce
Moseley Office of School Transformation –
Jennifer Morrison Office of Virtual Education – Bradley
Mitchell

Expanded Educator Evaluation System Guidelines http://ed.sc.gov/agency/se/Educator-Evalu
ation/
Preamble explaining intent and philosophy of teacher professional growth
Organized by requirements of ESEA waiver (to prevent restrictions of NCLB)
Principal evaluation Current PADEPP Standards 1-9 (50%)
School-wide student growth measures (50%)

Teacher Evaluation Rubric-based Observations and
professional practice (50%) Student growth over school year
(30%) Classroom Value-add (tested grades
/subjects) Student Learning Objectives (non-tested
grades / subjects) District Choice (20%)

Student Learning Objectives (SLOs) Locally created standards-based student
growth target May be school or district-wide or
individual for each teacher Specific, Measureable, Aspirational but
Realistic, Time-specific Uses at least two time periods per
student (beginning/end of school year), more data points are better
Types of Value-Added
Classroom value-added The average growth of all tested students
for a given teacher
School-wide value-added – OPTIONAL The average growth of all the state-tested
students in a school.
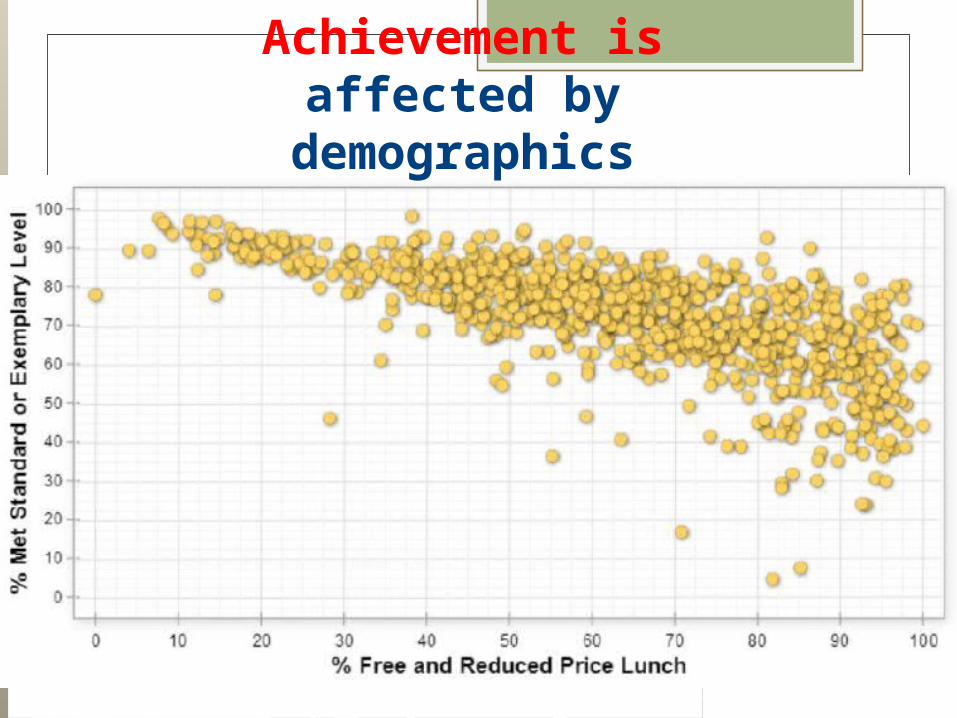
Achievement is affected by demographics

Value-Add Measures growth rather than achievement
0 = students grew the expected amount
Grew more than expected
Grew less than expected

What is Value-added?
2012 achievement 2013 achievement
References: Meyer & Dokumaci (2009); Wiley (2006)
Expected achievement
Actual achievement
Value-added by that teacher

Gain Average Expected Growth – Average
Actual Growth
So if the gain metric is zero, students met expected growth targets.

• 50% of his class scored as “proficient”
• On average, his class made the expected amount of growth.
2011 2012
Actual = Expected Value-added score = 3
How does this play outin the classroom?
Avera
ge s
core
of
class
Mr. Sterling has an average class.

• 95% of her students scored “proficient”
• BUT Only 5% made expected growth.
2011 2012
Expected
Actual
Value added score < 3
How does this play outin the classroom?
Avera
ge s
core
of
class
Ms. Draper has Honors students.

• Only 5% of her students scored as “proficient”
• But 95% made larger gains than expected.
Actual
Expected
Value-added
score >3
How does this play outin the classroom?
2011 2012
Ms. Olsen is in a struggling school.
Avera
ge s
core
of
class

Less than expected growth, Value-add score is 1or 2
Sco
res
Time
VA 5
VA 4
VA 2
VA 1
VA 3
Expected growth = 3
More th
an expect
ed gro
wth,
Value-a
dd score
is 4
or 5
Less than expected growth, Value-add score is 1or 2
Value-added is associated with positive long-term student outcomes:
• Improved college attendance—A series ofhigh-value-added teachers may double or even triple college attendance rates.
• Higher salaries in adulthood—Having onehigh-value-added teacher is associated with an additional $50K in lifetime earnings per student ($1.5 million for class of 30 students).
Reference: Chetty, Friedman, & Rockoff (2011)

ReferencesBoyd, D., Grossman, P., Lankford, H., Loeb, S., & Wyckoff, J. (2008). Teacher preparation and student
achievement (NBER Working Paper Series 14314). Cambridge, MA: National Bureau of Economic Research.
Chetty, R., Friedman, J. N., & Rockoff, J. E. (2011). The long-term impacts of teachers: Teacher value-added and student outcomes in adulthood (NBER Working Paper Series 17699). Cambridge, MA: National Bureau of Economic Research.
Clotfelter, C. T., Ladd, H. F., & Vigdor, J. L. (2007). Teacher credentials and student achievement in high school: A cross-subject analysis with student fixed effects (NBER Working Paper Series 13617). Cambridge, MA: National Bureau of Economic Research.
Goldhaber, D. D., & Brewer, D. J. (1996). Why don’t schools and teachers seem to matter? Assessing the impact of unobservables on educational productivity. Journal of Human Resources, 32 (3), 505–520.
Gordon, R., Kane, T., & Staiger, D. O. (2006). Identifying effective teachers using performance on the job (Hamilton Project Discussion Paper). Washington, DC: The Brookings Institution.
Harris, D. N., & Sass, T. R. (2009). The effects of NBPTS certified teachers on student achievement. Washington, DC: National Center for Analysis of Longitudinal Data in Education Research.
Hershberg, T., Simon, V. A., & Kruger, B. L. (2004). The revelations of value-added. The School Administrator, 61, 10–14.
Koretz, D. (2008). A measured approach. American Educator, Fall, 18–39.
Meyer, R. & Dokumaci, E. (2009). Value-added models and the next generation of assessments. Austin, TX: Center for K-12 Assessment & Performance Management.
National Association of State Boards of Education (NASBE, 2005). Evaluating value-added: Findings and recommendations from the NASBE Study Group on value-added assessments. Alexandria, VA: Author.
Wiley, E. W. (2006). A practitioner’s guide to value-added assessment. Tempe, AZ: Arizona State University.

Questions/Discussion