
SBC Fairview Corners DEIR
58
APPENDIX F A IR Q UALITY A NALYSIS
Transcript of SBC Fairview Corners DEIR
APPENDIX F
AIR QUALITY ANALYSIS

Fairview/Gavilan College Air Quality Study
May 16, 2008 Revised August 19, 2008
Prepared for:
Julie Mier David J. Powers Associates
1885 The Alameda, Suite 204 San Jose, CA 95126
Prepared by:
James Reyff
505 Petaluma Boulevard South Petaluma, CA 94952
(707) 766-7700
Job No.: 07-199
Introduction
The air quality impacts of the proposed Gavilan Campus/Fairview Corners Master Plan development in San Benito County, California are described in this report. The project site is located at the northeast corner of Fairview Road and Airline Highway, covering roughly 137 acres of vacant land. The project as proposed consists of a 3,500-student community college campus, 70 on-campus housing units, 35,000 square feet (s.f.) of retail space, and 220 single-family homes.
The college campus and single-family homes will be constructed separately. The college campus would be constructed in two phases. The first phase would include limited site grading, placement of five modular buildings, a 415-car parking lot, and access roads. Full campus build out would occur over a 25-year period. The residential portion of the project would be built out in five phases over 10 years. Each phase would require grading and construction of infrastructure.
This report describes existing air quality, temporary construction-related impacts, potential direct and indirect long-term emissions associated with the project build out scenario, and the impacts of these emissions on both the local and regional scale. Mitigation measures warranted to reduce or eliminate any identified significant impacts are described.
This analysis was conducted following guidance provided by the Monterey Bay Air Pollution Control District (MBAPCD) CEQA Guidelines. Emissions, which are the quantity of pollutant that the project would emit both directly and indirectly, are measured in pounds per day. The amount of pollutant material measured per volumetric unit of air is referred to as the concentration and is typically measured in parts per million (ppm) or micrograms per cubic meter (μg/m3). Stationary sources associated with the project, which could result in adverse air quality impacts that would contribute to air quality emissions, have not been identified.
Overall Regulatory Setting
The Federal Clean Air Act governs air quality in the United States. In addition to being subject to federal requirements, air quality in California is also governed by more stringent regulations under the California Clean Air Act. At the federal level, the United States Environmental Protection Agency (USEPA) administers the Clean Air Act (CAA). The California Clean Air Act is administered by the California Air Resources Board (CARB) at the State level and by the Air Quality Management Districts at the regional and local levels. The Monterey Bay Air Pollution Control District (MBAPCD) regulates air quality at the regional level.
United States Environmental Protection Agency
USEPA is responsible for enforcing the Federal CAA. USEPA is also responsible for establishing the National Ambient Air Quality Standards (NAAQS). NAAQS are required under the 1977 CAA and subsequent amendments. USEPA regulates emission sources that are under the exclusive authority of the federal government, such as aircraft, ships, and certain types of locomotives. The agency has jurisdiction over emission sources outside state waters (e.g., beyond the outer continental shelf) and establishes various emission standards, including those
for vehicles sold in states other than California. Automobiles sold in California must meet the stricter emission standards established by CARB.
California Air Resources Board
In California, CARB, which became part of the California Environmental Protection Agency (CalEPA) in 1991, is responsible for meeting the state requirements of the Federal CAA, administering the California CAA, and establishing the California Ambient Air Quality Standards (CAAQS). The California CAA, as amended in 1992, requires all air districts in the State to endeavor to achieve and maintain the California Ambient Air Quality Standards (CAAQS). The CARB regulates mobile air pollution sources, such as motor vehicles. The agency is responsible for setting emission standards for vehicles sold in California and for other emission sources, such as consumer products and certain off-road equipment. CARB has established passenger vehicle fuel specifications. CARB oversees the functions of local air pollution control districts and air quality management districts, which in turn administer air quality activities at the regional and county level.
Monterey Bay Unified Air Pollution Control District
The Monterey Bay Unified Air Pollution Control District (MBAPCD) is primarily responsible for assuring that the National and State ambient air quality standards are attained and maintained in the Monterey Bay Area. MBAPCD is also responsible for adopting and enforcing rules and regulations concerning air pollutant sources, issuing permits for stationary sources of air pollutants, inspecting stationary sources of air pollutants, responding to citizen complaints, monitoring ambient air quality and meteorological conditions, awarding grants to reduce motor vehicle emissions, conducting public education campaigns, as well as many other activities.
National and State Ambient Air Quality Standards
As required by the Federal Clean Air Act, NAAQS have been established for six major air pollutants: carbon monoxide (CO), nitrogen oxides (NOx), ozone (O3), respirable particulate matter (PM10), fine particulate matter (PM2.5), sulfur oxides, and lead. Pursuant to the California Clean Air Act, the State of California has also established ambient air quality standards. These standards are generally more stringent than the corresponding federal standards and incorporate additional standards for sulfates, hydrogen sulfide, vinyl chloride and visibility reducing particles.
Both State and Federal standards are summarized in Table 1. The “primary” standards have been established to protect the public health. The “secondary” standards are intended to protect the nation’s welfare and account for air pollutant effects on soil, water, visibility, materials, vegetation and other aspects of the general welfare. CAAQS are more stringent than the NAAQS. Thus, CAAQS are used as the comparative standard in this analysis.
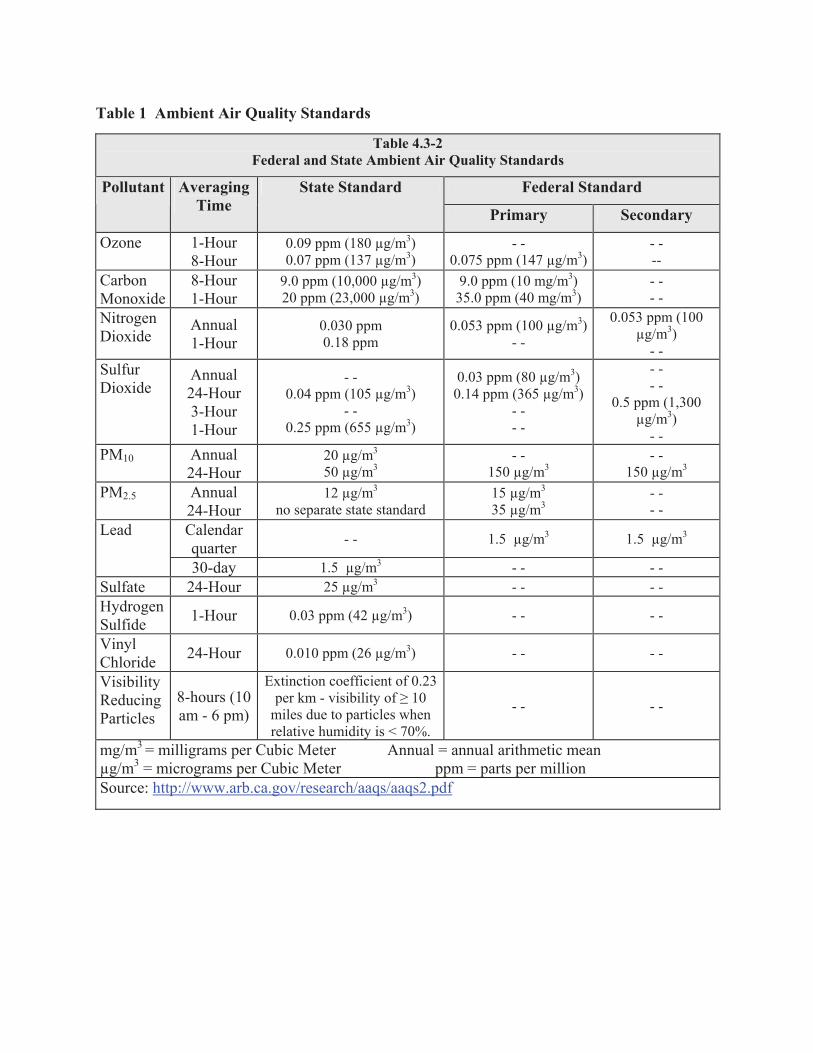
Table 1 Ambient Air Quality Standards
Table 4.3-2 Federal and State Ambient Air Quality Standards
Federal Standard Pollutant AveragingTime
State Standard
Primary Secondary
Ozone 1-Hour8-Hour
0.09 ppm (180 μg/m3)0.07 ppm (137 μg/m3)
- - 0.075 ppm (147 μg/m3)
- - --
CarbonMonoxide
8-Hour1-Hour
9.0 ppm (10,000 μg/m3)20 ppm (23,000 μg/m3)
9.0 ppm (10 mg/m3)35.0 ppm (40 mg/m3)
- - - -
NitrogenDioxide
Annual1-Hour
0.030 ppm 0.18 ppm
0.053 ppm (100 μg/m3)- -
0.053 ppm (100 μg/m3)
- - SulfurDioxide
Annual24-Hour3-Hour1-Hour
- - 0.04 ppm (105 μg/m3)
- - 0.25 ppm (655 μg/m3)
0.03 ppm (80 μg/m3)0.14 ppm (365 μg/m3)
- - - -
- - - -
0.5 ppm (1,300 μg/m3)
- - PM10 Annual
24-Hour20 μg/m3
50 μg/m3- -
150 μg/m3- -
150 μg/m3
PM2.5 Annual24-Hour
12 μg/m3
no separate state standard 15 μg/m3
35 μg/m3- - - -
Calendarquarter - - 1.5 μg/m3 1.5 μg/m3Lead
1.5 μg/m3 - - - - 30-daySulfate 24-Hour 25 μg/m3 - - - - HydrogenSulfide 1-Hour 0.03 ppm (42 μg/m3) - - - -
VinylChloride 24-Hour 0.010 ppm (26 μg/m3) - - - -
VisibilityReducingParticles
8-hours (10 am - 6 pm)
Extinction coefficient of 0.23 per km - visibility of 10
miles due to particles when relative humidity is < 70%.
- - - -
mg/m3 = milligrams per Cubic Meter Annual = annual arithmetic mean μg/m3 = micrograms per Cubic Meter ppm = parts per million Source: http://www.arb.ca.gov/research/aaqs/aaqs2.pdf
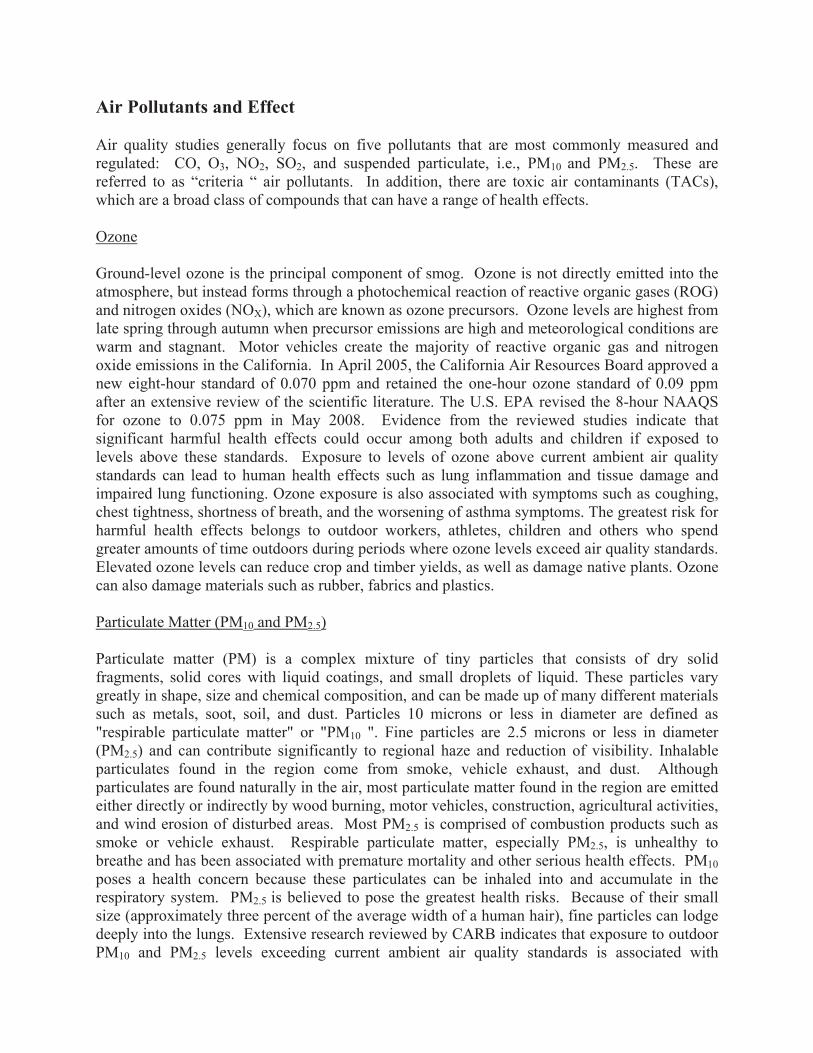
Air Pollutants and Effect
Air quality studies generally focus on five pollutants that are most commonly measured and regulated: CO, O3, NO2, SO2, and suspended particulate, i.e., PM10 and PM2.5. These are referred to as “criteria “ air pollutants. In addition, there are toxic air contaminants (TACs), which are a broad class of compounds that can have a range of health effects.
Ozone
Ground-level ozone is the principal component of smog. Ozone is not directly emitted into the atmosphere, but instead forms through a photochemical reaction of reactive organic gases (ROG) and nitrogen oxides (NOX), which are known as ozone precursors. Ozone levels are highest from late spring through autumn when precursor emissions are high and meteorological conditions are warm and stagnant. Motor vehicles create the majority of reactive organic gas and nitrogen oxide emissions in the California. In April 2005, the California Air Resources Board approved a new eight-hour standard of 0.070 ppm and retained the one-hour ozone standard of 0.09 ppm after an extensive review of the scientific literature. The U.S. EPA revised the 8-hour NAAQS for ozone to 0.075 ppm in May 2008. Evidence from the reviewed studies indicate that significant harmful health effects could occur among both adults and children if exposed to levels above these standards. Exposure to levels of ozone above current ambient air quality standards can lead to human health effects such as lung inflammation and tissue damage and impaired lung functioning. Ozone exposure is also associated with symptoms such as coughing, chest tightness, shortness of breath, and the worsening of asthma symptoms. The greatest risk for harmful health effects belongs to outdoor workers, athletes, children and others who spend greater amounts of time outdoors during periods where ozone levels exceed air quality standards. Elevated ozone levels can reduce crop and timber yields, as well as damage native plants. Ozone can also damage materials such as rubber, fabrics and plastics.
Particulate Matter (PM10 and PM2.5)
Particulate matter (PM) is a complex mixture of tiny particles that consists of dry solid fragments, solid cores with liquid coatings, and small droplets of liquid. These particles vary greatly in shape, size and chemical composition, and can be made up of many different materials such as metals, soot, soil, and dust. Particles 10 microns or less in diameter are defined as "respirable particulate matter" or "PM10 ". Fine particles are 2.5 microns or less in diameter (PM2.5) and can contribute significantly to regional haze and reduction of visibility. Inhalable particulates found in the region come from smoke, vehicle exhaust, and dust. Although particulates are found naturally in the air, most particulate matter found in the region are emitted either directly or indirectly by wood burning, motor vehicles, construction, agricultural activities,and wind erosion of disturbed areas. Most PM2.5 is comprised of combustion products such as smoke or vehicle exhaust. Respirable particulate matter, especially PM2.5, is unhealthy to breathe and has been associated with premature mortality and other serious health effects. PM10poses a health concern because these particulates can be inhaled into and accumulate in the respiratory system. PM2.5 is believed to pose the greatest health risks. Because of their small size (approximately three percent of the average width of a human hair), fine particles can lodge deeply into the lungs. Extensive research reviewed by CARB indicates that exposure to outdoor PM10 and PM2.5 levels exceeding current ambient air quality standards is associated with
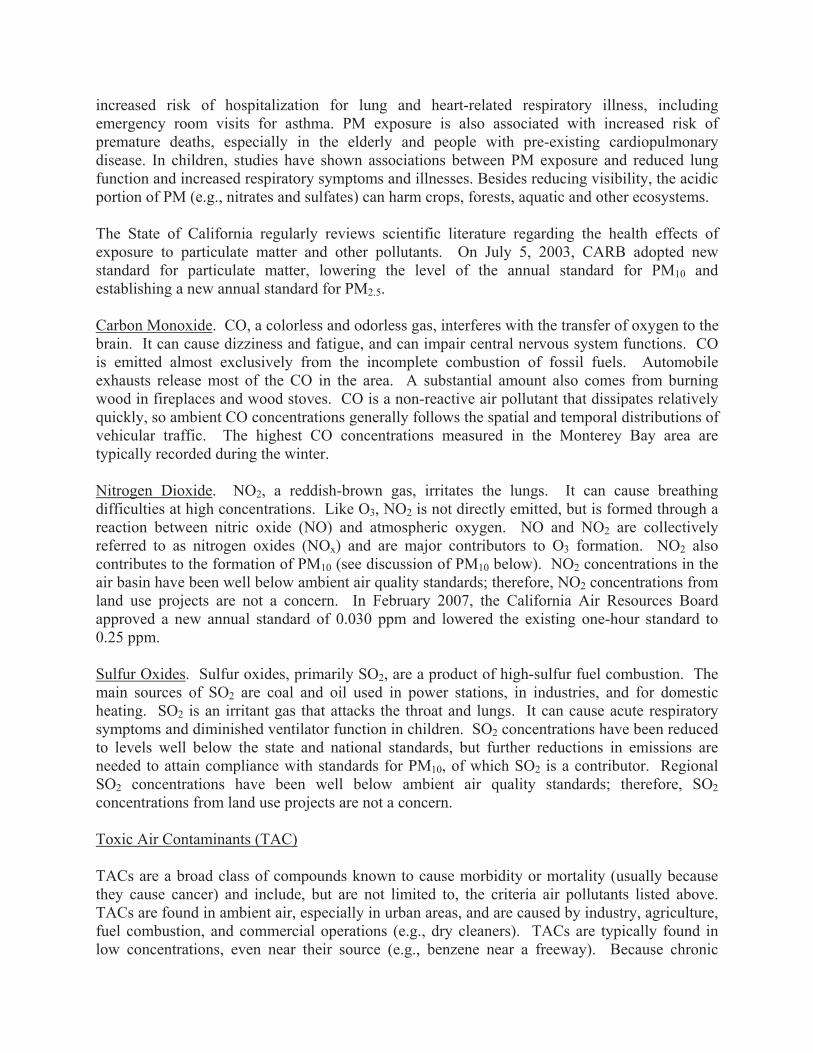
increased risk of hospitalization for lung and heart-related respiratory illness, including emergency room visits for asthma. PM exposure is also associated with increased risk of premature deaths, especially in the elderly and people with pre-existing cardiopulmonary disease. In children, studies have shown associations between PM exposure and reduced lung function and increased respiratory symptoms and illnesses. Besides reducing visibility, the acidic portion of PM (e.g., nitrates and sulfates) can harm crops, forests, aquatic and other ecosystems.
The State of California regularly reviews scientific literature regarding the health effects of exposure to particulate matter and other pollutants. On July 5, 2003, CARB adopted new standard for particulate matter, lowering the level of the annual standard for PM10 and establishing a new annual standard for PM2.5.
Carbon Monoxide. CO, a colorless and odorless gas, interferes with the transfer of oxygen to the brain. It can cause dizziness and fatigue, and can impair central nervous system functions. CO is emitted almost exclusively from the incomplete combustion of fossil fuels. Automobile exhausts release most of the CO in the area. A substantial amount also comes from burning wood in fireplaces and wood stoves. CO is a non-reactive air pollutant that dissipates relatively quickly, so ambient CO concentrations generally follows the spatial and temporal distributions of vehicular traffic. The highest CO concentrations measured in the Monterey Bay area are typically recorded during the winter.
Nitrogen Dioxide. NO2, a reddish-brown gas, irritates the lungs. It can cause breathing difficulties at high concentrations. Like O3, NO2 is not directly emitted, but is formed through a reaction between nitric oxide (NO) and atmospheric oxygen. NO and NO2 are collectively referred to as nitrogen oxides (NOx) and are major contributors to O3 formation. NO2 also contributes to the formation of PM10 (see discussion of PM10 below). NO2 concentrations in the air basin have been well below ambient air quality standards; therefore, NO2 concentrations from land use projects are not a concern. In February 2007, the California Air Resources Board approved a new annual standard of 0.030 ppm and lowered the existing one-hour standard to 0.25 ppm.
Sulfur Oxides. Sulfur oxides, primarily SO2, are a product of high-sulfur fuel combustion. The main sources of SO2 are coal and oil used in power stations, in industries, and for domestic heating. SO2 is an irritant gas that attacks the throat and lungs. It can cause acute respiratory symptoms and diminished ventilator function in children. SO2 concentrations have been reduced to levels well below the state and national standards, but further reductions in emissions are needed to attain compliance with standards for PM10, of which SO2 is a contributor. Regional SO2 concentrations have been well below ambient air quality standards; therefore, SO2concentrations from land use projects are not a concern.
Toxic Air Contaminants (TAC)
TACs are a broad class of compounds known to cause morbidity or mortality (usually because they cause cancer) and include, but are not limited to, the criteria air pollutants listed above. TACs are found in ambient air, especially in urban areas, and are caused by industry, agriculture, fuel combustion, and commercial operations (e.g., dry cleaners). TACs are typically found in low concentrations, even near their source (e.g., benzene near a freeway). Because chronic
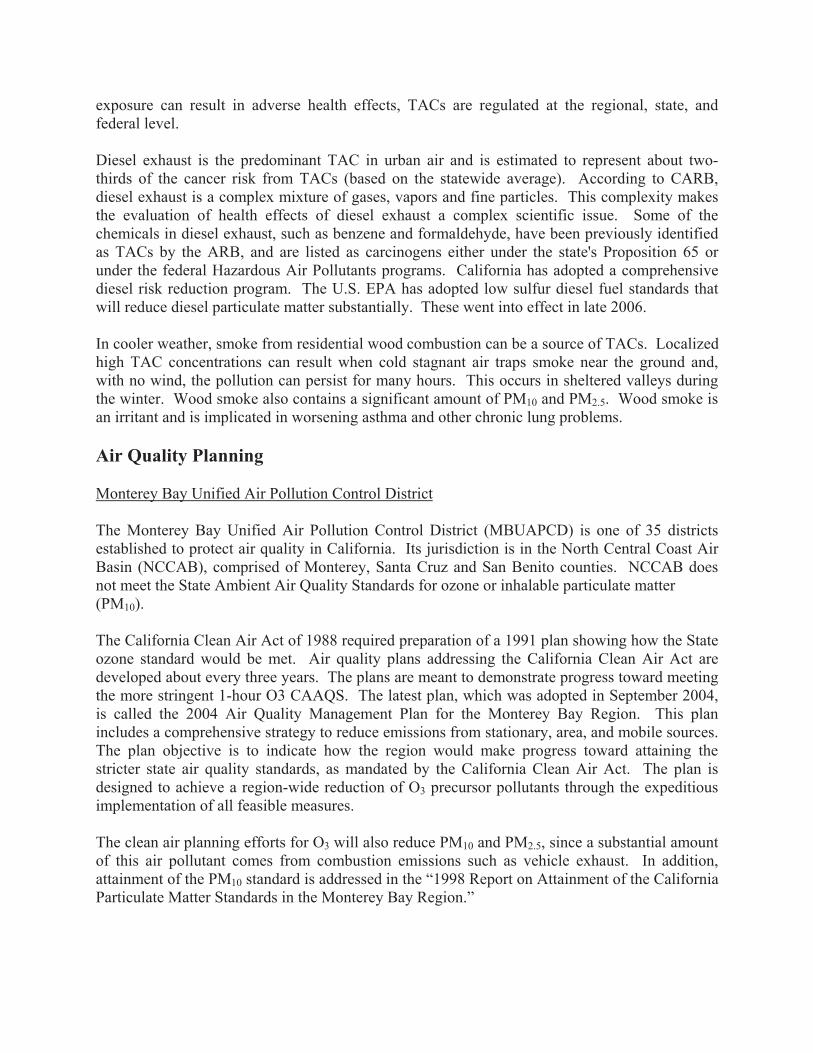
exposure can result in adverse health effects, TACs are regulated at the regional, state, and federal level.
Diesel exhaust is the predominant TAC in urban air and is estimated to represent about two-thirds of the cancer risk from TACs (based on the statewide average). According to CARB, diesel exhaust is a complex mixture of gases, vapors and fine particles. This complexity makes the evaluation of health effects of diesel exhaust a complex scientific issue. Some of the chemicals in diesel exhaust, such as benzene and formaldehyde, have been previously identified as TACs by the ARB, and are listed as carcinogens either under the state's Proposition 65 or under the federal Hazardous Air Pollutants programs. California has adopted a comprehensive diesel risk reduction program. The U.S. EPA has adopted low sulfur diesel fuel standards that will reduce diesel particulate matter substantially. These went into effect in late 2006.
In cooler weather, smoke from residential wood combustion can be a source of TACs. Localized high TAC concentrations can result when cold stagnant air traps smoke near the ground and, with no wind, the pollution can persist for many hours. This occurs in sheltered valleys during the winter. Wood smoke also contains a significant amount of PM10 and PM2.5. Wood smoke is an irritant and is implicated in worsening asthma and other chronic lung problems.
Air Quality Planning
Monterey Bay Unified Air Pollution Control District
The Monterey Bay Unified Air Pollution Control District (MBUAPCD) is one of 35 districts established to protect air quality in California. Its jurisdiction is in the North Central Coast Air Basin (NCCAB), comprised of Monterey, Santa Cruz and San Benito counties. NCCAB does not meet the State Ambient Air Quality Standards for ozone or inhalable particulate matter (PM10).
The California Clean Air Act of 1988 required preparation of a 1991 plan showing how the State ozone standard would be met. Air quality plans addressing the California Clean Air Act are developed about every three years. The plans are meant to demonstrate progress toward meeting the more stringent 1-hour O3 CAAQS. The latest plan, which was adopted in September 2004, is called the 2004 Air Quality Management Plan for the Monterey Bay Region. This plan includes a comprehensive strategy to reduce emissions from stationary, area, and mobile sources. The plan objective is to indicate how the region would make progress toward attaining the stricter state air quality standards, as mandated by the California Clean Air Act. The plan is designed to achieve a region-wide reduction of O3 precursor pollutants through the expeditious implementation of all feasible measures.
The clean air planning efforts for O3 will also reduce PM10 and PM2.5, since a substantial amount of this air pollutant comes from combustion emissions such as vehicle exhaust. In addition, attainment of the PM10 standard is addressed in the “1998 Report on Attainment of the California Particulate Matter Standards in the Monterey Bay Region.”
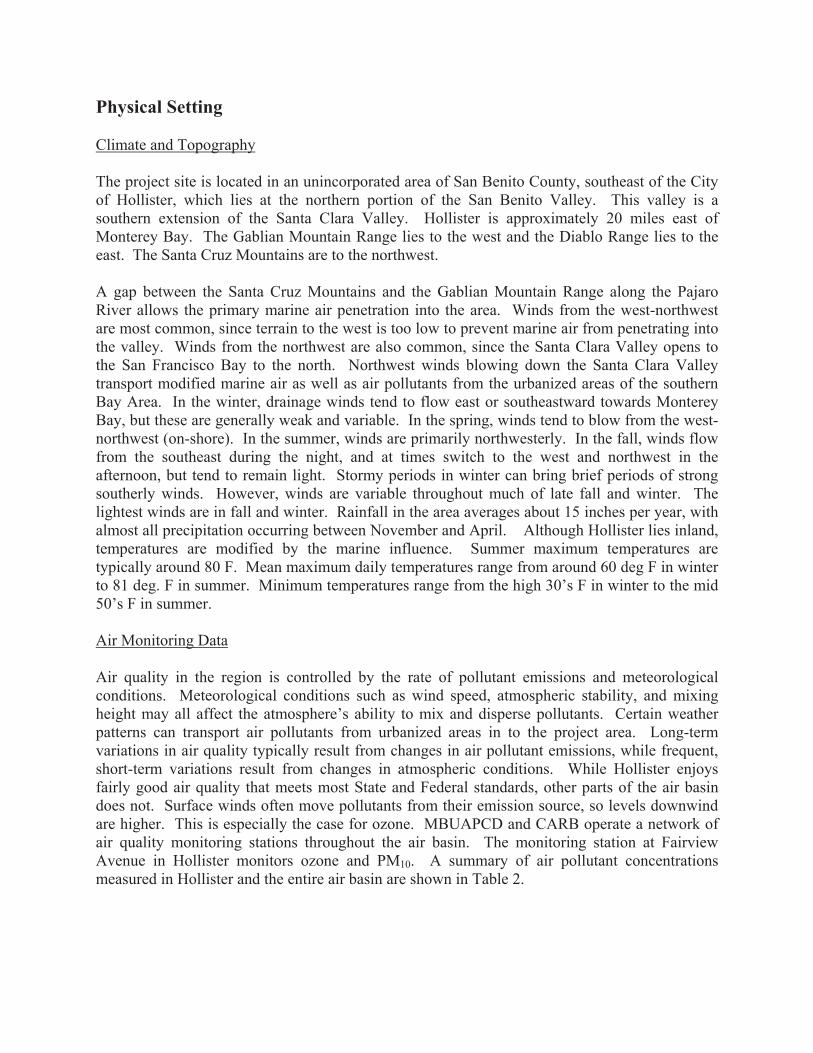
Physical Setting
Climate and Topography
The project site is located in an unincorporated area of San Benito County, southeast of the City of Hollister, which lies at the northern portion of the San Benito Valley. This valley is a southern extension of the Santa Clara Valley. Hollister is approximately 20 miles east of Monterey Bay. The Gablian Mountain Range lies to the west and the Diablo Range lies to the east. The Santa Cruz Mountains are to the northwest.
A gap between the Santa Cruz Mountains and the Gablian Mountain Range along the Pajaro River allows the primary marine air penetration into the area. Winds from the west-northwest are most common, since terrain to the west is too low to prevent marine air from penetrating into the valley. Winds from the northwest are also common, since the Santa Clara Valley opens to the San Francisco Bay to the north. Northwest winds blowing down the Santa Clara Valley transport modified marine air as well as air pollutants from the urbanized areas of the southern Bay Area. In the winter, drainage winds tend to flow east or southeastward towards Monterey Bay, but these are generally weak and variable. In the spring, winds tend to blow from the west-northwest (on-shore). In the summer, winds are primarily northwesterly. In the fall, winds flow from the southeast during the night, and at times switch to the west and northwest in the afternoon, but tend to remain light. Stormy periods in winter can bring brief periods of strong southerly winds. However, winds are variable throughout much of late fall and winter. The lightest winds are in fall and winter. Rainfall in the area averages about 15 inches per year, with almost all precipitation occurring between November and April. Although Hollister lies inland, temperatures are modified by the marine influence. Summer maximum temperatures are typically around 80 F. Mean maximum daily temperatures range from around 60 deg F in winter to 81 deg. F in summer. Minimum temperatures range from the high 30’s F in winter to the mid 50’s F in summer.
Air Monitoring Data
Air quality in the region is controlled by the rate of pollutant emissions and meteorological conditions. Meteorological conditions such as wind speed, atmospheric stability, and mixing height may all affect the atmosphere’s ability to mix and disperse pollutants. Certain weather patterns can transport air pollutants from urbanized areas in to the project area. Long-term variations in air quality typically result from changes in air pollutant emissions, while frequent, short-term variations result from changes in atmospheric conditions. While Hollister enjoys fairly good air quality that meets most State and Federal standards, other parts of the air basin does not. Surface winds often move pollutants from their emission source, so levels downwind are higher. This is especially the case for ozone. MBUAPCD and CARB operate a network of air quality monitoring stations throughout the air basin. The monitoring station at Fairview Avenue in Hollister monitors ozone and PM10. A summary of air pollutant concentrations measured in Hollister and the entire air basin are shown in Table 2.
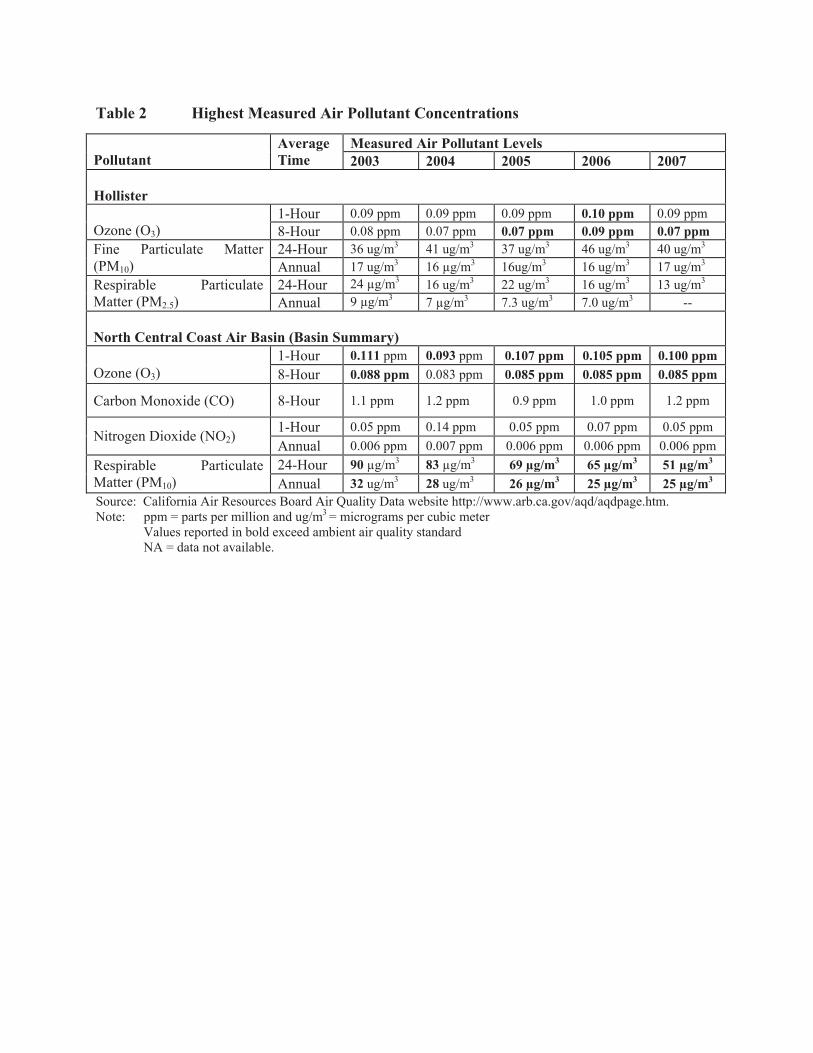
Table 2 Highest Measured Air Pollutant Concentrations
Measured Air Pollutant Levels AverageTimePollutant 2003 2004 2005 2006 2007
Hollister1-Hour 0.09 ppm 0.09 ppm 0.09 ppm 0.10 ppm 0.09 ppm
Ozone (O3) 8-Hour 0.08 ppm 0.07 ppm 0.07 ppm 0.09 ppm 0.07 ppm 24-Hour 36 ug/m3 41 ug/m3 37 ug/m3 46 ug/m3 40 ug/m3Fine Particulate Matter
(PM10) Annual 17 ug/m3 16 μg/m3 16ug/m3 16 ug/m3 17 ug/m3
24-Hour 24 μg/m3 16 ug/m3 22 ug/m3 16 ug/m3 13 ug/m3Respirable Particulate Matter (PM2.5) Annual 9 μg/m3 7 μg/m3 7.3 ug/m3 7.0 ug/m3 --
North Central Coast Air Basin (Basin Summary) 1-Hour 0.111 ppm 0.093 ppm 0.107 ppm 0.105 ppm 0.100 ppm
Ozone (O3) 8-Hour 0.088 ppm 0.085 ppm 0.083 ppm 0.085 ppm 0.085 ppm
Carbon Monoxide (CO) 8-Hour 1.1 ppm 1.2 ppm 0.9 ppm 1.0 ppm 1.2 ppm
1-Hour 0.05 ppm 0.14 ppm 0.05 ppm 0.07 ppm 0.05 ppm Nitrogen Dioxide (NO2) Annual 0.006 ppm 0.007 ppm 0.006 ppm 0.006 ppm 0.006 ppm 24-Hour 90 μg/m3 83 μg/m3 69 μg/m3 65 μg/m3 51 μg/m3Respirable Particulate
Matter (PM10) Annual 32 ug/m3 26 μg/m328 ug/m3 25 μg/m3 25 μg/m3
Source: California Air Resources Board Air Quality Data website http://www.arb.ca.gov/aqd/aqdpage.htm. Note: ppm = parts per million and ug/m3 = micrograms per cubic meter Values reported in bold exceed ambient air quality standard NA = data not available.
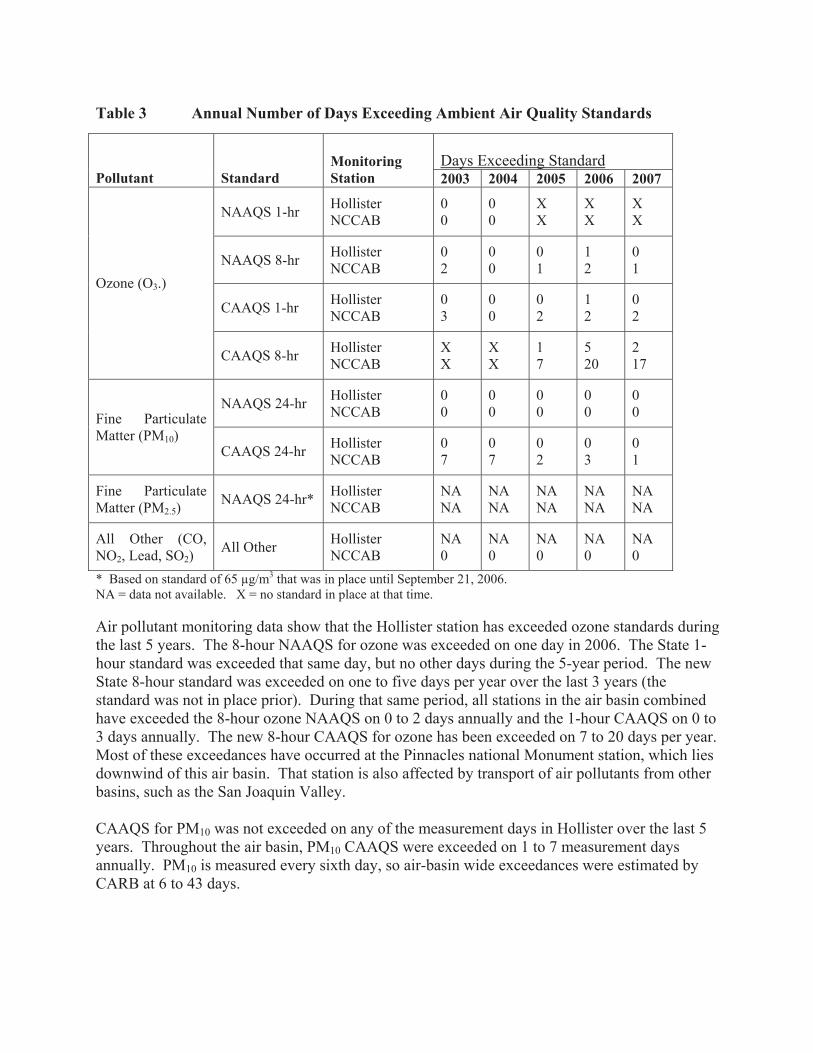
Table 3 Annual Number of Days Exceeding Ambient Air Quality Standards
Days Exceeding Standard
Pollutant StandardMonitoringStation 2003 2004 2005 2006 2007
NAAQS 1-hr HollisterNCCAB
00
00
XX
XX
XX
NAAQS 8-hr Hollister 0NCCAB 2
00
01
12
01
CAAQS 1-hr Hollister 0NCCAB 3
00
02
12
02
Ozone (O3.)
CAAQS 8-hr Hollister XNCCAB X
XX
17
520
217
NAAQS 24-hr HollisterNCCAB
00
00
00
00
00Fine Particulate
Matter (PM10)CAAQS 24-hr Hollister 0
NCCAB 707
02
03
01
Fine Particulate Matter (PM2.5)
NAAQS 24-hr* HollisterNCCAB
NANA
NANA
NANA
NANA
NANA
All Other (CO, NO2, Lead, SO2)
All Other HollisterNCCAB
NA0
NA0
NA0
NA0
NA0
* Based on standard of 65 μg/m3 that was in place until September 21, 2006. NA = data not available. X = no standard in place at that time.
Air pollutant monitoring data show that the Hollister station has exceeded ozone standards during the last 5 years. The 8-hour NAAQS for ozone was exceeded on one day in 2006. The State 1-hour standard was exceeded that same day, but no other days during the 5-year period. The new State 8-hour standard was exceeded on one to five days per year over the last 3 years (the standard was not in place prior). During that same period, all stations in the air basin combined have exceeded the 8-hour ozone NAAQS on 0 to 2 days annually and the 1-hour CAAQS on 0 to 3 days annually. The new 8-hour CAAQS for ozone has been exceeded on 7 to 20 days per year. Most of these exceedances have occurred at the Pinnacles national Monument station, which lies downwind of this air basin. That station is also affected by transport of air pollutants from other basins, such as the San Joaquin Valley.
CAAQS for PM10 was not exceeded on any of the measurement days in Hollister over the last 5 years. Throughout the air basin, PM10 CAAQS were exceeded on 1 to 7 measurement days annually. PM10 is measured every sixth day, so air-basin wide exceedances were estimated by CARB at 6 to 43 days.
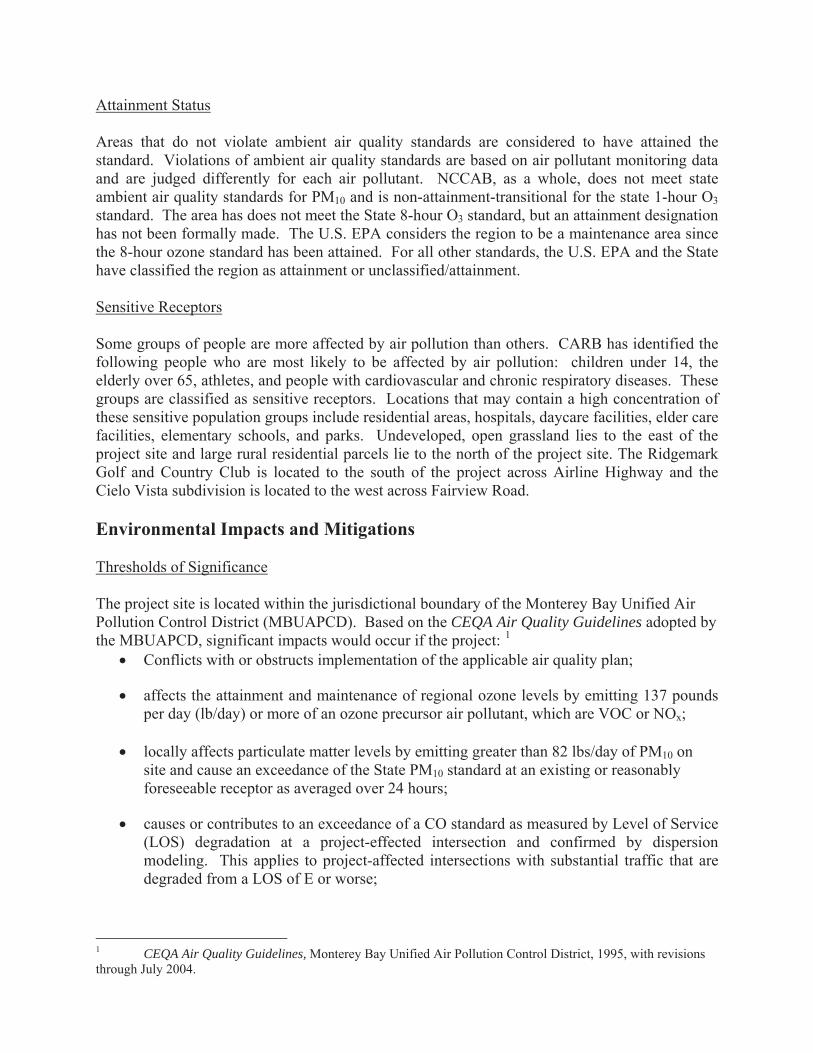
Attainment Status
Areas that do not violate ambient air quality standards are considered to have attained the standard. Violations of ambient air quality standards are based on air pollutant monitoring data and are judged differently for each air pollutant. NCCAB, as a whole, does not meet state ambient air quality standards for PM10 and is non-attainment-transitional for the state 1-hour O3standard. The area has does not meet the State 8-hour O3 standard, but an attainment designation has not been formally made. The U.S. EPA considers the region to be a maintenance area since the 8-hour ozone standard has been attained. For all other standards, the U.S. EPA and the State have classified the region as attainment or unclassified/attainment.
Sensitive Receptors
Some groups of people are more affected by air pollution than others. CARB has identified the following people who are most likely to be affected by air pollution: children under 14, the elderly over 65, athletes, and people with cardiovascular and chronic respiratory diseases. These groups are classified as sensitive receptors. Locations that may contain a high concentration of these sensitive population groups include residential areas, hospitals, daycare facilities, elder care facilities, elementary schools, and parks. Undeveloped, open grassland lies to the east of the project site and large rural residential parcels lie to the north of the project site. The Ridgemark Golf and Country Club is located to the south of the project across Airline Highway and the Cielo Vista subdivision is located to the west across Fairview Road.
Environmental Impacts and Mitigations
Thresholds of Significance
The project site is located within the jurisdictional boundary of the Monterey Bay Unified Air Pollution Control District (MBUAPCD). Based on the CEQA Air Quality Guidelines adopted by the MBUAPCD, significant impacts would occur if the project: 1
Conflicts with or obstructs implementation of the applicable air quality plan;
affects the attainment and maintenance of regional ozone levels by emitting 137 pounds per day (lb/day) or more of an ozone precursor air pollutant, which are VOC or NOx;
locally affects particulate matter levels by emitting greater than 82 lbs/day of PM10 on site and cause an exceedance of the State PM10 standard at an existing or reasonably foreseeable receptor as averaged over 24 hours;
causes or contributes to an exceedance of a CO standard as measured by Level of Service (LOS) degradation at a project-effected intersection and confirmed by dispersion modeling. This applies to project-affected intersections with substantial traffic that are degraded from a LOS of E or worse;
1 CEQA Air Quality Guidelines, Monterey Bay Unified Air Pollution Control District, 1995, with revisions through July 2004.
exposes sensitive receptors or the general public to substantial levels of toxic air contaminants; and
creates or exposes a substantial number of people to objectionable odors or nuisances.
For cumulative impacts, MBUAPCD recommends that the project be assessed for consistency with the 2004 Air Quality Management Plan for the North Central Coast Air Basin. This was done by requesting a formal consistency determination from AMBAG.
The project does not include siting of sensitive receptors (e.g., residences) near roadways with sufficient volumes to expose sensitive receptors to unhealthy air pollution levels. CARB recommends a buffer of 500 feet between sensitive receptors and freeways or rural roads with an average of 50,000 vehicles or more per day2.
Air Quality Impacts
Impact AQ-1 Construction Period Impacts –PM10 from Fugitive Dust Construction activities, such as clearing, grading operations, construction vehicle traffic on unpaved ground, and wind blowing over exposed earth would generate dust and particulate matter. This would be a significant impact.
Construction activities would occur at times over a 10-year or longer period on the 137-acre undeveloped site. The college and residential portion of the site would be constructed separately, and possibly concurrently. The first phase of the college is likely to involve fairly minor grading to develop pads for the modular buildings, access roads and a parking lot. More grading would occur in the future as the site is developed into the college campus. About 40% of the site would be developed with single-family residences, open space/park/buffer and infrastructure such as roadways. This portion of the site would be developed in five separate phases over 10 years.
Site grading would primarily be accomplished using diesel powered heavy equipment. Dust is generated from a variety of project construction activities that include grading, import/export of fill material, and vehicle travel on unpaved surfaces. Dust from construction includes PM10.Soil can also be tracked-out onto paved roads where it is entrained in the air by passing cars and trucks. Additionally, dust can be generated by wind erosion of exposed areas. The rate of dust emissions is related to the type and size of the disturbance, meteorological conditions, and soil conditions. Construction activities can result in localized high concentrations of PM10 and affect regional levels of PM10. High levels of PM10 can lead to adverse health effects, nuisance concerns, and reduced visibility. Detailed development plans or construction plans for these sites have not been developed.
MBUAQMD CEQA Guidelines consider on-site emissions of 82 pounds per day or greater of PM10 from construction activity to be significant if the emissions would lead to exceedances of ambient air quality standards. The emissions threshold defines significance where specific
2 Air Quality and Land Use Handbook: A Community Health Perspective, California Air Resources Board. April 2005.
construction activity is not known to conduct a detailed analysis to model PM10 concentrations. Due to the variables that affect construction emissions, quantification of construction period emissions is difficult. The initial phases of construction that generate the highest emissions of PM10 from fugitive dust would be of most concern. As previously mentioned, the site would be constructed phases, over the next 10 to 25 years. Grading and construction activities could begin in 2010 and continue to occur intermittently at various times out beyond the 2018-20 period. During other construction phases, additional material would be imported to the site. This would include base rock, select soil/gravel for trenches and building pads, concrete, and asphalt for paving. Building materials would also be imported to the site.
Fugitive dust emissions would occur during each of the construction phases. The greatest amount of dust emissions would be generated during the initial grading phase where the soil disturbance activities would be the most intense (i.e., cut and fill activities involving scrapers and other equipment). The other construction phases would generate dust emissions, but of a lesser degree than grading since the intensity of soil disturbance activities would be reduced.
Uncontrolled daily fugitive dust emissions can be approximated for grading construction activities using emission factors developed as part of a study conducted for the South Coast Air Quality Management District (MRI, 1996). This study developed fugitive dust (PM10) emission factors for construction activities at seven sites in Las Vegas, Coachella Valley, the South Coast area, and in the San Joaquin Valley. A general overall emission factor of 10 pounds per acre per day was found to represent typical daily emissions. On the most active days during grading, emissions would be higher. The identified a worst-case overall emission factor that would apply to the most intense construction sites was 38.2 pounds per acre per day. However, the worst-case overall rate for a California site was 4.1 pounds per acre per work hour, or 32.8 pounds per acre per day. These emission factors include emissions associated with general construction activities, as well as those from intensive earth-moving activities. The study developed specific emission factors that require specific construction information, such as the amount of earthwork and the detail of control measures. Since that type of information is generally not available, overall emission factors were used to estimate daily emissions.
Using emission factors of 10 pounds per acre per day would result in significant emissions if over 8.2 acres were disturbed on a typical day. For very active periods (worst-case), emissions would be significant if over 2.5 acres were disturbed in one day. Grading activity that encompasses more than 2.5 acres in a single day could result in on-site PM10 emissions that would be significant. When specific project details and grading activities are known, better emission estimates could be made to refine construction plans and possibly remain below the 82 pound per day threshold with a larger area of disturbance.
In addition, PM10 emissions would occur as a result of wind erosion over disturbed areas during dry windy conditions and from vehicle track out. These emissions are not accounted for in the emission factors applied to grading and construction activities. Ordinarily, these emissions would be considerably small in comparison with grading activities. Emissions from wind erosion are difficult to predict since one has to know the area that is disturbed enough so that wind could cause erosion and then a wind speed above a certain threshold has to occur for a known duration. Wind erosion emissions would vary considerably, but could be effectively controlled through active watering of the site or use of soil stabilization methods throughout the
construction period. To greatly reduce wind erosion, disturbed areas would have to also be controlled on weekends or holidays that construction is not occurring.
The closest sensitive receptors to the site are the single-family residences Cielo Vista subdivision to the west across Fairview Road. These homes would be about 150 to 200 feet or further from the closest construction activities. Typically, winds blow from the west during the daytime, so these homes would be normally upwind of construction activities. This would especially be the case during spring and summer.
Given the size of the project area to be graded, daily activity areas could exceed 2.5 acres per day. Onsite PM10 emissions, therefore, may exceed the MBUAPCD thresholds of 82 pounds per day. This would result in a significant impact to air quality.
Mitigation
Prior to start of construction, the project applicant or contractor shall submit to the County of San Benito Public Works Department a construction dust mitigation plan. This plan shall specify the methods of dust control that would be utilized, demonstrate the availability of needed equipment and personnel, use reclaimed water for dust control, and identify a responsible individual who, if needed, can authorize implementation of additional measures. The construction dust mitigation plan shall, at a minimum, include the following measures:
Limit grading activity to a maximum of 2.5 acres daily. As more detailed construction information becomes available, emissions from grading activities could be reassessed to determine if the area of grading could be increased. Such an assessment would have to be conducted using appropriate assumptions and mitigation measures. Water all active construction areas at least twice daily and more often during windy periods. Active areas adjacent to existing businesses should be kept damp at all times. If necessary, during windy periods, watering is to occur on all days of the week regardless of onsite activities. Cover all trucks hauling trucks or maintain at least two feet of freeboard. Pave, apply water three times daily, or apply (non-toxic) soil stabilizers on all unpaved access roads, parking areas and staging areas at construction sites. Sweep daily all paved access roads, parking areas and staging areas at construction sites.Sweep streets daily if visible soil material is deposited onto the adjacent roads.Hydroseed or apply (non-toxic) soil stabilizers to inactive construction areas (previously graded areas inactive for ten days or more).Enclose, cover, water twice daily or apply (non-toxic) soil binders to exposed stockpiles.Limit traffic speeds on unpaved roads to 15 mph. Replant vegetation in disturbed areas as quickly as possible. Suspend excavation and grading activity when hourly-average winds exceed 15 mph and visible dust clouds cannot be contained within the site.
The combined effect of the above measures, including the use of a dust suppressant, which represent Best Management Practices, and limiting the size of the grading area would reduce project impacts to a less-than-significant level only if emissions can be limited to 82 pounds per day or subsequent dispersion modeling of construction activities demonstrates that PM10concentrations from construction activity would not cause an exceedance of the State ambient air quality standard, as averaged over 24 hours. Use of the measures above and limiting size of areas to be graded during a single day would reduce the impact to a less-than-significant level.
Impact AQ-2 Heavy-Duty Off-Road Equipment Construction activities would involve use of the heavy-duty off-road equipment and large trucks that use diesel fuel resulting in emissions of diesel particulate matter that can cause health effects to nearby residences. This is a significant impact that can be reduced to a less-than-significant level with implementation of the following mitigation.
The California Air Resources Board has identified diesel particulate matter as a toxic air contaminant. It is one of many toxic air contaminants; however, it is estimated to contribute about 70% to the overall potential inhalation cancer risk. Improved diesel engine technologies along with reformulated diesel fuel are expected to substantially lower the risk from diesel exhaust. In addition, CARB recently adopted an Air Toxics Control Measure that will require replacement or retrofit of existing construction equipment to reduce both diesel particulate matter and NOx.
The heavy construction equipment utilized to construct this project would be diesel fueled. Grading of the site is expected to result in the highest emissions of diesel particulate matter during the construction period. Grading plans are not known at this time, therefore, the amount and types of equipment and their schedule cannot be determined. There are typically two different periods of grading: a “rough” grading phase that requires excavators, dozers and water trucks and then a “fine” grading phase that may include motor graders, rollers, scrapers, and loaders. This equipment is typically used from 4 to 8 hours per day. Other phases of construction use smaller sized equipment (e.g., some loaders, forklifts, etc.), but include numerous heavy-duty truck deliveries for cement, asphalt, building materials, and landscape materials.
Construction equipment can emit substantial amounts of NOx that could have a small, but cumulative affect on ozone concentrations. MBUAPCD CEQA guidelines do not have thresholds that apply to these emissions. Therefore, the impact is considered less than significant if reasonable and feasible measures to reduce emissions are employed.
Diesel exhaust includes air contaminants that can cause health effects. The increased health risk from these types of emissions (i.e., increased cancer risk) are calculated over a 70-year continuous exposure period at locations of sensitive receptors. Truck travel and construction equipment exhaust may result in elevated levels of diesel particulate matter for short time periods. However, these activities would occur for a relatively short period. In addition, the closest sensitive receptors would be 150 to 200 feet from the closest construction activities, and typically more than 500 feet away from active construction areas. New homes constructed by the project could be located closer to future construction phases, but future phases would likely have smaller construction sites and include newer construction equipment that has lower
emissions. As a result, the impact would be considered as less-than-significant provided that mitigation measures are implemented to minimize exposure to sensitive receptors.
Mitigation
Projects developed under the Master Plan should be evaluated for individual construction period air quality impacts. Project-specific mitigation measures would be identified at that time. However, the following mitigation measures should be implemented for all projects to reduce diesel particulate emissions from on-site construction equipment:
The project shall reduce exhaust NOx and particulate matter emissions by implementing one of the following measures: o The project shall provide a plan, acceptable by the lead agency MBUAPCD,
demonstrating that the heavy-duty (> 50 horsepower) off-road vehicles and equipment to be used in the construction project, including owned, leased and subcontractor vehicles, will achieve a project wide fleet-average 20 percent NOx reduction and 45 percent particulate reduction compared to the most recent CARB fleet average for the time of construction; or
o All off-road construction vehicles/equipment greater than 50 horsepower that will be used on site for more than one week shall: 1) be manufactured during or after 1996, 2) shall meet the NOx emissions standard of 6.9 grams per brake-horsepower hour, and 3) shall be equipped with diesel particulate matter filters.
The contractors shall install temporary electrical service whenever possible to avoid the need for independently powered equipment (e.g. compressors). Signs at the construction site shall be clearly visible to advise that that diesel equipment standing idle for more than 5 minutes shall be turned off. This would include trucks waiting to deliver or receive soil, aggregate or other bulk materials. Rotating drum concrete trucks may keep their engines running continuously if onsite and staged away from residential areas. Properly tune and maintain equipment for low emissions. Stage large diesel powered equipment at least 200 feet from any active land uses (e.g., residences).
The combined effect of the above measures would reduce project impacts to a less-than-significant level.
Impact AQ-3: Truck Emissions Associated with Export of Soil Prior to Construction A large volume of soil may be exported from the site and transported to another project location. This would result in ROG and NOx emissions that would not exceed significance thresholds established by the MBUAPCD. This represents a significant impact.
Prior to project construction, up to 450,000 cubic yards of soil may be exported from the project site by truck. There are no specific plans to export this soil, but preliminary estimates are that it would require several years. This assessment assumes that 100 truckloads of material would be
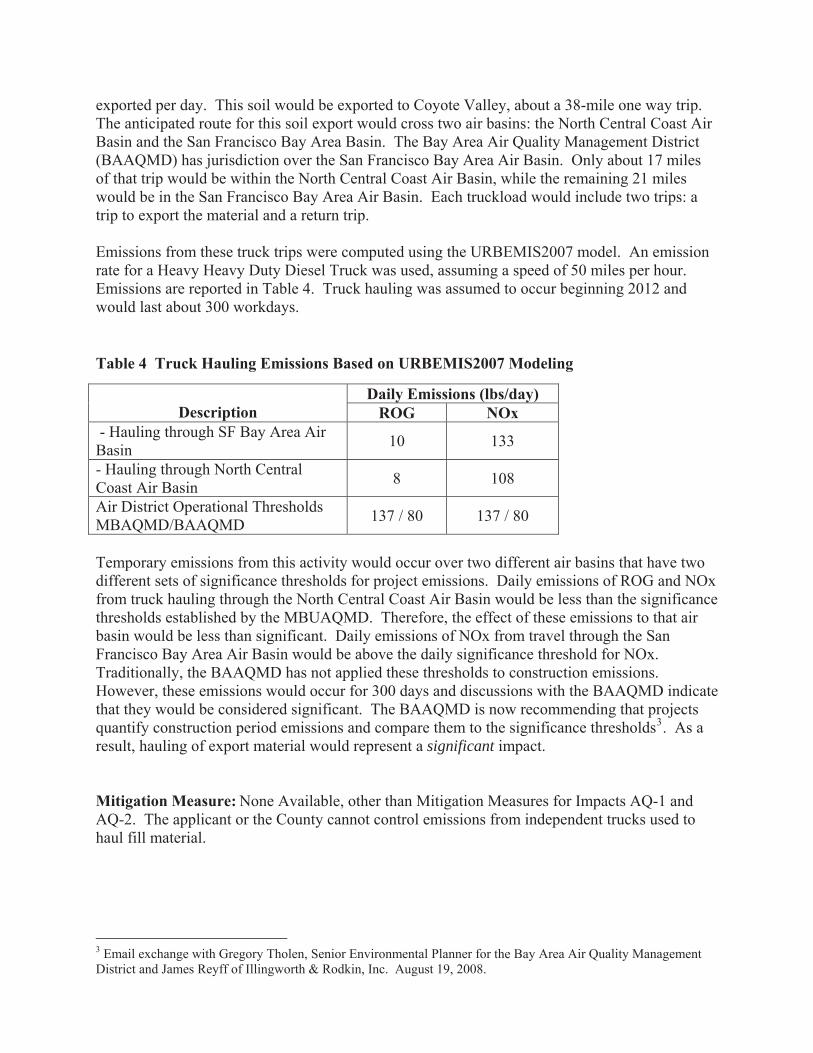
exported per day. This soil would be exported to Coyote Valley, about a 38-mile one way trip. The anticipated route for this soil export would cross two air basins: the North Central Coast Air Basin and the San Francisco Bay Area Basin. The Bay Area Air Quality Management District (BAAQMD) has jurisdiction over the San Francisco Bay Area Air Basin. Only about 17 miles of that trip would be within the North Central Coast Air Basin, while the remaining 21 miles would be in the San Francisco Bay Area Air Basin. Each truckload would include two trips: a trip to export the material and a return trip.
Emissions from these truck trips were computed using the URBEMIS2007 model. An emission rate for a Heavy Heavy Duty Diesel Truck was used, assuming a speed of 50 miles per hour. Emissions are reported in Table 4. Truck hauling was assumed to occur beginning 2012 and would last about 300 workdays.
Table 4 Truck Hauling Emissions Based on URBEMIS2007 Modeling
Daily Emissions (lbs/day) Description ROG NOx
- Hauling through SF Bay Area Air Basin 10 133
- Hauling through North Central Coast Air Basin 8 108
Air District Operational ThresholdsMBAQMD/BAAQMD 137 / 80 137 / 80
Temporary emissions from this activity would occur over two different air basins that have two different sets of significance thresholds for project emissions. Daily emissions of ROG and NOx from truck hauling through the North Central Coast Air Basin would be less than the significance thresholds established by the MBUAQMD. Therefore, the effect of these emissions to that air basin would be less than significant. Daily emissions of NOx from travel through the San Francisco Bay Area Air Basin would be above the daily significance threshold for NOx.Traditionally, the BAAQMD has not applied these thresholds to construction emissions. However, these emissions would occur for 300 days and discussions with the BAAQMD indicate that they would be considered significant. The BAAQMD is now recommending that projects quantify construction period emissions and compare them to the significance thresholds3. As a result, hauling of export material would represent a significant impact.
Mitigation Measure: None Available, other than Mitigation Measures for Impacts AQ-1 and AQ-2. The applicant or the County cannot control emissions from independent trucks used to haul fill material.
3 Email exchange with Gregory Tholen, Senior Environmental Planner for the Bay Area Air Quality Management District and James Reyff of Illingworth & Rodkin, Inc. August 19, 2008.
Impact AQ-4: Plan Generated Operational Impacts Build out of the project would result in increases in long-term operational emissions of ozone precursor pollutants. These emissions of ROG and NOx would not exceed significance thresholds established by the MBUAPCD. This represents a less-than-significant impact.
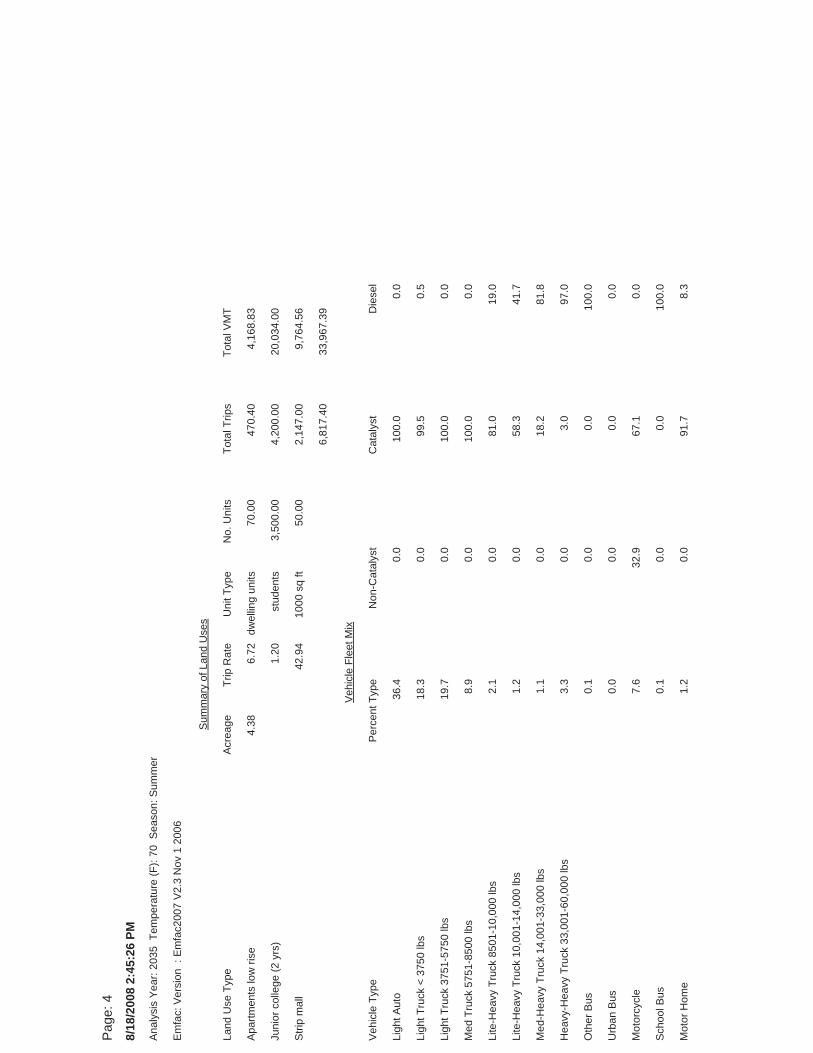
The Master Plan proposes development of college campus, retail uses, student housing and 200 single-family homes. The college project would require at least 20 years for complete build out. The campus would be developed in two phases. The first phase could occur in the near term, where modular classrooms are placed on the site and infrastructure to support those classrooms are developed. The campus would be completely developed after reaching certain student enrollment goals. Development of the single-family homes could occur simultaneous with the campus. The homes would be built out in about 5 phases, so it would also require about 10 years or longer to fully develop the site. The Master Plan’s traffic analysis forecasts 7,433 new daily vehicle trips at full build out. This estimate includes reductions for trip internalization, applied by the Traffic Consultant. Emissions from these trips would affect regional air quality in terms of contributing to possible exceedances of ambient air quality standards for ozone. For emissions modeling purposes, full build out was assumed to be 2035 for the college and 2020 for the residential.
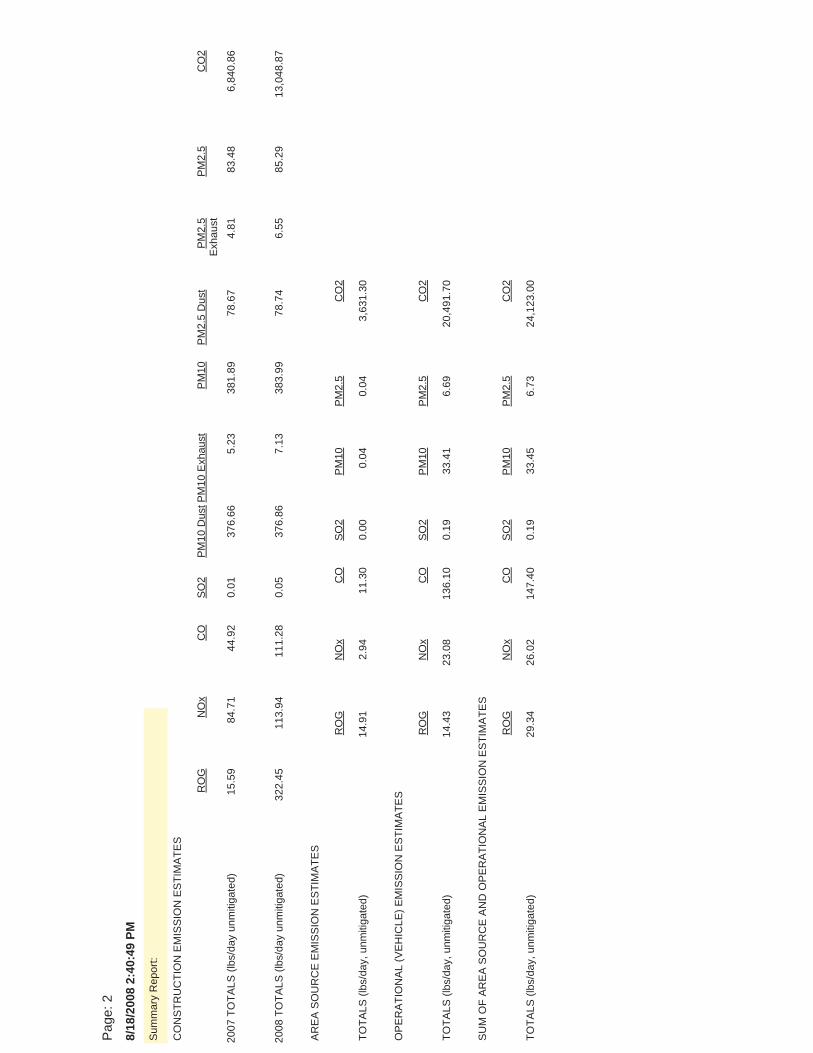
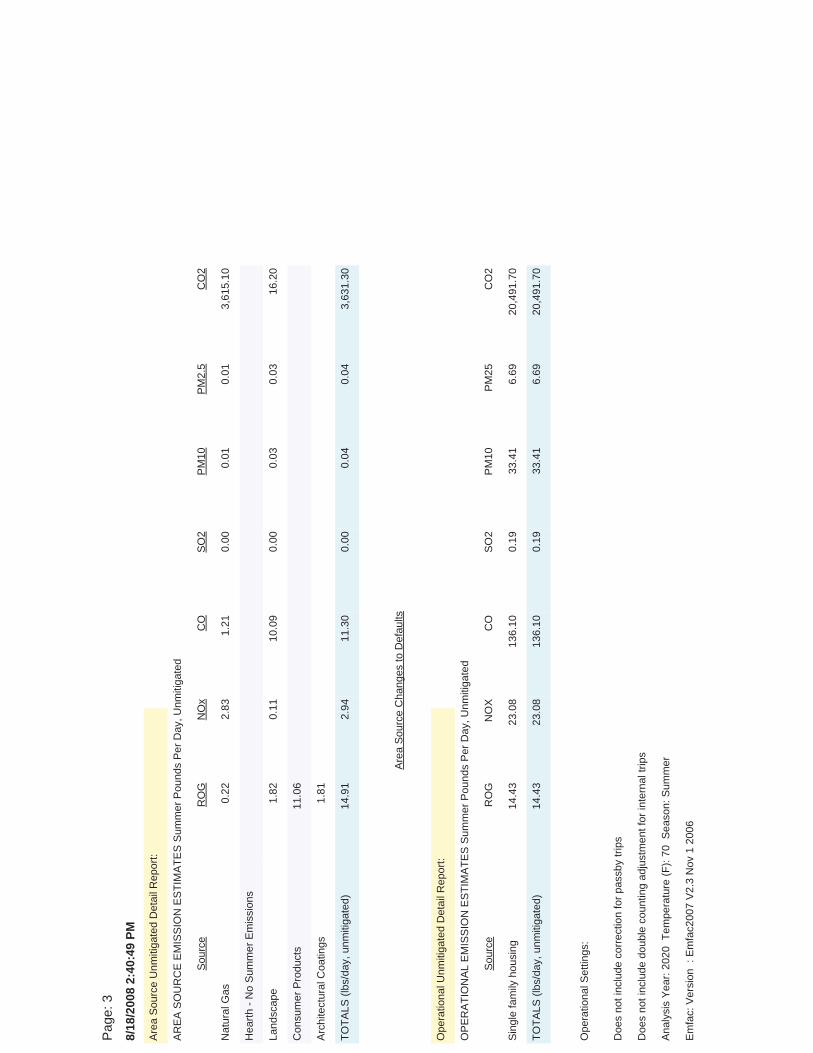
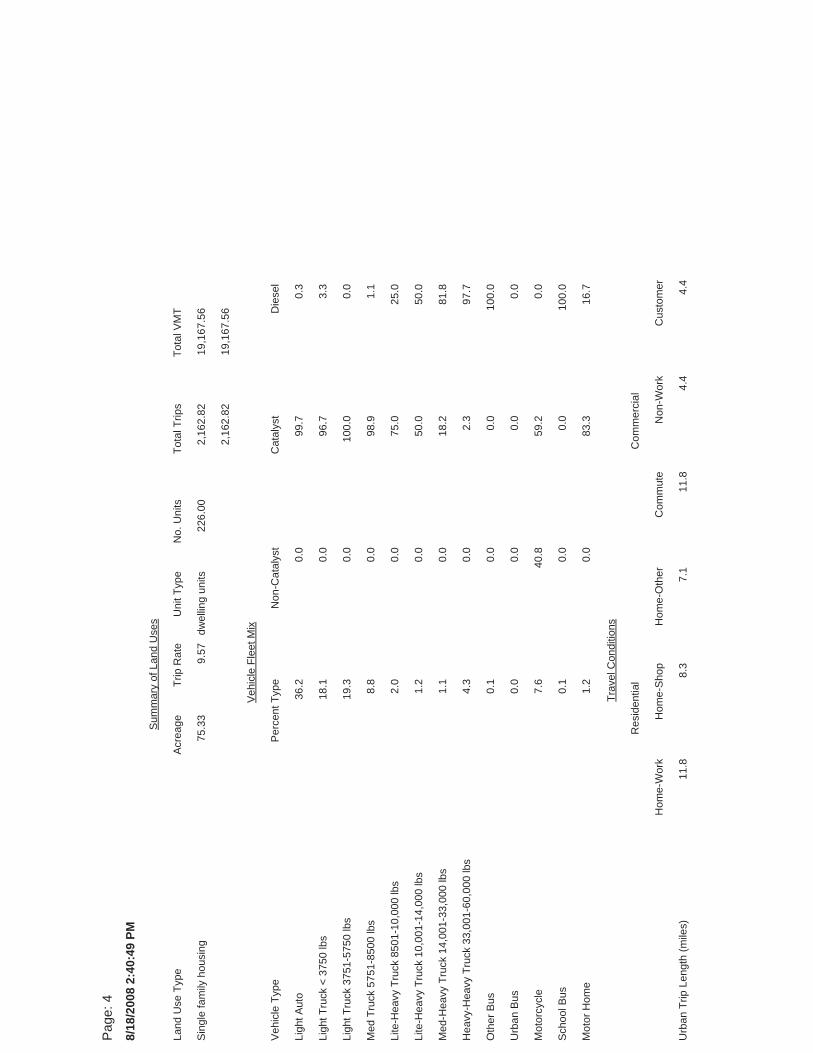
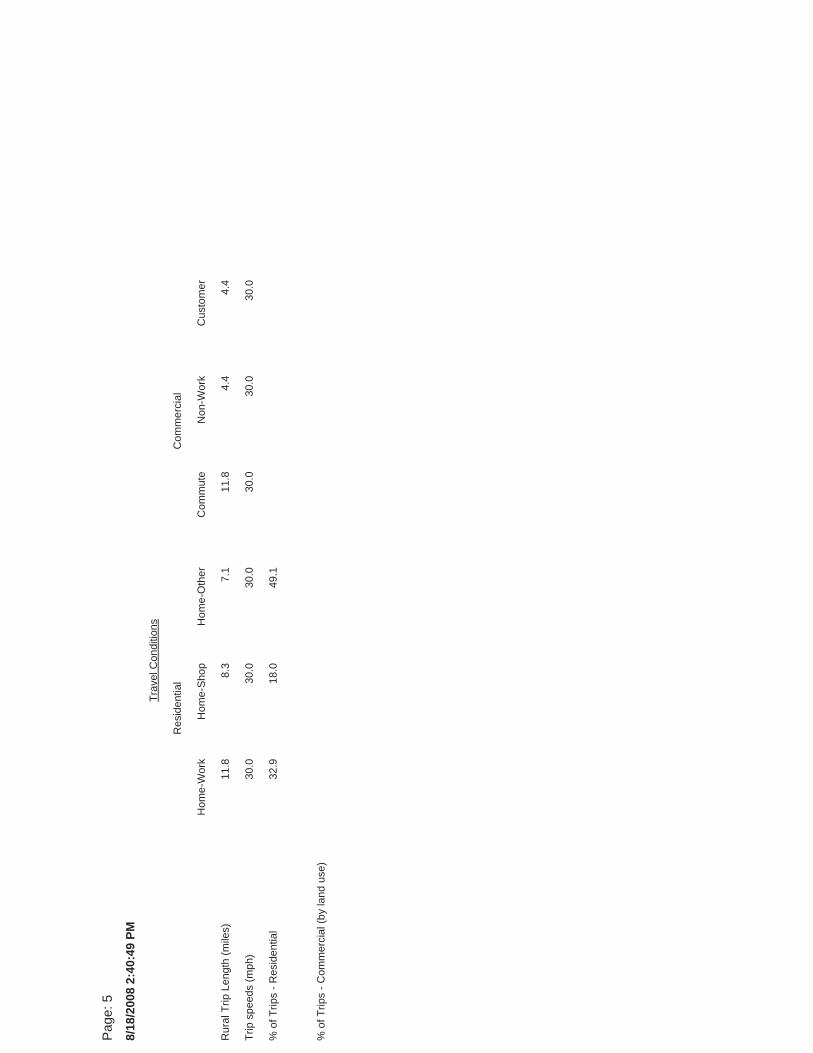
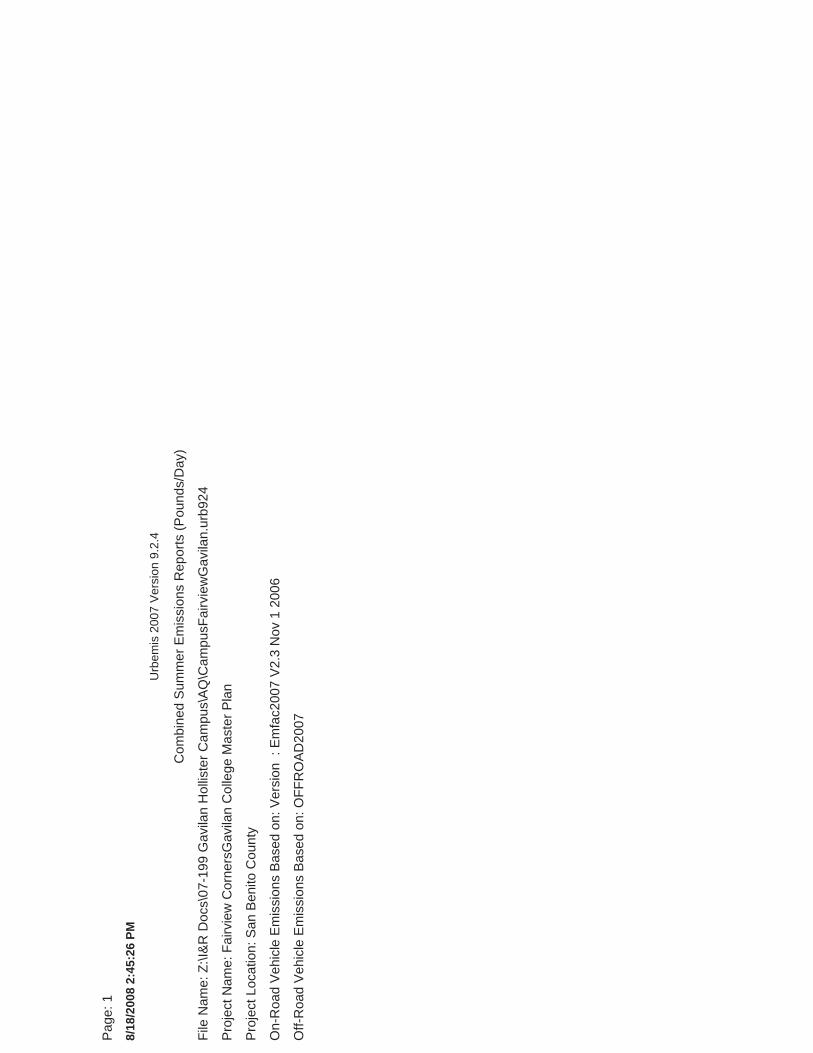
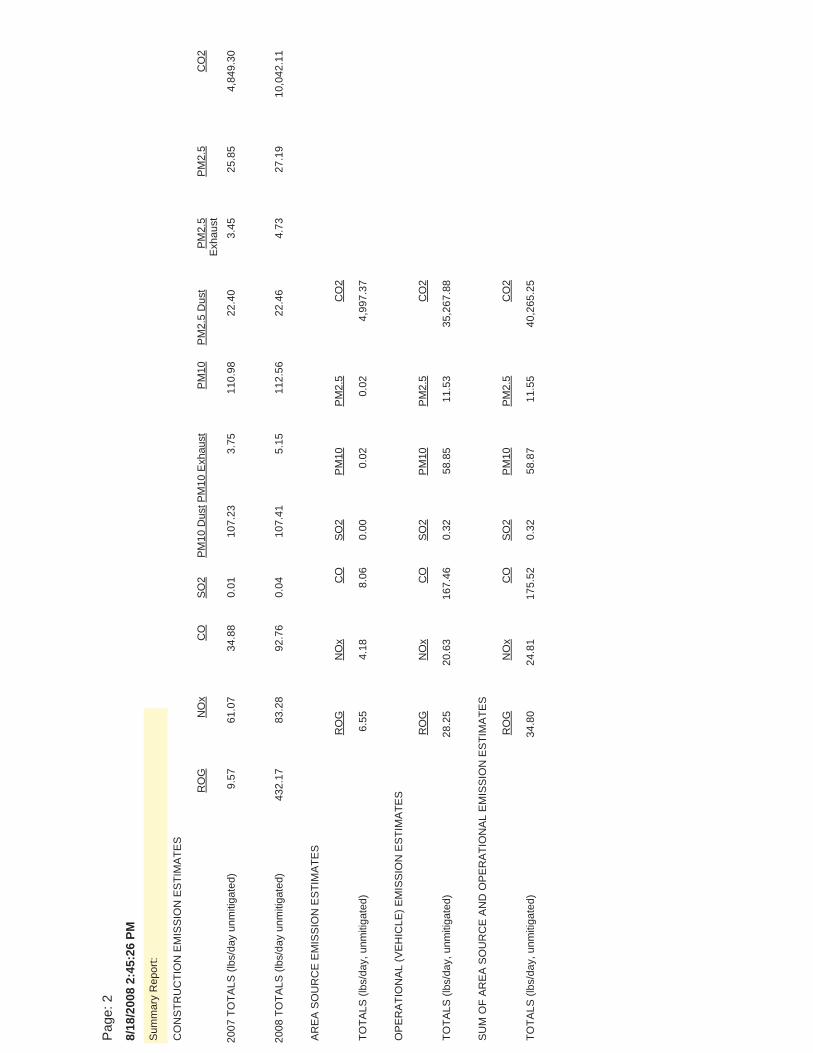
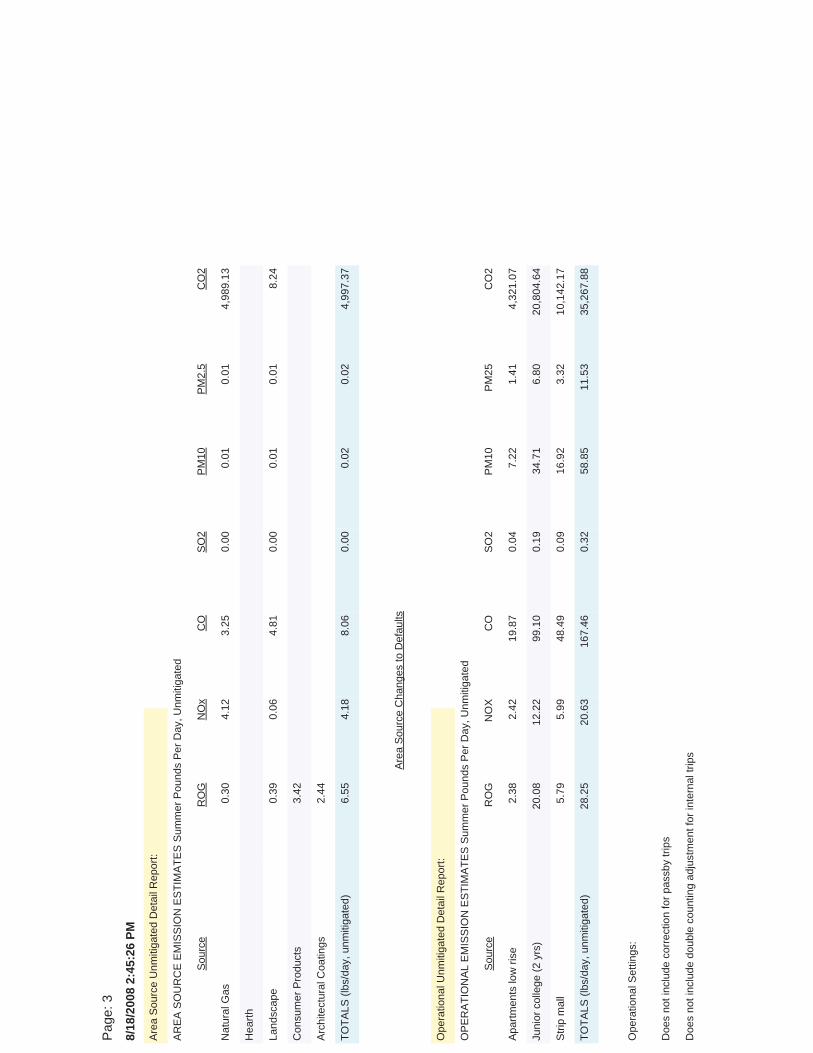
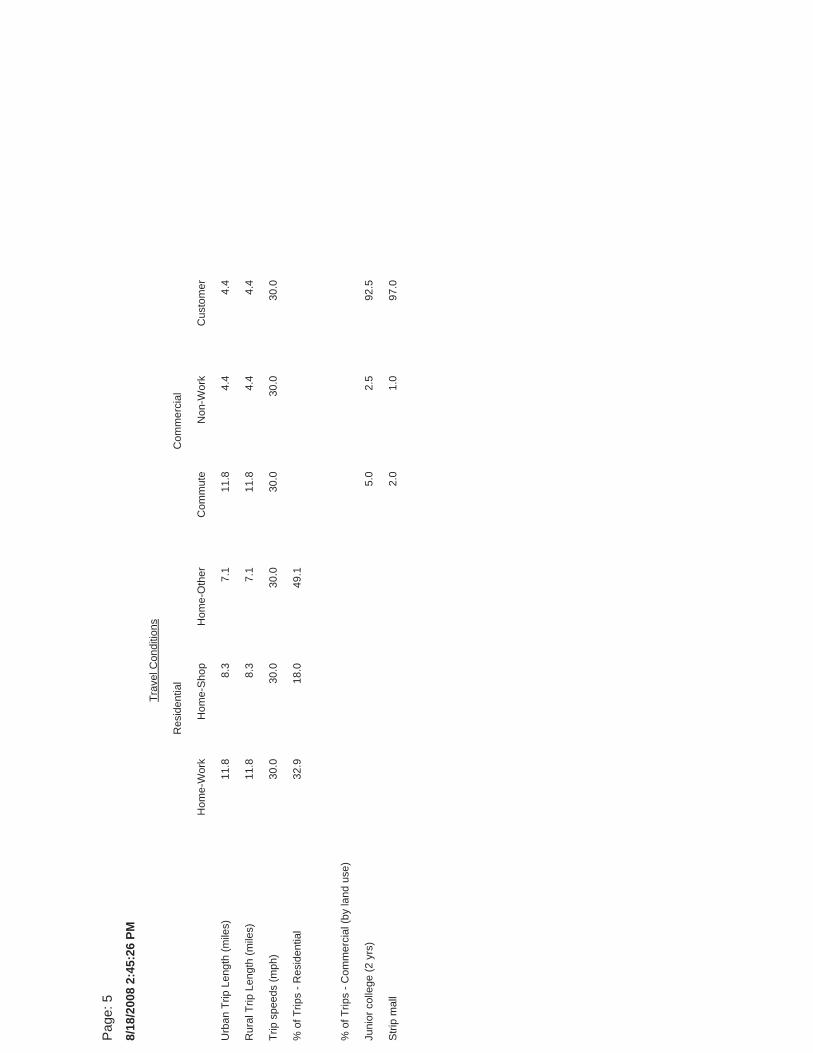
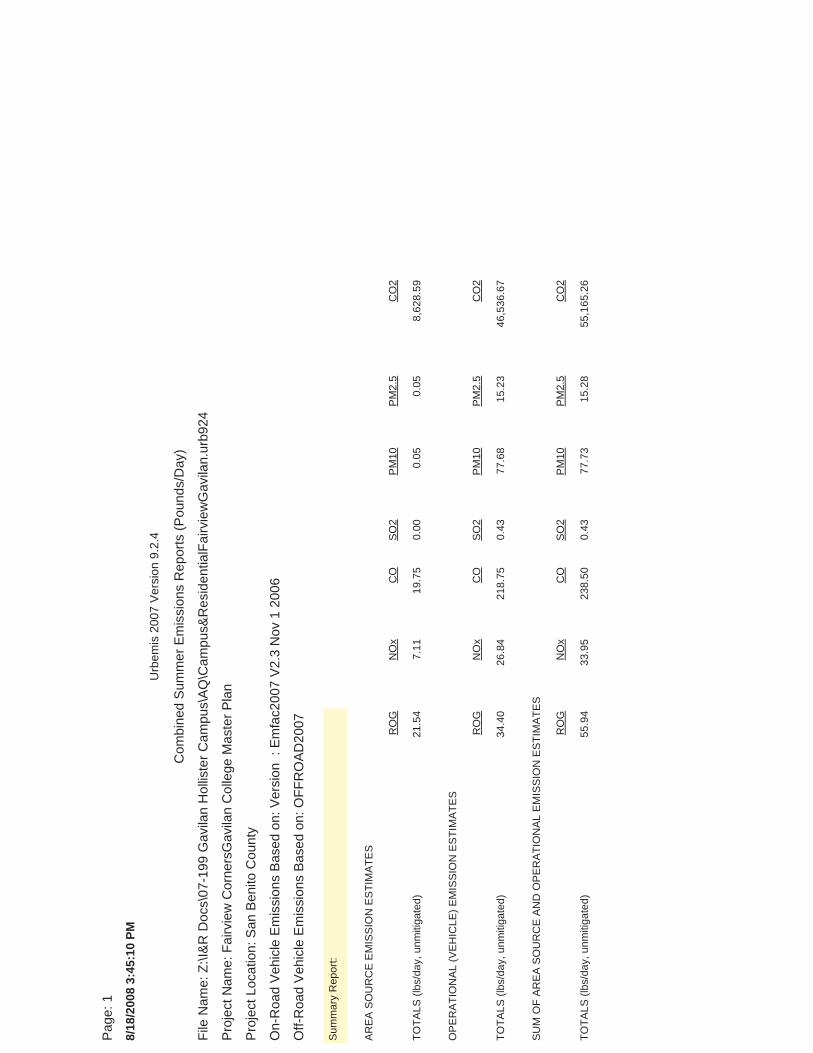
Operational emissions associated with the Master Plan build out were predicted using URBEMIS2007 model (version 9.2.4). The model predicts direct and indirect emissions from projects. Direct emissions are from sources on site such as natural gas combustion for space and water heating, landscape equipment, evaporative emissions from consumer products, and wood burning. Indirect emissions are those produced off site from motor vehicle use. The model predicts daily emissions associated with land use developments. The model combines predicted daily traffic activity associated with the different land use types, with emission factors from the State’s mobile emission factor model (i.e., EMFAC2007). The project size and estimated traffic generation were input to the URBEMIS2007 model to predict daily emissions of ROG, NOx, CO, and PM10. The Master Plan traffic generation provided by Hexagon Transportation Consultants for the DEIR, was used in the model to provide daily traffic generation estimates based on selected land uses. URBEMIS2007 model default for passby trips was not used. Instead, trip reduction percentages provided by the traffic engineer based on the reduction of internal trips due to mixed uses were utilized. This was only applied to the conditions representing full build out of the campus and residential components of the project in 2035.
URBEMIS2007 model also predicted area source emissions associated with build out of the project. Area source emissions of ROG and NOx were predicted for summer, and the area source emissions of CO and PM10 were predicted for winter in accordance with MBUAPCD CEQA Guidelines. This included wood smoke from potential fireplaces. The project emissions were predicted for a normal day representative of the traffic generation used for the traffic study. Daily emissions from the build out of the specific plan are reported in Table 4. Model output is provided in Attachment 1.
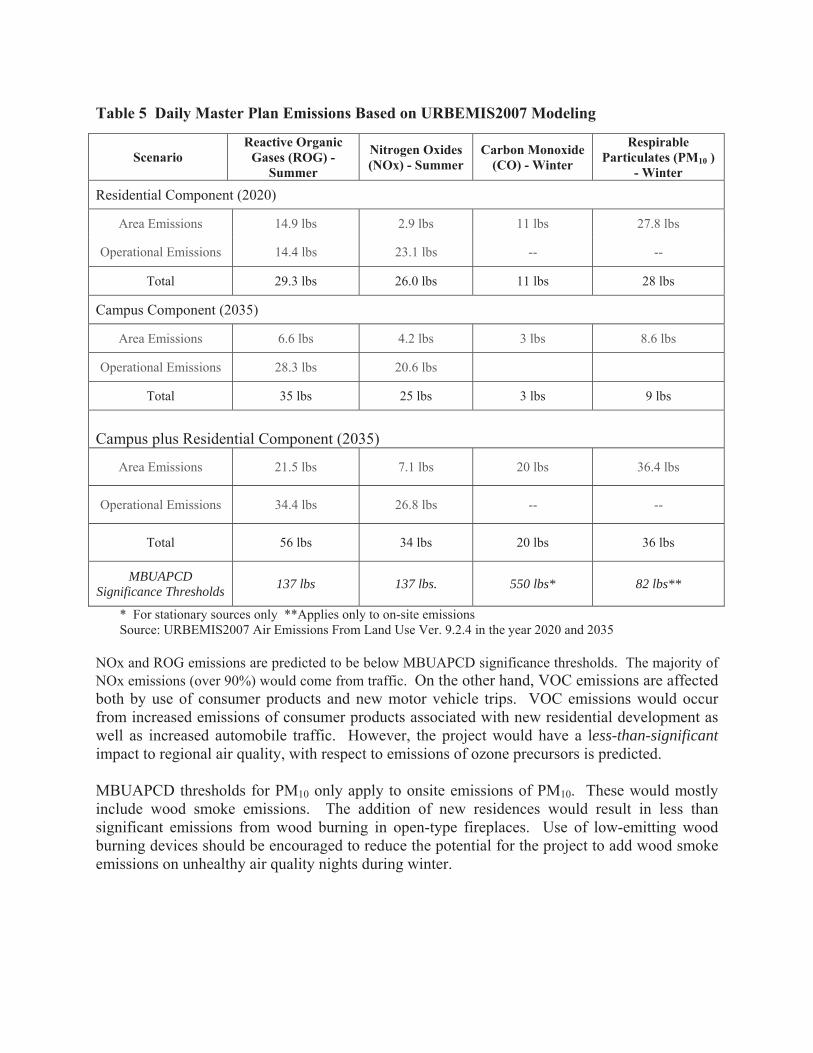
Table 5 Daily Master Plan Emissions Based on URBEMIS2007 Modeling
Reactive Organic Gases (ROG) -
Summer
Nitrogen Oxides (NOx) - Summer
Carbon Monoxide (CO) - Winter Scenario
Respirable Particulates (PM10 )
- Winter
Residential Component (2020)
Area Emissions 14.9 lbs 2.9 lbs 11 lbs 27.8 lbs
Operational Emissions 14.4 lbs 23.1 lbs -- --
Total 29.3 lbs 26.0 lbs 11 lbs 28 lbs
Campus Component (2035)
Area Emissions 6.6 lbs 4.2 lbs 3 lbs 8.6 lbs
Operational Emissions 28.3 lbs 20.6 lbs
Total 35 lbs 25 lbs 3 lbs 9 lbs
Campus plus Residential Component (2035)
Area Emissions 21.5 lbs 7.1 lbs 20 lbs 36.4 lbs
Operational Emissions 34.4 lbs 26.8 lbs -- --
Total 56 lbs 34 lbs 20 lbs 36 lbs
MBUAPCD Significance Thresholds 137 lbs 137 lbs. 550 lbs* 82 lbs**
* For stationary sources only **Applies only to on-site emissions Source: URBEMIS2007 Air Emissions From Land Use Ver. 9.2.4 in the year 2020 and 2035
NOx and ROG emissions are predicted to be below MBUAPCD significance thresholds. The majority of NOx emissions (over 90%) would come from traffic. On the other hand, VOC emissions are affected both by use of consumer products and new motor vehicle trips. VOC emissions would occur from increased emissions of consumer products associated with new residential development as well as increased automobile traffic. However, the project would have a less-than-significantimpact to regional air quality, with respect to emissions of ozone precursors is predicted.
MBUAPCD thresholds for PM10 only apply to onsite emissions of PM10. These would mostly include wood smoke emissions. The addition of new residences would result in less than significant emissions from wood burning in open-type fireplaces. Use of low-emitting wood burning devices should be encouraged to reduce the potential for the project to add wood smoke emissions on unhealthy air quality nights during winter.
Impact AQ-5 Local Carbon Monoxide Concentrations Development of the project would result in higher traffic volumes that could increase carbon monoxide concentrations. This would be a less-than-significant impact.
Emissions thresholds established for carbon monoxide apply to direct or stationary sources. Emissions of carbon monoxide (CO) emitted from traffic generated by the project are first evaluated by assessing the impacts of specific plan-generated traffic on existing and future traffic conditions. MBUAPCD guidelines require CO hotspot analysis under the following project conditions:
Intersections where the Level of Service (LOS) would degrade below D
Volume to capacity ratio increases by 0.05 at LOS E or F intersections
The delay at LOS E or F intersections increases by 10 seconds or more
Reserve capacity at unsignalized LOS E or F intersection decrease by 50 or more
Highest CO concentrations typically occur during the winter where there is traffic congestion occurs. Congested intersections with high volumes of traffic could cause CO “hot spots”, where localized high concentrations of CO occur. The highest CO level measured in the District, which is representative of more urban settings, is 1 ppm for 8-hour exposures. This level is well below the State standards.
Modeling of CO concentrations associated with project related traffic conditions was conducted. The traffic study for the Master Plan evaluated operations at intersections in the area affected by the project. The intersection of Airline Highway and Union Road is predicted to have conditions in the future that meet the criteria for a possible CO hot spot. This signalized intersection is anticipated to operate at Level of Service F in the future with or without the Master Plan build out. Under future Master Plan build out conditions, vehicle delay would increase by up to 19 seconds. CO concentrations at and near this intersection were predicted using the Caline4 model following the Transportation Project Level Carbon Monoxide Protocol, developed by UC Davis. This assessment involved predicting CO emission rates from the EMFAC2007 model and using those along with peak-hour traffic and screening meteorological conditions in the Caline4 model to predict roadside CO levels. These levels were adjusted to 8-hour average levels using a persistence factor of 0.7 and added to the 1-hour background concentration of 1.0 parts per million (ppm). Modeling information is provided in Attachment 2. Under build out of the Master Plan and cumulative traffic conditions, the highest CO concentrations would be 2.5 ppm. This level would be well below the California ambient air quality standard of 9.0 ppm or the national ambient air quality standard of 9 ppm. As a result, the impact on local air quality resulting from the Master Plan is considered to be less than significant.
Mitigation Measure: None required.
Impact: Cumulative Air Quality Impacts The project consists of a junior college campus, some retail and residential uses that were found by AMBAG to be consistent with the 2004 regional forecasts and the Air Quality Management Plan; therefore, it would not conflict with regional efforts to attain and maintain ambient air quality standards. Temporary emissions from soil hauling to San Jose would result in a significant impact to the San Francisco Bay Area Air Basin. As a result, the proposed project would contribute significantly to a cumulative air quality impact.
Projects are evaluated for cumulative impacts both by determining the consistency of the proposed project with the applicable regional air quality plan and the specific project’s individual impacts to air quality.
The MBUAPCD 2004 Air Quality Management Plan for the Monterey Bay Region(AQMP) addresses attainment of the State ozone standard. MBUAPCD has included emissions related to population growth in the AQMP using projections adopted by the Association of Monterey Bay Area Governments (AMBAG). For this project, consistency with population forecasts is determined by comparing project build-out population at the year of project completion with the appropriate five-year forecast increment for the jurisdiction that the project is located (i.e., Monterey County). Projects or plans that would not cause the estimated cumulative population to exceed forecasts are considered consistent with air quality planning efforts. According to AMBAG, this project is consistent with the 2004 regional forecasts for Monterey County and the Air Quality Management Plan. A letter from AMBAG documenting the consistency determination is included in Attachment 3.
As described in impact Air-3, the project direct and indirect emissions of ozone precursor pollutants would be below MBUAPCD significance thresholds. Therefore, project emissions are not anticipated to affect attainment and maintenance of ambient air quality standards for ozone. Short-term impacts to air quality from on site construction would be less-than-significant with mitigation. These impacts are anticipated to be localized and not cumulatively contribute to other air quality impacts in the project area. However, a significant, but temporary impact to air quality from hauling of soil was identified. This significant impact would occur for about one year. This significant impact would not occur within the project air basin.

Attachment 1
URBEMIS2007 MODEL OUTPUT See PDF attachment
8/18
/200
8 2:
40:4
9 PM
Page
: 1
File
Nam
e: Z
:\I&R
Doc
s\07
-199
Gav
ilan
Hol
liste
r Cam
pus\
AQ\R
esid
entia
lFai
rvie
wG
avila
n.ur
b924
Proj
ect N
ame:
Gav
ilan
Fairv
iew
- R
esid
entia
l
Proj
ect L
ocat
ion:
San
Ben
ito C
ount
y
On-
Roa
d Ve
hicl
e Em
issi
ons
Base
d on
: Ver
sion
: E
mfa
c200
7 V2
.3 N
ov 1
200
6
Off-
Roa
d Ve
hicl
e Em
issi
ons
Base
d on
: OFF
RO
AD20
07
Com
bine
d Su
mm
er E
mis
sion
s R
epor
ts (P
ound
s/D
ay)
Urb
emis
200
7 Ve
rsio
n 9.
2.4
8/18
/200
8 2:
40:4
9 PM
Page
: 2
TOTA
LS (l
bs/d
ay, u
nmiti
gate
d)29
.34
26.0
214
7.40
0.19
33.4
56.
7324
,123
.00
SUM
OF
AREA
SO
UR
CE
AND
OPE
RAT
ION
AL E
MIS
SIO
N E
STIM
ATES
RO
GN
Ox
CO
SO2
PM10
PM2.
5C
O2
TOTA
LS (l
bs/d
ay, u
nmiti
gate
d)14
.43
23.0
813
6.10
0.19
33.4
16.
6920
,491
.70
OPE
RAT
ION
AL (V
EHIC
LE) E
MIS
SIO
N E
STIM
ATES
RO
GN
Ox
CO
SO2
PM10
PM2.
5C
O2
TOTA
LS (l
bs/d
ay, u
nmiti
gate
d)14
.91
2.94
11.3
00.
000.
040.
043,
631.
30
AREA
SO
UR
CE
EMIS
SIO
N E
STIM
ATES
RO
GN
Ox
CO
SO2
PM10
PM2.
5C
O2
2008
TO
TALS
(lbs
/day
unm
itiga
ted)
322.
4511
3.94
111.
280.
0537
6.86
7.13
383.
9978
.74
6.55
85.2
913
,048
.87
2007
TO
TALS
(lbs
/day
unm
itiga
ted)
15.5
984
.71
44.9
20.
0137
6.66
5.23
381.
8978
.67
4.81
83.4
86,
840.
86
RO
GN
Ox
CO
SO2
PM10
Dus
tPM
10 E
xhau
stPM
10PM
2.5
Dus
tPM
2.5
Exha
ust
PM2.
5C
O2
CO
NST
RU
CTI
ON
EM
ISSI
ON
EST
IMAT
ES
Sum
mar
y R
epor
t:
8/18
/200
8 2:
40:4
9 PM
Page
: 3
OPE
RAT
ION
AL E
MIS
SIO
N E
STIM
ATES
Sum
mer
Pou
nds
Per D
ay, U
nmiti
gate
d
Sing
le fa
mily
hou
sing
14.4
323
.08
136.
100.
1933
.41
6.69
20,4
91.7
0
TOTA
LS (l
bs/d
ay, u
nmiti
gate
d)14
.43
23.0
813
6.10
0.19
33.4
16.
6920
,491
.70
Sour
ceR
OG
NO
XC
OSO
2PM
10PM
25C
O2
Ope
ratio
nal U
nmiti
gate
d D
etai
l Rep
ort:
Arch
itect
ural
Coa
tings
1.81
Con
sum
er P
rodu
cts
11.0
6
Hea
rth -
No
Sum
mer
Em
issi
ons
Land
scap
e1.
820.
1110
.09
0.00
0.03
0.03
16.2
0
Nat
ural
Gas
0.22
2.83
1.21
0.00
0.01
0.01
3,61
5.10
TOTA
LS (l
bs/d
ay, u
nmiti
gate
d)14
.91
2.94
11.3
00.
000.
040.
043,
631.
30
Sour
ceR
OG
NO
xC
OSO
2PM
10PM
2.5
CO
2
AREA
SO
UR
CE
EMIS
SIO
N E
STIM
ATES
Sum
mer
Pou
nds
Per D
ay, U
nmiti
gate
d
Area
Sou
rce
Unm
itiga
ted
Det
ail R
epor
t:
Anal
ysis
Yea
r: 20
20 T
empe
ratu
re (F
): 70
Sea
son:
Sum
mer
Emfa
c: V
ersi
on :
Em
fac2
007
V2.3
Nov
1 2
006
Doe
s no
t inc
lude
cor
rect
ion
for p
assb
y tri
ps
Doe
s no
t inc
lude
dou
ble
coun
ting
adju
stm
ent f
or in
tern
al tr
ips
Ope
ratio
nal S
ettin
gs:
Area
Sou
rce
Cha
nges
to D
efau
lts
8/18
/200
8 2:
40:4
9 PM
Page
: 4
Urb
an T
rip L
engt
h (m
iles)
11.8
8.3
7.1
11.8
4.4
4.4
Trav
el C
ondi
tions
Hom
e-W
ork
Hom
e-Sh
opH
ome-
Oth
erC
omm
ute
Non
-Wor
kC
usto
mer
Res
iden
tial
Com
mer
cial
Hea
vy-H
eavy
Tru
ck 3
3,00
1-60
,000
lbs
4.3
0.0
2.3
97.7
Med
-Hea
vy T
ruck
14,
001-
33,0
00 lb
s1.
10.
018
.281
.8
Mot
or H
ome
1.2
0.0
83.3
16.7
Oth
er B
us0.
10.
00.
010
0.0
Scho
ol B
us0.
10.
00.
010
0.0
Mot
orcy
cle
7.6
40.8
59.2
0.0
Urb
an B
us0.
00.
00.
00.
0
Ligh
t Tru
ck <
375
0 lb
s18
.10.
096
.73.
3
Ligh
t Aut
o36
.20.
099
.70.
3
Lite
-Hea
vy T
ruck
10,
001-
14,0
00 lb
s1.
20.
050
.050
.0
Lite
-Hea
vy T
ruck
850
1-10
,000
lbs
2.0
0.0
75.0
25.0
Med
Tru
ck 5
751-
8500
lbs
8.8
0.0
98.9
1.1
Ligh
t Tru
ck 3
751-
5750
lbs
19.3
0.0
100.
00.
0
Vehi
cle
Flee
t Mix
Vehi
cle
Type
Perc
ent T
ype
Non
-Cat
alys
tC
atal
yst
Die
sel
Sing
le fa
mily
hou
sing
75.3
39.
57dw
ellin
g un
its22
6.00
2,16
2.82
19,1
67.5
6
2,16
2.82
19,1
67.5
6
Sum
mar
y of
Lan
d U
ses
Land
Use
Typ
eAc
reag
eTr
ip R
ate
Uni
t Typ
eN
o. U
nits
Tota
l Trip
sTo
tal V
MT
8/18
/200
8 2:
40:4
9 PM
Page
: 5
Trip
spe
eds
(mph
)30
.030
.030
.030
.030
.030
.0
% o
f Trip
s - R
esid
entia
l32
.918
.049
.1
% o
f Trip
s - C
omm
erci
al (b
y la
nd u
se)
Rur
al T
rip L
engt
h (m
iles)
11.8
8.3
7.1
11.8
4.4
4.4
Trav
el C
ondi
tions
Hom
e-W
ork
Hom
e-Sh
opH
ome-
Oth
erC
omm
ute
Non
-Wor
kC
usto
mer
Res
iden
tial
Com
mer
cial
8/18
/200
8 2:
45:2
6 PM
Page
: 1
File
Nam
e: Z
:\I&R
Doc
s\07
-199
Gav
ilan
Hol
liste
r Cam
pus\
AQ\C
ampu
sFai
rvie
wG
avila
n.ur
b924
Proj
ect N
ame:
Fai
rvie
w C
orne
rsG
avila
n C
olle
ge M
aste
r Pla
n
Proj
ect L
ocat
ion:
San
Ben
ito C
ount
y
On-
Roa
d Ve
hicl
e Em
issi
ons
Base
d on
: Ver
sion
: E
mfa
c200
7 V2
.3 N
ov 1
200
6
Off-
Roa
d Ve
hicl
e Em
issi
ons
Base
d on
: OFF
RO
AD20
07
Com
bine
d Su
mm
er E
mis
sion
s R
epor
ts (P
ound
s/D
ay)
Urb
emis
200
7 Ve
rsio
n 9.
2.4
8/18
/200
8 2:
45:2
6 PM
Page
: 2
TOTA
LS (l
bs/d
ay, u
nmiti
gate
d)34
.80
24.8
117
5.52
0.32
58.8
711
.55
40,2
65.2
5
SUM
OF
AREA
SO
UR
CE
AND
OPE
RAT
ION
AL E
MIS
SIO
N E
STIM
ATES
RO
GN
Ox
CO
SO2
PM10
PM2.
5C
O2
TOTA
LS (l
bs/d
ay, u
nmiti
gate
d)28
.25
20.6
316
7.46
0.32
58.8
511
.53
35,2
67.8
8
OPE
RAT
ION
AL (V
EHIC
LE) E
MIS
SIO
N E
STIM
ATES
RO
GN
Ox
CO
SO2
PM10
PM2.
5C
O2
TOTA
LS (l
bs/d
ay, u
nmiti
gate
d)6.
554.
188.
060.
000.
020.
024,
997.
37
AREA
SO
UR
CE
EMIS
SIO
N E
STIM
ATES
RO
GN
Ox
CO
SO2
PM10
PM2.
5C
O2
2008
TO
TALS
(lbs
/day
unm
itiga
ted)
432.
1783
.28
92.7
60.
0410
7.41
5.15
112.
5622
.46
4.73
27.1
910
,042
.11
2007
TO
TALS
(lbs
/day
unm
itiga
ted)
9.57
61.0
734
.88
0.01
107.
233.
7511
0.98
22.4
03.
4525
.85
4,84
9.30
RO
GN
Ox
CO
SO2
PM10
Dus
tPM
10 E
xhau
stPM
10PM
2.5
Dus
tPM
2.5
Exha
ust
PM2.
5C
O2
CO
NST
RU
CTI
ON
EM
ISSI
ON
EST
IMAT
ES
Sum
mar
y R
epor
t:
8/18
/200
8 2:
45:2
6 PM
Page
: 3
OPE
RAT
ION
AL E
MIS
SIO
N E
STIM
ATES
Sum
mer
Pou
nds
Per D
ay, U
nmiti
gate
d
Strip
mal
l5.
795.
9948
.49
0.09
16.9
23.
3210
,142
.17
Apar
tmen
ts lo
w ri
se2.
382.
4219
.87
0.04
7.22
1.41
4,32
1.07
Juni
or c
olle
ge (2
yrs
)20
.08
12.2
299
.10
0.19
34.7
16.
8020
,804
.64
TOTA
LS (l
bs/d
ay, u
nmiti
gate
d)28
.25
20.6
316
7.46
0.32
58.8
511
.53
35,2
67.8
8
Sour
ceR
OG
NO
XC
OSO
2PM
10PM
25C
O2
Ope
ratio
nal U
nmiti
gate
d D
etai
l Rep
ort:
Arch
itect
ural
Coa
tings
2.44
Con
sum
er P
rodu
cts
3.42
Hea
rth
Land
scap
e0.
390.
064.
810.
000.
010.
018.
24
Nat
ural
Gas
0.30
4.12
3.25
0.00
0.01
0.01
4,98
9.13
TOTA
LS (l
bs/d
ay, u
nmiti
gate
d)6.
554.
188.
060.
000.
020.
024,
997.
37
Sour
ceR
OG
NO
xC
OSO
2PM
10PM
2.5
CO
2
AREA
SO
UR
CE
EMIS
SIO
N E
STIM
ATES
Sum
mer
Pou
nds
Per D
ay, U
nmiti
gate
d
Area
Sou
rce
Unm
itiga
ted
Det
ail R
epor
t:
Doe
s no
t inc
lude
cor
rect
ion
for p
assb
y tri
ps
Doe
s no
t inc
lude
dou
ble
coun
ting
adju
stm
ent f
or in
tern
al tr
ips
Ope
ratio
nal S
ettin
gs:
Area
Sou
rce
Cha
nges
to D
efau
lts
8/18
/200
8 2:
45:2
6 PM
Page
: 4
Hea
vy-H
eavy
Tru
ck 3
3,00
1-60
,000
lbs
3.3
0.0
3.0
97.0
Med
-Hea
vy T
ruck
14,
001-
33,0
00 lb
s1.
10.
018
.281
.8
Mot
or H
ome
1.2
0.0
91.7
8.3
Oth
er B
us0.
10.
00.
010
0.0
Scho
ol B
us0.
10.
00.
010
0.0
Mot
orcy
cle
7.6
32.9
67.1
0.0
Urb
an B
us0.
00.
00.
00.
0
Ligh
t Tru
ck <
375
0 lb
s18
.30.
099
.50.
5
Ligh
t Aut
o36
.40.
010
0.0
0.0
Lite
-Hea
vy T
ruck
10,
001-
14,0
00 lb
s1.
20.
058
.341
.7
Lite
-Hea
vy T
ruck
850
1-10
,000
lbs
2.1
0.0
81.0
19.0
Med
Tru
ck 5
751-
8500
lbs
8.9
0.0
100.
00.
0
Ligh
t Tru
ck 3
751-
5750
lbs
19.7
0.0
100.
00.
0
Vehi
cle
Flee
t Mix
Vehi
cle
Type
Perc
ent T
ype
Non
-Cat
alys
tC
atal
yst
Die
sel
Juni
or c
olle
ge (2
yrs
)1.
20st
uden
ts3,
500.
004,
200.
0020
,034
.00
Strip
mal
l42
.94
1000
sq
ft50
.00
2,14
7.00
9,76
4.56
Apar
tmen
ts lo
w ri
se4.
386.
72dw
ellin
g un
its70
.00
470.
404,
168.
83
6,81
7.40
33,9
67.3
9
Sum
mar
y of
Lan
d U
ses
Land
Use
Typ
eAc
reag
eTr
ip R
ate
Uni
t Typ
eN
o. U
nits
Tota
l Trip
sTo
tal V
MT
Emfa
c: V
ersi
on :
Em
fac2
007
V2.3
Nov
1 2
006
Anal
ysis
Yea
r: 20
35 T
empe
ratu
re (F
): 70
Sea
son:
Sum
mer
8/18
/200
8 2:
45:2
6 PM
Page
: 5
% o
f Trip
s - R
esid
entia
l32
.918
.049
.1
Strip
mal
l2.
01.
097
.0
Juni
or c
olle
ge (2
yrs
)5.
02.
592
.5
% o
f Trip
s - C
omm
erci
al (b
y la
nd u
se)
Trip
spe
eds
(mph
)30
.030
.030
.030
.030
.030
.0
Urb
an T
rip L
engt
h (m
iles)
11.8
8.3
7.1
11.8
4.4
4.4
Rur
al T
rip L
engt
h (m
iles)
11.8
8.3
7.1
11.8
4.4
4.4
Trav
el C
ondi
tions
Hom
e-W
ork
Hom
e-Sh
opH
ome-
Oth
erC
omm
ute
Non
-Wor
kC
usto
mer
Res
iden
tial
Com
mer
cial
8/18
/200
8 3:
45:1
0 PM
Page
: 1
File
Nam
e: Z
:\I&R
Doc
s\07
-199
Gav
ilan
Hol
liste
r Cam
pus\
AQ\C
ampu
s&R
esid
entia
lFai
rvie
wG
avila
n.ur
b924
Proj
ect N
ame:
Fai
rvie
w C
orne
rsG
avila
n C
olle
ge M
aste
r Pla
n
Proj
ect L
ocat
ion:
San
Ben
ito C
ount
y
On-
Roa
d Ve
hicl
e Em
issi
ons
Base
d on
: Ver
sion
: E
mfa
c200
7 V2
.3 N
ov 1
200
6
Off-
Roa
d Ve
hicl
e Em
issi
ons
Base
d on
: OFF
RO
AD20
07
Com
bine
d Su
mm
er E
mis
sion
s R
epor
ts (P
ound
s/D
ay)
Urb
emis
200
7 Ve
rsio
n 9.
2.4
TOTA
LS (l
bs/d
ay, u
nmiti
gate
d)55
.94
33.9
523
8.50
0.43
77.7
315
.28
55,1
65.2
6
SUM
OF
AREA
SO
UR
CE
AND
OPE
RAT
ION
AL E
MIS
SIO
N E
STIM
ATES
RO
GN
Ox
CO
SO2
PM10
PM2.
5C
O2
TOTA
LS (l
bs/d
ay, u
nmiti
gate
d)34
.40
26.8
421
8.75
0.43
77.6
815
.23
46,5
36.6
7
OPE
RAT
ION
AL (V
EHIC
LE) E
MIS
SIO
N E
STIM
ATES
RO
GN
Ox
CO
SO2
PM10
PM2.
5C
O2
TOTA
LS (l
bs/d
ay, u
nmiti
gate
d)21
.54
7.11
19.7
50.
000.
050.
058,
628.
59
AREA
SO
UR
CE
EMIS
SIO
N E
STIM
ATES
RO
GN
Ox
CO
SO2
PM10
PM2.
5C
O2
Sum
mar
y R
epor
t:
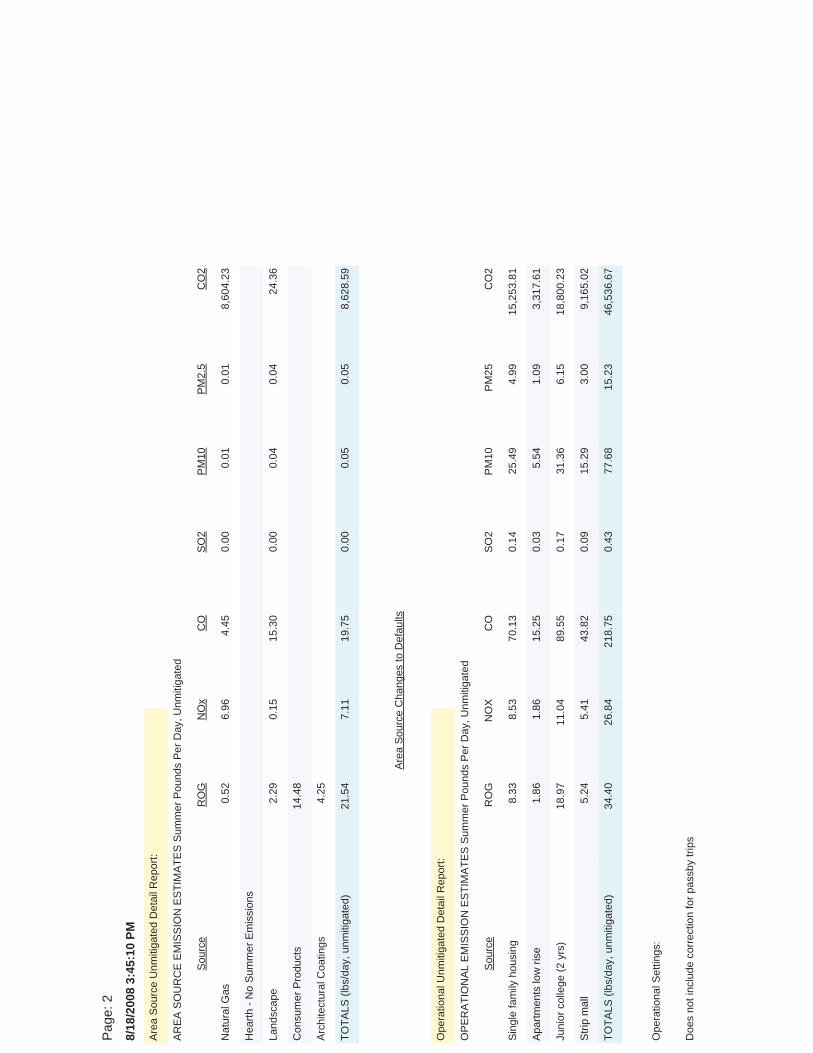
8/18
/200
8 3:
45:1
0 PM
Page
: 2
OPE
RAT
ION
AL E
MIS
SIO
N E
STIM
ATES
Sum
mer
Pou
nds
Per D
ay, U
nmiti
gate
d
Strip
mal
l5.
245.
4143
.82
0.09
15.2
93.
009,
165.
02
Juni
or c
olle
ge (2
yrs
)18
.97
11.0
489
.55
0.17
31.3
66.
1518
,800
.23
Apar
tmen
ts lo
w ri
se1.
861.
8615
.25
0.03
5.54
1.09
3,31
7.61
Sing
le fa
mily
hou
sing
8.33
8.53
70.1
30.
1425
.49
4.99
15,2
53.8
1
TOTA
LS (l
bs/d
ay, u
nmiti
gate
d)34
.40
26.8
421
8.75
0.43
77.6
815
.23
46,5
36.6
7
Sour
ceR
OG
NO
XC
OSO
2PM
10PM
25C
O2
Ope
ratio
nal U
nmiti
gate
d D
etai
l Rep
ort:
Arch
itect
ural
Coa
tings
4.25
Con
sum
er P
rodu
cts
14.4
8
Hea
rth -
No
Sum
mer
Em
issi
ons
Land
scap
e2.
290.
1515
.30
0.00
0.04
0.04
24.3
6
Nat
ural
Gas
0.52
6.96
4.45
0.00
0.01
0.01
8,60
4.23
TOTA
LS (l
bs/d
ay, u
nmiti
gate
d)21
.54
7.11
19.7
50.
000.
050.
058,
628.
59
Sour
ceR
OG
NO
xC
OSO
2PM
10PM
2.5
CO
2
AREA
SO
UR
CE
EMIS
SIO
N E
STIM
ATES
Sum
mer
Pou
nds
Per D
ay, U
nmiti
gate
d
Area
Sou
rce
Unm
itiga
ted
Det
ail R
epor
t:
Doe
s no
t inc
lude
cor
rect
ion
for p
assb
y tri
ps
Ope
ratio
nal S
ettin
gs:
Area
Sou
rce
Cha
nges
to D
efau
lts
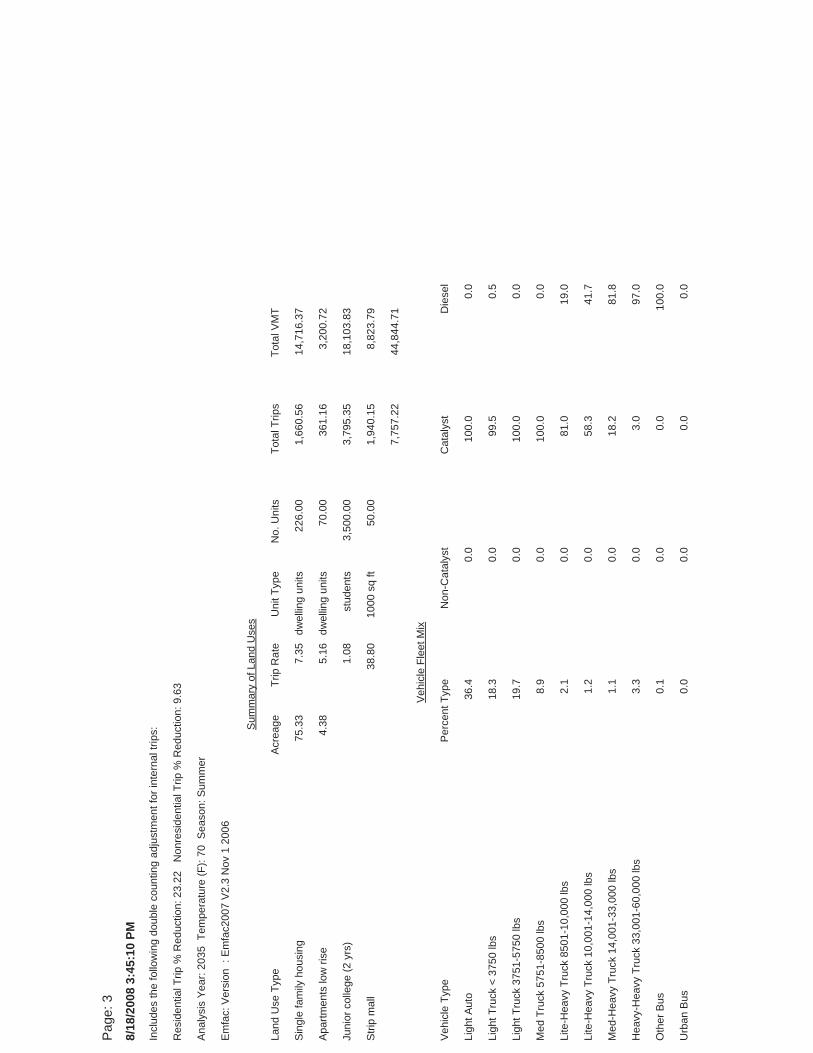
8/18
/200
8 3:
45:1
0 PM
Page
: 3
Hea
vy-H
eavy
Tru
ck 3
3,00
1-60
,000
lbs
3.3
0.0
3.0
97.0
Med
-Hea
vy T
ruck
14,
001-
33,0
00 lb
s1.
10.
018
.281
.8
Oth
er B
us0.
10.
00.
010
0.0
Urb
an B
us0.
00.
00.
00.
0
Ligh
t Tru
ck <
375
0 lb
s18
.30.
099
.50.
5
Ligh
t Aut
o36
.40.
010
0.0
0.0
Lite
-Hea
vy T
ruck
10,
001-
14,0
00 lb
s1.
20.
058
.341
.7
Lite
-Hea
vy T
ruck
850
1-10
,000
lbs
2.1
0.0
81.0
19.0
Med
Tru
ck 5
751-
8500
lbs
8.9
0.0
100.
00.
0
Ligh
t Tru
ck 3
751-
5750
lbs
19.7
0.0
100.
00.
0
Vehi
cle
Flee
t Mix
Vehi
cle
Type
Perc
ent T
ype
Non
-Cat
alys
tC
atal
yst
Die
sel
Sing
le fa
mily
hou
sing
75.3
37.
35dw
ellin
g un
its22
6.00
1,66
0.56
14,7
16.3
7
Juni
or c
olle
ge (2
yrs
)1.
08st
uden
ts3,
500.
003,
795.
3518
,103
.83
Apar
tmen
ts lo
w ri
se4.
385.
16dw
ellin
g un
its70
.00
361.
163,
200.
72
Strip
mal
l38
.80
1000
sq
ft50
.00
1,94
0.15
8,82
3.79
7,75
7.22
44,8
44.7
1
Sum
mar
y of
Lan
d U
ses
Land
Use
Typ
eAc
reag
eTr
ip R
ate
Uni
t Typ
eN
o. U
nits
Tota
l Trip
sTo
tal V
MT
Anal
ysis
Yea
r: 20
35 T
empe
ratu
re (F
): 70
Sea
son:
Sum
mer
Emfa
c: V
ersi
on :
Em
fac2
007
V2.3
Nov
1 2
006
Incl
udes
the
follo
win
g do
uble
cou
ntin
g ad
just
men
t for
inte
rnal
trip
s:
Res
iden
tial T
rip %
Red
uctio
n: 2
3.22
N
onre
side
ntia
l Trip
% R
educ
tion:
9.6
3
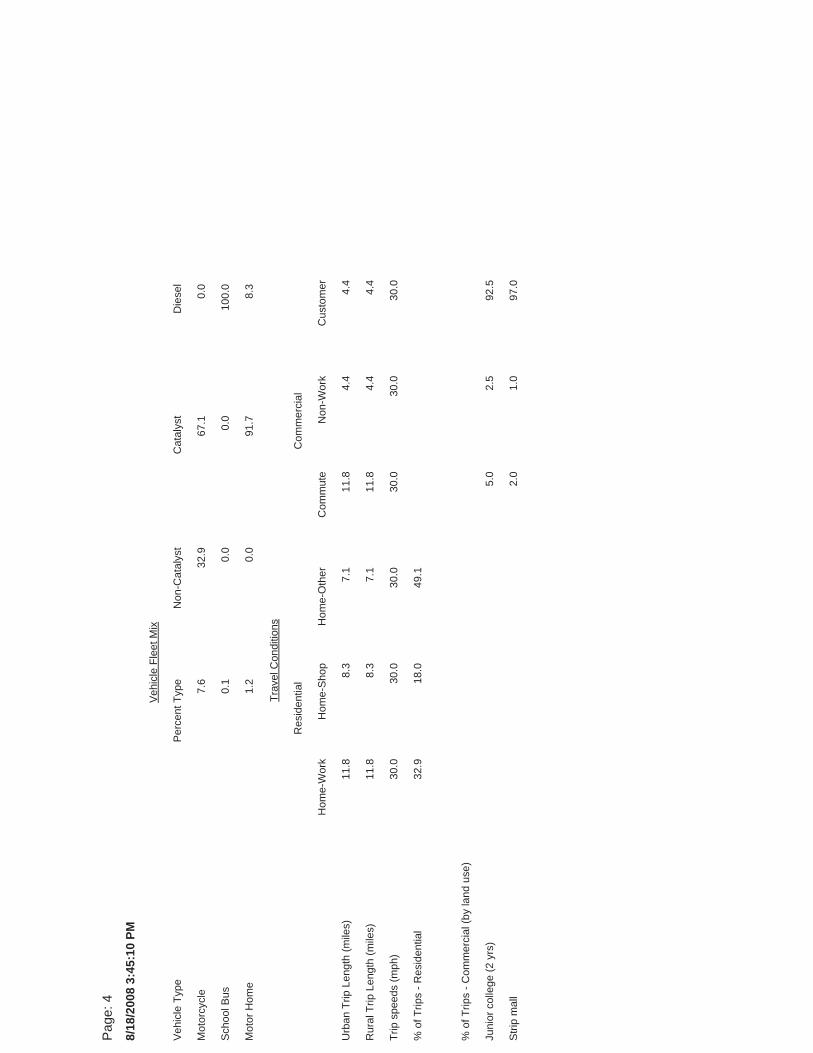
8/18
/200
8 3:
45:1
0 PM
Page
: 4
% o
f Trip
s - R
esid
entia
l32
.918
.049
.1
Strip
mal
l2.
01.
097
.0
Juni
or c
olle
ge (2
yrs
)5.
02.
592
.5
% o
f Trip
s - C
omm
erci
al (b
y la
nd u
se)
Trip
spe
eds
(mph
)30
.030
.030
.030
.030
.030
.0
Urb
an T
rip L
engt
h (m
iles)
11.8
8.3
7.1
11.8
4.4
4.4
Rur
al T
rip L
engt
h (m
iles)
11.8
8.3
7.1
11.8
4.4
4.4
Trav
el C
ondi
tions
Hom
e-W
ork
Hom
e-Sh
opH
ome-
Oth
erC
omm
ute
Non
-Wor
kC
usto
mer
Res
iden
tial
Com
mer
cial
Mot
or H
ome
1.2
0.0
91.7
8.3
Scho
ol B
us0.
10.
00.
010
0.0
Mot
orcy
cle
7.6
32.9
67.1
0.0
Vehi
cle
Flee
t Mix
Vehi
cle
Type
Perc
ent T
ype
Non
-Cat
alys
tC
atal
yst
Die
sel

Attachment 2
Caline4 and EMFAC2007 Model Output See PDF attachment
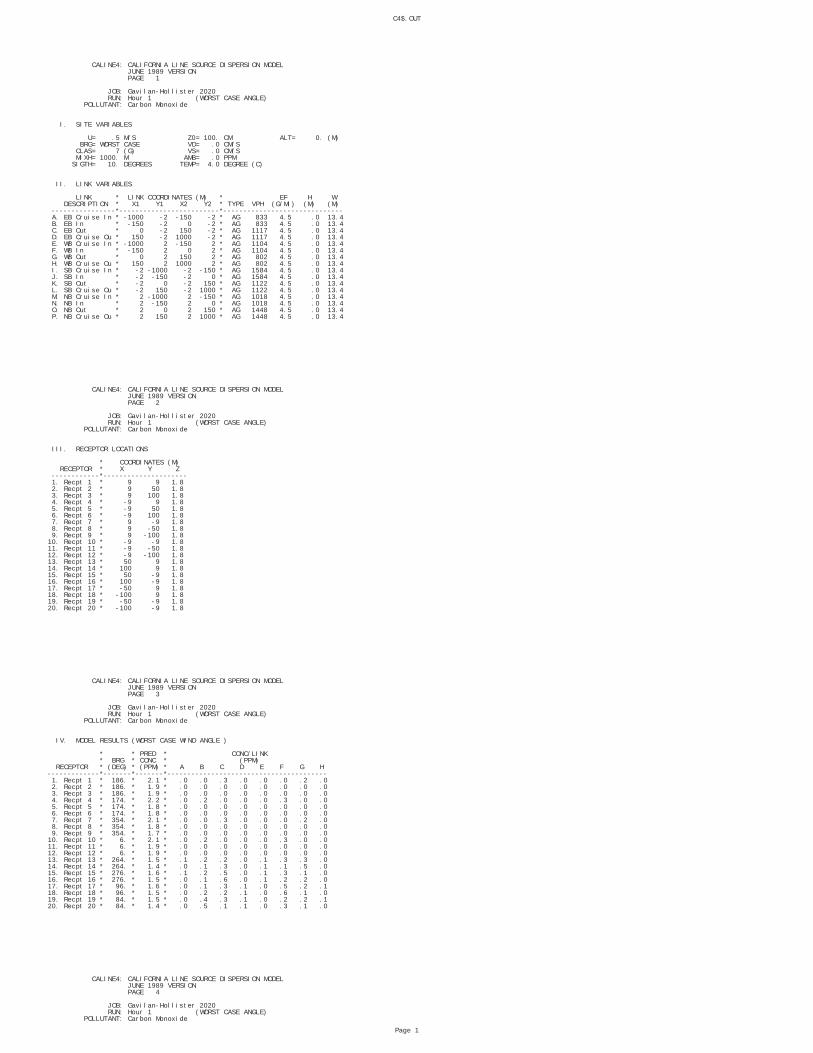
C4$.OUT
CALINE4: CALIFORNIA LINE SOURCE DISPERSION MODEL JUNE 1989 VERSION PAGE 1
JOB: Gavilan-Hollister 2020 RUN: Hour 1 (WORST CASE ANGLE) POLLUTANT: Carbon Monoxide
I. SITE VARIABLES
U= .5 M/S Z0= 100. CM ALT= 0. (M) BRG= WORST CASE VD= .0 CM/S CLAS= 7 (G) VS= .0 CM/S MIXH= 1000. M AMB= .0 PPM SIGTH= 10. DEGREES TEMP= 4.0 DEGREE (C)
II. LINK VARIABLES
LINK * LINK COORDINATES (M) * EF H W DESCRIPTION * X1 Y1 X2 Y2 * TYPE VPH (G/MI) (M) (M) ----------------*-------------------------*------------------------------ A. EB Cruise In * -1000 -2 -150 -2 * AG 833 4.5 .0 13.4 B. EB In * -150 -2 0 -2 * AG 833 4.5 .0 13.4 C. EB Out * 0 -2 150 -2 * AG 1117 4.5 .0 13.4 D. EB Cruise Ou * 150 -2 1000 -2 * AG 1117 4.5 .0 13.4 E. WB Cruise In * -1000 2 -150 2 * AG 1104 4.5 .0 13.4 F. WB In * -150 2 0 2 * AG 1104 4.5 .0 13.4 G. WB Out * 0 2 150 2 * AG 802 4.5 .0 13.4 H. WB Cruise Ou * 150 2 1000 2 * AG 802 4.5 .0 13.4 I. SB Cruise In * -2 -1000 -2 -150 * AG 1584 4.5 .0 13.4 J. SB In * -2 -150 -2 0 * AG 1584 4.5 .0 13.4 K. SB Out * -2 0 -2 150 * AG 1122 4.5 .0 13.4 L. SB Cruise Ou * -2 150 -2 1000 * AG 1122 4.5 .0 13.4 M. NB Cruise In * 2 -1000 2 -150 * AG 1018 4.5 .0 13.4 N. NB In * 2 -150 2 0 * AG 1018 4.5 .0 13.4 O. NB Out * 2 0 2 150 * AG 1448 4.5 .0 13.4 P. NB Cruise Ou * 2 150 2 1000 * AG 1448 4.5 .0 13.4
CALINE4: CALIFORNIA LINE SOURCE DISPERSION MODEL JUNE 1989 VERSION PAGE 2
JOB: Gavilan-Hollister 2020 RUN: Hour 1 (WORST CASE ANGLE) POLLUTANT: Carbon Monoxide
III. RECEPTOR LOCATIONS
* COORDINATES (M) RECEPTOR * X Y Z ------------*--------------------- 1. Recpt 1 * 9 9 1.8 2. Recpt 2 * 9 50 1.8 3. Recpt 3 * 9 100 1.8 4. Recpt 4 * -9 9 1.8 5. Recpt 5 * -9 50 1.8 6. Recpt 6 * -9 100 1.8 7. Recpt 7 * 9 -9 1.8 8. Recpt 8 * 9 -50 1.8 9. Recpt 9 * 9 -100 1.810. Recpt 10 * -9 -9 1.811. Recpt 11 * -9 -50 1.812. Recpt 12 * -9 -100 1.813. Recpt 13 * 50 9 1.814. Recpt 14 * 100 9 1.815. Recpt 15 * 50 -9 1.816. Recpt 16 * 100 -9 1.817. Recpt 17 * -50 9 1.818. Recpt 18 * -100 9 1.819. Recpt 19 * -50 -9 1.820. Recpt 20 * -100 -9 1.8
CALINE4: CALIFORNIA LINE SOURCE DISPERSION MODEL JUNE 1989 VERSION PAGE 3
JOB: Gavilan-Hollister 2020 RUN: Hour 1 (WORST CASE ANGLE) POLLUTANT: Carbon Monoxide
IV. MODEL RESULTS (WORST CASE WIND ANGLE )
* * PRED * CONC/LINK * BRG * CONC * (PPM) RECEPTOR * (DEG) * (PPM) * A B C D E F G H-------------*-------*-------*---------------------------------------- 1. Recpt 1 * 186. * 2.1 * .0 .0 .3 .0 .0 .0 .2 .0 2. Recpt 2 * 186. * 1.9 * .0 .0 .0 .0 .0 .0 .0 .0 3. Recpt 3 * 186. * 1.9 * .0 .0 .0 .0 .0 .0 .0 .0 4. Recpt 4 * 174. * 2.2 * .0 .2 .0 .0 .0 .3 .0 .0 5. Recpt 5 * 174. * 1.8 * .0 .0 .0 .0 .0 .0 .0 .0 6. Recpt 6 * 174. * 1.8 * .0 .0 .0 .0 .0 .0 .0 .0 7. Recpt 7 * 354. * 2.1 * .0 .0 .3 .0 .0 .0 .2 .0 8. Recpt 8 * 354. * 1.8 * .0 .0 .0 .0 .0 .0 .0 .0 9. Recpt 9 * 354. * 1.7 * .0 .0 .0 .0 .0 .0 .0 .010. Recpt 10 * 6. * 2.1 * .0 .2 .0 .0 .0 .3 .0 .011. Recpt 11 * 6. * 1.9 * .0 .0 .0 .0 .0 .0 .0 .012. Recpt 12 * 6. * 1.9 * .0 .0 .0 .0 .0 .0 .0 .013. Recpt 13 * 264. * 1.5 * .1 .2 .2 .0 .1 .3 .3 .014. Recpt 14 * 264. * 1.4 * .0 .1 .3 .0 .1 .1 .5 .015. Recpt 15 * 276. * 1.6 * .1 .2 .5 .0 .1 .3 .1 .016. Recpt 16 * 276. * 1.5 * .0 .1 .6 .0 .1 .2 .2 .017. Recpt 17 * 96. * 1.6 * .0 .1 .3 .1 .0 .5 .2 .118. Recpt 18 * 96. * 1.5 * .0 .2 .2 .1 .0 .6 .1 .019. Recpt 19 * 84. * 1.5 * .0 .4 .3 .1 .0 .2 .2 .120. Recpt 20 * 84. * 1.4 * .0 .5 .1 .1 .0 .3 .1 .0
CALINE4: CALIFORNIA LINE SOURCE DISPERSION MODEL JUNE 1989 VERSION PAGE 4
JOB: Gavilan-Hollister 2020 RUN: Hour 1 (WORST CASE ANGLE) POLLUTANT: Carbon Monoxide
Page 1
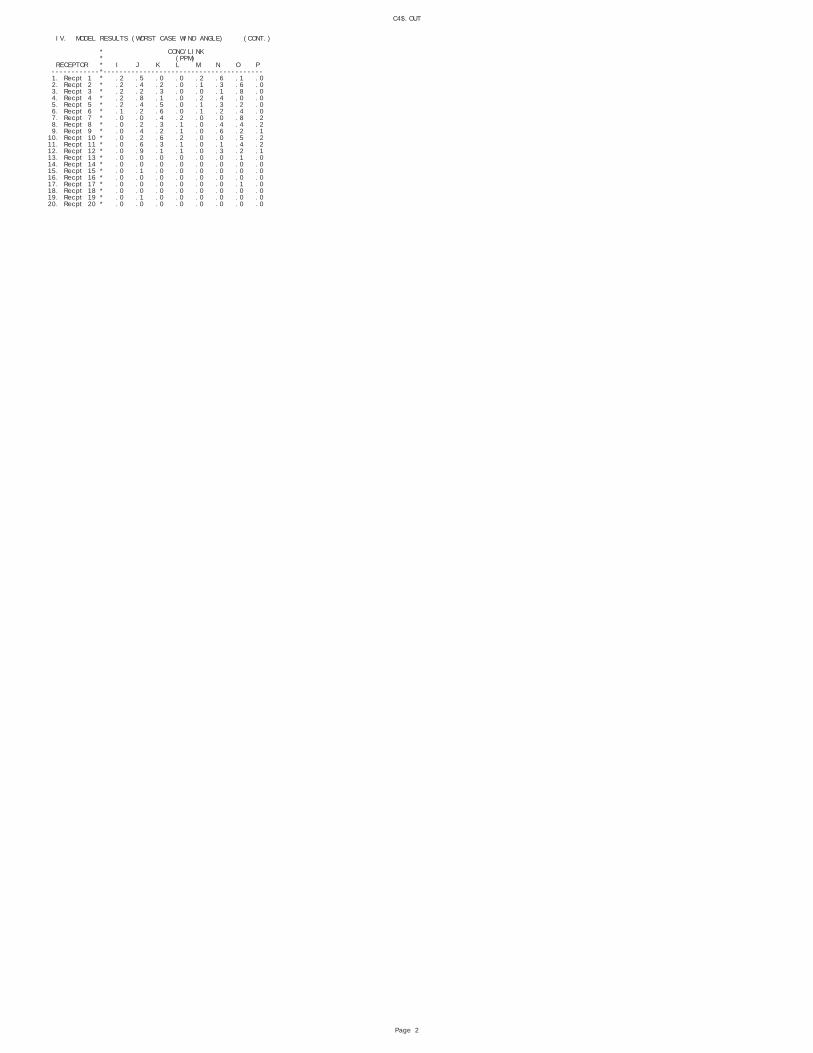
C4$.OUT
IV. MODEL RESULTS (WORST CASE WIND ANGLE) (CONT.)
* CONC/LINK * (PPM) RECEPTOR * I J K L M N O P ------------*---------------------------------------- 1. Recpt 1 * .2 .5 .0 .0 .2 .6 .1 .0 2. Recpt 2 * .2 .4 .2 .0 .1 .3 .6 .0 3. Recpt 3 * .2 .2 .3 .0 .0 .1 .8 .0 4. Recpt 4 * .2 .8 .1 .0 .2 .4 .0 .0 5. Recpt 5 * .2 .4 .5 .0 .1 .3 .2 .0 6. Recpt 6 * .1 .2 .6 .0 .1 .2 .4 .0 7. Recpt 7 * .0 .0 .4 .2 .0 .0 .8 .2 8. Recpt 8 * .0 .2 .3 .1 .0 .4 .4 .2 9. Recpt 9 * .0 .4 .2 .1 .0 .6 .2 .110. Recpt 10 * .0 .2 .6 .2 .0 .0 .5 .211. Recpt 11 * .0 .6 .3 .1 .0 .1 .4 .212. Recpt 12 * .0 .9 .1 .1 .0 .3 .2 .113. Recpt 13 * .0 .0 .0 .0 .0 .0 .1 .014. Recpt 14 * .0 .0 .0 .0 .0 .0 .0 .015. Recpt 15 * .0 .1 .0 .0 .0 .0 .0 .016. Recpt 16 * .0 .0 .0 .0 .0 .0 .0 .017. Recpt 17 * .0 .0 .0 .0 .0 .0 .1 .018. Recpt 18 * .0 .0 .0 .0 .0 .0 .0 .019. Recpt 19 * .0 .1 .0 .0 .0 .0 .0 .020. Recpt 20 * .0 .0 .0 .0 .0 .0 .0 .0
Page 2
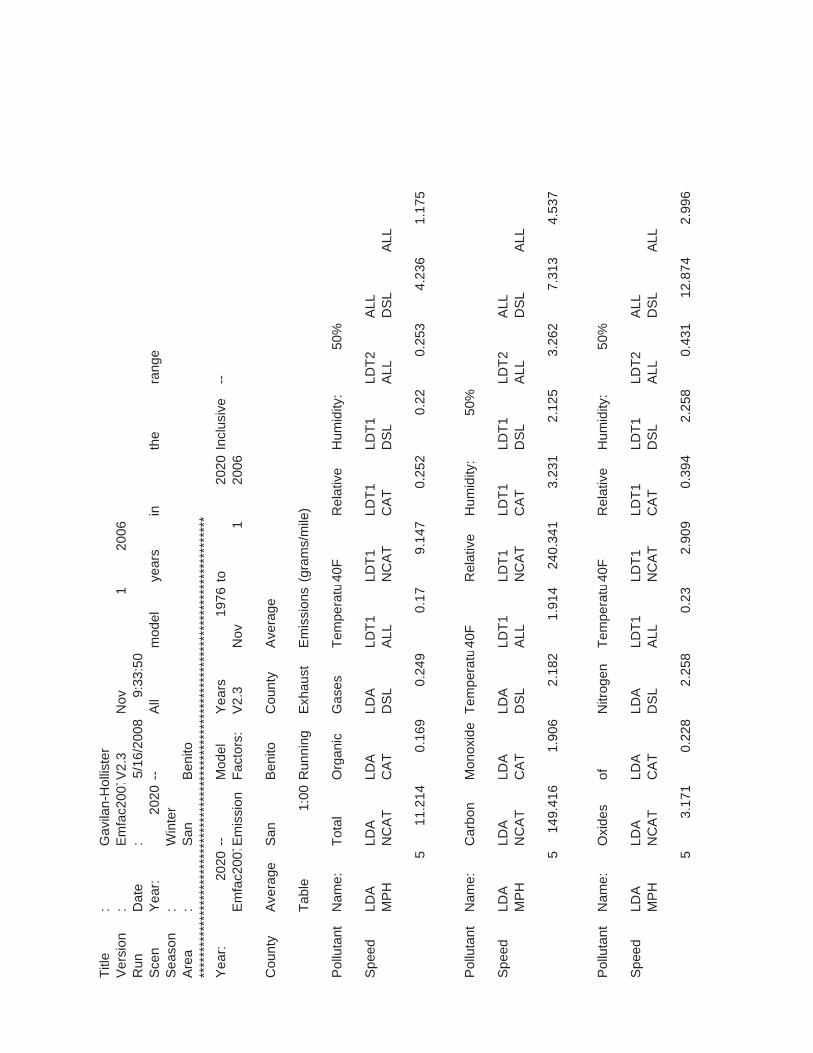
Title
:G
avila
n-H
ollis
ter
Vers
ion
:Em
fac2
007V
2.3
Nov
120
06R
unD
ate
:5/
16/2
008
9:33
:50
Scen
Year
:20
20--
All
mod
elye
ars
inth
era
nge
Seas
on:
Win
ter
Area
:Sa
nBe
nito
****
****
****
****
****
****
****
****
****
****
****
****
****
****
****
****
****
****
****
****
****
****
*Ye
ar:
2020
--M
odel
Year
s19
76to
2020
Incl
usiv
e--
Emfa
c200
7Em
issi
onFa
ctor
s:V2
.3N
ov1
2006
Cou
nty
Aver
age
San
Beni
toC
ount
yAv
erag
e
Tabl
e1:
00R
unni
ngEx
haus
tEm
issi
ons
(gra
ms/
mile
)
Pollu
tant
Nam
e:To
tal
Org
anic
Gas
esTe
mpe
rat u
40F
Rel
ativ
eH
umid
ity:
50%
Spee
dLD
ALD
ALD
ALD
ALD
T1LD
T1LD
T1LD
T1LD
T2AL
LM
PHN
CAT
CAT
DSL
ALL
NC
ATC
ATD
SLAL
LD
SLAL
L
511
.214
0.16
90.
249
0.17
9.14
70.
252
0.22
0.25
34.
236
1.17
5
Pollu
tant
Nam
e:C
arbo
nM
onox
ide
Tem
pera
t u40
FR
elat
ive
Hum
idity
:50
%
Spee
dLD
ALD
ALD
ALD
ALD
T1LD
T1LD
T1LD
T1LD
T2AL
LM
PHN
CAT
CAT
DSL
ALL
NC
ATC
ATD
SLAL
LD
SLAL
L
514
9.41
61.
906
2.18
21.
914
240.
341
3.23
12.
125
3.26
27.
313
4.53
7
Pollu
tant
Nam
e:O
xide
sof
Nitr
ogen
Tem
pera
t u40
FR
elat
ive
Hum
idity
:50
%
Spee
dLD
ALD
ALD
ALD
ALD
T1LD
T1LD
T1LD
T1LD
T2AL
LM
PHN
CAT
CAT
DSL
ALL
NC
ATC
ATD
SLAL
LD
SLAL
L
53.
171
0.22
82.
258
0.23
2.90
90.
394
2.25
80.
431
12.8
742.
996
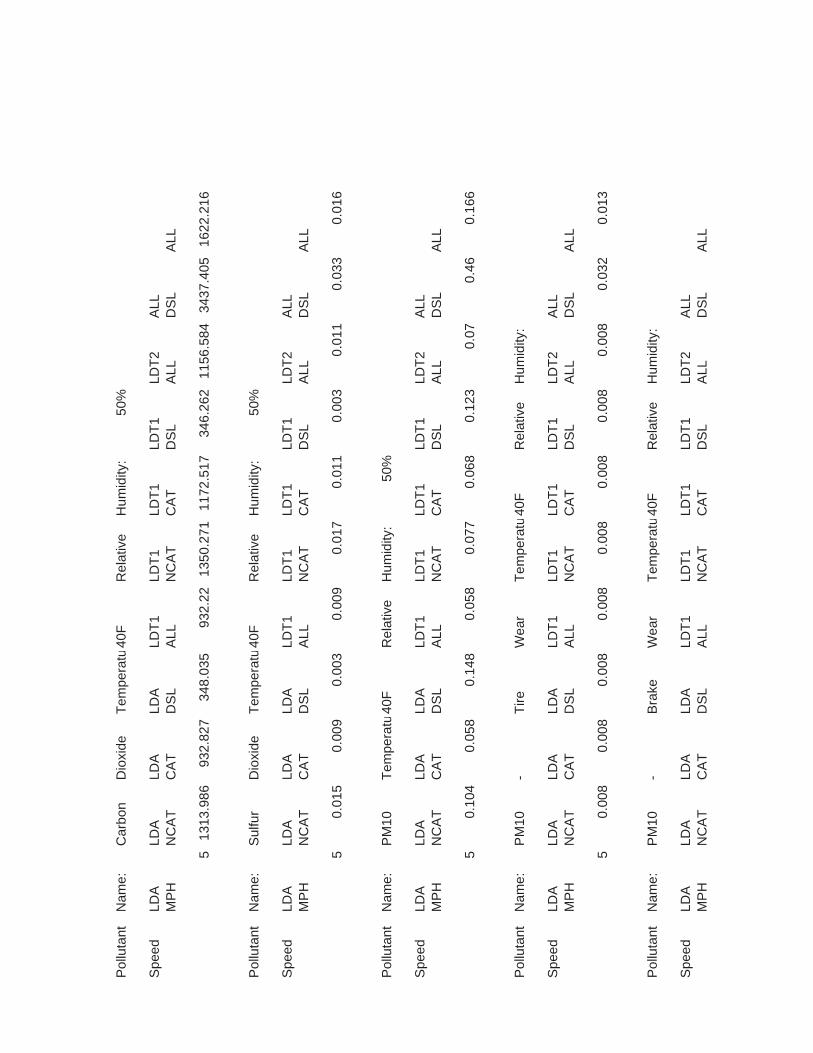
Pollu
tant
Nam
e:C
arbo
nD
ioxi
deTe
mpe
ratu
40F
Rel
ativ
eH
umid
ity:
50%
Spee
dLD
ALD
ALD
ALD
ALD
T1LD
T1LD
T1LD
T1LD
T2AL
LM
PHN
CAT
CAT
DSL
ALL
NC
ATC
ATD
SLAL
LD
SLAL
L
513
13.9
8693
2.82
734
8.03
593
2.22
1350
.271
1172
.517
346.
262
1156
.584
3437
.405
1622
.216
Pollu
tant
Nam
e:Su
lfur
Dio
xide
Tem
pera
t u40
FR
elat
ive
Hum
idity
:50
%
Spee
dLD
ALD
ALD
ALD
ALD
T1LD
T1LD
T1LD
T1LD
T2AL
LM
PHN
CAT
CAT
DSL
ALL
NC
ATC
ATD
SLAL
LD
SLAL
L
50.
015
0.00
90.
003
0.00
90.
017
0.01
10.
003
0.01
10.
033
0.01
6
Pollu
tant
Nam
e:PM
10Te
mpe
rat u
40F
Rel
ativ
eH
umid
ity:
50%
Spee
dLD
ALD
ALD
ALD
ALD
T1LD
T1LD
T1LD
T1LD
T2AL
LM
PHN
CAT
CAT
DSL
ALL
NC
ATC
ATD
SLAL
LD
SLAL
L
50.
104
0.05
80.
148
0.05
80.
077
0.06
80.
123
0.07
0.46
0.16
6
Pollu
tant
Nam
e:PM
10-
Tire
Wea
rTe
mpe
rat u
40F
Rel
ativ
eH
umid
ity:
Spee
dLD
ALD
ALD
ALD
ALD
T1LD
T1LD
T1LD
T1LD
T2AL
LM
PHN
CAT
CAT
DSL
ALL
NC
ATC
ATD
SLAL
LD
SLAL
L
50.
008
0.00
80.
008
0.00
80.
008
0.00
80.
008
0.00
80.
032
0.01
3
Pollu
tant
Nam
e:PM
10-
Brak
eW
ear
Tem
pera
t u40
FR
elat
ive
Hum
idity
:
Spee
dLD
ALD
ALD
ALD
ALD
T1LD
T1LD
T1LD
T1LD
T2AL
LM
PHN
CAT
CAT
DSL
ALL
NC
ATC
ATD
SLAL
LD
SLAL
L
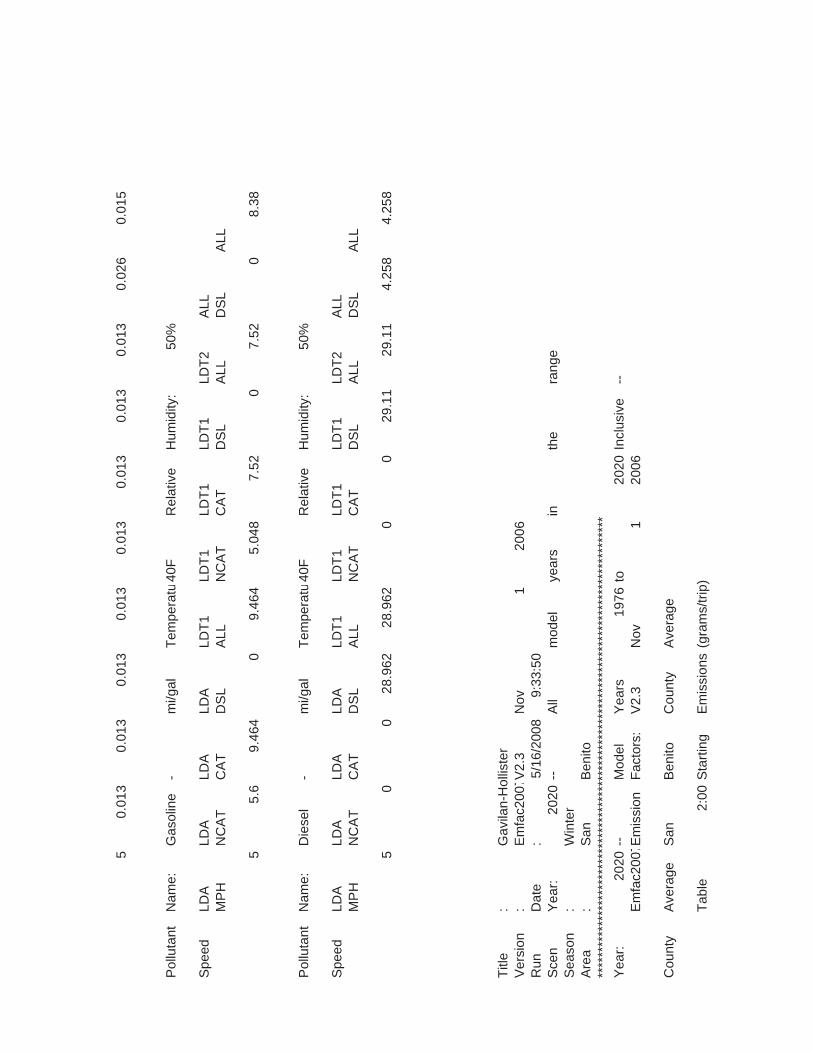
50.
013
0.01
30.
013
0.01
30.
013
0.01
30.
013
0.01
30.
026
0.01
5
Pollu
tant
Nam
e:G
asol
ine
-m
i/gal
Tem
pera
tu40
FR
elat
ive
Hum
idity
:50
%
Spee
dLD
ALD
ALD
ALD
ALD
T1LD
T1LD
T1LD
T1LD
T2AL
LM
PHN
CAT
CAT
DSL
ALL
NC
ATC
ATD
SLAL
LD
SLAL
L
55.
69.
464
09.
464
5.04
87.
520
7.52
08.
38
Pollu
tant
Nam
e:D
iese
l-
mi/g
alTe
mpe
rat u
40F
Rel
ativ
eH
umid
ity:
50%
Spee
dLD
ALD
ALD
ALD
ALD
T1LD
T1LD
T1LD
T1LD
T2AL
LM
PHN
CAT
CAT
DSL
ALL
NC
ATC
ATD
SLAL
LD
SLAL
L
50
028
.962
28.9
620
029
.11
29.1
14.
258
4.25
8
Title
:G
avila
n-H
ollis
ter
Vers
ion
:Em
fac2
007V
2.3
Nov
120
06R
unD
ate
:5/
16/2
008
9:33
:50
Scen
Year
:20
20--
All
mod
elye
ars
inth
era
nge
Seas
on:
Win
ter
Area
:Sa
nBe
nito
****
****
****
****
****
****
****
****
****
****
****
****
****
****
****
****
****
****
****
****
****
****
*Ye
ar:
2020
--M
odel
Year
s19
76to
2020
Incl
usiv
e--
Emfa
c200
7Em
issi
onFa
ctor
s:V2
.3N
ov1
2006
Cou
nty
Aver
age
San
Beni
toC
ount
yAv
erag
e
Tabl
e2:
00St
artin
gEm
issi
ons
(gra
ms/
trip)
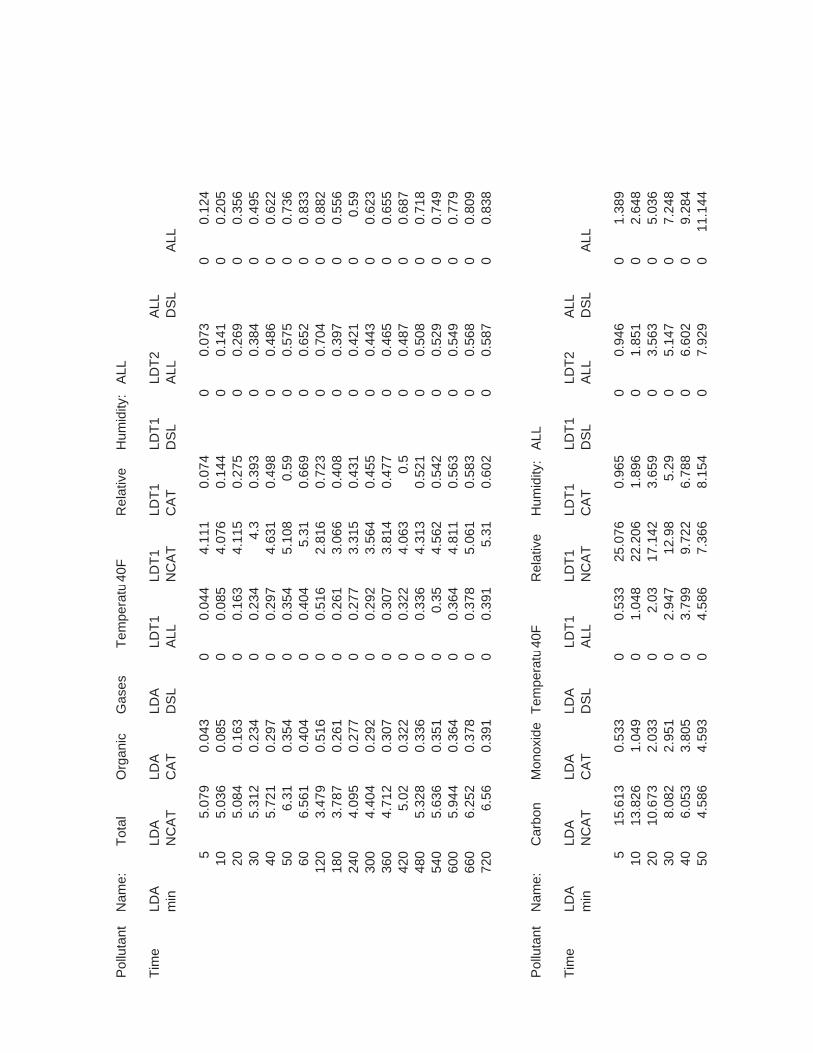
Pollu
tant
Nam
e:To
tal
Org
anic
Gas
esTe
mpe
ratu
40F
Rel
ativ
eH
umid
ity:
ALL
Tim
eLD
ALD
ALD
ALD
ALD
T1LD
T1LD
T1LD
T1LD
T2AL
Lm
inN
CAT
CAT
DSL
ALL
NC
ATC
ATD
SLAL
LD
SLAL
L
55.
079
0.04
30
0.04
44.
111
0.07
40
0.07
30
0.12
410
5.03
60.
085
00.
085
4.07
60.
144
00.
141
00.
205
205.
084
0.16
30
0.16
34.
115
0.27
50
0.26
90
0.35
630
5.31
20.
234
00.
234
4.3
0.39
30
0.38
40
0.49
540
5.72
10.
297
00.
297
4.63
10.
498
00.
486
00.
622
506.
310.
354
00.
354
5.10
80.
590
0.57
50
0.73
660
6.56
10.
404
00.
404
5.31
0.66
90
0.65
20
0.83
312
03.
479
0.51
60
0.51
62.
816
0.72
30
0.70
40
0.88
218
03.
787
0.26
10
0.26
13.
066
0.40
80
0.39
70
0.55
624
04.
095
0.27
70
0.27
73.
315
0.43
10
0.42
10
0.59
300
4.40
40.
292
00.
292
3.56
40.
455
00.
443
00.
623
360
4.71
20.
307
00.
307
3.81
40.
477
00.
465
00.
655
420
5.02
0.32
20
0.32
24.
063
0.5
00.
487
00.
687
480
5.32
80.
336
00.
336
4.31
30.
521
00.
508
00.
718
540
5.63
60.
351
00.
354.
562
0.54
20
0.52
90
0.74
960
05.
944
0.36
40
0.36
44.
811
0.56
30
0.54
90
0.77
966
06.
252
0.37
80
0.37
85.
061
0.58
30
0.56
80
0.80
972
06.
560.
391
00.
391
5.31
0.60
20
0.58
70
0.83
8
Pollu
tant
Nam
e:C
arbo
nM
onox
ide
Tem
pera
t u40
FR
elat
ive
Hum
idity
:AL
L
Tim
eLD
ALD
ALD
ALD
ALD
T1LD
T1LD
T1LD
T1LD
T2AL
Lm
inN
CAT
CAT
DSL
ALL
NC
ATC
ATD
SLAL
LD
SLAL
L
515
.613
0.53
30
0.53
325
.076
0.96
50
0.94
60
1.38
910
13.8
261.
049
01.
048
22.2
061.
896
01.
851
02.
648
2010
.673
2.03
30
2.03
17.1
423.
659
03.
563
05.
036
308.
082
2.95
10
2.94
712
.98
5.29
05.
147
07.
248
406.
053
3.80
50
3.79
99.
722
6.78
80
6.60
20
9.28
450
4.58
64.
593
04.
586
7.36
68.
154
07.
929
011
.144
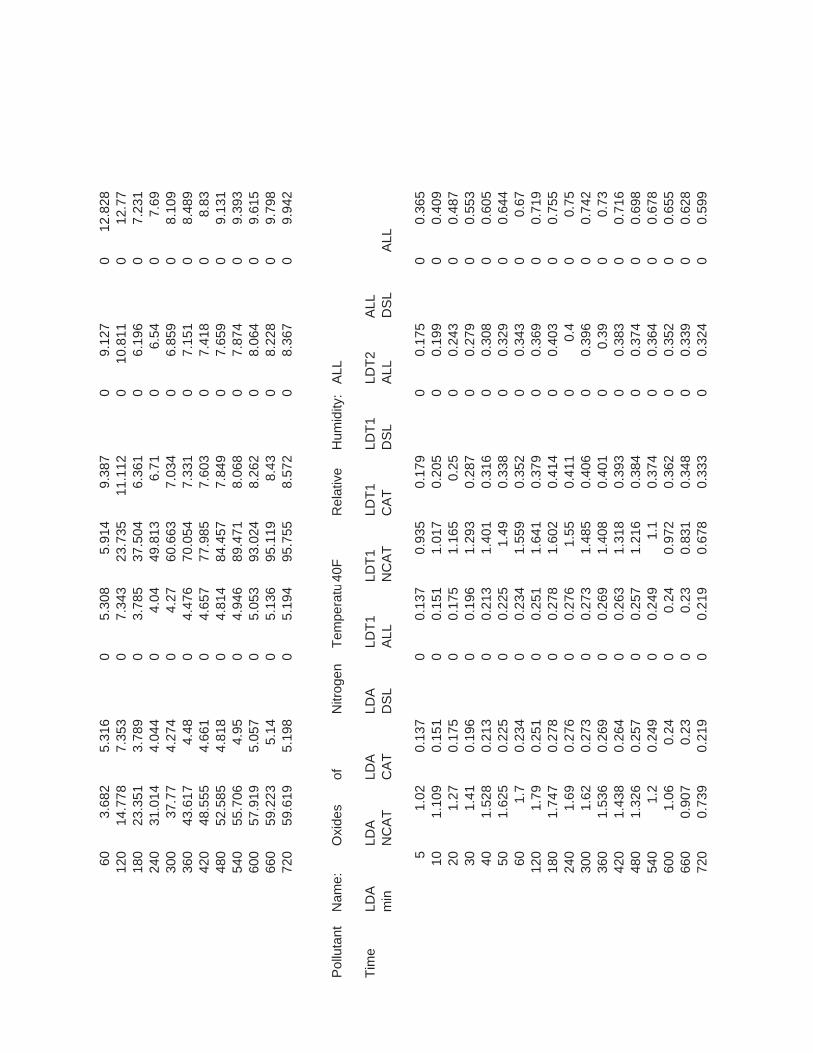
603.
682
5.31
60
5.30
85.
914
9.38
70
9.12
70
12.8
2812
014
.778
7.35
30
7.34
323
.735
11.1
120
10.8
110
12.7
718
023
.351
3.78
90
3.78
537
.504
6.36
10
6.19
60
7.23
124
031
.014
4.04
40
4.04
49.8
136.
710
6.54
07.
6930
037
.77
4.27
40
4.27
60.6
637.
034
06.
859
08.
109
360
43.6
174.
480
4.47
670
.054
7.33
10
7.15
10
8.48
942
048
.555
4.66
10
4.65
777
.985
7.60
30
7.41
80
8.83
480
52.5
854.
818
04.
814
84.4
577.
849
07.
659
09.
131
540
55.7
064.
950
4.94
689
.471
8.06
80
7.87
40
9.39
360
057
.919
5.05
70
5.05
393
.024
8.26
20
8.06
40
9.61
566
059
.223
5.14
05.
136
95.1
198.
430
8.22
80
9.79
872
059
.619
5.19
80
5.19
495
.755
8.57
20
8.36
70
9.94
2
Pollu
tant
Nam
e:O
xide
sof
Nitr
ogen
Tem
pera
t u40
FR
elat
ive
Hum
idity
:AL
L
Tim
eLD
ALD
ALD
ALD
ALD
T1LD
T1LD
T1LD
T1LD
T2AL
Lm
inN
CAT
CAT
DSL
ALL
NC
ATC
ATD
SLAL
LD
SLAL
L
51.
020.
137
00.
137
0.93
50.
179
00.
175
00.
365
101.
109
0.15
10
0.15
11.
017
0.20
50
0.19
90
0.40
920
1.27
0.17
50
0.17
51.
165
0.25
00.
243
00.
487
301.
410.
196
00.
196
1.29
30.
287
00.
279
00.
553
401.
528
0.21
30
0.21
31.
401
0.31
60
0.30
80
0.60
550
1.62
50.
225
00.
225
1.49
0.33
80
0.32
90
0.64
460
1.7
0.23
40
0.23
41.
559
0.35
20
0.34
30
0.67
120
1.79
0.25
10
0.25
11.
641
0.37
90
0.36
90
0.71
918
01.
747
0.27
80
0.27
81.
602
0.41
40
0.40
30
0.75
524
01.
690.
276
00.
276
1.55
0.41
10
0.4
00.
7530
01.
620.
273
00.
273
1.48
50.
406
00.
396
00.
742
360
1.53
60.
269
00.
269
1.40
80.
401
00.
390
0.73
420
1.43
80.
264
00.
263
1.31
80.
393
00.
383
00.
716
480
1.32
60.
257
00.
257
1.21
60.
384
00.
374
00.
698
540
1.2
0.24
90
0.24
91.
10.
374
00.
364
00.
678
600
1.06
0.24
00.
240.
972
0.36
20
0.35
20
0.65
566
00.
907
0.23
00.
230.
831
0.34
80
0.33
90
0.62
872
00.
739
0.21
90
0.21
90.
678
0.33
30
0.32
40
0.59
9
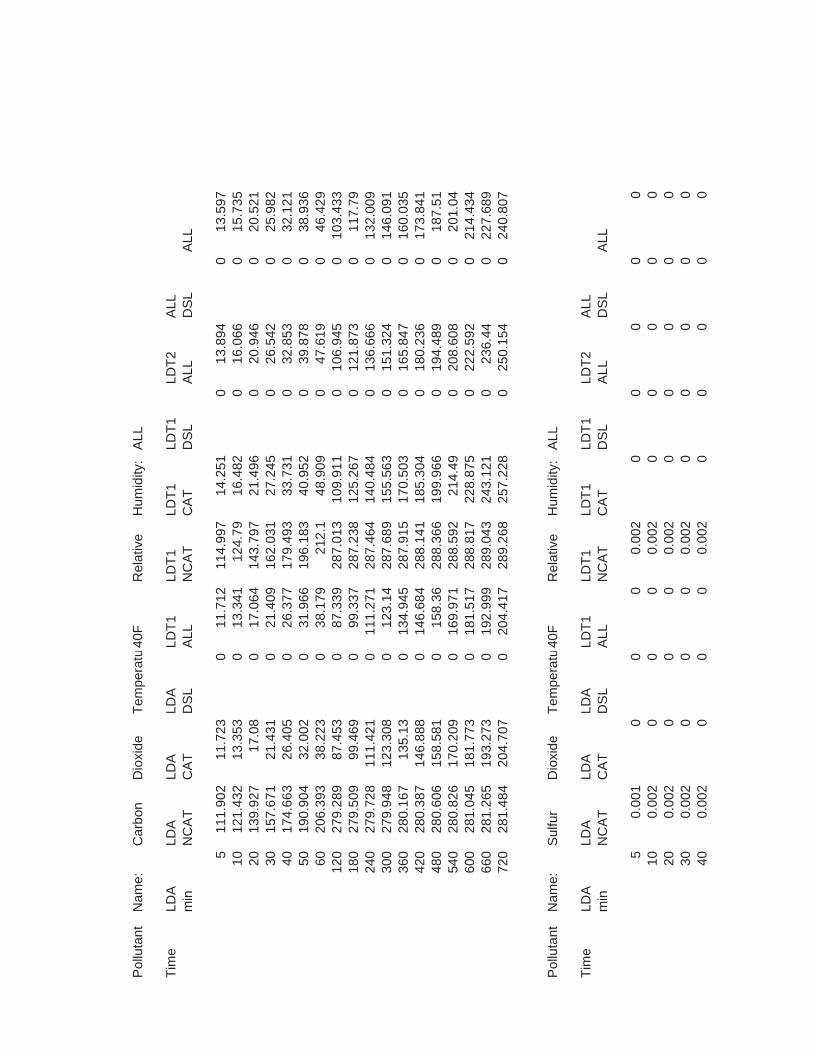
Pollu
tant
Nam
e:C
arbo
nD
ioxi
deTe
mpe
ratu
40F
Rel
ativ
eH
umid
ity:
ALL
Tim
eLD
ALD
ALD
ALD
ALD
T1LD
T1LD
T1LD
T1LD
T2AL
Lm
inN
CAT
CAT
DSL
ALL
NC
ATC
ATD
SLAL
LD
SLAL
L
511
1.90
211
.723
011
.712
114.
997
14.2
510
13.8
940
13.5
9710
121.
432
13.3
530
13.3
4112
4.79
16.4
820
16.0
660
15.7
3520
139.
927
17.0
80
17.0
6414
3.79
721
.496
020
.946
020
.521
3015
7.67
121
.431
021
.409
162.
031
27.2
450
26.5
420
25.9
8240
174.
663
26.4
050
26.3
7717
9.49
333
.731
032
.853
032
.121
5019
0.90
432
.002
031
.966
196.
183
40.9
520
39.8
780
38.9
3660
206.
393
38.2
230
38.1
7921
2.1
48.9
090
47.6
190
46.4
2912
027
9.28
987
.453
087
.339
287.
013
109.
911
010
6.94
50
103.
433
180
279.
509
99.4
690
99.3
3728
7.23
812
5.26
70
121.
873
011
7.79
240
279.
728
111.
421
011
1.27
128
7.46
414
0.48
40
136.
666
013
2.00
930
027
9.94
812
3.30
80
123.
1428
7.68
915
5.56
30
151.
324
014
6.09
136
028
0.16
713
5.13
013
4.94
528
7.91
517
0.50
30
165.
847
016
0.03
542
028
0.38
714
6.88
80
146.
684
288.
141
185.
304
018
0.23
60
173.
841
480
280.
606
158.
581
015
8.36
288.
366
199.
966
019
4.48
90
187.
5154
028
0.82
617
0.20
90
169.
971
288.
592
214.
490
208.
608
020
1.04
600
281.
045
181.
773
018
1.51
728
8.81
722
8.87
50
222.
592
021
4.43
466
028
1.26
519
3.27
30
192.
999
289.
043
243.
121
023
6.44
022
7.68
972
028
1.48
420
4.70
70
204.
417
289.
268
257.
228
025
0.15
40
240.
807
Pollu
tant
Nam
e:Su
lfur
Dio
xide
Tem
pera
t u40
FR
elat
ive
Hum
idity
:AL
L
Tim
eLD
ALD
ALD
ALD
ALD
T1LD
T1LD
T1LD
T1LD
T2AL
Lm
inN
CAT
CAT
DSL
ALL
NC
ATC
ATD
SLAL
LD
SLAL
L
50.
001
00
00.
002
00
00
010
0.00
20
00
0.00
20
00
00
200.
002
00
00.
002
00
00
030
0.00
20
00
0.00
20
00
00
400.
002
00
00.
002
00
00
0
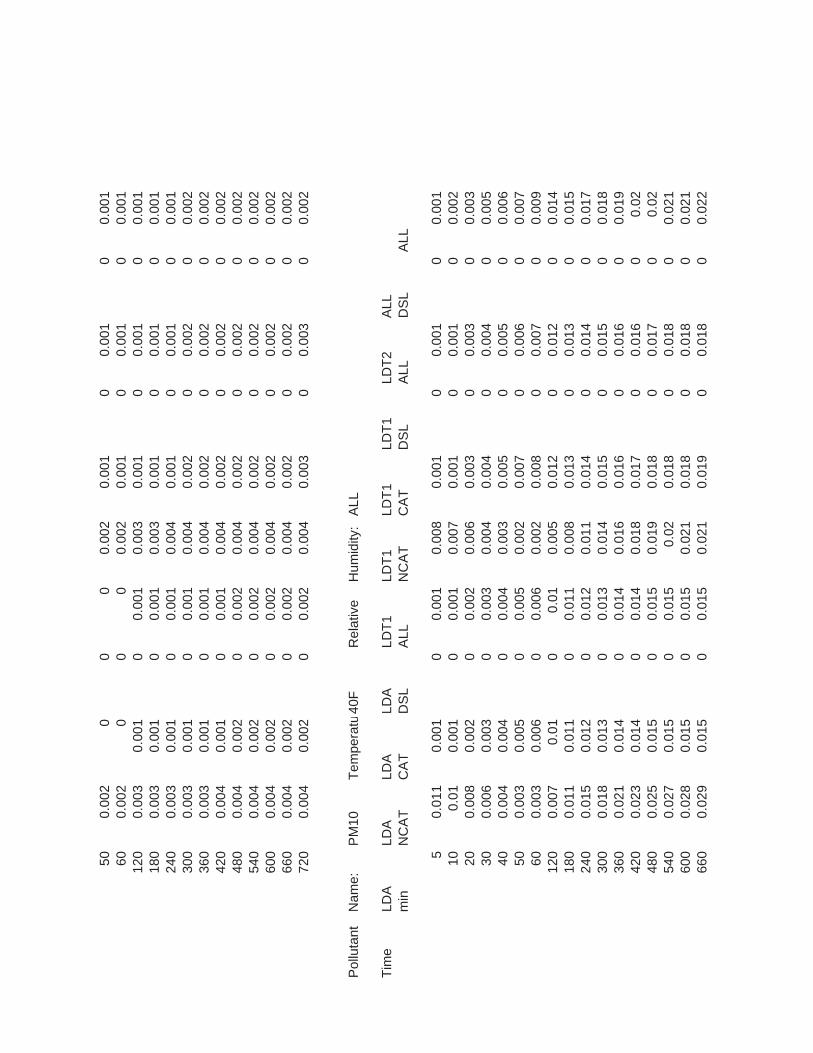
500.
002
00
00.
002
0.00
10
0.00
10
0.00
160
0.00
20
00
0.00
20.
001
00.
001
00.
001
120
0.00
30.
001
00.
001
0.00
30.
001
00.
001
00.
001
180
0.00
30.
001
00.
001
0.00
30.
001
00.
001
00.
001
240
0.00
30.
001
00.
001
0.00
40.
001
00.
001
00.
001
300
0.00
30.
001
00.
001
0.00
40.
002
00.
002
00.
002
360
0.00
30.
001
00.
001
0.00
40.
002
00.
002
00.
002
420
0.00
40.
001
00.
001
0.00
40.
002
00.
002
00.
002
480
0.00
40.
002
00.
002
0.00
40.
002
00.
002
00.
002
540
0.00
40.
002
00.
002
0.00
40.
002
00.
002
00.
002
600
0.00
40.
002
00.
002
0.00
40.
002
00.
002
00.
002
660
0.00
40.
002
00.
002
0.00
40.
002
00.
002
00.
002
720
0.00
40.
002
00.
002
0.00
40.
003
00.
003
00.
002
Pollu
tant
Nam
e:PM
10Te
mpe
rat u
40F
Rel
ativ
eH
umid
ity:
ALL
Tim
eLD
ALD
ALD
ALD
ALD
T1LD
T1LD
T1LD
T1LD
T2AL
Lm
inN
CAT
CAT
DSL
ALL
NC
ATC
ATD
SLAL
LD
SLAL
L
50.
011
0.00
10
0.00
10.
008
0.00
10
0.00
10
0.00
110
0.01
0.00
10
0.00
10.
007
0.00
10
0.00
10
0.00
220
0.00
80.
002
00.
002
0.00
60.
003
00.
003
00.
003
300.
006
0.00
30
0.00
30.
004
0.00
40
0.00
40
0.00
540
0.00
40.
004
00.
004
0.00
30.
005
00.
005
00.
006
500.
003
0.00
50
0.00
50.
002
0.00
70
0.00
60
0.00
760
0.00
30.
006
00.
006
0.00
20.
008
00.
007
00.
009
120
0.00
70.
010
0.01
0.00
50.
012
00.
012
00.
014
180
0.01
10.
011
00.
011
0.00
80.
013
00.
013
00.
015
240
0.01
50.
012
00.
012
0.01
10.
014
00.
014
00.
017
300
0.01
80.
013
00.
013
0.01
40.
015
00.
015
00.
018
360
0.02
10.
014
00.
014
0.01
60.
016
00.
016
00.
019
420
0.02
30.
014
00.
014
0.01
80.
017
00.
016
00.
0248
00.
025
0.01
50
0.01
50.
019
0.01
80
0.01
70
0.02
540
0.02
70.
015
00.
015
0.02
0.01
80
0.01
80
0.02
160
00.
028
0.01
50
0.01
50.
021
0.01
80
0.01
80
0.02
166
00.
029
0.01
50
0.01
50.
021
0.01
90
0.01
80
0.02
2
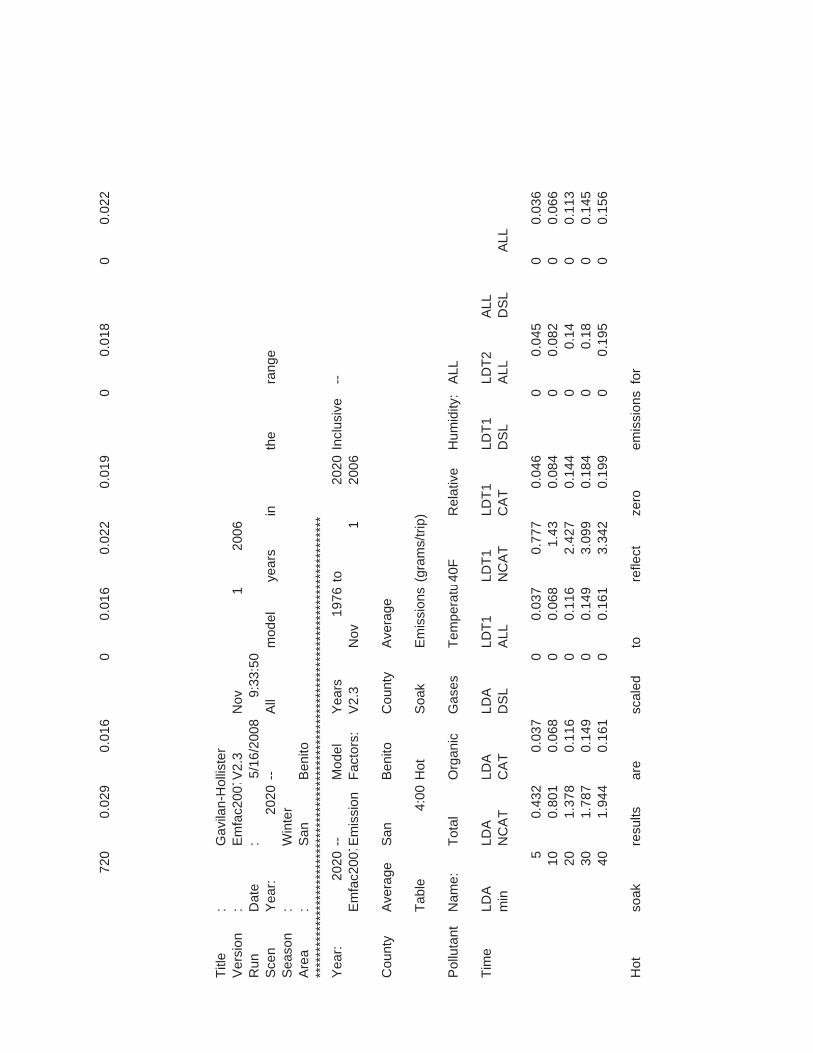
720
0.02
90.
016
00.
016
0.02
20.
019
00.
018
00.
022
Title
:G
avila
n-H
ollis
ter
Vers
ion
:Em
fac2
007V
2.3
Nov
120
06R
unD
ate
:5/
16/2
008
9:33
:50
Scen
Year
:20
20--
All
mod
elye
ars
inth
era
nge
Seas
on:
Win
ter
Area
:Sa
nBe
nito
****
****
****
****
****
****
****
****
****
****
****
****
****
****
****
****
****
****
****
****
****
****
*Ye
ar:
2020
--M
odel
Year
s19
76to
2020
Incl
usiv
e--
Emfa
c200
7Em
issi
onFa
ctor
s:V2
.3N
ov1
2006
Cou
nty
Aver
age
San
Beni
toC
ount
yAv
erag
e
Tabl
e4:
00H
otSo
akEm
issi
ons
(gra
ms/
trip)
Pollu
tant
Nam
e:To
tal
Org
anic
Gas
esTe
mpe
rat u
40F
Rel
ativ
eH
umid
ity:
ALL
Tim
eLD
ALD
ALD
ALD
ALD
T1LD
T1LD
T1LD
T1LD
T2AL
Lm
inN
CAT
CAT
DSL
ALL
NC
ATC
ATD
SLAL
LD
SLAL
L
50.
432
0.03
70
0.03
70.
777
0.04
60
0.04
50
0.03
610
0.80
10.
068
00.
068
1.43
0.08
40
0.08
20
0.06
620
1.37
80.
116
00.
116
2.42
70.
144
00.
140
0.11
330
1.78
70.
149
00.
149
3.09
90.
184
00.
180
0.14
540
1.94
40.
161
00.
161
3.34
20.
199
00.
195
00.
156
Hot
soak
resu
ltsar
esc
aled
tore
flect
zero
emis
sion
sfo
r
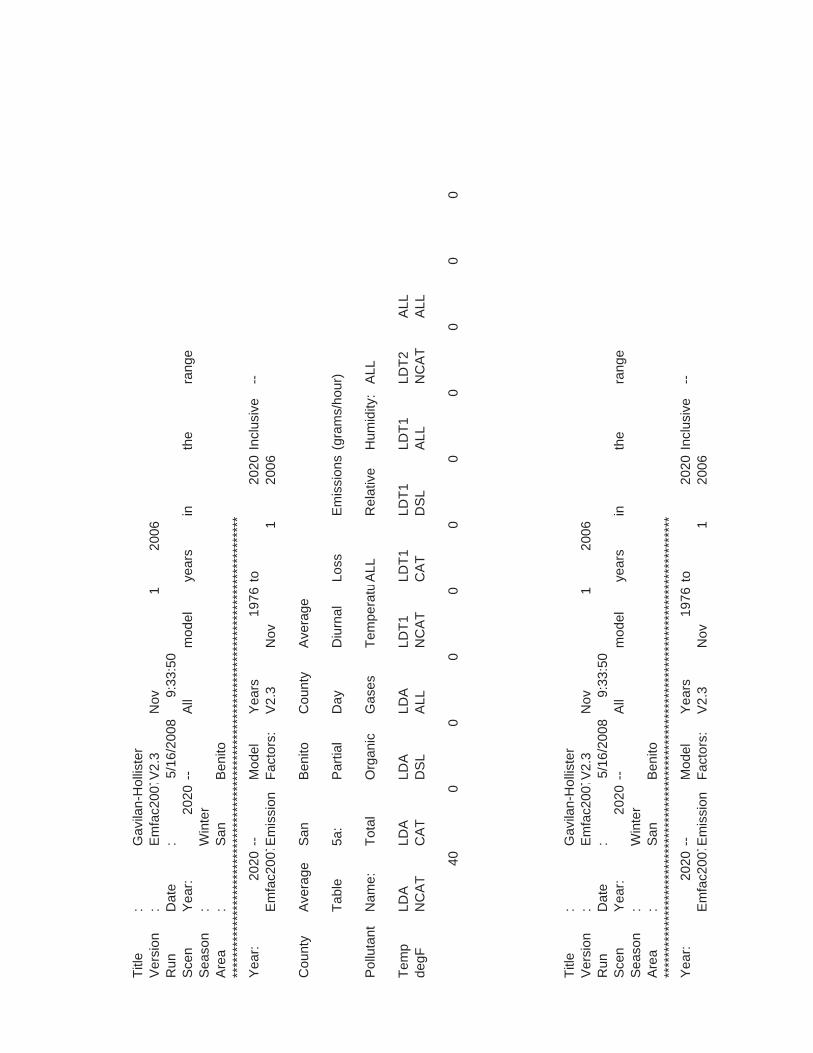
Title
:G
avila
n-H
ollis
ter
Vers
ion
:Em
fac2
007V
2.3
Nov
120
06R
unD
ate
:5/
16/2
008
9:33
:50
Scen
Year
:20
20--
All
mod
elye
ars
inth
era
nge
Seas
on:
Win
ter
Area
:Sa
nBe
nito
****
****
****
****
****
****
****
****
****
****
****
****
****
****
****
****
****
****
****
****
****
****
*Ye
ar:
2020
--M
odel
Year
s19
76to
2020
Incl
usiv
e--
Emfa
c200
7Em
issi
onFa
ctor
s:V2
.3N
ov1
2006
Cou
nty
Aver
age
San
Beni
toC
ount
yAv
erag
e
Tabl
e5a
:Pa
rtial
Day
Diu
rnal
Loss
Emis
sion
s(g
ram
s/ho
ur)
Pollu
tant
Nam
e:To
tal
Org
anic
Gas
esTe
mpe
rat u
ALL
Rel
ativ
eH
umid
ity:
ALL
Tem
pLD
ALD
ALD
ALD
ALD
T1LD
T1LD
T1LD
T1LD
T2AL
Lde
gFN
CAT
CAT
DSL
ALL
NC
ATC
ATD
SLAL
LN
CAT
ALL
400
00
00
00
00
0
Title
:G
avila
n-H
ollis
ter
Vers
ion
:Em
fac2
007V
2.3
Nov
120
06R
unD
ate
:5/
16/2
008
9:33
:50
Scen
Year
:20
20--
All
mod
elye
ars
inth
era
nge
Seas
on:
Win
ter
Area
:Sa
nBe
nito
****
****
****
****
****
****
****
****
****
****
****
****
****
****
****
****
****
****
****
****
****
****
*Ye
ar:
2020
--M
odel
Year
s19
76to
2020
Incl
usiv
e--
Emfa
c200
7Em
issi
onFa
ctor
s:V2
.3N
ov1
2006
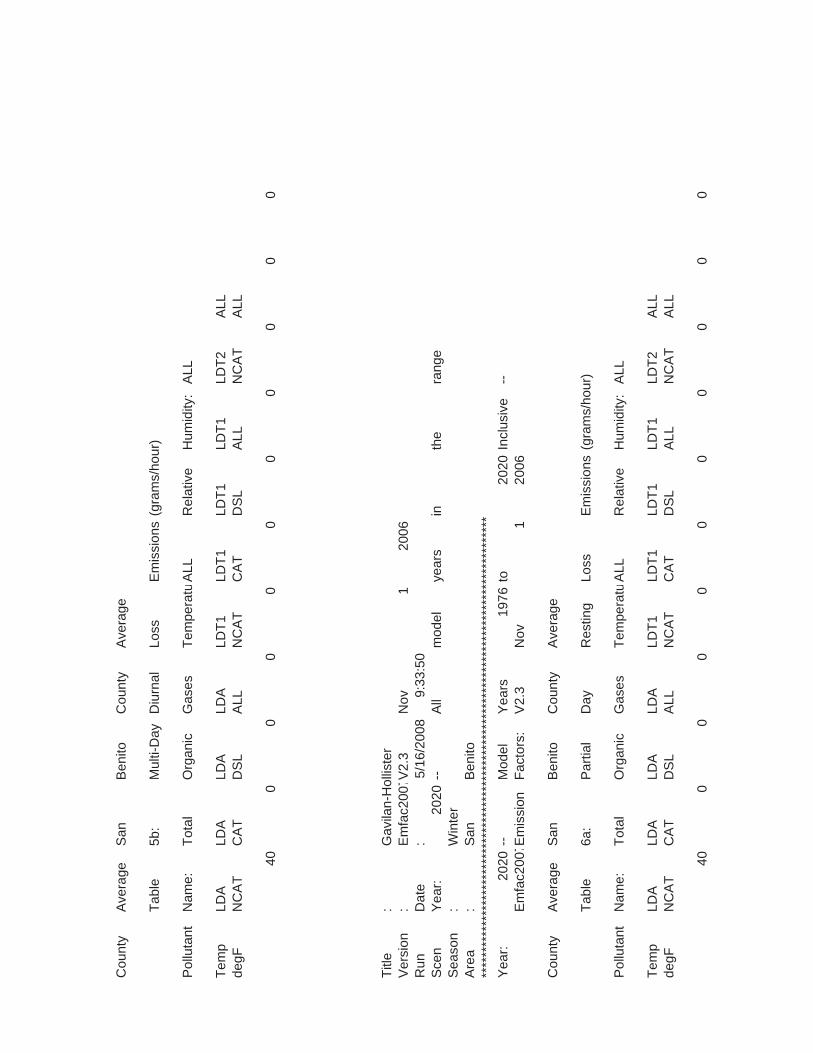
Cou
nty
Aver
age
San
Beni
toC
ount
yAv
erag
e
Tabl
e5b
:M
ulti-
Day
Diu
rnal
Loss
Emis
sion
s(g
ram
s/ho
ur)
Pollu
tant
Nam
e:To
tal
Org
anic
Gas
esTe
mpe
rat u
ALL
Rel
ativ
eH
umid
ity:
ALL
Tem
pLD
ALD
ALD
ALD
ALD
T1LD
T1LD
T1LD
T1LD
T2AL
Lde
gFN
CAT
CAT
DSL
ALL
NC
ATC
ATD
SLAL
LN
CAT
ALL
400
00
00
00
00
0
Title
:G
avila
n-H
ollis
ter
Vers
ion
:Em
fac2
007V
2.3
Nov
120
06R
unD
ate
:5/
16/2
008
9:33
:50
Scen
Year
:20
20--
All
mod
elye
ars
inth
era
nge
Seas
on:
Win
ter
Area
:Sa
nBe
nito
****
****
****
****
****
****
****
****
****
****
****
****
****
****
****
****
****
****
****
****
****
****
*Ye
ar:
2020
--M
odel
Year
s19
76to
2020
Incl
usiv
e--
Emfa
c200
7Em
issi
onFa
ctor
s:V2
.3N
ov1
2006
Cou
nty
Aver
age
San
Beni
toC
ount
yAv
erag
e
Tabl
e6a
:Pa
rtial
Day
Res
ting
Loss
Emis
sion
s(g
ram
s/ho
ur)
Pollu
tant
Nam
e:To
tal
Org
anic
Gas
esTe
mpe
rat u
ALL
Rel
ativ
eH
umid
ity:
ALL
Tem
pLD
ALD
ALD
ALD
ALD
T1LD
T1LD
T1LD
T1LD
T2AL
Lde
gFN
CAT
CAT
DSL
ALL
NC
ATC
ATD
SLAL
LN
CAT
ALL
400
00
00
00
00
0
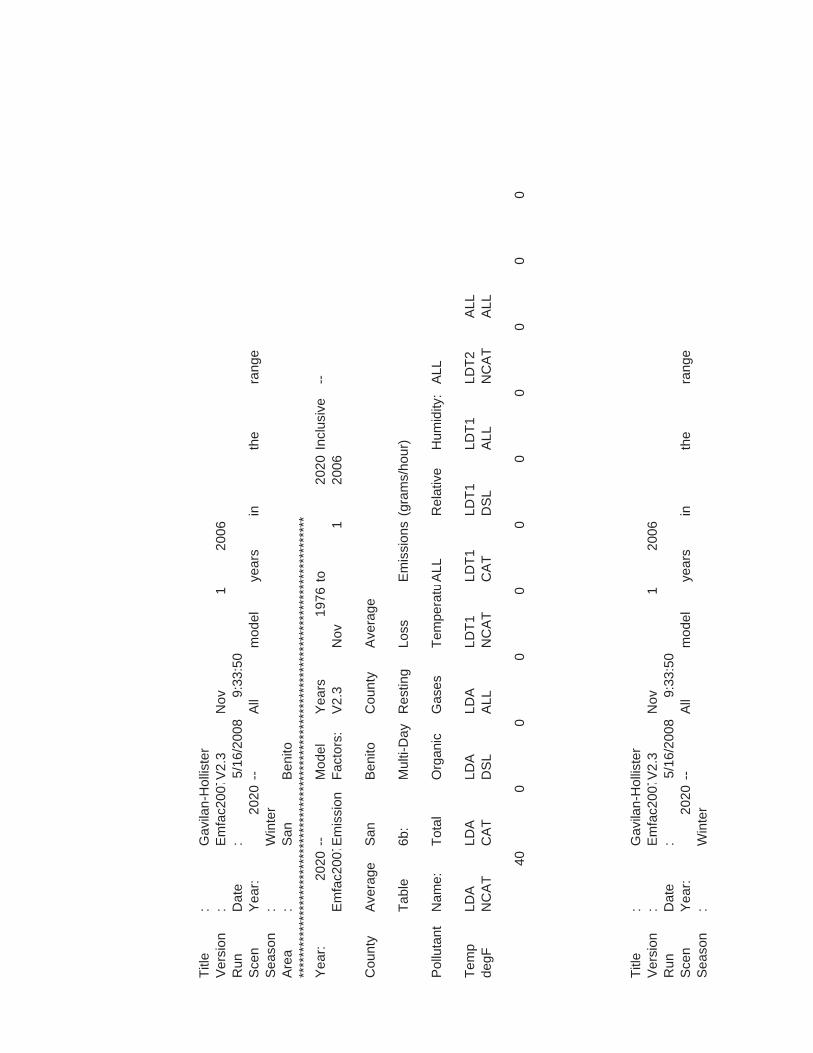
Title
:G
avila
n-H
ollis
ter
Vers
ion
:Em
fac2
007V
2.3
Nov
120
06R
unD
ate
:5/
16/2
008
9:33
:50
Scen
Year
:20
20--
All
mod
elye
ars
inth
era
nge
Seas
on:
Win
ter
Area
:Sa
nBe
nito
****
****
****
****
****
****
****
****
****
****
****
****
****
****
****
****
****
****
****
****
****
****
*Ye
ar:
2020
--M
odel
Year
s19
76to
2020
Incl
usiv
e--
Emfa
c200
7Em
issi
onFa
ctor
s:V2
.3N
ov1
2006
Cou
nty
Aver
age
San
Beni
toC
ount
yAv
erag
e
Tabl
e6b
:M
ulti-
Day
Res
ting
Loss
Emis
sion
s(g
ram
s/ho
ur)
Pollu
tant
Nam
e:To
tal
Org
anic
Gas
esTe
mpe
rat u
ALL
Rel
ativ
eH
umid
ity:
ALL
Tem
pLD
ALD
ALD
ALD
ALD
T1LD
T1LD
T1LD
T1LD
T2AL
Lde
gFN
CAT
CAT
DSL
ALL
NC
ATC
ATD
SLAL
LN
CAT
ALL
400
00
00
00
00
0
Title
:G
avila
n-H
ollis
ter
Vers
ion
:Em
fac2
007V
2.3
Nov
120
06R
unD
ate
:5/
16/2
008
9:33
:50
Scen
Year
:20
20--
All
mod
elye
ars
inth
era
nge
Seas
on:
Win
ter
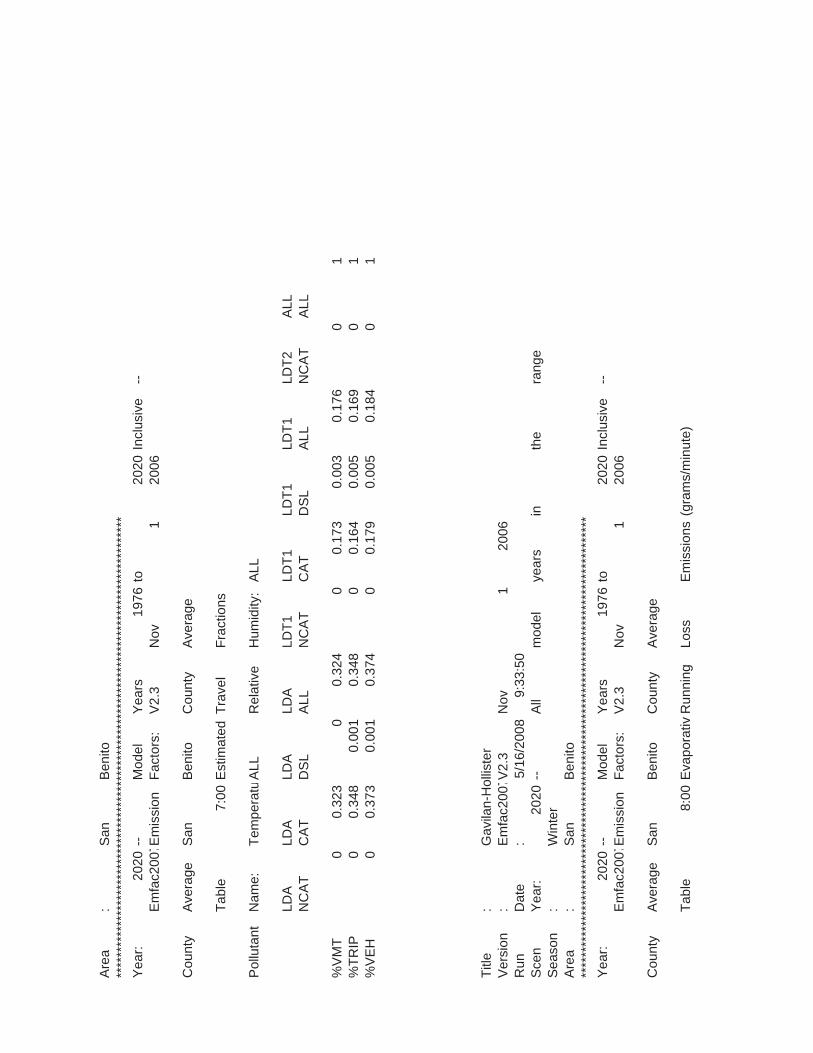
Area
:Sa
nBe
nito
****
****
****
****
****
****
****
****
****
****
****
****
****
****
****
****
****
****
****
****
****
****
*Ye
ar:
2020
--M
odel
Year
s19
76to
2020
Incl
usiv
e--
Emfa
c200
7Em
issi
onFa
ctor
s:V2
.3N
ov1
2006
Cou
nty
Aver
age
San
Beni
toC
ount
yAv
erag
e
Tabl
e7:
00Es
timat
edTr
avel
Frac
tions
Pollu
tant
Nam
e:Te
mpe
rat u
ALL
Rel
ativ
eH
umid
ity:
ALL
LDA
LDA
LDA
LDA
LDT1
LDT1
LDT1
LDT1
LDT2
ALL
NC
ATC
ATD
SLAL
LN
CAT
CAT
DSL
ALL
NC
ATAL
L
%VM
T0
0.32
30
0.32
40
0.17
30.
003
0.17
60
1%
TRIP
00.
348
0.00
10.
348
00.
164
0.00
50.
169
01
%VE
H0
0.37
30.
001
0.37
40
0.17
90.
005
0.18
40
1
Title
:G
avila
n-H
ollis
ter
Vers
ion
:Em
fac2
007V
2.3
Nov
120
06R
unD
ate
:5/
16/2
008
9:33
:50
Scen
Year
:20
20--
All
mod
elye
ars
inth
era
nge
Seas
on:
Win
ter
Area
:Sa
nBe
nito
****
****
****
****
****
****
****
****
****
****
****
****
****
****
****
****
****
****
****
****
****
****
*Ye
ar:
2020
--M
odel
Year
s19
76to
2020
Incl
usiv
e--
Emfa
c200
7Em
issi
onFa
ctor
s:V2
.3N
ov1
2006
Cou
nty
Aver
age
San
Beni
toC
ount
yAv
erag
e
Tabl
e8:
00Ev
apor
ati v
Run
ning
Loss
Emis
sion
s(g
ram
s/m
inut
e)
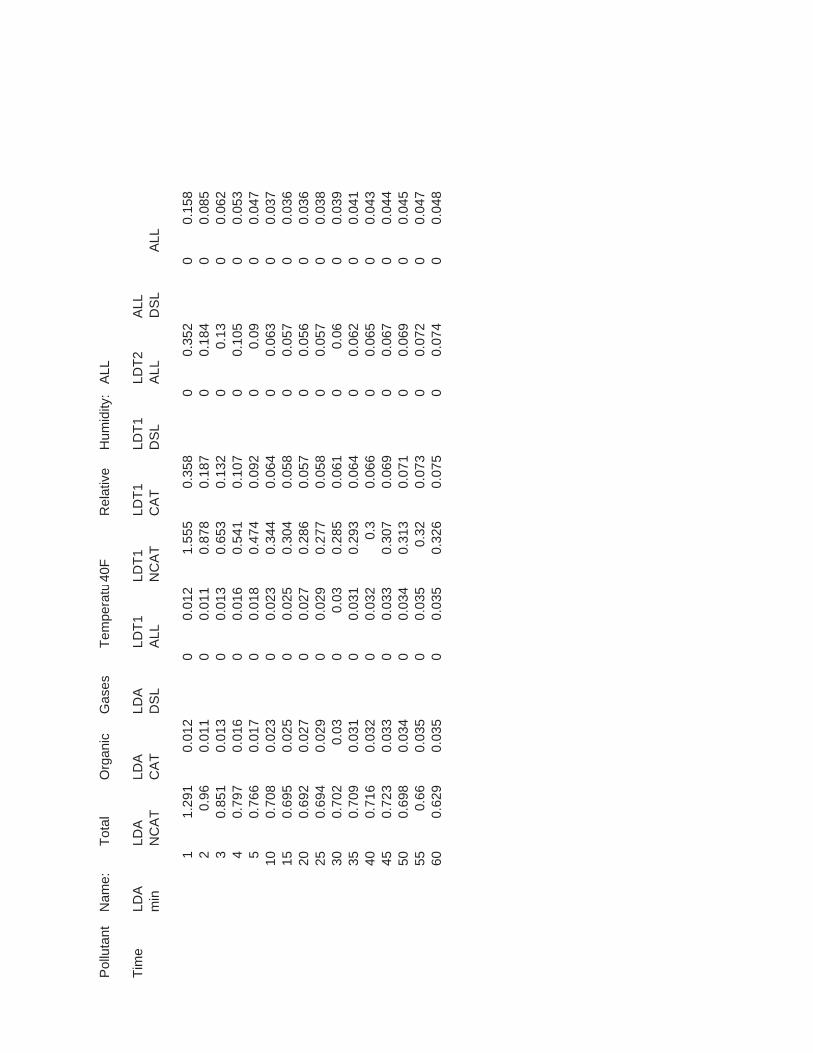
Pollu
tant
Nam
e:To
tal
Org
anic
Gas
esTe
mpe
ratu
40F
Rel
ativ
eH
umid
ity:
ALL
Tim
eLD
ALD
ALD
ALD
ALD
T1LD
T1LD
T1LD
T1LD
T2AL
Lm
inN
CAT
CAT
DSL
ALL
NC
ATC
ATD
SLAL
LD
SLAL
L
11.
291
0.01
20
0.01
21.
555
0.35
80
0.35
20
0.15
82
0.96
0.01
10
0.01
10.
878
0.18
70
0.18
40
0.08
53
0.85
10.
013
00.
013
0.65
30.
132
00.
130
0.06
24
0.79
70.
016
00.
016
0.54
10.
107
00.
105
00.
053
50.
766
0.01
70
0.01
80.
474
0.09
20
0.09
00.
047
100.
708
0.02
30
0.02
30.
344
0.06
40
0.06
30
0.03
715
0.69
50.
025
00.
025
0.30
40.
058
00.
057
00.
036
200.
692
0.02
70
0.02
70.
286
0.05
70
0.05
60
0.03
625
0.69
40.
029
00.
029
0.27
70.
058
00.
057
00.
038
300.
702
0.03
00.
030.
285
0.06
10
0.06
00.
039
350.
709
0.03
10
0.03
10.
293
0.06
40
0.06
20
0.04
140
0.71
60.
032
00.
032
0.3
0.06
60
0.06
50
0.04
345
0.72
30.
033
00.
033
0.30
70.
069
00.
067
00.
044
500.
698
0.03
40
0.03
40.
313
0.07
10
0.06
90
0.04
555
0.66
0.03
50
0.03
50.
320.
073
00.
072
00.
047
600.
629
0.03
50
0.03
50.
326
0.07
50
0.07
40
0.04
8

Attachment 3
AMBAG CONSISTENCY LETTER
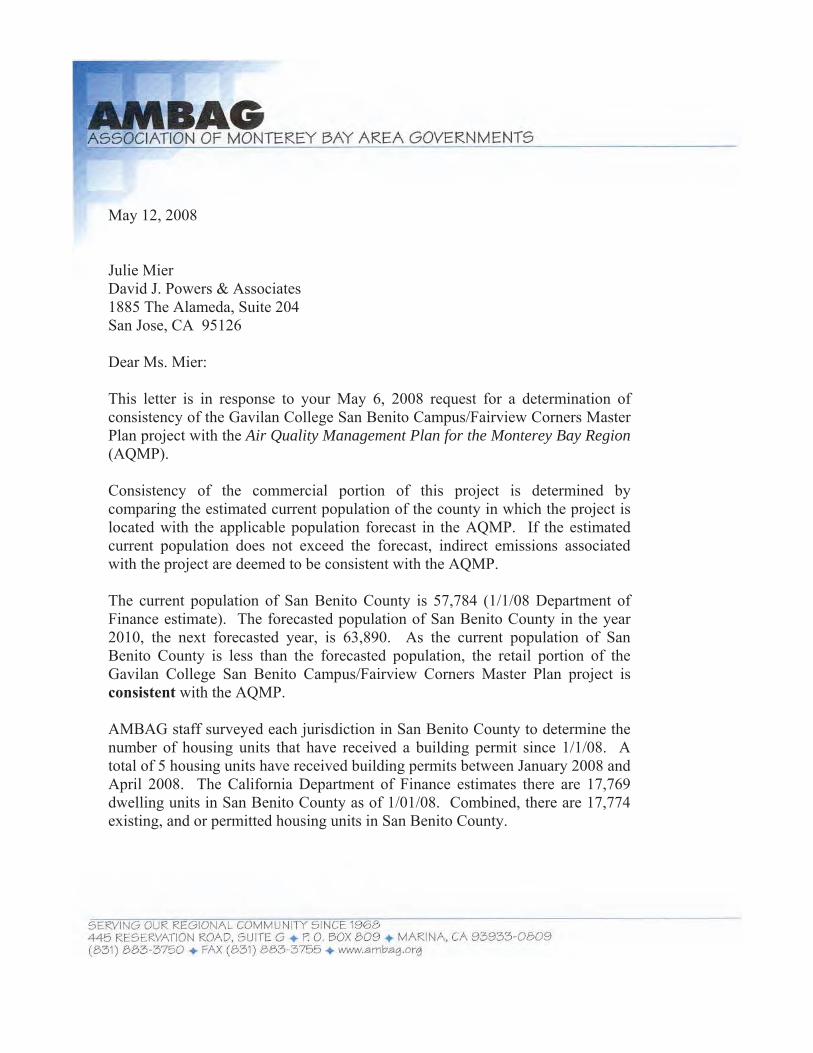
May 12, 2008
Julie Mier David J. Powers & Associates 1885 The Alameda, Suite 204 San Jose, CA 95126
Dear Ms. Mier:
This letter is in response to your May 6, 2008 request for a determination of consistency of the Gavilan College San Benito Campus/Fairview Corners Master Plan project with the Air Quality Management Plan for the Monterey Bay Region(AQMP).
Consistency of the commercial portion of this project is determined by comparing the estimated current population of the county in which the project is located with the applicable population forecast in the AQMP. If the estimated current population does not exceed the forecast, indirect emissions associated with the project are deemed to be consistent with the AQMP.
The current population of San Benito County is 57,784 (1/1/08 Department of Finance estimate). The forecasted population of San Benito County in the year 2010, the next forecasted year, is 63,890. As the current population of San Benito County is less than the forecasted population, the retail portion of the Gavilan College San Benito Campus/Fairview Corners Master Plan project is consistent with the AQMP.
AMBAG staff surveyed each jurisdiction in San Benito County to determine the number of housing units that have received a building permit since 1/1/08. A total of 5 housing units have received building permits between January 2008 and April 2008. The California Department of Finance estimates there are 17,769 dwelling units in San Benito County as of 1/01/08. Combined, there are 17,774 existing, and or permitted housing units in San Benito County.
The Gavilan College San Benito Campus/Fairview Corners Master Plan project consists of a total of 691 residential units phased at 40 units every two years over 10 years. Occupancy of the first housing units is estimated to take place by 2010. The 2004 Population, Housing Unit, and Employment Forecast forecasts there will be 19,455 housing units in San Benito County by the year 2010.
The combination of the existing and permitted housing units in San Benito County (17,774) plus the 20 housing units in the Gavilan College San Benito Campus/Fairview Corners Master Plan project is less then the regional forecasts for San Benito County (19,455.) The continuing phases of construction out to 2018 are also under the regional forecasts for the intervening years. Therefore the Gavilan College San Benito Campus/Fairview Corners Master Plan project isconsistent with the 2004 regional forecasts and the Air Quality Management Plan.
Please feel free to contact me if you have any questions about this determination.
Sincerely,
David Roemer Associate Planner
cc: Jean Getchell, MBUAPCD