![[XLS]wcd.gujarat.gov.inwcd.gujarat.gov.in/pdf/anganwadi/Dahod.xls · Web viewPanda Kamliben Sumanbhai zarla f Gohil Narmdaben Bhurabhai Palashmajulaben jalubhai" - 11 khakhara f Chouhan](https://static.fdocuments.net/doc/165x107/5ab98edf7f8b9a28468e3709/xlswcd-viewpanda-kamliben-sumanbhai-zarla-f-gohil-narmdaben-bhurabhai-palashmajulaben.jpg)
Saurashtra University - COnnecting REpositories. Daxaben Gohil guided me at her level best by...
286
Saurashtra University Re – Accredited Grade ‘B’ by NAAC (CGPA 2.93) Nathwani, Nirmal, 2004, The Study of Financial Performance of Banking Sector of India, thesis PhD, Saurashtra University http://etheses.saurashtrauniversity.edu/id/eprint/54 Copyright and moral rights for this thesis are retained by the author A copy can be downloaded for personal non-commercial research or study, without prior permission or charge. This thesis cannot be reproduced or quoted extensively from without first obtaining permission in writing from the Author. The content must not be changed in any way or sold commercially in any format or medium without the formal permission of the Author When referring to this work, full bibliographic details including the author, title, awarding institution and date of the thesis must be given. Saurashtra University Theses Service http://etheses.saurashtrauniversity.edu [email protected] © The Author
Transcript of Saurashtra University - COnnecting REpositories. Daxaben Gohil guided me at her level best by...

Saurashtra University Re – Accredited Grade ‘B’ by NAAC (CGPA 2.93)
Nathwani, Nirmal, 2004, The Study of Financial Performance of Banking Sector of India, thesis PhD, Saurashtra University
http://etheses.saurashtrauniversity.edu/id/eprint/54 Copyright and moral rights for this thesis are retained by the author A copy can be downloaded for personal non-commercial research or study, without prior permission or charge. This thesis cannot be reproduced or quoted extensively from without first obtaining permission in writing from the Author. The content must not be changed in any way or sold commercially in any format or medium without the formal permission of the Author When referring to this work, full bibliographic details including the author, title, awarding institution and date of the thesis must be given.
Saurashtra University Theses Service http://etheses.saurashtrauniversity.edu
© The Author

A THESIS
ON
THE STUDY OF FINANCIAL PERFORMANCE OF
BANKING SECTOR OF INDIA
SUBMITTED BY: Prof. : NIRMAL NATHWANI
LECTURER IN COMMERCE
SMT. J. J. KUNDALIA COMMERCE COLLEGE,
RAJKOT.
FOR :
PH. D. DEGREE IN COMMERCE UNDER
THE FACULTY OF COMMERCE SAURASHTRA UNIVERSITY
RAJKOT
GUIDED BY :
Dr. DAXABEN C. GOHIL ASSOCIATE PROFESSOR
DEPARTMENT OF COMMERCE &
BUSINESS ADMINISTRATION SAURASHTRA UNIVERSITY
RAJKOT 2004
1

Department of Commerce & Business Administration
Saurashtra University
Rajkot
C e r t i f i c a t e This is to certify that Mr. Nathwani Nirmal Jaysukhlal has
carried out the research work in this thesis on 'The Study of
Financial Performance of Banking Sector of India' under my
guidance and supervision.
I also certify that this is his original work.
Place : Rajkot Guide :- Dr.Daxaben C. Gohil Associate Professor Dept. of Commerce &
Business Administration Saurashtra University,
Rajkot
APRIL-2004
2
Department of Commerce & Business Administration
Saurashtra University
Rajkot
D e c l a r a t i o n
I hereby declare that the research work presented in this thesis on
'The Study of financial Performance of Banking Sector of India' is
prepared by me after studying various references.
I also declare that the research work is my original work and has not
previously submitted to this or any other University for any degree
or award.
Place : Rajkot Researcher : Mr. Nathwani Nirmal Jaysukhlal Smt. J.J.Kundaliya Commerce
College, Rajkot Guide :- Dr.Daxaben C. Gohil
Associate Professor Dept. of Commerce &
Business Administration Saurashtra University,
Rajkot
APRIL-2004
3

PREFACE
Banking sector reforms in India, strive to increase efficiency
and profitability of the banking institutions, the existing banking
institutions has to face the global competition. As a consequence,
there has not only been rapid expansion in the number of banking
institutions in the country, but the banking horizon of the country
has also changed significantly with the entry of new private sector
and foreign banks. As of now, the country has public sector, old
private sector, new private sector and foreign banks operating side-
by-side and giving cut-throat competition to each other. Apparently,
these different types of banks differ significantly from each other in
terms of financial performance including operational efficiency,
profitability, productivity and credit efficiency. There is a general
perception that new private sector banks and foreign banks are more
efficient in financial performance than that of nationalized and old
private sector banks. This study emphases on the financial
performance of all the commercial banks of the country for the
period of five years from the year 1997-1998 to 2001-2002.
4

The aim of this study is to understand and to find out different
types of efficiency level of all the commercial banks in India. The
operational efficiency reveals the performance of banks regarding
operational aspects. The profitability tells about banks financial
strength with the same and other banking groups in the industry. The
productivity parameter indicates the labour productivity of the
employees of a bank. The credit efficiency parameter shows how the
given credits are efficient and what will be the effect on solvency of
the bank. All these parameters have been taken with different ratios
for the period of five years. All the scheduled commercial banks in
India have been selected by the researcher. The types of banks are…
1. SBI Group.
2. Other nationalized banks
3. Old private-sector banks.
4. New private-sector banks.
5. Foreign banks.
As a layman, I firmly believe that my Journey for Ph. D.
Degree began with the blessings of my parents and ended up with
the grace of god. My Parents allowed me a birth on this earth, spared
5

a lot of time and money for my growth and served me all the
facilities to avail the best education. Being the excellent teacher, my
grandmother who is passing her retired life with devoting all her
time for praying god poured some good manners and learning habits
in me resulted in my efforts to claim my eligibility for availing
Ph.D.Degree. After completing my M.Com in 1990, I immediately
got the Part-Time lecturership in the same year. Fortunately I
selected as a full time lecturer in 1991. This event made me
obligatory to do something for academic era. I express my deep
sense of thanks for the full moral support of my friend and
philosopher, the incharge principal of my college, Late Shri C.M.
Kotak Saheb. When I thought about to register my self as a Ph. D.
student, I approached Dr. (Mrs.) Daxaben Gohil, Associate
professor, Department of Commerce and Business Administration,
Saurashtra University and with a shining face, she allowed me for
registration under her guidance.
Υ]∼ ΤΜ ς{;Φ ΣΛΗΛς[ Η{;[ 5}Γ∆ Ρ∴Ν Τ[Η ΣΖ[ ςΦ{Ζ Τ5[ ΓΧΛ∴ ςΦ5[ πΖ ςΦΓ∴Ν
Dr. Daxaben Gohil guided me at her level best by contributing her
precious time and her findings from the ocean of commerce
6

literature. As no proper words are available to me; directly from my
heart I express my sense of gratitude and thanks to my beloved guide
Dr.Daxaben Gohil. I also acknowledge Dr. Pratapsinhji Chauhan,
Miss Jhanavi and Miss Kruti (Daughters of Dr.Daxaben &
Dr.Pratapsinhji Chauhan) who have always cheerfully welcomed me
at home.
I would like to acknowledge my better half my loving wife
Rajeshri (Raj). I indeed appreciate her contribution for my success.
She has taken care of my requirements and has inspired me
constantly to proceed my research work. I and Raj have a God gifted
loving son named as Akhilesh studying in Std-3. Though he is a little
boy, he is very cultured and mature. My wife Raj and son Akhilesh
devoted their everything for my convenience. My research work
would have been remained incomplete without the help of
Mr.Haresh Dada (Prof. Dr. Haresh Tank). Being my best friend,
Haresh Dada numerously assisted me a lot. At last but not the least,
Mr. Gaurav Pujara helped me in finishing my research work by
offering me my work in binded thesis.
7

I must acknowledge Mr. Jayantibhai Kundaliya, Late Shri
Labhubhai Trivedi, Mr. Mansukhbhai Joshi, Dr. Alpanaben
Labhubhai Trivedi, Mr. Ashvinbhai Mehta, Saurashtra university
officials, Mr. Kirtibhai Nathwani, Principal Smt. Banuben
Rameshbhai Dhakan, Principal Shri K.M. Padhiar Saheb, and Dr.
Naliniben Dave,
I acknowledge the grace of Lord Shiva and offer my work to
the society.
Prof. N. J. Nathwani
8

CHAPTER PLAN
CHAPTER - 1 INDIAN BANKING SYSTEM – AN OVERVIEW
CHAPTER - 2 PERFORMANCE APPRAISAL - A
CONCEPTUAL FRAMEWORK CHAPTER - 3 RESEARCH METHODOLOGY CHAPTER - 4 ANALYSIS OF OPERATIONAL
EFFICIENCY OF INDIAN BANKING SECTOR
CHAPTER - 5 ANALYSIS OF PROFITABILITY OF
INDIAN BANKING SECTOR CHAPTER - 6 ANALYSIS OF CREDIT EFFICIENCY
AND PRODUCTIVITY OF INDIAN BANKING SECTOR.
CHAPTER - 7 SUMMARY, FINDINGS AND
SUGGESTIONS
9

CHAPTER – 1
INDIAN BANKING SYSTEM – AN OVERVIEW
1.1 Development of Banking in India.
1.1(a) Ancient India.
1.1(b) Muslim period
1.1(c) British period
1.2 Central banking enquiry committee.
1.3 The was and post war developments.
1.4 First phase:- 1948-1968, Banking before Nationalization.
1.4(a) After independence
1.4(b) Economic Plan era.
1.4(c) On the eve of Nationalization
1.5 Second phase: 1969-1991 Nationalization and After.
1.5(a) After to Nationalization
1.5(b) Branch Expansion
10

1.5(c) Resource Mobilization
1.5(d) Credit operations
1.5(e) Social Banking
1.5(f) Problems and consolidation
1.6 Third phase : 1992-2002 Regime of Reforms
1.6.(a) The Reforms Process.
1.6(b) Banking Reforms
1.6(c) major components of Reforms
1.6(d) Narsimham Committee : 1998
1.6(e) Reforms and Response
1.7 Fourth Phase : Beyond 2002
1.7(a) New Challenges
1.7(b) New Dimension
1.7(c) HRD: Rigidities
1.7(d) Corporate governance
References
11

1.1 DEVELOPMENT OF BANKING IN INDIA
1.1 (A) Ancient India :
The origin of banking in India dates back to the Vedic period.
There are repeated references in the Vedic literature to money
lending which was quite common as a side business. Later, during
the time of the Smritis, which followed the Vedic period, and the
Epic age, banking became a full-time business and got diversified
with bankers performing most of the functions of the present day
banks. The Vaish community, who conducted banking business
during this period, accepted deposits from the public, granted loans
against pledges and personal security, granted simple open loans,
acted as bailee for their customers, subscribed to public loans by
granting loans to Kings, acted as treasurers and bankers to the state
and managed the currency of the country.
Still later, that is, during the Buddhist period, banking business
was decentralized and became a matter of volition. Consequently,
Brahmins and Kshatriyas, who were earlier not permitted to take to
banking as their profession except under exceptionally rare
circumstances, also took to it as their business. During this period,
12

banking became more specific and systematic and bills of exchange
came in wide use. "Shresthis" or bankers became influential in
society and very often acted as royal treasurers.
1.1 (B) MUSLIM PERIOD :
Indigenous banking which by the time of the Buddhist period
had become fairly well developed received a setback during the
Muslim period since the muslim rulers believed in the quranic
injunction of charging interest as "Haraam' or a great sin. Moreover,
the unending wars and royal succession feuds of this period greatly
hampered the development of trade and commerce on which the
development of banking and money lending dependent. Banking
business was, however, partially rehabilitated during the Mughal
period, particularly during the secular and settled reign of Emperor
Akbar who gave the much-needed political stability to the country.
Further, during the Jahangir's reign, private banking further
developed and it is recorded that there were many enterprising
bankers functioning in the country at this time. During Shahjahan's
reign also banking prospered without interruption and large banking
houses were established at important trading centers in the country.
13

However, as a staunch practitioner of the quranic injunctions,
Aurangzeb adopted a negative approach towards money lending and
banking. Even so, some of the sagacious indigenous bankers were
very influential in the country's life.
1.1 (C) BRITISH PERIOD :
The seventeenth century witnessed the coming into India of
the English traders. The English traders established their own agency
houses, houses at the port towns of Bombay, Calcutta and Madras.
These agency houses, apart from engaging in trade and commerce,
also carried on the banking business. The indigenous bankers being
in conversant with the language and trade practices of the former
could not take advantage of the expanding business in the hands of
the English merchants. Further, the unification of the currency in
1835, gave a further blow to the indigenous bankers as it deprived
them of the profitable business of money changing.
The development of the means of transport and
communication causing deflection of trade and commerce along new
routes, changing the nature and structure of trade activities in the
country were the other factors which also contributed to the downfall
14

of the indigenous bankers. Partly to fill the void caused by their
downfall and partly to finance the growing financial requirements of
English trade, the East India Company now came to favour the
establishment of the banking institutions patterned after the Western
style.
The first Joint Stock Bank established in the country was the
Bank of Hindustan founded in 1770 by the famous English agency
house of M/s. Alexander and Company. This bank failed in 1832
with the coming to grief of the firm of Alexander and Co. The
Bengal Bank and the Central Bank of India were established in
1785. The Bank of Bengal, the first of the three Presidency Banks,
was established in Calcutta in 1806 under the name of Bank of
Calcutta. It was renamed in 1809 on the grant of the charter as the
Bank of Bengal. The two other presidency banks, namely the Bank
of Bombay and the Bank of Madras, were established in 1840 and
1843 respectively. All the Presidency Banks were also empowered
to issue notes. After the Paper Currency Act of 1862, however, the
right of the note issue was taken away from them. The Bank of
Bombay carried on the speculative activities in cotton following the
15

American Civil war and it suffered heavy losses culminating in its
final winding up in 1868. To replace this bank, a new bank of the
same name was constituted under the Indian Companies Act of
1866. The Presidency Banks Act of 1876 placed certain restrictions
on the functioning of these banks, which were forbidden from
negotiating foreign bills. They were also forbidden from giving
advances for a period exceeding six months. 1
The Presidency Banks had branches in important towns of the
country. There was, however, considerable duplication and
overlapping in their activities, and therefore, public opinion favoured
a single presidency bank for the whole country. In 1898, some
witnesses who tendered their evidence before the Fowler Currency
Committee 2 favoured the establishment of a Central bank in the
country, but the Government was apathetical to the suggestion. The
Presidency Banks, which were anxious to maintain their
individuality, were also not in favour of a single bank by
amalgamating the three Presidency Banks. The Chamberlain
Commission in 1913, 2 suggested the appointment of a committee to
examine the whole issue. The banking crisis of 1913 to 1917,
16

however, brought out the serious deficiencies in the existing banking
system in the country showing the need for effective co-ordination
through the establishment of Central Bank. After repeated efforts,
the three Presidency Banks were fused into a single bank under the
name of the Imperial Bank of India in 1921. At the time of the
amalgamation, the three Presidency Banks had a total of 70
branches, total paid up capital of Rs. 3.75 crores and reserves
totaling Rs. 3.5 crores.
Besides, the three Presidency Banks, some other joint stock
banks established in the later half of the 19th Century included the
Allahabad Bank (1865), the Punjab National Bank (1894), and the
Peoples' Bank of India (1901). The last two banks owned their origin
and development to the untiring efforts of Lala Harkishan Lal.
Around the turn of the 20th Century, a great spurt was
witnessed in the commercial banking activity in the country. With
the spread of the Swadeshi Movement in the country in 1906 the
number of banks with capital and reserves of over Rs. 5 lakh,
doubled from 9 to 18 in the short period of seven years from 1906 to
1913. These banks claimed the total deposits of Rs. 22 crores while
17

their total paid up capital and reserves exceeded Rs. 4 crores. The
number of smaller commercial banks started during this period was
much larger. Among the banks established during this period were
now famous Banks of India, Central Bank of India, Bank of Baroda,
Bank of Mysore, etc.
Soon after this 'banking boom', followed a period of crisis,
which gave a rude shock to banking development in the country.
During the short period of eleven years from 1913 to 1924, as many
as 161 banks came to grief involving a loss of about Rs. 7 crores in
the form of paid up capital. Of these banks, 15 had paid up capital
each of over Rs. 5 lakh and above; 20 had paid up capital each of
over Rs. 1 lakh but less than Rs. 5 lakh while the rest 126 had paid
up capital each of less than Rs. 1 lakh. Thus, whatever little banking
facilities survived were concentrated in a few selected urban areas.
There was great disparity between the resources of the few big banks
and large number of small banks. Very few commercial banks had
all India character with most banks restricting their activities to
particular areas of influence.
18

1.2 CENTRAL BANKING ENQUIRY COMMITTEE :
There were repeated demands for banking reforms in the
country. The Royal Commission of Indian Finance and Currency in
1914 had suggested the appointment of committee to study certain
issue relating to banking in India. The Industrial Commission in
1918 had likewise recommended the setting-up of an expert
committee to consider the issue of the extent of banking facilities
available for the financing of industries in the country. In 1919, Sir
B. N. Sharma had moved a revolution in the Imperial Legislative
Council asking the Government for appointing a banking committee.
In 1927, Mr. S. N. Haji also moved a resolution in the Legislative
Assembly urging the Government to appoint a commission to
investigate into the existing conditions of banking in India. The trade
and industrial organizations like the Associated Chambers of
Commerce of India and Ceylon and the Federation of Indian
Chambers of Commerce and Industry had also, by moving
resolutions in their meetings, requested the Government for an early
appointment of a banking enquiry committee.
19

Looking to these pressing demands, the Government appointed
the Provincial Banking Enquiry Committees in eight provinces in
1929, besides appointing a separate Banking Enquiry Committee for
the centrally administered areas. Subsequently, to complete the chain
of enquiry, the Government appointed on July 22, 1929 the Indian
Central Banking Enquiry Committee under the chairmanship of Sri.
B. N. Mitra. The committee recommended, among other things,
enactment of a comprehensive banking legislation covering the
organization, management, audit and liquidation of banks in India.
Some of the Committee's recommendations were implemented in
1936 when the Indian Companies Act, 1913 was amended.
These and other provisions together with the provisions of the
Reserve Bank of India Act, 1934 relating to scheduled banks meant
considerable regulation of the hitherto un regulative commercial
banking system in the country. Besides, the establishment of the
Reserve Bank of India in 1935 as the central banking institution in
India was designed to bring about the much needed supervision and
control of, and co-ordination among the joint stock banks in the
country. The presence of the Reserve Bank of India created
20

confidence in the joint stock banks in as much as there was now an
institution the banks could go to for help when faced with
difficulties.
However, it was soon realized that the provisions of the
existing legislations were both inadequate and difficult to administer.
Not much could, however, be done during the War on the legislation
front and the activity remained confined to introducing only the
abortive bills in the legislative assembly and the promulgation on the
Banking Companies (Control) Ordinance, 1948. The only exceptions
were the Indian Companies (Second Amendment) Act, 1942 which
provided for the compulsory use of the word 'bank', 'banker' or
'banking' by every banker and the Banking Companies (Restriction
on Braches) Act, 1946 requiring banks to obtain Reserve Bank's
permission before opening new offices or changing the location of
the existing ones.
1.3 THE WAR AND POST WAR DEVELOPMENTS :
The war years witnessed a considerable increase in the number
of scheduled banks in the country. During 1942 and 1943 alone, a
number of important banks were floated which included the Bharat
21

Bank Ltd., the Hindustan Commercial Bank Ltd., the United
Commercial Bank Ltd., and the Travancore Bank Ltd. The
establishment of the first three banks owned to the initiatives of three
well-known industrial houses of Dalmias, Singhanias and Birlas.
The Bharat Bank Ltd., was merged with the Punjab National Bank
Ltd., in 1951, while the other two still continue with the United
Commercial Bank being counted among the 'Big Five". The total
number of the offices of scheduled banks in India during 1938-50 is
shown in Table 1.3(A)
TABLE – 1.3(A)
NUMBER OF OFFICES OF SCHEDULED BANKS IN INDIA
(1938-50)
Number of Offices Year Imperial Bank of
India Other Scheduled
Banks
Total
1938 358 677 1035 1939 381 798 1179 1940 390 860 1250 1941 401 954 1355 1942 392 974 1366 1943 398 1400 1798 1944 419 1977 2396 1945 426 2454 2880 1946 358 2441 2799 1947 362 2565 2927 1948 367 2534 2901 1949 377 2411 2788 1950 382 2355 2717
22

Source :- Various issues of Reserve Bank of India Bulletins and
Statistical Tables relating to Banking in India. figure in
the table from 1938 to 1941 relate to India and Burma;
those from 1942 to 1945 to undivided Indian and there
after to the Indian union.
Table 1.3(a) reveals a decline in the number of banking offices
of the Imperial Bank in 1942 and 1946 and of all the banks in 1946
onwards except during 1947. The decline in the number of offices of
the Imperial Bank was the result of the separation of Burma and
Pakistan from India. Although, Burma was separated from India in
1937, its banking offices continued to be shown together with that of
India's until 1941. Similarly, the Bank's offices in Pakistan were
shown separately from those in India from 1946 onwards. Because
of separately showing the bank offices in Pakistan from 1946
onward, the total number of bank offices in India also fell for 1946.
The fall in the number of banking offices after 1946 was the result of
a number of voluntary winding up and amalgamation schemes. In
1950, as many as 11 banks went into voluntary liquidation while
four scheduled banks in Bengal were amalgamated with the United
23

Bank of India Ltd., In 1951, the Bharat Bank Ltd., was merged with
the Punjab National Bank Ltd., As a result of these amalgamations
and mergers, about 142 uneconomic offices were closed which was a
healthy trend.
In short, the Indian Banking system as at the end of World
War II was characterized by a large number of small and financially
weak non-scheduled banks and a rapid expansion of bank offices
during the War. According to the Rural Banking Enquiry
Committee, a part of this expansion represented a careless and
sometimes unscrupulous increase in bank branches and unsound
methods of working with the result that even during 1941-46 when
circumstances were generally favourable to the development of
banking, as many as 254 banks went into liquidation. However, the
decline in the number of banking offices during 1947-49 reflected a
restrictive licensing policy pursued by the Reserve Bank of India
under the powers conferred to it in 1946.
The Indian Banking system is unique and perhaps has no
parallels in the banking history of any country in the world. It is
interesting to study the evolution of Indian Banking over the last five
24
decades, in terms of organizations functions, resource mobilization,
socio-economic role, problems and solutions. The period of five
decades witnessed many macro-economic developments, monetary
and banking policies and the external situation, which influenced the
evolution of Indian banking in different ways and in different
periods. For this reason, it would be useful to analyze in some detail
the evolution of Indian Banking system with reference to some
distinct phases. The first phase covers the period from 1948 to 1968
and the second phase from 1969 to 1991. These two phases
constitute the past. The period of banking reforms beginning with
1992 and till the year 2002 may be regarded as the current or present
phase for the purpose of this analysis. It is the current phase, which
provides the basis for looking into the future of Indian Banking
System.
1.4) First Phase : 1948-1968 : Banking before Nationalization :
It is useful to trace briefly the Banking situation in India at the
time of independence of the country in 1947. The country inherited a
banking system that was patterned on the British Banking System.
There were many joint stock companies doing banking business, and
25

they were concentrating mostly in major cities. Even the financing
activities of these banks were confined to the exports of Jute, Tea
etc. and to traditional industries like textiles and sugar. There was no
uniform law governing banking activity. An immediate concern after
the partition of the country was about bank branches located in
Pakistan and steps were taken to close some of them as desired by
that country. As a result of mushroom-like growth of banking
companies, bank failures were very common in those days. In 1949,
as many as 55 banks either went into liquidation or went out of
banking business. Banking did not receive much attention of the
policy makers and disjointed efforts were made towards the
regulation of the banking industry.
1.4 (A) After Independence :
The first step was to create the legislative framework
appropriate for banking in a newly independent nation. The Banking
regulation Act passed in 1948 provided the legal framework for the
regulation of the banking system by the Reserve Bank of India. The
Act, which came into force in March 1949, 3 imposed certain
discipline on the joint stock companies doing banking business in
26

India. As a result, the banking industry came to be organized for the
first time on certain uniform parameters. The Act prohibited the use
of the word 'Bank' by financial companies, which were not
complying with certain minimum requirements i.e. minimum, paid
up capital and reserves. This stipulation, which came into force from
March 1952, led to a process of weeding out financially weak banks.
A number of banks went into liquidation.
The Reserve Bank of India (RBI), which was vested with
greater powers of control over the banks, started collecting data from
1949 on various aspects of banking. There were 620 banking
companies, big and small, scheduled and non-scheduled, operating
mostly in state capitals and in urban centers. The total number of
branches was 4,263. Total deposits and advances were Rs. 997 crore
and Rs. 518 crore respectively. Investments were Rs. 376 crore.
Imperial Bank of India was the biggest bank in those days with 433
branches. The present day subsidiaries of the state Bank of India
were independent banking companies mostly in the former princely
states. Besides the Indian Banks, there were 15 Exchange bank
27

(Foreign Banks) with branches in big cities only, and they were
dealing mostly with international banking i.e. financing the export
and import of commodities.
The Banking System at the time of independence was deficient
in many respects. The banks were largely urban-oriented and
remained beyond the reach of the rural population. A large
percentage of the rural population had to depend on the moneylender
as their main source of credit. Banks’ rural penetration was grossly
inadequate, as agriculture was not considered an economic
proposition by banks in those days. Thus, the agricultural sector, the
crucial segment of the Indian economy was not supported by the
banking system in any form. Moreover, security oriented lending
was the order of the day. Only 4% of the total advances were made
without any security. Another serious deficiency was that the focus
of banks was entirely on short-term credit. There were no sources of
long-term finance worth the name. There was no well developed
capital market, nor was there any term-lending institution except for
the industrial finance corporation of India, set up in 1948.
28
1.4 (B) Economic Plan Era :
With the introduction of economic planning in 1951, the need
was felt for aligning monetary and banking activity with the
requirements of planning. The first five-year plan observed that RBI
as the Central Bank should create the machinery needed for
financing development and ensure that the finance available flows in
the directions intended. The objective was to widen and deepen the
flow of agricultural and industrial credit. The thrust was on the
rejuvenation of the rural economy and the banking system had to be
geared to this. The branch expansion by banks and increase in rural
credit including credit to the small-scale sector became imperative.
The All India Rural Credit Survey Committee appointed by the RBI
reviewed the rural credit scheme in 1954 and brought out the
maladies of the rural economy arising out of capital starvation. The
committee made a few major recommendations for improving the
flow of rural credit. On the basis of its recommendations, the
Imperial Bank of India was nationalized and renamed as State Bank
of India (SBI) from July 1955. The new bank was charged with the
responsibility of expanding it's rural branch network within a time
29

frame. Thus the first step was taken to induct the commercial banks
into rural credit, which was till then reserved for co-operative credit
agencies who were waging a battle against money lenders. As a part
of the process of geographical expansion of banking facilities to
meet the credit needs of co-operatives, certain banking companies
functioning in former princely states were converted in 1959 into
subsidiaries of SBI, later came to be known as associate banks of
SBI.
In 1960, the Crash of Palai Central Bank in Kerala, shook the
confidence of the public in the banking system and the RBI came out
with two schemes to stabilize the banking system. One was the
establishment of the deposit insurance corporation, to insure the
deposits of small depositors. The second scheme was the
compulsory mergers and amalgamations of banks of weak financial
structure, with bigger and viable banks. Simultaneously, in terms of
the banking companies (Amendment) Act-1963, RBI acquired
powers to restrain control over the affairs of banks of particular
groups of persons; regulate loans, advances and guarantees given by
30

banks and to appoint or remove banks as well as executive
personnel. In 1966, the co-operative banking system was brought
within the statutory supervision and control of RBI. During these
years, Indian Banks established overseas branches to increase their
participation in external trade, e.g. foreign exchange transactions.
There were some qualitative changes in the banking activity
during these years. There was a shift in the financing of Industries.
There was a decline in the financing of textiles and Sugar industries
and with the emphasis of the second five-year plan on heavy
industry development, the financing of cement, chemicals, iron and
steel and engineering industries became prominent. Export financing
also attracted attention, leading to the setting up of export credit
guarantee corporation in 1964 to compensate exporters for the losses
they might sustain. There was also some shift in the method of
lending from security based to capacity-to-produce-and-sell criteria.
A review of the ownership of bank deposits during this period
revealed the nexus between business houses and banking companies,
indicating the nature of control of banks by business houses.
31

1.4 (C) On the eve of Nationalization :
Even though Indian Banking System made considerable
progress both functionally and in terms of geographical coverage
during this period, there were still many rural and semi urban areas
which were not served by banks. Moreover, large industries and big
and established business houses tended to enjoy a major portion of
the credit facilities. Vital Sectors like agriculture, small-scale
industries and exports did not receive the attention they deserved.
Therefore, in 1968, the government imposed social control over
banks by amending banking laws. The objective was to achieve
efficient distribution of banking resources in conformity with the
requirements of the economy and to meet the needs of the priority
sectors. In this process, RBI acquired wider powers in matters of
appointment of heads of banks, directors on the boards of banks and
auditors.
The outcome of implementation of Social Control over banks
is of interest. One is that the system of credit planning became an
integral part of formulation of credit policy, second, the introduction
32

of the Lead Bank Scheme was to make the banking system function
as an instrument of development. Under social control the banking
system including smaller banks started gaining strength as evidenced
by the absence of voluntary or compulsory mergers of banks. Thus,
Social Control was a milestone in the evolution of banking policy.
1.5 Second Phase:1969-1991 Nationalization and After:
This phase began in a sedate manner with the appointment in
1969 of the Banking Commission, which was to recommended
changes in structure, procedures and policy for the Indian Banking
System. However, the commission did not have much time to
complete its task as it was overtaken by Swift Politico-economic
developments, which culminated in the nationalization, on July 19,
1969 of the 14 major Indian Scheduled Commercial banks in the
private sector. On 15th April, 1980, six more private sector banks
were nationalized, 4 thus extending further the area of public control
over the Indian Banking System. Nationalization was seen as a
major step to ensure adequate credit flow into genuine productive
areas in conformity with plan priorities.
33

1.5 (A) After to Nationalization :
The main objectives of nationalization were growth, reduction
in region imbalance of economic activity, to make the banking
system reach out to the small man in rural and semi-urban areas,
extending banking facilities to areas hitherto not served by banks so
that they not only mop up potential savings but also meet the credit
gaps in agriculture, small scale industries and other neglected sectors
of the economy. The aim was to bring large areas of economic
activity within the organized banking system. The two significant
aspects of nationalization were therefore; rapid branch expansion
and channeling credit according to priorities. In the wake of
nationalization the growth and development of the Indian Banking
System was phenomena. By the end of the second decade of
nationalization, Indian Banking was relatively sophisticated, with a
wide range of branches, huge deposit resources and extensive credit
operation. The outburst of banking activity during this period was
such that it may be described as banking explosion.
34

1.5 (B) Branch Expansion :
In terms of the branch licensing policy laid down by the RBI,
the accent was on the opening of branches in rural and semi-urban
areas, backward regions and under-banked states so that inter
regional disparities could be reduced. The details of the progress of
branch network during the period were summarized in the table
below.
TABLE NO. 1.5(B)(i)
NUMBER OF BRANCHES OF PSB
Year Total No. of Branches
Rural Branches
Semi-urban Branches
1969 8262 1833 3342 1980 32419 15105 8122 1991 60220 35206 11344
Source :- Various issues of Reserve Bank of India Bulletins and
Statistical Tables relating to Banking in India.
The total no. of branches increased near about eight fold
between 1969 and 1991, and the bulk of the increase was on account
of rural branches, which increased from less than two thousand in
1969 to over 35000 in 1991. The percentage share in the total
number of branches of rural and semi urban branches rose from 22%
and 4% respectively in 1969 to 45% and 25% in 1980 and to 58%
35

and 18% in 1991. A substantial part of the increase in branch
expansion took place in the first decade after nationalization. The
share of rural and semi urban branches together in the total number
of branches rose from 26% in 1969 to 76% in 1991. The impact of
this phenomenal growth was to bring down the population per
branch from 60000 in 1969 to about 14000. Thus one of the
objectives of nationalization i.e. to make banking reach out to the
small man in rural and semi urban areas, may be said to have been
served to a great extent. Even on the eve of banking reforms, the
bank branch network was widespread.
1.5 (C) Resource Mobilization :
One of the objectives of branch expansion was to mop up
national savings both actual and potential and to channel them into
investments according to plan priorities. The magnitude of resources
mobilized by the banks during 1969 to 1991 is indicated below.
TABLE NO. 1.5(C)(i) Resource Mobilization
(Rs. in Crore) Year Total
Deposits Term Deposits Saving
Deposits 1969 5173 3280 1524 1980 37988 19253 10937 1991 230758 128768 56902
36

Source :- Various issues of Reserve Bank of India Bulletins and
Statistical Tables relating to Banking in India.
Between 1969 and 1980, total deposits increased more than
seven fold and between 1980 and 1991, the increase was far more
than five fold. The substantial increase in total deposits and savings
deposits, which represents the savings of the community. These two
categories of deposits recorded a handsome increase in each of the
periods 1969-1980 and 1981-1991. The share of time deposits was
on an average 56% of the total deposits for the period 1969-1991,
while the average share of savings deposits was 27%. It is net-
worthy that deposits per bank office which was Rs. 0.6 crore in 1969
rose to Rs. 1.2 crore in 1980 and to Rs. 3.8 crore in 1991. This is the
result of both widening and deepening of the branch network by
banks.
1.5 (D) Credit Operations :
Given the objective of ensuring adequate credit flow to
genuine productive sectors and in accordance with plan priorities,
banks resorted to extensive credit operations after nationalization.
37

This was made possible by the enlarged resource base of banks
during the period. The RBI's credit policy over the years laid
increasing emphasis on channeling of bank credit to preferred
sectors and borrowers of small means. Annual targets were laid
down for lending to priority sectors as a whole with sub targets for
weaker sections of the society. It was also stipulated that a major
portion of the deposits mobilized in rural and semi urban areas
should be deployed in respective areas i.e. credit deposit ratio.
The credit operations of banks during the period are
summarized below.
TABLE NO. 1.5(D)(I) Credit operations
(Rs. in Crore) 1969 1980 1991
Bank Credit 3729 25371 125592 Priority Sector 659
(18%) 8501
(33%) 45425 (36%)
OF WHICH Agriculture Small Scale Industry Sector
258 (39%) 347
(52%)
3584 (42%) 3229
(37%)
18157 (42%) 18150 (42%)
Source :- Various issues of Reserve Bank of India Bulletins and
Statistical Tables relating to Banking in India.
Bank credit increased near about seven fold between 1969 and
1980 and about five fold between 1980 and 1991. The share of
38

Priority Sector in total bank credit increased from 18% in 1969 to
36% in 1991. Within the priority group the share of agriculture was
39% in 1969, 42% in 1980 and even 42% in 1991. The share of
small-scale industry sector which was 52% in 1969 showed a
relative decline to 37% in 1980 and was uplifted to 42% in 1991.
Bank advances per bank branch was Rs. 0.4 crore in 1969 and it rose
to Rs. 0.8 crore in 1980 and further Rs. 2.1 crore in 1991.
Going by the rural spread of bank branches, deposits
mobilized and credit extended, one could Justifiable conclude that
there was complete transformation from class banking to mass
banking during the period.
1.5 (E) Social Banking :
An important banking development after nationalization was
the emergence of social banking i.e. the use of banking as an
instrument for promoting socio-economic objectives. In the
seventies, banking policy was reoriented for securing a progressive
reduction in income inequalities, concentration of economic power
and class disparities. For attaining the objectives of social banking,
39

special institutions and schemes were sponsored by the government
of India and the RBI.
The introduction of the scheme for priority sector lending was
followed by the establishment in 1971 of credit guarantee
corporation to provide guarantees against the risk of default in
payment in respect of loans to various categories of small borrowers.
This was intended to encourage banks to lend to these categories
without hesitation. A number of innovations were made in the field
of social banking and large volumes of credit were lent under
programmes like 20-point Economic Programme, Integrated Rural
Development Programme (IRDP), and programmes for self-
employment of educated unemployed youth. Many of the poverty
alleviation programmes in the nature of mass-lending schemes were
adopted by the banking system for financing.
Though banks penetrated into rural areas, planners were not
satisfied with the amount of credit extended to weaker sections of
the rural society. To ensure that the benefits of development
percolated sufficiently to the needy, the Government of India came
out with special programmes like Small Farmers Development
40

Agency, the Marginal Farmers Development Agency and
Agricultural Laboureres Development Agency. It was felt that to
cater to the needs of these target groups, a separate credit agency
was necessary. The Narsimham Committee, which went into these
problems in 1974, recommended the establishment of Regional
Rural Banks (RRBs). Under the RRBs Act, 1975, banks in
collaboration with central and State Governments set up RRBS in
selected regions where the co-operative system was weak and where
commercial banks were not very active.
An important aspect of credit policy during the period was the
use of administered interest rates to direct the flow of funds to
preferred sectors, small borrowers and weaker sections of the
society. The aim was to make credit available at low cost to the
identified target groups.
1.5 (F) Problems and consolidation :
The phenomenal growth of the Indian Banking System over
the two decades prior to the reforms, gave rise to several problems,
which became more visible from the mid eighties. The rapid and
substantial growth rendered the banking system un widely. Besides
41
the constraints, both internal and external (to the banking system)
under which banks were functioning, exposed their several
weaknesses. These were; low operational efficiency, inadequate
capital base, high level of non-performing assets, low profitability,
unhealthy balance sheets and unsatisfactory customer service. In
short, the very viability of the banking system came in for scrutiny.
The period 1985-1991 may be regarded as a period of
consolidation for the banking system. The process of consolidation
called for action on several fronts. Individual banks were asked to
prepare action plans covering organization and structure, house
keeping, training, customer service, credit management, recovery of
loans, productivity and profitability. The banks were asked to
introduce, in a phased manner, modern technology in banking
operations, following the recommendations of the Rangrajan
Committee on Computerization in Banks. Emphasis was laid on the
financial viability of banks through improvement in profitability,
strengthening the capital base of banks and allowing them flexibility
in several areas of their operations.
42

Although the progress made by the banking system in terms of
geographical and functional coverage, resources mobilized and
credit deployed was laudable, it displayed all the characteristics of a
repressed financial system.
1.6 Third Phase : 1992-2002 Regime of Reforms : 5
The period 1992-2002 may be regarded as the present or the
current phase in the evolution of Indian Banking. Like the second
phase (1969-1991) which began with a bang i.e. nationalization of
banks, the current phase also began with a radical departure from
regulated banking towards market-oriented banking, as a result of
the introduction of financial reforms, especially banking reforms,
India's economic reforms programme began as a response to the
macroeconomic crisis that developed in early 1991. The crisis
manifested itself in rising inflation, high lever fiscal deficit, low
growth and unsustainable current account deficit, and the gulf war of
1990 precipitated the balance of payments crisis. Faced with the
most serious balance of payments problems, government of India
initiated measures for stabilization and structural adjustment with
far- reaching consequences.
43

1.6 (A) The Reforms Process :
The main plank of economic reforms comprised _ _ _ _
(i) Stabilization of the economy so as to keep under control
inflationary and balance of payment pressures.
(ii) Deregulation of the real and financial sectors and removal of
the license and permits system from all spheres of production
and domestic trade, to promote competition.
(iii) Liberalization of international trade in various sectors to
promote competition and efficiency by removing the high
degree of protection enjoyed by the domestic industry and.....
(iv) Integration with the world economy to attract capital and
modern technology.
However, economic reforms in the real sectors of the economy
would not succeed without parallel reforms in the financial sector It
hardly needs emphasis that a liberalized economy would be i11-
served if the banking system remains highly sheltered or regulated.
Just as the banking system cannot become viable or sustainable in
the long run unless it adequately responds to the needs of the
market-oriented economy. Thus, financial sector reforms were a
44

necessary concomitant of liberalization of industrial and trade
policies.
1.6 (B) Banking Reforms :
The broad directions of the financial reforms were
improvement in the overall monetary policy framework,
strengthening financial institutions and gradual integration of the
domestic financial system into the global economy. Within these
broad goals of policy, banking reforms have the specific task of
achieving. :
(i) A suitable modification in the policy framework within which
banks operate
(ii) Improvement in the financial health and competitive
capabilities of banks.
(iii) Building financial infrastructure relating to supervision, audit
and technology and
(iv) Up gradation of the level of managerial competence and the
quality of human resources.
The banking reforms based on these specific tasks have two
aspects; Macro level policy changes and micro-level policy reforms.
45

The former aims at removing external constraints on the banking
system as a whole and thus creating a climate in which banks could
function in tune with liberalization. Micro-level reforms, on the
other hand, are concerned with specifics of individual banks and
banks as a whole to enable them to overcome internal constraints on
their functioning.
1.6 (C) Major Components of Reforms :
The basis for banking reforms was provided by the committee
on financial system (Narsimham Committee) which made
recommendations in November 1991, and these recommendations
are a landmark in the evolution of banking policy in the country, as
these transformed the Indian Banking System from a highly
regulated to a more market-oriented system. The major components
of banking reforms are outlined in the following paragraphs :
(i) Modifying the policy framework was the starting point. The
pre-emption of banks’ resources by way of Cash Reserve
Ratio (CRR) and Statutory Liquidity Ratio (SLR) was acting
as an external constraint on their profitability. This constraint
was relaxed in two ways. These two ratios together pre-empted
46

as much as 63.5% of banks resources in 1991. The average
CRR was reduced to 7.5% by may 2001. The SLR was also
rationalized into a uniform ratio of 25% of net demand and
time liabilities (NDTL) of banks. The interest paid on eligible
cash balances under CRR was raised to 6%. Alongside, the
bank rate was activated in April 1997 as an effective signal
and as a reference rate.
There was also the deregulation of the administered
structure of interest rates. The Plethora of lending rates were
rationalized and interest rates were made market-oriented for
most of the transactions, the exceptions being the lending rates
for small borrowers and interest rate on savings bank deposit.
A continuous and careful step-by-step approach has been the
main feature of deregulation of interest rates. To facilitate the
use of open market operations as a monetary instrument, many
policy changes were made in government securities market
with reference to yields, sales procedures, network of dealers
and maturity patterns. These were supplemented by measures
47
to discontinue automatic monetization of fiscal deficit by
phasing out the issue of adhoc treasury bills.
The modifications in the policy framework carried out as
part of the reforms have paved the way for greater reliance on
indirect instruments of monetary control.
(ii) Improving the financial soundness of banks is the second
major component. In an attempt to maintain profitability,
banks developed a tendency to over extend their lending by
accepting debtors of low creditworthiness, which has come to
be known as ‘adverse selection’. In 1992, prudential norms
and regulations were introduced, to ensure safety and
soundness of banks and impart greater transparency and
accountability in operations. Prudential norms introduced
relate to income recognition, provisioning for bad and doubtful
debts and capital adequacy. Prudential norms have helped to
serve two purposes. One they have brought out the true
position of the banking system's loan portfolio, and two, the
norms have helped to arrest its deterioration. The norms have
been progressively tightened since their introduction.
48

Related to the improving of financial soundness of banks
are the other measures such as recapitalization of public sector
banks on a selective basis by the government, improved
governance in banks and a certain amount of functional
autonomy to the management of public sector banks.
(iii) Strengthening the institutional framework is another key
element of banking reforms. A more competitive environment
has also been created for banks so as to raise their efficiency
and performance. Efficiency is not just operational or
allocational efficiency but functional efficiency as well. Banks
already face competition from non-banking finance companies
(NBFCs), mutual funds and from within the industry itself.
While existing banks have been allowed greater flexibility,
new banks are now being set up in the private sector to provide
increased competition. In January 1993, RBI announced
guidelines for the entry of new private sector banks. Approvals
have been given for the establishment of new foreign banks to
set up their operations in India and existing foreign banks have
been allowed to expand their branch network.
49
(iv) Strengthening of supervisory mechanism is essential for a
sound banking system. There has to be an alert mechanism for
monitoring compliance with prudential norms and directives
of RBI and other regulatory agencies. The system of external
supervision has been revamped by the establishment of the
Board for Financial Supervision, with the operational support
of the Department of Banking supervision of RBI. In tune with
international practices of supervision, a three-tier supervisory
model comprising on-site inspection, off-site monitoring and a
periodical external auditing based on CAMELS (Capital
Adequacy, Asset Quality, Management Earning, Liquidity and
Systems Controls) has been put in place.
Development finance institutions and non-banking
finance institutions were also brought into the regulatory ambit
of RBI. In terms of the Khanna Committee (1995)
recommendations and the amendment in 1997 of the RBI Act,
a three-tier supervisory framework was introduced in respect
of Non-Banking Finance Companies (NBFCs). The CAMELS
approach has been made applicable to NBFCs also. A
50

department of non-banking supervision has been created to
exclusively supervise NBFCs only.
1.6 (D) The Narsimham Committee : 1998
The Government Appointed a second high level "Committee
on Banking Sector Reforms" headed by Shri M. Narsimham, to
review the implementation of the reforms recommended by the
earlier committee and to look ahead and chart the reforms necessary
in the years ahead to make Indian banking strong and better
equipped to compete effectively in a fast-changing environment.
The committee in its report submitted in April 1998, made
wide-ranging recommendations covering various aspects of banking
policy, institutional, supervisory and legislative dimensions. The
committee came out with recommendations with regard to capital
adequacy, asset quality, non performing assets (NPAs), directed
credit, prudential norms, disclosure requirements, asset- liability
management, earnings and profitability, systems and methods in
banks, restructuring including mergers and amalgamations,
reduction of government and RBI shareholding to 33% in the public
sector banks, devising effective regulatory norms and the review of
51

banking sector laws. These recommendations are being
progressively implemented. In follow-up of Narsimham
Committee’s (1998) reference to weak banks in the context of
restructuring of banks, Verma Committee was appointed in 1999
with the specific task of identifying weak public sector banks,
examining their problems and suggesting strategies for restructuring
them. The recommendations of the committee were approved in
principle.
1.6 (E) Reforms and Response :
The progress of banking reforms in the last ten years has been
impressive. The RBI made substantial progress in modifying the
policy framework for reforms. The proportion of banks' resources
pre-empted has been brought down. For instance, the SLR, which
was 37.4% in March 1992, came down to 25% in 2001. Similarly the
CRR, which was 15% in January 1992, was brought down to 5.5%
in December 2001. The Bank Rate was reduced from 12% in
October 1991 to 6.5% in October 2001. The interest rate regime has
been rationalized and in the context of deregulation, banks have been
given considerable operational flexibility and autonomy in April
52

2001, in determining rates with the approval of their boards. To
restore the soundness of public sector banks, capital adequacy ratio
was introduced in 1992 and this was accompanied by re-
capitalization of banks by the government. Between 1992-93 and
1998-99 the government contributed over Rs. 20000 crore to the
capital of public sector banks. New initiatives were taken to
strengthen the supervisory system for banks by moving towards
consolidated supervision and also towards risk based supervision.
The response of the banks to the reforms has been impressive.
The banks have been adjusting very well to the new environment,
though gradually. As at the end of March 2001, 23 out of 27 Public
sector banks had capital adequacy in excess of 10%, the prescribed
ratio being 9%, 15 nationalized banks fell into this category i.e.
exceeding 10%. There has been considerable reduction in non-
performing assets (NPAs). The ratio of gross NPAs to gross
advances, which was 23% in 1992-93 declined to 12.4% by March
2001. Net NPAs to net advances was 6.7% in 2001. Net profit of
public sector banks amounted to Rs. 2,095 crore in 2001 as against a
net lose of Rs. 4705 crore in 1993-94. Deposits mobilized increased
53

four fold between 1992 and 2000, the share of time deposits being
80% in 2000. Credit deployed in 2000 showed a fourfold increase
over 1991. The share of credit to priority sector in total bank credit
was a little over 30%. In 1992-93, the first post-reform year, 12 out
of 27 public sector banks reported net losses; by March 2001 only 2
banks recorded net losses. The striking feature of the banking system
during 1991-2001 is its continuing branch expansion. By March
2001 there were 65,901 branches and the share of rural and semi-
urban branches together was 70% indicating the wide reach of the
banking system. There is little doubt that the benefits of the banking
reforms have been considerable.
1.7 Fourth Phase : Beyond 2002
1.7 (A) New Challenges:
The first phase of financial reforms laid the basis for a sound
banking system. Considerable progress has been made in
implementing the reforms and the banking system is now moving
towards the second phase. Nevertheless, the Indian Banking System
faces several difficult challenges; therefore, the banks have re-orient
their strategies in the light of their own strengths and the kind of
54

market in which they are likely to operate. Some of the challenges
are home grown. e.g. high cost of doing business; level of non-
performing assets; and low levels of customer satisfaction. Some of
the challenges are external e.g. phenomenal growth in the volume of
capital inflows; integration of financial markets across the globe. In
view of these domestic and international developments, it is
necessary to chart out a path for the development of efficient
banking in the new century. There are several areas of concern,
which need to be addressed.
1.7 (B) New Dimension :
Indian Banks will have to operate in a deregulated competitive
financial sector. Competitive pressure is building up for Indian
Banks both from within and from outside. Competition is likely to
intensify in the coming years within the industry, from NBFCs and
from foreign entities. Competition is not just in terms of number of
competitors but in terms of proliferation of innovations, specialized
markets cross border trade in financial services and capital flows.
Our reforms have made progress but we have not become
competitive internationally. We cannot lag behind other countries
55

and we have to transform the Indian Banking System from being a
largely domestic one to a truly international one; and this should
enable India to emerge as an international banking centre.
The worldwide revolution in information and communication
technology (ICT) has become the biggest force of change in
banking. It is a source of productivity growth and facilitates effective
competition. ICT reduces costs, increase volumes and facilitates
customized products. It plays an important role in the payments and
settlement system. Technology has opened up new avenues in
banking for discharging the same functions in a cost effective
manner : 24 hour banking, tele-banking internet banking; E-banking.
The process of technological change is just beginning in Indian
Banking. Even the use of existing technology is at low levels.
Though RBI and the banks have been taking steps in the last
few years, computerization has been mostly directed towards
accounting and related activities, without emphasis on critical areas
relevant to management and customer service and customized
products. The Indian Banking System will have to redouble its
efforts to build the technological infrastructure not only to provide
56

cost-effective and competitive customer service but also to achieve
international recognition and status.
The level of non-performing assets (NPAs), though declining
in recent years, continues to be high by international standards.
NPAs have become a first charge on banks funds for provisioning
and these affect banks performance by eating into their profitability.
The most important condition for improvement in the profitability of
banks is a reduction in the level of NPAs. In fact, it is a pre-
condition for the stability of the banking system. The response to the
efforts at debt recovery and restructuring of assets and other methods
has been slow. The strategies for containing the problem of NPAs
should emphasis the strict enforcement of prudential norms and
requirements, transparency and disclosure and the need for
legislation, which will make the recovery process smoother.
Reforms have to be supported by legal changes for enforceability of
contracts. In any effort to build a banking system of international
stature, reduction in NPAs should be the priority target.
Asset-liability mismatches expose the banks to various types
of risks i.e. risks of illiquidity and insolvency; risks arising from
57

globalization and deregulation. Risk management is a continuous
process of controlling assets and liabilities in terms of size,
maturities and yields. As operations in the financial market become
varied and complex, banks have to equip themselves with a variety
of skills and appropriate technology. The RBI has issued guidelines
to banks in April 1999, for asset-liability management, which would
help the bank management to meet the challenges. Banks are
encouraged to prescribe risk parameters and establish effective
control system. Now the action lies entirely with banks. The general
complaint that customer satisfaction is at low levels needs to be
addressed in all seriousness. The effort should be not only to
preserve the existing circle of clients, both corporate and individual,
but also to enlarge the client base. Banks need to develop customer
relationship, which has come to be known as "Relationship
Banking". It is concerned essentially with maintaining relations with
customers on a continuing basis. This is Customer Relationship
Management (CRM) and it is not just the relationship built around
raising deposits and making loans, though that is important. CRM
goes well beyond that.
58

Two important aspects of CRM are: one that it does not view
customers in totality or in the aggregate and two the devising of
banking products. Regarding the first, customers’ need and demands
and business styles vary; and it is, necessary to consider segments of
customers and build customer profiles to evolve strategies. As
banking products are intangible, CRM involves personal Selling. As
for the second, once the need for segment approach is recognized,
product differentiation becomes important. The present methods of
evolving banking products and then looking around for customers
for those products would not yield the desired results. In short,
banking products should be customer based. Besides, the method of
pricing products should also change from cost plus to product
quality. To raise the level of customer satisfaction, banks will have
to set up CRM groups or CRM departments.
1.7 (C) HRD : Rigidities
Human Resource Development (HRD) is the most important
need for a service industry like banking. The banking industry being
largely in the public sector, certain rigidities developed in HRD
within the banking system. Apart from being the preferred employer
59

for the educated manpower, public sector banks followed a
hierarchical structure, which gives preference to seniority over
performance. Besides, the banks continued, until recently, their
generalist orientation in the matter of recruitment. In the result, the
best talent especially specialist, could not be attracted. The approach
to human resources management in banks will have to change in
tune with the fast changing banking environment at home and
abroad. While it is difficult to bring about radical changes in the staff
structure in the near future, public sector banks can effect
improvements in the existing practices of recruitment, training and
redeployment. The focus must shift from generalist orientation of the
staff to specialist orientation i.e. the ability to imbibe and absorb
technology. Information technology is an area where HRD is now
critical. There is also the urgent need for training for up gradation of
different types of skills. For redeployment, for changing the mindset
and attitudes. It is time that banks revamp their HRD departments
and evolve appropriate policies to make the best use of their primary
asset i.e. human resources.
60

There are issues in supervision and regulation with which the
banks will have to be very much concerned in the days ahead. The
banks should have to prepare for tightening of prudential norms as
the new Basel Accord becomes effective. The earlier Basel Accord
(1988) gave recognition mainly to credit or the principal risk. Since
then a number of events have taken place including the East Asian
Crisis, which brought to light the inadequacy of the 1988
arrangement, as it did not recognize market risks and operational
risks. It also did not distinguish between different types of exposures
with different dimensions of risk. According to the New Capital
Accord, banks would have to provide capital in terms of "Economic
Capital" rather than the minimum regulatory capital. The concept of
economic capital covers all risks embedded in the banks’ balance
sheet. Again in terms of the accord, supervision involves moving
from the transaction-based approach to a risk based approach, to
determine the level of risk that each bank is exposed to. Bank
managements will therefore have to develop internal capital
evaluation according to their risk profile. Risk weights are being
61

constantly revised to take into consideration additional sources of
risk.
1.7 (D) Corporate Governance :
Corporate governance is assuming greater importance in the
banking sector today as a result of certain unhealthy developments in
recent years. The main focus in corporate governance is how to
enhance shareholder value; and this needs to be achieved in a legal
and ethical manner leading to contribution to business prosperity.
The major ingredients of good corporate governance would be
accountability at all levels, transparency and enhancing the image of
the organization in the eyes of the public. Corporate governance
underlines the belief that the public good should be placed above the
private good and that corporate resources cannot be used for
personal benefit. Ethics is part of good governance. Ethics apart,
good governance is concerned with observing rules and regulations,
guidelines and clean corporate practices. Public sector banks have to
pay considerable attention to corporate governance in the context of
deregulation, prudential norms, risk-based supervision and
globalization. As part of the ongoing reforms, bank managements
62

and their boards have been given greater autonomy. It is very
important that greater vigilance over adherence to prescribed rules,
norms and regulations is exercised. It is only then that autonomy for
banks would be meaningful.
The response groups in the banking system are banks. RBI, the
government and the customers; and the onus is on them to raise
Indian Banking to international standards.
63
References
1. Bank Finance to Corporate Sector in India G.C.R. Jaiswal Deep & Deep publication, New Delhi (1988) Page No. 15 to 22 2. Banking Century Prakash Tondon (VIKING) (1988) Page No. 65 to 68
3. Tannon's Banking Law & Practice (India Law House, New Delhi) (1999) Page No. 65
4. Indian Banking- Nature & Problems Vasant Desai (Himalaya Publishing House) (1987) Page No. 87, 88
5. Bank Quest October - December - 2002 Page No. 30 to 37
64

CHAPTER – 2
PERFORMANCE APPRAISAL
2.1) The concept of performance
2.2) The Measurement of performance
2.3) The areas of Performance in case of banking sector.
2.3(i) Service Production & productivity.
2.3(ii) Profitability performance
2.3(iii) Liquidity performance
2.3(iv) Working capital performance
2.3(v) Fixed assets performance
2.3(vi) Fund flow performance
2.3(vii) Social performance
2.4) The concept of appraisal
2.5) The need and importance of performance appraisal
65
2.6) The role of performance appraisal in planning, control and
decision-making.
2.7) The techniques of performance appraisal.
2.7(i) Financial techniques.
2.7(ii) Costing techniques.
2.7(iii) Statistical techniques.
2.8) Ratio analysis as a tool of performance appraisal.
References
66

2.1) The Concept of Performance
The word ‘Performance’ means ‘the performing of an activity,
keeping, in view the achievement made by it’. In other words,
‘Performance’ means ‘the role Played by an arrangement keeping in
view the achievement made by it’. In the context of the banks, it
takes into account the way of their progress.
The opinion of Robert Albans 1 about performance is… “The
word ‘performance’ is used to mean the efforts extended to achieve
the targets efficiently and effectively. The achievement of targets
involves the integrated use of human, financial and natural
resources.”
According to Erich L. Kohlar, 2 “The performance is a general
term applied to a part or to all the conducts of activities of an
organization over a period of time; often with reference to past or
projected costs efficiency, management responsibility or
accountability or the like.”
On the basis of the above definitions, it can be said that the
word ‘Performance’ not only refers to the presentation of something
but it also exhibits the quality and results achieved by the
67

management of an enterprise. It takes into account the
accomplishment of objectives and goals set for an enterprise.
Keeping in view the comparison of the present success with the past.
However in the context of the present study, it covers financial, cost,
personnel and social aspects. Thus we can say that the overall
conclusion of the activities of an enterprise is called ‘Performance’.
2.2) The Measurement of Performance
Concept of Measurement
According to P.C. Tripathi 3, Measurement May be defined as
“The assignment of numerals to characteristics of objects, persons,
states or events accounting to rules. What is measured is not the
object, person, state or event itself but some characteristics of it.
When objects are counted, for example, we do not measure the
object itself but only it’s characteristic of being present. We never
measure people, only their age, height, weight or some other
characteristics.”
According to Michael Mascon 4 “Performance is dependent on
effort, abilities, traits and the individual’s perception of his role.”
68
While measuring the performance of a firm or an enterprise we
need a measuring unit. Human aims and beliefs are mostly realized
through the establishment of diverse kinds of associations. All
associations were established for fulfillment of some goals and
objectives. Thus association needs performance measurement to find
out as to how much is organization has achieved by its course of
action for its targets.
The financial appraisal is a vital unit to measure the
performance of firms. Therefore, financial statements are prepared to
serve the objective.
According to Eldon S. Hendriksen, 5 “The primary focus of
financial reporting is information about an enterprise’s performance
provided by measures of earnings and its components.”
Erich A. Helfert 6 rightly remarks, “The measurement of
business performance is more complex and difficult. Since it must
deal with the effectiveness with which capital is employed, the
efficiency and profitability of operations, and the value and safety of
various claims against the business.”
69

The main object of preparing financial statement is to show the
result achieved by an enterprise through its operations, the revenue
and the expenditure accrued to fulfill that revenues and the actual
financial position for the particular period on a particular date.
In order to analyze financial statement properly, users must
have a basic understanding of the concept and principles underlying
their preparation. Without such an understanding users will not
recognize the limits of financial statements.
In any business enterprise, accounting provides financial data
through income statements, balance sheet and sources and uses of
funds statements. According to Stanley B., 7 “The financial manager
must know how to interpret and use these statements in the
allocation of the firms financial resources to generate the best return
possible in the long run. Finance is the link that integrates the
economical theory with the numbers of Accounting.”
Measurement of performance through the financial statement
analysis provides a good knowledge about the behaviour of financial
variables for measuring the performance of different units in the
70

industry and to indicate the trend of improvement or deterioration in
the organizations.
2.3) Areas of Performance :
There are areas where the performance can be improved by
effective assessment of various activities performed by a business
enterprise in different areas of operations. The areas of operations may be
termed as the areas of performance. The important areas are as follows:-
2.3 (i) Service Production and Productivity
Performance:-
Service Production is the most important area of performance, and
the productivity is the systematic analysis for evaluating the service
production function. The service production data can be performed as
compared to other competitive banking companies of the banking
industry. The service production performance of the banking industry can
be compared for different years with the competitive industries.
The analysis of capacity utilization and component part analysis of
service production can significantly prove the service production
performance of a banking company as a whole.
71

2.3 (ii) Profitability Performance:-
Profitability is the ability of an enterprise to earn profits. The bank
management is vitally interested in profit as it is often used as
performance measure. Measurement of profitability is the overall
measurement of performance. Profit is also important to financial
institutions, bankers and creditors. Moreover, even a layman also assesses
the performance of a business enterprise by its ability to earn profit.
Profitability performance can be made by computing and interpreting
various profitability ratios.
2.3 (iii) Liquidity Performance:-
By checking the fluctuations most probably in current assets,
the researcher can take the estimate of liquidity performance.
2.3 (iv) Working Capital Performance:-
Generally working capital is said to be the excess of current
assets over current liabilities. It is used for regular business
operations consisting of loans and advances, Payment of wages,
direct and indirect expenses, investments, credit granted to
customers and cash on hand. It is lifeblood of each bank.
72

As soon as the heart gets blood, it circulates the same in the
body. In the same manner working capital funds are obtained and
circulated in banking operations. As and when this circulation stops,
the banking business becomes lifeless. So we can say that the
working capital has an important place in the area of performance,
hence working capital performance indicates the adequacy of
working capital in the bank and the efficiency as regards utilization
of working capital. Analysis of working capital statements and
various ratios of its kind may depict required information for the
purpose.
2.3 (v) Fixed Assets Performance:-
According to foulke, Roy A., 8 “Some part of the capital of
every master artificer or manufacturer must be fixed in the
instrument of his trade. ” Usually a firm does not deal in fixed assets,
so they are not trading assets. They are also not acquired for sale.
The amount invested in these assets is realized gradually from every
unit of sales made during the serviceable life of the assets. Analysis
of fixed assets structure, average annual growth of fixed assets,
impact of gross block on sales and operating profit margin and
73

efficiency in the use of fixed assets may depict the performance of
fixed assets. Since the depreciation is directly related to fixed assets,
the study of depreciation and the depreciation provision policy in
using fixed assets can also be useful. As fixed assets in nature are
along term tangible assets, * therefore, they should basically be
financed through long-term sources. In this respect, the ratio of fixed
assets to net worth can be calculated to study financing of fixed
assets. This ratio is very important as it shows that owners have
provided enough funds to finance fixed assets.
2.3 (vi) Fund-flow performance:-
Here a fund-flow statement of bank is prepared to check the
receipt & usage of fund.
2.3 (vii) Social Performance:-
The value of all the resources concerned with the banking
industry is called social performance. They may be men, material,
money and machines. All these resources which are to be used for
the welfare of society and banking industry are included to evaluate
social performance.
74

The social performance of any bank can be evaluated by
considering different parties like government, depositors, financial
institutions, investors, account holders and employees. All these
parties are members of the society. Some important accounting
ratios can be helpful to know the contribution made by the banks to
the society.
2.4) THE CONCEPT OF ‘APPRAISAL’
‘Appraisal’ is just an intelligent application of techniques to
examine, to measure, to interpret, and then to draw some
conclusions. Appraisal is mostly done by the researchers or experts,
who evaluate the problem with their viewpoint.
When we correlate appraisal with performance, we mean to
say ‘Performance Appraisal’. The performance appraisal of any bank
is depended upon the final accounts prepared and published by the
bank. Performance appraisal is a close and critical study of various
measures observed in the operations of a bank. Performance
appraisal of bank is very similar to the concept of checking human
body. As we need medical check up and routine examination for our
75
bodies to maintain our fitness, likewise the performance appraisal of
banks is needed periodically as well as regularly.
Such critical assessments not only draw our attention to
remedy a deteriorating condition but also to show the way and
means to raise the performance to the possible maximum limit. Thus
performance appraisal is useful in two ways. In the banking industry,
‘Performance Appraisal’ involves a wide area of study. The
perspective throughout is on the effective management of banking
resources.
A careful consideration and critical analysis of financial
statements can be a yardstick for the appraisal of performance of a
bank. Generally, financial statements used in any bank are the profit
and loss A/c and the balance sheet. Though the statements of change
in financial position and value added statements are also prepared
and appended to annual reports, they may be considered as
additional financial statement. According to Erich A. Helfert, “The
person who is making the performance appraisal of bank must have
clear ideas in mind that which tests should be applied and for what
76

specific reasons. One must define the view points to be taken, the
objectives of the analysis and possible standards of comparison.”
The data embodied in financial statements are rearranged in
order to facilitate the performance appraisal and the monetary
figures are approximated to the nearest rupee to simplify the process
of appraisal. The comparative data obtained by applying the tools
and techniques of performance appraisal are evaluated, interpreted
and reported in an understandable form. On the basis of all the areas
of performance, the final conclusions are arrived at as a result of the
performance appraisal presented in the form of a report, which
highlights the performance of the banking industry and the banks
concerned.
Performance appraisal as a concept is purely a developmental
tool for a bank. As a developmental tool, it is not as much the final
product or the final assessment that is important as the whole process
of appraisal. The learning opportunity for the appraiser and the
appraisee starts with setting of tasks and targets and manifests in the
whole appraisal procedure such as self-appraisal, appraisal
interviews, final appraisal and grading, developmental planning etc.
77

However, the performance appraisal may not give a correct answer
to every question of doubt it may bring to light, but it can and will
point to the direction in which further enquiries should be made.
Hence, no single attempt can give firm results of appraising banking
performance. Banking conditions may differ by way of location,
type of facilities, product and services, capital structure, capacity,
accounting policies, levels of efficiency and the caliber of bank’s
management. Banking conditions have become more complicated in
the advent of multi-product and multi-banks. An analyst should keep
in mind all these differences at the time of appraising the
performance of various banks.
2.5) THE NEED AND IMPORTANCE OF
PERFORMANCE APPRAISAL
The need and importance of performance appraisal rise from
the viewpoint of different parties, which are actively interested in the
affairs of the banks. These parties are as below:-
2.5 (i) Management
According to Erich A. Helfert, “Managers are responsible for
efficiency, current and long term profit from operations and effective
78

development of capital and other resources in the process.”
Performance appraisal may help the management in evaluating the
effectiveness of it’s own plans and policies. The managements can
measure the effectiveness of it’s own plans and policies, determine
the advisability of adopting new policies and procedures and
document to owners as a result of their managerial efforts by doing
performance appraisal.
2.5 (ii) Employees and Trade Unions
Employees of the banks are interested in the profits and the
financial position of a bank. The employees measure the efficiency
of the bank with the satisfactory profit margin and adequate cash
flow. The employees can compare the past performance and the
present performance of bank by performance appraisal. Even trade
unions of banks use performance appraisal of banks for demanding
increase in wages and facilities.
2.5 (iii) Investors
Investors are the real investors of any enterprise. In case of
banking industry, the investors can know profitability, Productivity
79

& Overall efficiency of the bank by studying performance appraisal
of banks.
2.5 (iv) Depositors :
The depositors, wanted business with the bank, generally
appraise the performance of a bank before depositing the money.
The depositors are interested in the rate of interest offered by
different banks, cash flow and liquidity of the banks, facilities
available against deposits. They can know these each aspect by
referring performance appraisal of banks.
2.5 (v) Government
The government is keen interested in studying the performance
appraisal of banking industry as a whole. By studying the
performance appraisal of banks, the government can assess the
growth of industries and economy. Moreover the government can
take decision about tax structure and incentives for banking industry.
2.5 (vi) Society
In the Society, there are various agencies like media, stock
exchanges, economists, tax consultants and authorities, awakened
citizens who are interested in the performance appraisal of banks.
80
Their interest in the performance appraisal of banks becomes the
interest of the society. The society at large also expects to know
about the social performance such as environmental obligations,
employment avenues and social welfare etc.
2.6) THE ROLE OF PERFORMANCE APPRAISAL IN
PLANNING, CONTROL AND DECISION-MAKING.
Performance appraisal plays an important role in providing so
many useful information to the bank management as it is inevitably
needed for planning, control and decision-making. Decisions always
relate to what has to be done immediately, in near future and in the
long run. For this, the bank managements require various types of
information, both qualitative and quantitative. Performance appraisal
has taken on increasingly the task of providing the quantitative
information. This term also includes provision of such information
as will enable the management to exercise control over the day-to-
day operations with a view to ensuring maximum efficiency and
adherence to the plans of the bank managements. This control is
different from control over property and assets, as it looks at things
from such angles –
81

(A) That the work which had to be done has been done without
loss of time and
(B) That the cost incurred in doing the work is not more and is
within the estimated limits.
Also for planning, control and decision-making on capital
projects, such as expansion and diversification, performance
appraisal provides and examines a great deal of information.
2.7) THE TECHNIQUES OF PERFORMANCE APPRAISAL Mainly there are three techniques of performance appraisal.
The techniques of Performance appraisal
Financial Techniques Cost Techniques Statistical Techniques
1) Ratio Analysis 1) Standard Costing 1) Diagrammatic and graphic presentation. 2)Trend Analysis 2) Budgetary Control 2) Bar Diagrams
i) Common-size
vertical analysis
ii) Common-Size
horizontal analysis
3) Comparative
Statement Analysis
82

i) Comparative Profit and
loss A/c analysis
ii) Comparative balance
sheet analysis
2.8) RATIO ANALYSIS AS A TOOL OF
PERFORMANCE APPRAISAL
A Ratio is simply one number expressed as (i) Percentage (ii)
fraction and (iii) a stated comparison between numbers. According
to Hingorani, 9 “Accounting ratios are relationships expressed in
mathematical terms between figures with a cause and effective
relationship or which are connected with each other in some manner
or the other.” Ratio may be based on figures in the profit and loss
A/c or in the balance sheet or in both. So the Ratio Analysis is the
study of specific relationship and forms the heart of the statements
analysis.
Analysts use ratio to link different parts of the financial
statements in an attempt to find clues about the status of particular
aspects of the banks or any other business. The general procedure in
ratio analysis involves the selection of two items from the financial
83

statements and division of one item into the other to form a ratio. It
points out either the financial condition of a bank or business is good
or bad. It is universally used for appraising the performance of a
bank or business. The interpretation of ratios involves making
comparison over time. Under this, the same ratio or for that matter a
group of ratios is studied over a period of years with the result that
significant trends indicating rise, decline or stability are highlighted.
Sometimes, the average value of a ratio for a number of years in the
past can serve as a standard against which to judge current
performance. The ratios of any given bank or business firm may be
compared with the ratios of other banks or business firms existing in
the same industry. Such an exercise can also be known as ‘Inter-firm
comparison’ or “Inter-bank comparison’. Such comparisons are
usually significant as in most cases, members of the same industry
face the same or similar financial problems. Because of ratio
analysis and comparison, much useful information can usually be
brought under banks or business firms knowledge.
Further, the ratio analysis can be of invaluable aid to the bank
or business firm in the discharge of its basic functions like planning,
84

co-ordination, communication, control and forecasting. By an
analytical study of the past performance and projecting the future, it
assists in communication by conveying information which is
pertinent and purposeful, to those for whom it is meant. It promotes
co-ordination by a study of the efficiency of the bank or any other
business. It paves the way for effective control of banking or
business operations by undertaking an appraisal of both the physical
and monetary targets. It is also true that, no one ratio will give the
entire picture but they do tend to indicate, which cumulatively assists
considerably in appraisal of the financial position and operations of
the organizations.
85

References
1. Managing Towards Accountability for performance Robert Albans (1978) Page No. 13-14
2. A Dictionary for Accounts Erich L. Kohlar Prentice - Hall of India Pvt. Ltd., (New Delhi) 4th edition (1979) Page No. 315
3. Research Methodology P.C. Tripathi Sultan Chand & Sons, New Delhi, (1991)
4. Management individual and Organizational effectiveness Michael Mascon (Harpar & Rowput, New York) (1981) Page No. 331
5. Accounting Theory Eldson S. Hendriksen (Khosla publishing house, New Delhi) (1984) Page No. 136
6. Techniques of Financial Analysis Erich A. Helfert
7. A Hirt foundation of financial management Stanley B. (Homewood guineas: Richard growin inc.) 3rd edition (1984) Page No. 4
8. Practical financial statement analysis Foulke, Roy A. (McGraw hill Book Company inc.)
* In America, the term 'fixed assets' Does not include intangibles Financial Statement Analysis R. L. Gupta & M. Radhaswamy (Sultan Chand & Sons, New Delhi) (1991) Page No. 7
9. Management Accounting Hingorani Sultan Chand & Sons, New Delhi (1973 & 1990)
86
CHAPTER - 3
RESEARCH METHODOLOGY
Introduction:
Banking industry has been changed after reforms process. The
government has taken this sector in a basic priority and this service
sector has been changed according to the need of present days.
Banking sector reforms in India strive to increase efficiency and
profitability of the banking institutions as well as brought the
existing banking institutions face to face with global competition in
globalization process. Now, there has been a rapid expansion in the
number of banks including new private sector and foreign banks. At
present, public sector banks, old private banks, new private banks
and foreign banks are playing on equal field with the important role.
Considering the performance of 2001-2002, all the banks are
87

remarkable. These different types of banks differ from each other in
terms of operations efficiency, productivity, profitability and credit
efficiency. The objective of this study is to identify this difference
within banking groups.
Review of Literature – Problem Identification
Some studies conducted in context with the financial
efficiency or profitability or productivity of Banks are being
reviewed as below.
"Performance of commercial Banks in Kerala" - An Autopsy
by K. P. Mani and Chacko Jose; P. emphasized the significant
changes in the Banking scenario in Kerala after 1986. The Autopsy
performed on the statistics of commercial Banks in Kerala for the
period 1988-1996 revealed that on the front of deposits mobilization,
the state's performance was relatively better while the deployment
side was weak which brought down the credit deposit ratio and
adversely affected the profitability of the Bank.
Banking Infrastructure in Harayana by R. S. Nandal and Arjun
Singh highlighted that in Harayana all commercial, co-operative and
other banking institution have made tremendous progress by opening
88

their new branches in order to boost up the economy of the state. As
a result, the average population covered under the new branches
increased and efficiency of Banks was more utilized in advancing
loan facilities to the people. Deposits have also increased
significantly. But over the passage of time the Credit-Deposit ratio
instead of increasing started decreasing. Thus Banks needed
improvement in their functioning and steps were to be taken to
increase the percentage of their Credit Deposit ratio.
An article on Banking cost structure - Changing with times by
P. R. Bhasker which expressed, that the government was planning
further measures to strengthen the Indian Banking Industry as a part
of on going second phase of reforms but they were nevertheless
inadequate.
"Comparative Performance of Scheduled Commercial Banks
Operating In India : An Econometric Study" - by Subodh Chandra
Garai, Sanjib Chandra Basu and Prabir Ghosh applied multivariate
discriminant analysis technique for differentiating a priori bank
group operating in India using the data of some financial ratios
89

published by the RBI relating to individual banks for the financial
year 1995-96, 1996-97 and 1997-98.
In their study, to consider the efficiency of banks with regard
to management of lending activity, ratios regarding non-performing
assets were given due importance. The discriminate scores, which
combined the properly defined variable taking their weighted
aggregate, were termed as performance scores, in this particular
case. The existence of group difference was tested using parametric
test procedure. Eventually selected banks were ranked on the basis
of their performance for three years and revealed that in general
public sector banks were trailing private sector banks and most
foreign banks were able to score higher runs as compared to other
banks in the group.
"Liquidity, Productivity and Profitability of Foreign Banks and
Domestic Banks in India, A comparative analysis" by D.N. Nayak
described the high rate of growth in the business of foreign banks
during the last decade. The performance of those banks in terms of
other indicators like productivity and profitability made that group of
banks a better performer than all other Domestic Banks in India.
90

The study questioned as to "Does the better performance of
Foreign Banks relative to Domestic Banks indicate that foreign
banks adopt better management practices, policies and procedures
and possess superior organizational skills and know how or are there
any special factors which are responsible for the relatively good
performance of foreign banks ?
"Determinants of profitability of SBI group other Nationalized
Banks and Foreign Banks in India" by Saveeta and Satish Verma.
They examined the profitability of commercial banks. they have
depicted a declining trend in profitability since 1969, showing a
comparatively better performance of foreign banks.
Their study was based on time series data from 1971-1996 and
have analyzed the data using a number of statistical tools like ratios,
averages, percentages etc. The performance of SBI group and other
nationalized banks improved during 1981-1990 and it further
improved after the initiation of the financial sector reforms in 1991
and the profitability of SBI group was observed to be higher as
compared to that of foreign banks.
91

Report on the Working Group headed by Shri M.S. Verma on
Restructuring Weak Public Sector Banks for which the group
observed the good performance of some strong banks and that it was
neutralized by the persistent under performance of a handful of
banks. The banks specific efficiency levels varied and therefore to
identify the factors responsible for weaknesses they stressed on
solvency, earning capacity and profitability of banks Seven
parameters were selected covering the above mentioned three major
areas in order to assess a bank's strength or weakness.
V. B. Angadi and V. J. Devaraj in their paper discussed the
main factors contributing to difference in productivity and
profitability ratios of the Banks were interest earning, Banking
services, funds management other than income, expansion of
Banking business, difference in the cost of working fund and social
Banking.
A paper on the recovery from NPAS - Emerging Challenges
by Dr. V. S. Kaveri was an attempt to review the developments not
only in the recovery and prevention of NPAS but also suggested
92

future strategies for management of NPAS to in improve the
profitability of Banks.
A. K. Vashisht presented the 'Performance Appraisal of public
sector Commercial Banks in India' where he evaluated the
performance of public sector commercial banks in light of factors
like branch expansion priority sector advances, credit, deposits, net
profit and DRI advances.
J. Oza made an international comparison of productivity and
profitability of Public Sector Banks in India and studied the
substantial growth in productivity per employee.
J. Panda and G. S. Lall in their paper attempted to develop
internal management techniques for improving the profitability of
Indian Banks. They identified certain important factors, which
influence profitability i.e., quality of advances information system,
organizational set up, development of funds and branch expansion
policy.
'New Competition, Deregulation and emerging changes in
India Banking by B. N. Anantha swamy was an article which was an
93

analysis of the Comparative Performance of different Bank groups
over the period of 1995-96 to 1999-2000.
S. G. Hamdekar studied the productivity aspect of the
Regional Rural Banks. He studied the operational efficiency;
profitability and productivity in Rural oriented Bijapur Gramin Bank
and concluded stating that the operating profitability of the Gramin
Banks has been very poor.
S. Singh in his paper profitability of Commercial Banks in
India has enumerated several factors, which have been creating
stress and strain for the Banking system. These factors according to
him were a continuous increase in SLR, CRR, persistent branch
expansion in rural areas, unfavourable changes in the deposit mix,
growing incidence of industrial sickness, emphasis on social goals
etc.
Vipan shah has analyzed the Cost and Efficiency in Banking in
order to evaluate the working of Banks at the branch level in view of
the declining profitability and increasing operational costs. This
study attempted to contribute the understanding of factors
94

influencing costs, earnings and efficiency of banking services at the
branch level.
A paper on "Assessing Financial system Stability Efficiency
and Structure at the Bank of England" by Andrew C. Haldane, Glenn
Hoggarth and Victoria Saporta described some f the techniques used
by the Banks of England to monitor financial stability risks in the
United Kingdom. it has also described some policy work to improve
the infrastructure for managing those risks.
Micheal Woodford at Princeton University has discussed
Financial Market Efficiency and the Effectiveness of Monetary
Policy. in this paper, the description was about a possible conflict
between increasing microeconomic efficiency and preserving
macroeconomic stability. Issues like reducing the role of commercial
banks, advantage of payment of interest on the balances on Federal
Reserve System, the disappearances of required reserves and Central
Bank control of interest rates have been studied.
A Ph.D. thesis on Appraisal of Financial performance of State
Banks of India by Vijaykumar Bhatasana examined the Financial
Performance of State Bank of India in the light of factors like
95
profitability, employee productivity, branch productivity and other
social issues like priority sector lending.
Though there have been many works carried out in the area of
financial performance, profitability, productivity of various banks,
there is no specific study made to compare the financial efficiency of
different types of banks. Hence, the study is a sincere effort to
enable some contribution to the existing literature and to suggest
some measures to improve the overall financial efficiency of banks
in Gujarat State.
Ms. Swati Katira in her Ph.D. thesis has presented comparative
Analysis of financial efficiency of the selected banks.
Many of earlier studies for instance swami & subramanyam
(1993) attempted to focus on profitability within public sector banks
in an attempt to set benchmarks for laggards. Das (1999) compares
performance among public sector banks for three years in post
reform period 1992, 1995 and 1998. He notes that while there is a
welcome increase in emphasis on non-interest income, banks have
tended to show risk adverse behaviour by opting for risk free
investment over risky loans. Sankar and Das (1997) compare
96

performance of public, private and foreign banks for the year 1994-
95 by using measures of profitability, productivity and financial
management. They find PSBs comparing poorly with others.
Bhattacharya (1997) studied the impact of the limited liberalization
initiated before the deregulation of the nineties on the performance
of the different categories of banks, using Data Envelopment
Analysis. They covered 70 Banks in the period 1986-91. Ram
Mohan (2000) studied the performance of public sector banks with
private & foreign banks for the period of 1994-95 to 99-2000
regarding profitability and credit efficiency. Beside that the survey
of top banks has been made by ‘Financial Express’ for the year
2000-01 regarding the financial performance. But, according to the
researcher, the whole banking sector is not covered and if it is
covered, it is only for the particular year. The five years study for the
whole banking sector divided into five groups has not been found so
far. So, it was the need felt by the researcher to focus this topic.
Swami & Subramanyam (1993) attempted to focus on
profitability within public sector banks in an attempt to set
benchmarks for laggards. Das (1999) compares performance among
97

public sector banks for three years in post reform period 1992, 1995
and 1998. He notes that while there is a welcome increase in
emphasis on non-interest income, banks have tended to show risk
adverse behavior by opting for risk free investment over risky loans.
Sankar and Das (1997) compare performance of public, private and
foreign banks for the year 1994-95 by using measures of
profitability, productivity and financial management. They find
PSBs comparing poorly with others. Bhattacharya (1997) studied the
impact of the limited liberalization initiated before the deregulation
of the nineties on the performance of the different categories of
banks, using Data Envelopment Analysis. They covered 70 Banks in
the period 1986-91. Ram Mohan (2000) studied the performance of
public sector banks with private & foreign banks for the period of
1994-95 to 99-2000 regarding profitability and credit efficiency.
Furqan Qamar has studied about the profitability and resource use
efficiency in commercial banks. Besides that the survey of top banks
has been made by ‘Financial Express’ for the year 2000-01
regarding the financial performance.
98

The optimism that the process of liberalization, privatization
and globalization would transform the otherwise archaic and morose
banking organizations into a multi-modal, technology-savvy,
customer-centric, growth and profit-oriented modern financial
intermediaries, has also been marred with the fear that the
conventional public sector banks would not be able to face the
onslaught of competition from the Indian and foreign private sector
banks and would be pushed to the brinks of bankruptcy. These fear
wee found to be true by studies on performance and profitability of
public sector banks but the research evidences in this regard have
been only sporadic and often contradictory. It has been reported that
in the post-reform period the public sector banks were looser in
terms of their market share in deposit mobilization and credit
deployment and were saddled with relatively higher share in the
non-performing assets [Chansarkar, 1999, Shirai, 2002]. Share of
public sector banks in deposit base which as high as 91 percent in
1991, has already shrunk to 82 percent in 2001 and most of these
losses have been in favour of the private sector banks whose deposit
base has skyrocketed from a mere 4 percent in 1991 to 12 percent in
99

2001. Interestingly, however, the share of foreign banks in the
deposit base during the corresponding period has increased only
marginally, from 5 percent to 6 percent [Shirai, 2002]. Employee
morale and motivation in the public sector banks have also been
reported to be low resulting into lower business and profitability per
employee in such banks [Charansarkar, 1999]. In contrast, studies
have also shown that the public sector banks have continued to enjoy
the confidence, faith and trust of common public and are still
considered to be their favoured banking destination (Qamar, 2003).
There have been strong perceptions that the public sector and old
private sector banks have an edge over the new private sector and
foreign banks [Ramamoorthy, 1998] and that they have the potential
to compete successfully, particularly if they could leverage
technology. There are also views that the public sector banks have
been doing quite well except for the political intervention [Saikia].
Gaps:
According to the researcher, the whole banking sector is not
covered in some studies or if it is covered, the period of study has
been of a particular year or till the year 2000. But, the five years
100

study from the year 1997-1998 to 2001-2002 for the whole banking
sector divided into five groups has not been found so far. So, the
need felt by the researcher to focus on the latest development and
performance till the year 2002. The topic is selected as under :
The Topic :
“The study of financial performance of Banking Sector of
India.”
Research Methodology :
The research methodology of the selected topic follows in
these dimensions :
(1) Population of The Study :
In this study, whole the census is covered for Indian banking
sector. All the banks in Indian banking sector are divided in
following groups from the year 1997-1998 to 2001-2002 :
Banking group No. of banks SBI group 8 Other nationalized banks 19 Old private sector banks 23 New private sector banks 08 Foreign banks 42
Total 100
101

Within the last two years, some mergers and acquisitions have
been made in foreign banks, which are considered by the researcher
for the study. Some foreign banks, which have very limited
functions and branches in India are ignored from the study.
(2) The Period of The Study :
The study is covered for five years from the year 1997-1998 to
2001-2002. This period is selected by the researcher for the study
because it is a period after the submission of The Narsimham
committee report II. The second phase of reforms process can be
covered during this time period.
(3) Scope of The Study :
This study is based on census of nationalized, private and
foreign banks in India for the period of five years from 1997-1998 to
2001-2002. It covers the evaluation of financial performance
regarding profitability, credit efficiency, operational efficiency and
productivity of banks. The study is limited for only financial
performance covering ten ratios. The tool for appraisal of financial
performance is ratio analysis. So, the scope of the study is still very
wide.
102

(4) Investigative questions :
This study focuses the functional aspects of the banks as well
as it cleans the financial consideration for efficiency measurement.
Through this study, operational efficiency and commercial viability
is considered by the researcher. The researcher would like to address
the following questions :
A) Either the banking sector in India is operationally efficient or
not.
B) Either the profitability of all the groups of banks is consistent
and different or not.
C) Either there is any difference in productivity of all the groups
or not.
D) The credit efficiency is differing within the banking groups or
not.
5) Objectives of the study :
The broader objectives of the study are as under :
I) To known the banking sector and its current trends.
II) To evaluate operational efficiency in all the five banking
groups.
103
III) To examine the profitability of banks.
IV) To compare the credit efficiency of banks.
V) To compare the productivity of banks.
VI) To evaluate the best banking group regarding financial
performance.
(6) Hypothesis :
The broader hypothesis are as under :
A) There is no significant difference in operational efficiency
among all the banking groups.
B) There is no significant difference in profitability trends
within all the five banking groups.
C) There is no significant difference regarding credit
efficiency among all the banking groups.
D) There is no significant difference regarding Productivity of
all the banking groups :
E) There is no significant difference regarding overall
performance of all the banking groups.
104

(7) Nature of the study :
It is a functional study and it focuses on the functional aspects
of the bank. No sampling technique is required as the researcher
wants to take a census for the study.
(1) Data Collection :
This study is based on secondary data. For this purpose, the
researcher has used the data published in IBA Bulletins, Annual IBA
Bulletins for March 2002 and 2003, the survey pubished in financial
express for top banks and other related websites. Moreover, the
journals, articles, reports and surveys have been referred.
(2) Data Analysis :
A census is selected by the researcher, but for the comparison
between the groups, some statistical tests have been used according
to the nature and objectives of the study. The collected informations
are suitably classified and tabulated with the help of statistical tools
like ratios, trends, co relation, regression, T test, F test, Z test, anova
and X2 test. The conclusions have been drawn on the basis of 5%
level of significance.
105
Chapter plan :
I) Indian Banking System – An Overview
II) Performance appraisal – a conceptual framework.
III) Research methodology.
IV) Analysis of operational efficiency of Indian banking sector.
V) Analysis of profitability of Indian banking sector.
VI) Analysis of credit efficiency and productivity of Indian
banking sector.
VII) Summary, Findings and Suggestions
106

References
1. Research Methodology C.R. Kothari 2. Research Methodology K.R. Sharma
National Publishing House, (Jaipur & New Delhi) (2002)
3. 'India's Best Banks' The Financial Express (Survey - 2002) 4. 'Bank quest' December - 2002 5. 'Charted Financial Analyst' June-1997, December-1998. 6. 'IBA Bulletin' September-2002,
November-2002, February-2003.
7. 'Best Banks 2002' Business India
(December-2002) 8. www.rbi.org.in
107

CHAPTER – 4
ANALYSIS OF OPERATIONAL EFFICIENCY OF
INDIAN BANKING SECTOR
4.1 INTEREST INCOME TO AVERAGE WORKING
FUNDS RATIO
4.1.1 Interest Income To Average Working Funds Ratio for SBI Group during 1997-98 to 2001-02.
4.1.2 Interest Income To Average Working Funds Ratio for other nationalized banks during 1997-98 to 2001-02.
4.1.3 Interest Income To Average Working Funds Ratio for old private sector banks during 1997-98 to 2001-02.
4.1.4 Interest Income To Average Working Funds Ratio for new private banks during 1997-98 to 2001-02.
4.1.5 Interest Income To Average Working Funds Ratio for foreign banks during 1997-98 to 2001-02.
4.1.6 Interest Income To Average Working Funds Ratio for all the five banking groups during 1997-98 to 2001-02.
108

4.2 NON-INTEREST INCOME TO AVERAGE WORKING FUNDS RATIO
4.2.1 Non-Interest Income to Average Working Funds Ratio for SBI Group during 1997-98 to 2001-02.
4.2.2 Non-Interest Income To Average Working Funds Ratio for other nationalized banks during 1997-98 to 2001-02.
4.2.3 Non-Interest Income To Average Working Funds Ratio for old private sector banks during 1997-98 to 2001-02.
4.2.4 Non-Interest Income To Average Working Funds Ratio for new private banks during 1997-98 to 2001-02.
4.2.5 Non-Interest Income To Average Working Funds Ratio for foreign banks during 1997-98 to 2001-02.
4.2.6 Non-Interest Income To Average Working Funds Ratio for all the five banking groups during 1997-98 to 2001-02.
4.3 CAPITAL ADEQUACY RATIO (CAR) / CAPITAL TO RISK ASSETS RATIO (CRAR) / CAPITAL TO RISK ADEQUACY RATIO (CRAR)/ CAPITAL TO RISK-WEIGHTED ASSETS RATIO
(CRWAR)
4.3.1. Capital Adequacy Ratio for SBI Group during 1997-98 to 2001-02
4.3.2. Capital Adequacy Ratio for other nationalized banks during 1997-98 to 2001-02.
109

4.3.3. Capital Adequacy Ratio for old private sector banks during 1997-98 to 2001-02.
4.3.4. Capital Adequacy Ratio for new private banks during 1997-98 to 2001-02.
4.3.5. Capital Adequacy Ratio for foreign banks during 1997-98 to 2001-02.
4.3.6. Capital Adequacy Ratio for all the five banking groups during 1997-98 to 2001-02.
References
110

This chapter deals with the operational efficiency of banks,
which is one of the key parameters for evaluating the financial
performance. There are hundred banks at present in Indian Banking
Sector. All these banks are divided into five groups as discussed
earlier. To evaluate operational efficiency of each group, three ratios
have been observed for the period of five years. Each group is
having the bunch of banks, so, an individual performance of each
bank has been discussed here from the point of operational
efficiency ratios. The purpose of this analysis is to know the
operational efficiency of each group and to observe which is the best
group according to operation functions. The ratios, formula and
terms defined for this operational efficiency are as under :
4.1) Interest Income as % to Average Working Funds :
This ratio deals with the major income of interest in banks. But
only the interest income is not important, how the average working
funds, is also important. The efficiency will be measured according
to this ratio. If this ratio is high, the operational efficiency will be
also good. The formula of this ratio is –
111

Interest Income 2 100
Average Working Funds
Total Interest Income (TII)
The sum total of discount, interest income from loans and
advances, interest income from investments. Interest income from
balances with RBI and other interest inflows. There is a strong
rationale behind include income from aggregate investments in TII.
And the rationale is that all interest income streams are Policy-
driven as far as a bank is concerned. A bank investigating in
securities is quite unlike a corporate entity investigating its surplus
cash in other corporate securities.
Total Interest Income to Average Working Fund (TII /
AWF)
Expressed as a percentage, this ratio shows a bank’s ability to
leverage its average total resources in enhancing its mainstream
operational interest income.
112

Average Working Funds (AWF) :
The average of the working funds at the beginning and at the
close of an accounting year. In this study, it is the average of the
working funds as on the date of the last two balance sheets i.e. 31
March 2000 and 31 March 2001.
Working Funds (WF) :
Working funds are total resources (total liabilities or total
assets) of a bank as on a particular date total resources include
capital, reserves and surplus, deposits, borrowings, other liabilities
and provisions. A higher AWF shows a bank’s total resource
strength. There is a school of theory, which maintains that working
funds are equal to aggregate deposits plus borrowings. However, is
defined working funds more Pragmatically and in Consonance with
capital adequacy calculations to include all resources, not just
deposits and borrowings, for, all these resources are put to work.
113

4.2) Non-Interest Income as % to Average Working
Funds
The other operational income of a bank is Non-Interest
Income, which includes commission, brokerage, gains on
revaluation of assets etc. This ratio also represents the operational
efficiency of a bank. The operational efficiency of a bank will be
high if this ratio is high. The formula of this ratio is –
Non-Interest Income 2 100
Average Working Funds
Non-Interest Income (NII)
This is the other income of a bank. It includes items such as
exchange commission, brokerage, gains on sale and revaluation of
investments and fixed assets, and profits from exchange transactions.
Since Non-Interest Income includes, among other things, items such
as profit on sale of assets, it is certainly preferable to replace both
the ratios Interest Income to AWF and Non-Interest Income to AWF
with fund based income to AWF and non-fund based income to
AWF.
114

However, given the state of disclosures in the annual reports of
Indian banks and given the unwillingness of banks in parting with
such information, the ratios interest income to AWF and Non-
Interest Income to AWF have been retained in the appraisal scheme.
Non-Interest Income to AWF (NII / AWF)
This ratio denotes a bank’s ability to earn from non-
conventional sources. In a liberalized environment, this ratio
assumes greater significance for; it mirrors a bank’s ability to take
full advantage of its operational freedom. Some foreign banks term
non-interest income as other income.
4.3) Capital Adequacy Ratio :
The Basle Committee report on the Convergence of Capital
and Standards, 1988, passed a directive that a Capital Adequacy
Ratio (CAR) of 8% was necessary for banks operating International.
Subsequently, The Narasimham Committee recommendation that all
Indian Banks should achieve a capital adequacy of 8% by March
1996 was implemented with successful results by the reserve Bank
of India (RBI). The capital Accord of Basle Committee was
115

reviewed and amended in 1996. The Narasimham Committee on
Banking Sector Reforms proposed an increase in the CAR of Banks.
Consequently, a CAR target of 9% by March 2000 was fixed. The
RBI has proposed to increase CAR to 10% by March 2002. The New
Capital Adequacy Framework issue by Basle Committee in June,
1999 is yet another step towards the strengthening of capital
adequacy in Banks.
Capital to Risk Assets Ratio
Capital adequacy is indicated by a minimum numerical ratio
which the Banks are expected to maintain to ensure stability and
strength. International l prudential norms stipulate the use of Capital
to Risk Assets Ratio (CRAR) as a measure of capital adequacy.
CRAR is the ratio of capital funds to risk weighted assets (both on
and off balance sheet) expressed as a percentage.
Capital Funds
CRAR = ––––––––––––––––––– 2 100 Risk Weighted Assets
116

All assets in the balance sheet, including off balance sheet
items are given an artificial weight and their total is compared to the
net worth of the Bank.
Capital Funds
The Capital Funds will comprise Tier-I capital (shareholders
equity and retained profits) and Tier-II capital (supplementary
capital) and Tier-III capital (subordinated debt with a minimum
maturity of two years - This criteria is suggested by Basle-II
committee, which will come into effect by March-2005).
Risk weighted assets
Funded Risk Assets i.e., on balance sheet items and Non-
Funded Risk Assets, i.e., off - balance sheets items are ranked from
less risky to more risky categories. BIS has prescribed five
categories of risk weights viz., 0,10,20,50,100. The higher the risk,
greater the weightage. Funded Risk Assets are those appearing in the
balance sheet excluding equity investments in subsidiaries and
intangible assets and losses. Non - funded assets are contingent
liabilities viz., guarantees letters of credit, forward exchange
contract, etc.
117

Risk weights of various Assets
Sl. No. Assets Risk weight (%)
1 Cash in hand 0
2 Balance with RBI 0
3 All claims on Banks 20
4 Investments:
a. Investments in Govt. &
Govt. Guaranteed Securities* 2.5
b. Investments in Bonds/Debentures
of Public Financial Institutions 20
c. All other Investments 100
5 Advances:
a. Advances Guaranteed by Govt.** 0
b. Advances to staff 100
c. Advances against Deposits 0
d. Advances against life policies, IVP, KVP 0
e. Advances to Banks / Guaranteed by
Banks 50
f. Advances Guaranteed by DICGC / ECGC 50
118
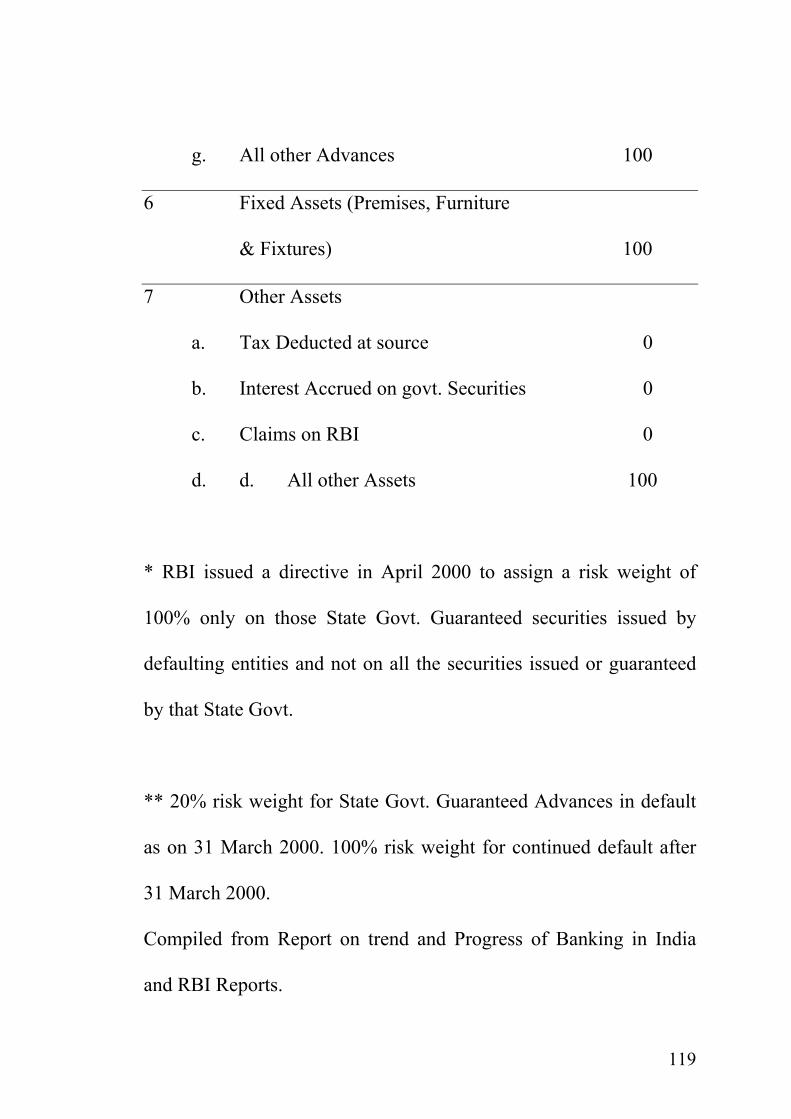
g. All other Advances 100
6 Fixed Assets (Premises, Furniture
& Fixtures) 100
7 Other Assets
a. Tax Deducted at source 0
b. Interest Accrued on govt. Securities 0
c. Claims on RBI 0
d. d. All other Assets 100
* RBI issued a directive in April 2000 to assign a risk weight of
100% only on those State Govt. Guaranteed securities issued by
defaulting entities and not on all the securities issued or guaranteed
by that State Govt.
** 20% risk weight for State Govt. Guaranteed Advances in default
as on 31 March 2000. 100% risk weight for continued default after
31 March 2000.
Compiled from Report on trend and Progress of Banking in India
and RBI Reports.
119

New Framework of Capital Adequacy Ratio :
Basle I Committee had recommended CAR framework for
credit risk only during 1988, which RBI had implemented during
1992. Subsequently the market risk for investment in securities,
including govt. Securities, was implemented in India w.e.f. March
31, 2000. Meanwhile Basle II, June 1999, suggested capital
adequacy not only for credit and market risk but also for operational
risk also. The new framework will come into effect by 2005 and
replace the earlier framework of 1988. In terms of the new
framework, the capital fund will comprise Tire I (shareholders'
equity and retained profits), Tire II (subordinated deft of 5.7 year
tenures) and Tire III capital (subordinated debt with a minimum
maturity of 2 years). Risk on the other hand, would comprise Credit
Risk + Market Risk + Operational Risk. Operational Risk is the risk
of direct or indirect loss resulting from inadequate or failed internal
processes, people and system or from external events. So far, the
measurement of operational risk has not been quantified but the
committee has suggested a 20% risk weight for the operational risk.
TO monitor the operational risk, the information technology and
120

MIS systems are expected to play very important role. The risk
management is expected to lend to lower capital requirement but to
implement risk management, banks will have to invest heavily in
technology.
CRAR of 9% by March 2000, was the norm set by RBI. All
Public Sector Banks (PSBs) expect one attained 9% CRAR. 21 out
of 24 Old Private Sector Banks, all 8 New Private Sector Banks and
all 42 Foreign Banks in India achieved the norm.
The RBI hoped that all Banks achieve 10% CRAR by March
2002. But 22 PSBs, 19 Old Private Sector Banks, 7 New Private
Sector Banks and 37 Foreign Banks had CRAR excess of 10% by
March 2000 itself.
All the banks except one have achieved capital adequacy.
Banks in India are becoming competitive and sound in their financial
health. But the CRAR has a few limitations, besides the weightage
of assets. The risk weightage of government guaranteed assets are
121
minimal. This necessitates constant review of CRAR as a measure of
banking health. In order to ensure greater capital adequacy and
strength of banks the RBI has come out with Prompt Corrective
Action (PCA) framework which complies with the Core Principles
of BIS. PCA is based on three parameters viz., CRAR, Net Non
performing Assets (NPA) and Return on Assets (RoA). Each
parameter has trigger points with discretionary ad mandatory,
preventive and corrective actions under each trigger point.
Table 4.1.1 to 4.1.5 indicates the interest income to average
working funds ratio according to individual bank of each banking
group. Table 4.1.6 is the indicator of average performance regarding
interest income of Indian Banking sector. The Analysis can be
shown as under :
After discussing the ratios and the terms, the actual
performance according to operation efficiency in each group
analyzed here.
122

4.1) Interest Income to Average Working Funds Ratio :
Table 4.1.1 Interest Income to Average Working Funds for SBI Group
during 1997-98 to 2001-02 Interest Income as % to Average
Working Funds Banks 1997-1998
1998-1999
1999-2000
2000-2001
2001-2002
AVG
(%)
PUBLIC SECTOR BANKS I.1. State Bank of India (SBI) 8.86 8.60 8.17 8.70 8.56 8.58II. ASSOCIATES OF SBI
2 State Bank of Bikaner & Jaipur 10.88 10.64 10.09 10.15 8.73 10.103 State Bank of Hyderabad 10.29 10.34 10.13 9.23 8.67 9.734 State Bank of Indore 10.63 10.79 10.06 9.89 8.83 10.045 State Bank of Mysore 10.71 10.35 10.33 9.96 9.38 10.156 State Bank of Patiala 11.18 9.38 10.76 10.76 8.68 10.157 State Bank of Saurashtra 8.93 9.36 10.56 10.50 8.99 9.678 State Bank of Travancore 10.11 8.42 10.38 10.18 8.82 9.58
Average of State Bank Group [I+II] 10.20 9.74 10.06 9.92 8.83 9.75[Source : IBA bulletin March 2002, 2003]
Tale 4.1.1 shows the interest income ratio to average working
funds for SBI group. This group includes the SBI main and associate
Bank’s ability, to leverage its average total resources ending in its
operational interest income.
(By observing this table, one can see that) in 1997 – 98,
highest ratio gained by state Bank of Patiala that is 11.87%, but the
123

lowest of SBI main equivalent to the ratio of SBS in 1997-98 the
average to whole the group in II/AWF is 10.20%.
In 1998-99 the average goes down because of weak ratio of
Bank of Patiala & SBI main, that shows less ability to leverage again
in 1999-2000, this ratio goes higher than the previous year. The
consistency in all the associate banks regarding interest income to
awf. But still in this year SBI main’s performance looks week. In the
year 2000-2001, the overall average goes down again and it falls by
0.14% camp to the previous year. And in the year, 2001-2002, the
average of SBI group regarding this ratio is slightly reduced because
of the lower interest rates as per RBI.
By seeing this table, it can be said that in each year associate
Banks’ performance for II/AWF is higher than the SBI main. The
average of associate Banks in higher than SBI main in each year.
This table shows a good ability to leverage its resources.
124

Table 4.1.2
Interest Income to Average Working Funds for other nationalised Banks during 1997-98 to 2001-02
Interest Income as % to Average Working Funds Banks
1997-1998
1998-1999
1999-2000
2000-2001
2001-2002
AVG
(%)
III. NATIONALISED BANKS 9 Allahabad Bank 9.81 9.68 9.64 9.77 9.62 9.70
10 Andhra Bank 11.00 10.64 10.71 10.66 9.69 10.5411 Bank of Baroda 10.09 9.96 8.83 9.09 8.40 9.2712 Bank of India 9.10 9.16 8.61 9.23 8.03 8.8313 Bank of Maharashtra 10.42 10.42 10.47 10.41 9.31 10.2114 Canara Bank 10.01 10.64 9.54 9.70 8.82 9.7415 Central Bank of India 10.76 10.68 10.56 10.43 8.85 10.2616 Corporation Bank 10.95 10.12 10.63 10.68 8.24 10.1217 Dena Bank 11.33 10.98 10.38 9.69 9.07 10.2918 Indian Bank 8.31 8.02 8.59 8.58 7.58 8.2219 Indian Overseas Bank 9.64 9.49 9.28 9.47 8.95 9.3720 Oriental Bank of Commerce 11.10 11.20 10.90 10.60 9.42 10.6421 Punjab & Sind Bank 10.29 10.27 9.99 9.83 9.20 9.9222 Punjab National Bank 9.98 10.03 10.12 9.84 9.12 9.8223 Syndicate Bank 9.52 9.98 9.79 9.84 9.08 9.6424 Uco Bank 8.96 9.33 9.09 9.71 8.10 9.0425 Union Bank of India 10.47 10.50 10.46 10.49 9.05 10.1926 United Bank of India 10.40 10.20 9.46 10.07 8.93 9.8127 Vijaya Bank 10.29 10.49 10.53 10.34 9.53 10.24
Average of 19 Nationalised Banks [III] 10.13 10.09 9.87 9.92 8.89 9.78[Source : IBA bulletin March 2002, 2003]
Table 4.1.2 shows the II / AWF ratio for other 19 nationalized
Banks. By studying the table, some Banks one looking try consistent
in the higher ratio of II / AWF. These banks are, CBI, Oriental Bank
of commerce, Andhra bank, corporation Bank & Dena Bank. These
banks have maintained a good ratio during these five years.
125

But there are some banks who have the lower ratio in the
period of years, and these are – Indian Bank and UCO bank whose II
/ AWF ratio is between 8 to 9%. The average performance can be
seen between 8 to 10% is there in some banks like Bank of India,
Indian overseas Bank, Allahabad Bank, etc.
The overall average for ability to leverage goes consistently
from the year 1997-98 to 2001-02 this result indicates the lower
interest in come trend. May be it is so because of the interest rates
fell down in every year according to RBI.
Table 4.1.3 Interest Income to Average Working Funds for Old Private Sector Banks
during 1997-98 to 2001-02 Interest Income as % to Average
Working Funds Banks 1997-1998
1998-1999
1999-2000
2000-2001
2001-2002
AVG
(%)
PRIVATE SECTOR BANKS 1 Bharat Overseas Bank Ltd. 10.61 9.96 10.30 10.22 7.93 9.802 City Union Bank Ltd. 11.21 10.77 11.19 10.49 9.51 10.633 Development Credit Bank Ltd. 10.80 11.76 10.72 11.28 9.01 10.714 Lord Krishna Bank Ltd. 13.32 12.23 10.74 10.09 8.36 10.955 SBI Commercial & International Bank Ltd. 8.43 11.39 9.40 9.94 8.07 9.456 Tamilnad Mercantile Bank Ltd. 11.81 11.35 11.30 11.32 10.12 11.187 The Bank of Rajasthan Ltd. 10.80 9.84 10.33 10.44 9.42 10.178 The Benares State Bank Ltd. 10.07 9.15 9.26 8.88 - 9.349 The Catholic Syrian Bank Ltd. 12.60 11.36 10.83 10.49 9.68 10.99
10 The Dhanalakshmi Bank Ltd. 12.26 11.44 10.94 10.52 9.59 10.9511 The Federal Bank Ltd. 13.19 11.97 11.70 11.54 10.28 11.7412 The Ganesh Bank of Kurundwad Ltd. 12.45 12.06 12.02 11.30 10.05 11.5813 The Jammu & Kasmir Bank Ltd. 10.97 11.06 10.57 10.51 9.21 10.4614 The Karnataka Bank Ltd. 12.77 11.50 11.20 10.89 9.57 11.19
126

15 The Karur Vysya Bank Ltd. 12.57 12.21 12.36 11.69 9.44 11.6516 The Lakshmi Vilas Bank Ltd. 11.39 11.03 10.94 10.39 9.53 10.6617 The Nainital Bank Ltd. 11.27 10.86 10.58 10.40 9.55 10.5318 The Nedungadi Bank Ltd. 12.52 12.27 11.69 9.80 9.85 11.2319 The Ratnakar Bank Ltd. 12.23 12.25 11.76 11.61 9.39 11.4520 The Sangli Bank Ltd. 10.99 10.41 10.46 11.05 8.00 10.1821 The South Indian Bank Ltd. 13.11 12.24 11.83 11.55 9.39 11.6222 The United Western Bank Ltd. 10.75 10.74 10.67 10.52 9.59 10.4523 The Vysya Bank Ltd. 11.07 10.68 10.63 10.54 8.61 10.31
Average of 23 Private Sector Banks [I] 11.62 11.24 10.93 10.67 9.28 10.75[Source : IBA bulletin March 2002, 2003]
There are 23 old private sector Banks in banking industry.
Table 4.1.3 shows the Interest Income / AWF ratio of these 23 banks
during 1997-98 to 2001-02. All the banks’ performance regarding
this ratio, is excellent, the overall average in 1997-98 is 11.59%, 99-
2000 is 10.67% and 2001-02 is 9.36% for achieving this much good
ratio; each bank has given a good result. Each bank has maintained
the higher ratio and consistency in the period of 5 years. Some of
these banks have achieved excellent ratios like. The Federal Bank
Ltd., The south Indian Bank Ltd., The Catholic Syrian Banks Ltd.,
The Karur Vysya Bank Ltd., The Nedungadi Bank Ltd., etc.
127

This table shows that the old private sector Bank has got more
interest income in each year with reference to their average working
funds. The result shows a positive sign.
Table 4.1.4 Interest Income to Average Working Funds for New Private Banks
during 1997-98 to 2001-02 Interest Income as % to Average
Working Funds Banks 1997-1998
1998-1999
1999-2000
2000-2001
2001-2002
AVG
(%)
NEW PRIVATE SECTOR BANKS
24 Bank of Punjab Ltd. 10.72 10.57 10.82 11.20 9.35 10.5325 Centurion Bank Ltd. 11.26 14.61 10.95 10.24 11.63 11.7426 Global Trust Bank Ltd. 12.20 11.27 11.59 10.35 9.91 11.0627 HDFC Bank Ltd. 4.52 4.17 4.74 3.89 7.16 4.9028 ICICI Bank Ltd. 11.15 11.22 10.59 10.07 2.07 9.0229 IDBI Bank Ltd. 12.06 11.45 11.25 10.89 7.67 10.6630 Indusind Bank Ltd. 12.49 12.32 10.99 10.59 6.96 10.6731 UTI Bank Ltd. 10.88 11.71 10.81 10.07 8.21 10.34
Average of 8 New Private Sec.Banks [I] 10.66 10.92 10.22 9.66 7.87 9.87[Source : IBA bulletin March 2002, 2003]
Table 4.1.4 indicates the II / AWF for the new private sector
banks. This group is having 8 private sector banks. By studying this
table, we can see that the overall average is lower because of only
one Bank’s weak ratio. That is HDFC Bank. HDFC has acquired a
very much lower ratio of interest income related to AWF and it falls
only 4 to 5 % during all the five years. Global Trust Bank Ltd.,
128

Indusind Banks Ltd. and IDBI Bank Ltd. has achieved a good ratio
of interest income, may be because of industrial advances. Most of
the Banks have got consistency in this ratio. Naturally from 1997-98
to 2001-02 it will go down slightly because of policy matter of lower
interest rates.
The overall average is however can said as a good average,
consistently lower than the previous year because of lower interest
rates offered by the banking sector.
Table 4.1.5 Interest Income to Average Working Funds for Foreign Banks
during 1997-98 to 2001-02 Interest Income as % to Average
Working Funds Banks 1997-1998
1998-1999
1999-2000
2000-2001
2001-2002
AVG
(%) FOREIGN BANKS
1 ABN-Amro 9.64 10.68 10.35 10.73 10.16 10.312 Abu Dhabi Commercial 9.74 8.59 10.98 6.54 10.03 9.183 American Express 10.50 10.54 10.96 9.88 8.60 10.104 Arab Bangladesh 5.98 7.85 7.92 7.88 6.26 7.185 Bank International l Indonesia 12.26 11.65 9.85 5.59 4.26 8.726 Bank Muscat International l - 3.34 4.88 9.89 10.99 7.287 Bank of America 12.07 10.39 7.72 10.63 8.90 9.948 Bank of Bahrain and Kuwait 12.45 12.01 12.43 11.65 8.55 11.429 Bank of Ceylon 11.07 10.75 13.70 9.88 8.32 10.74
10 Barclays 10.22 11.61 9.16 8.97 4.60 8.9111 BNP Pariba 11.95 11.87 11.26 10.99 7.54 10.7212 Chinatrust Commercial 11.28 11.12 11.96 11.21 13.35 11.78
129
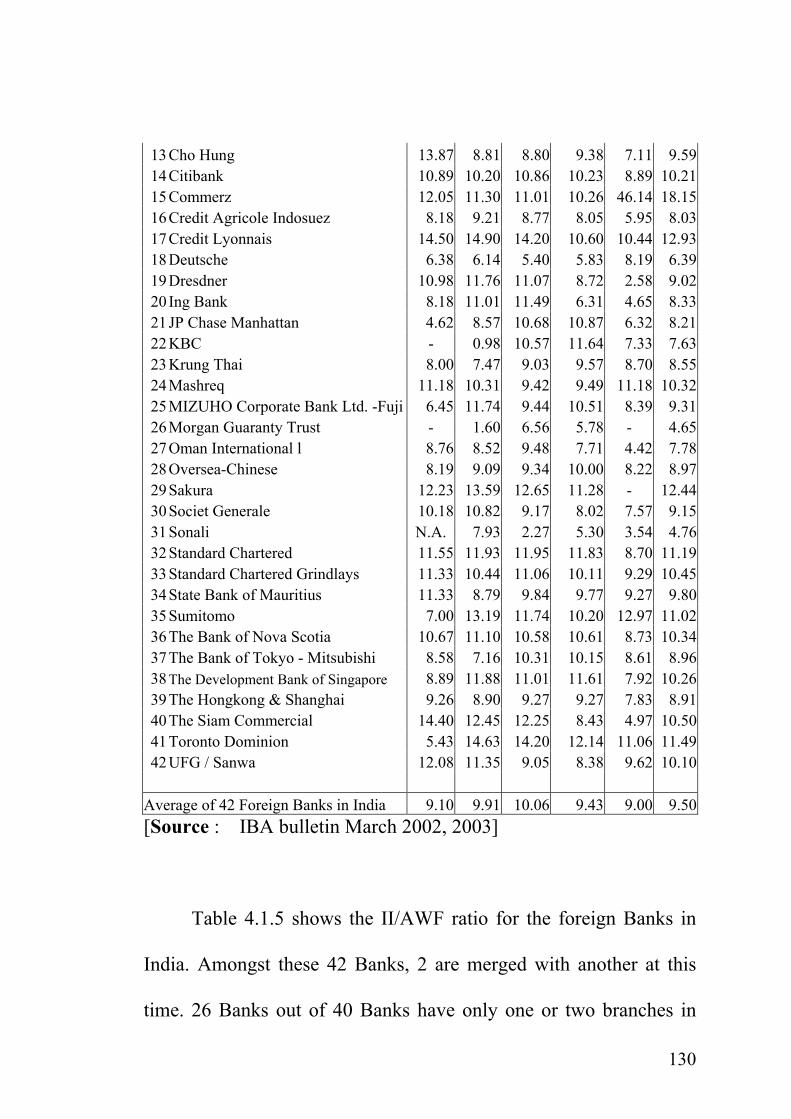
13 Cho Hung 13.87 8.81 8.80 9.38 7.11 9.5914 Citibank 10.89 10.20 10.86 10.23 8.89 10.2115 Commerz 12.05 11.30 11.01 10.26 46.14 18.1516 Credit Agricole Indosuez 8.18 9.21 8.77 8.05 5.95 8.0317 Credit Lyonnais 14.50 14.90 14.20 10.60 10.44 12.9318 Deutsche 6.38 6.14 5.40 5.83 8.19 6.3919 Dresdner 10.98 11.76 11.07 8.72 2.58 9.0220 Ing Bank 8.18 11.01 11.49 6.31 4.65 8.3321 JP Chase Manhattan 4.62 8.57 10.68 10.87 6.32 8.2122 KBC - 0.98 10.57 11.64 7.33 7.6323 Krung Thai 8.00 7.47 9.03 9.57 8.70 8.5524 Mashreq 11.18 10.31 9.42 9.49 11.18 10.3225 MIZUHO Corporate Bank Ltd. -Fuji 6.45 11.74 9.44 10.51 8.39 9.3126 Morgan Guaranty Trust - 1.60 6.56 5.78 - 4.6527 Oman International l 8.76 8.52 9.48 7.71 4.42 7.7828 Oversea-Chinese 8.19 9.09 9.34 10.00 8.22 8.9729 Sakura 12.23 13.59 12.65 11.28 - 12.4430 Societ Generale 10.18 10.82 9.17 8.02 7.57 9.1531 Sonali N.A. 7.93 2.27 5.30 3.54 4.7632 Standard Chartered 11.55 11.93 11.95 11.83 8.70 11.1933 Standard Chartered Grindlays 11.33 10.44 11.06 10.11 9.29 10.4534 State Bank of Mauritius 11.33 8.79 9.84 9.77 9.27 9.8035 Sumitomo 7.00 13.19 11.74 10.20 12.97 11.0236 The Bank of Nova Scotia 10.67 11.10 10.58 10.61 8.73 10.3437 The Bank of Tokyo - Mitsubishi 8.58 7.16 10.31 10.15 8.61 8.9638 The Development Bank of Singapore 8.89 11.88 11.01 11.61 7.92 10.2639 The Hongkong & Shanghai 9.26 8.90 9.27 9.27 7.83 8.9140 The Siam Commercial 14.40 12.45 12.25 8.43 4.97 10.5041 Toronto Dominion 5.43 14.63 14.20 12.14 11.06 11.4942 UFG / Sanwa 12.08 11.35 9.05 8.38 9.62 10.10
Average of 42 Foreign Banks in India 9.10 9.91 10.06 9.43 9.00 9.50[Source : IBA bulletin March 2002, 2003]
Table 4.1.5 shows the II/AWF ratio for the foreign Banks in
India. Amongst these 42 Banks, 2 are merged with another at this
time. 26 Banks out of 40 Banks have only one or two branches in
130

India. There are major 14 banks in these group of which
performance can be attended. No. 1 to 14 are the major foreign
Banks. In this group there is no consistency in other Banks.
Sometimes it is very much high, sometimes low. But seeing the
performance of Bank of America, & credit lyonnais are excellent
except one year. The weak ratio of Deutsche Bank reflects in the
overall average, this banks ratio is between 5 to 6% which or
II/AWT in this group is 8.83% (1997-98), 9.91% (1998-99), 10.06%
(1999-2000), 9.43%(2000-01), and in (2001-02).
The trend shows a little bit improvement in leverage ability
during these five years.
Table 4.1.6 Interest Income to Average Working Funds for all the five Banking groups from
1997-98 to 2001-02(in percent) 1997-1998
1998-1999
1999-2000
2000-2001
2001-2002
Avg (%)
Banking Groups
1 SBI 10.20 9.74 10.06 9.92 8.83 9.752 Other Nationalized Banks 10.13 10.09 9.87 9.92 8.89 9.783 Old Private Banks 11.62 11.24 10.93 10.67 9.28 10.754 New Private Banks 10.66 10.92 10.22 9.66 7.87 9.875 Foreign Banks 9.10 9.91 10.06 9.43 9.00 9.50 AVG (%) 10.34 10.38 10.23 9.92 8.78 9.93
131

0
2
4
6
8
10
12
1997-1998
1998-1999
1999-2000
2000-2001
2001-2002
SBI Other Nationalized Banks Old Private Banks New Private Banks Foreign Banks
In above Table no. 4.1.6 and chart year wise average of
Interest Income to Average Working Funds ratio is showing almost
diminishing trend it is seen so due to diminishing interest rates. Old
private sector banks group leads the banking sector of India during
all the five years (1997-98 to 2001-02). While foreign banks are
found less interested in Interest Income as their other sources of
income life brokerage, commissions are sound.
132

Interest Income to Average Working Funds Ratio
Hypothesis Testing
The researcher wanted to find out that if there is any
significant difference regarding the performance related to Interest
Income to Average Working Funds Ratio among all the five banking
groups during 1997-98 to 2001-02 or not. This was tested as under.
Null Hypothesis :
There is no significant difference regarding the Interest
Income to average working funds Ratio among all the five banking
groups during 1997-98 to 2001-02.
H0 = µ1 = µ2 = µ3 = µ4 = µ5
H1 = µ1 ≠ µ2 ≠ µ3 ≠ µ4 ≠ µ5
ANOVA TABLE
Interest Income to Average Working Funds
Source of Variable
SS DF MS F Ratio 5% F Limit (From table F)
Between Sample 2471.01 (5-1) = 4 61775 1009.83 F (4,20) 2.87 Within Sample 12.23 (25-5) = 20 0.61
The above Anova table reveals the table value of F at 5% level
of significance is 2.87, and the calculated value of F is 1009.83.
133

Hence the calculated value is more than the table value of F, so Null
hypothesis is rejected. It means that there is a difference among all
the five banking groups regarding the Interest Income to Average
Working Funds ratio. The performance of all the banking groups
regarding this ratio is different.
4.2) Non-Interest Income to Average Working Funds
Ratio :
Table No. 2.1 to 2.6 indicate about Non-Interest Income to
Average Working Funds Ratio for each bank and each group. The
analysis is as under:
Table 4.2.1 Non Interest Income to Average Working Funds for SBI Group
during 97-98 to 01-02 Non Interest Income as % to
Average Working Funds Banks 1997-1998
1998-1999
1999-2000
2000-2001
2001-2002
AVG
(%)
PUBLIC SECTOR BANKS I.1. State Bank of India (SBI) 1.57 1.48 1.31 1.34 1.20 1.38II. ASSOCIATES OF SBI
2 State Bank of Hyderabad 1.69 1.61 1.82 1.57 1.93 1.723 State Bank of Patiala 1.17 1.22 1.59 1.36 1.65 1.404 State Bank of Travancore 1.53 1.26 1.74 1.50 2.73 1.755 State Bank of Bikaner & Jaipur 2.08 1.81 1.99 1.92 2.25 2.016 State Bank of Mysore 1.69 1.78 2.12 1.86 1.53 1.807 State Bank of Indore 1.89 1.94 2.41 2.27 1.85 2.078 State Bank of Saurashtra 1.66 1.42 1.73 1.54 1.40 1.55
Average of State Bank Group [I+II] 1.66 1.57 1.84 1.67 1.82 1.71[Source : IBA bulletin March 2002, 2003]
134

The Non-Interest Income includes exchange commission,
brokerage, gains on sale & revaluation of investment & fixed assets,
profits from exchange etc. the NII/AWF ratio shows the ability to
earn from non-conventional sources. If this ratio is higher, it
indicates the good sign for non-conventional earning performance. It
is an operational parameter for performance of a Bank.
Table 4.2.1 shows the Non-Interest Income to Average
Working Funds (NII/AWF) ratio in percentage for SBI group, which
includes 7 associate Banks. By observing this table, the highest
overall average is in 1999-2000 that is 1.84%. The Non-Interest
Income is higher in State Bank of Bikaner & Jaipur, state Banks of
Mysore & State Bank of Indore. However, the overall average is
seen lower because of the performance of SBI main and state Bank
of Patiala. The overall average during these five years is however,
consistent and is above 1.50% and below 2%. This shows the
average performance regarding the Non-Interest Income. If it is
more than 2%, it is a very good sign of operational efficiency.
135

Table 4.2.2 Non Interest Income to Average Working Funds for other nationalized Banks
during 97-98 to 01-02 Non Interest Income as % to Average
Working Funds Banks 1997-1998
1998-1999
1999-2000
2000-2001
2001-2002
AVG
(%)
III. NATIONALISED BANKS 9 Canara Bank 1.60 1.43 1.64 1.58 1.55 1.56
10 Punjab National Bank 1.59 1.23 1.43 1.31 1.45 1.4011 Bank of Baroda 1.31 1.20 1.16 1.12 1.40 1.2412 Bank of India 1.34 1.14 1.43 1.50 1.58 1.4013 Central Bank of India 1.31 1.14 1.24 1.15 1.43 1.2514 Union Bank of India 0.87 0.96 0.94 0.88 1.98 1.1315 Indian Overseas Bank 1.01
1.04 0.99 1.03 1.14 1.0416 Syndicate Bank 1.24 1.30 1.23 0.99 1.62 1.2817 Oriental Bank of Commerce 1.10 1.00 1.00 1.00 1.87 1.1918 Indian Bank 1.15 0.98 1.25 1.29 1.66 1.2719 Uco Bank 1.19 1.03 1.14 1.27 1.50 1.2320 Allahabad Bank 1.46 1.27 1.34 1.15 1.47 1.3421 United Bank of India 1.10 0.80 0.78 0.86 1.65 1.0422 Andhra Bank 1.40 1.48 1.73 1.16 1.34 1.4223 Bank of Maharashtra 0.98 0.99 1.32 1.36 0.87 1.1024 Corporation Bank 1.54 1.48 1.79 1.73 1.86 1.6825 Dena Bank 1.71 1.13 1.38 1.10 1.12 1.2926 Vijaya Bank 1.04 1.14 1.03 1.19 1.73 1.2327 Punjab & Sind Bank 1.41 1.17 1.37 1.32 1.17 1.29
Average of 19 Nationalised Banks [III] 1.28 1.15 1.27 1.21 1.49 1.28[Source : IBA bulletin March 2002, 2003]
Table 4.2.2 shows the NII/AWF in percentage for other 19
nationalized Banks. The weaker performance in operational
efficiency can be seen in Union Bank of India, United Bank of India
and Bank of Maharashtra which is below 1% in most of the years.
Compared to this, Canara Bank, Punjab National Bank, Bank of
India, Corporation Bank & Dena Bank have gotten good Non-
Interest Income. Other Banks’ performance is average and
136

consistent. However the overall average is below 1.50% in every
year, which is very much lower to SBI Group. Surprisingly a sudden
swing must be considered in case of Union Bank of India in 2001-02.
Table 4.2.3 Non Interest Income to Average Working Funds for Old Private Sector Banks
during 1997-98 to 2001-02 Non Interest Income as % to
Average Working Funds Banks 1997-1998
1998-1999
1999-2000
2000-2001
2001-2002
AVG
(%)
PRIVATE SECTOR BANKS 1 Bharat Overseas Bank Ltd. 1.18 1.27 1.47 1.66 2.35 1.592 City Union Bank Ltd. 1.95 1.98 2.11 1.64 2.15 1.973 Development Credit Bank Ltd. 4.20 1.70 2.73 1.41 2.29 2.474 Lord Krishna Bank Ltd. 1.77 1.73 2.09 1.72 4.37 2.345 SBI Commercial & International Bank Ltd. 2.00 2.19 2.34 1.53 2.28 2.076 Tamilnad Mercantile Bank Ltd. 2.22 1.94 1.81 1.54 1.46 1.797 The Bank of Rajasthan Ltd. 1.40 1.23 1.38 1.33 2.02 1.478 The Benares State Bank Ltd. 1.83 1.04 1.66 1.52 - 1.519 The Catholic Syrian Bank Ltd. 1.61 1.08 1.61 1.62 2.84 1.75
10 The Dhanalakshmi Bank Ltd. 1.34 1.08 1.65 1.54 3.11 1.7411 The Federal Bank Ltd. 1.75 1.57 1.76 1.57 2.17 1.7612 The Ganesh Bank of Kurundwad Ltd. 1.03 0.97 0.66 0.49 1.44 0.9213 The Jammu & Kasmir Bank Ltd. 1.19 0.69 1.25 0.79 1.75 1.1314 The Karnataka Bank Ltd. 1.42 1.13 1.40 1.49 3.10 1.7115 The Karur Vysya Bank Ltd. 3.09 1.47 1.71 1.37 2.05 1.9416 The Lakshmi Vilas Bank Ltd. 2.56 2.37 2.94 2.44 3.02 2.6717 The Nainital Bank Ltd. 0.50 0.51 0.59 0.44 0.52 0.5118 The Nedungadi Bank Ltd. 2.03 1.42 1.69 1.60 4.44 2.2419 The Ratnakar Bank Ltd. 1.32 1.05 1.95 1.73 3.92 1.9920 The Sangli Bank Ltd. 2.49 1.47 1.71 1.04 1.96 1.7321 The South Indian Bank Ltd. 1.00 1.13 1.88 1.55 2.11 1.5322 The United Western Bank Ltd. 3.11 1.82 3.08 1.03 2.97 2.4023 The Vysya Bank Ltd. 2.39 1.64 2.50 1.47 2.62 2.12
Average of 23 Private Sector Banks [I] 1.89 1.41 1.82 1.41 2.50 1.81[Source : IBA bulletin March 2002, 2003]
137

Table 4.2.3 shows the NII/AWF ratio in percentage for the old
private sector 23 banks. By seeing this table, the overall average falls
from 1.89 to 1.47 in 1998-99, again it goes up to 1.82 % in 1999-
2000 and it goes down to 1.41% in 2000-01. The ratio is seen
exceptionally higher in 2001-02 of 2.5 %. This exceptional ratio
improves the overall scenario of five years duration.
The overall average reflects better Non-Interest Income
performance of United Western Bank Ltd. in 1997-98 and 1999-
2000 respectively. Moreover in 1997-98, the highest ratio of 4.20%
of Development Credit Bank Ltd. is seen, may be there due to big
profit in exchange or revaluation at assets. Very weak performance
related to this ratio is of The Nainital Bank Ltd., which is below
0.60%
The overall average is much higher than the nationalized banks
except SBI group in every year. Here there are some banks, which
are able to show the brighter performance merely in a single year
and are able to show better average. Such banks are Development
Credit Bank Ltd., Lord Krishna Bank Ltd., The Bank of Rajasthan
138

Ltd., The Catholic Syrian Bank Ltd., The Dhanalaxmi Bank Ltd.,
and The Karnataka Bank Ltd.
Table 4.2.4 Non Interest Income to Average Working Funds for New Private Banks
during 97-98 to 01-02 Non Interest Income as % to
Average Working Funds Banks 1997-1998
1998-1999
1999-2000
2000-2001
2001-2002
AVG
(%)
NEW PRIVATE SECTOR BANKS 24 ICICI Bank Ltd. 3.65 1.84 2.41 1.78 3.02 2.5425 HDFC Bank Ltd. 2.71 1.93 1.92 1.43 1.71 1.9426 UTI Bank Ltd. 2.59 1.46 2.04 1.85 3.14 2.2227 Global Trust Bank Ltd. 3.93 3.36 3.06 1.90 1.40 2.7328 Indusind Bank Ltd. 3.51 1.72 2.50 1.69 0.55 1.9929 Centurion Bank Ltd. 1.61 1.65 2.20 1.83 1.85 1.8330 IDBI Bank Ltd. 1.43 1.12 1.46 1.41 1.81 1.4531 Bank of Punjab Ltd. 2.99 2.42 1.90 1.41 2.89 2.32
Average of 8 New Private Sec.Banks [I] 2.80 1.94 2.19 1.66 2.05 2.13[Source : IBA bulletin March 2002, 2003]
Table 4.2.4 shows NII/AWF ratio for new 8 private sector
Banks. The overall average is highly impressive in this sector
because of its operational efficiency in exchange commission of
brokerages.
During the year 1997-98, ICICI Bank Ltd. Global Trust Bank
Ltd. and Indusind Bank Ltd. have gotten excellent performance of
above 3.50%. During 1998-99, only global Trust Bank has
maintained this ratio and during 1999-2000, again global Trust Bank
139

is the best. But in 2000-01, whatever may be the cause, every bank
has the NII/AWF ratio of below 2%. During this year, global Trust
Bank has the good performance of 1.90%. Thus among all the new
private sector banks, as per as the Non-Interest Income / Average
Working Funds Ratio is concerned, Global Trust Bank Ltd. is the
best bank.
However, it can be seen that the overall average in operational
efficiency to earn from non-conventional resources is higher that old
private sector Banks in this group. It is also higher than nationalized
banks.
Table 4.2.5 Non-Interest Income to Average Working Funds for Foreign Banks
during 97-98 to 01-02 Non Interest Income as % to
Average Working Funds Banks 1997-1998
1998-1999
1999-2000
2000-2001
2001-2002
AVG
(%) FOREIGN BANKS
1 ABN-Amro 3.75 2.84 2.14 2.26 2.63 2.722 Abu Dhabi Commercial 1.75 1.47 1.51 0.81 0.46 1.203 American Express 4.05 3.53 5.14 6.80 6.47 5.204 Arab Bangladesh 2.68 3.01 2.55 2.91 2.82 2.795 Bank International l Indonesia 1.57 2.83 2.62 1.95 1.51 2.106 Bank Muscat International l - 0.92 2.30 1.61 1.65 1.627 Bank of America 2.57 1.22 2.39 1.74 2.32 2.058 Bank of Bahrain and Kuwait 0.87 1.60 2.37 1.87 2.94 1.939 Bank of Ceylon 4.13 2.83 4.63 3.18 2.36 3.43
10 Barclays 4.79 1.93 0.62 1.45 5.45 2.8511 BNP Pariba 2.18 2.37 2.22 1.76 1.12 1.9312 Chinatrust Commercial 1.26 0.13 0.45 0.64 1.34 0.76
140
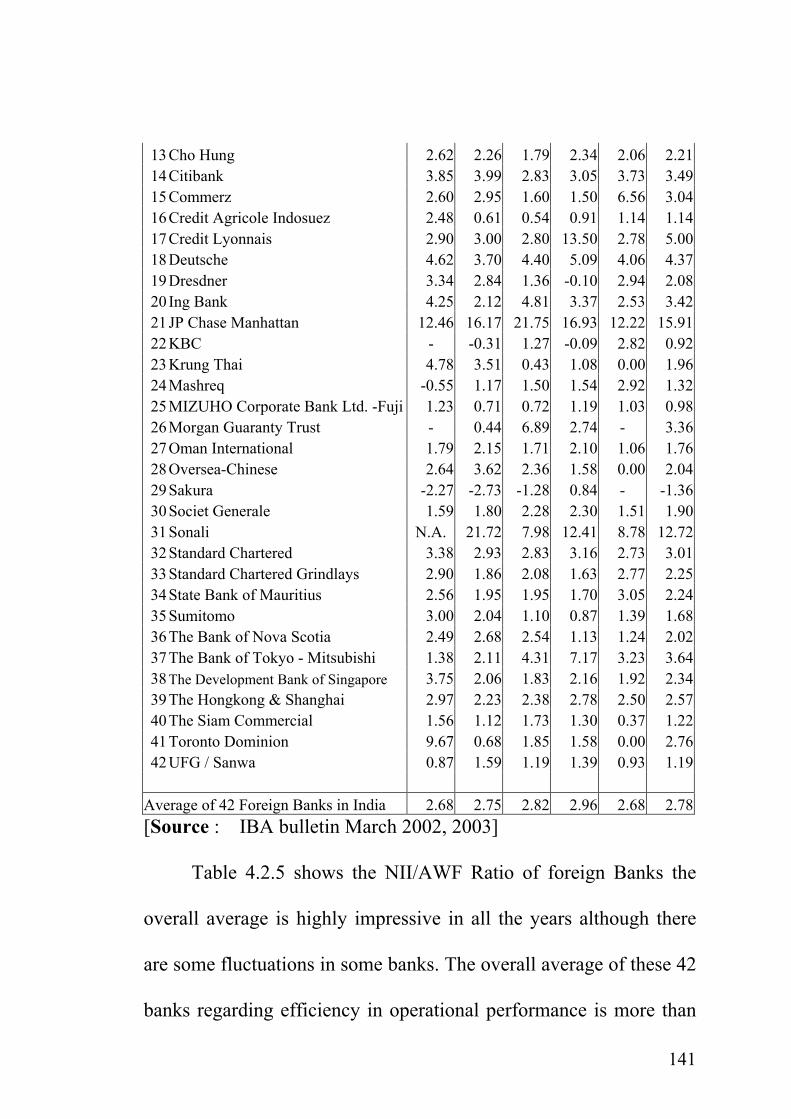
13 Cho Hung 2.62 2.26 1.79 2.34 2.06 2.2114 Citibank 3.85 3.99 2.83 3.05 3.73 3.4915 Commerz 2.60 2.95 1.60 1.50 6.56 3.0416 Credit Agricole Indosuez 2.48 0.61 0.54 0.91 1.14 1.1417 Credit Lyonnais 2.90 3.00 2.80 13.50 2.78 5.0018 Deutsche 4.62 3.70 4.40 5.09 4.06 4.3719 Dresdner 3.34 2.84 1.36 -0.10 2.94 2.0820 Ing Bank 4.25 2.12 4.81 3.37 2.53 3.4221 JP Chase Manhattan 12.46 16.17 21.75 16.93 12.22 15.9122 KBC - -0.31 1.27 -0.09 2.82 0.9223 Krung Thai 4.78 3.51 0.43 1.08 0.00 1.9624 Mashreq -0.55 1.17 1.50 1.54 2.92 1.3225 MIZUHO Corporate Bank Ltd. -Fuji 1.23 0.71 0.72 1.19 1.03 0.9826 Morgan Guaranty Trust - 0.44 6.89 2.74 - 3.3627 Oman International 1.79 2.15 1.71 2.10 1.06 1.7628 Oversea-Chinese 2.64 3.62 2.36 1.58 0.00 2.0429 Sakura -2.27 -2.73 -1.28 0.84 - -1.3630 Societ Generale 1.59 1.80 2.28 2.30 1.51 1.9031 Sonali N.A. 21.72 7.98 12.41 8.78 12.7232 Standard Chartered 3.38 2.93 2.83 3.16 2.73 3.0133 Standard Chartered Grindlays 2.90 1.86 2.08 1.63 2.77 2.2534 State Bank of Mauritius 2.56 1.95 1.95 1.70 3.05 2.2435 Sumitomo 3.00 2.04 1.10 0.87 1.39 1.6836 The Bank of Nova Scotia 2.49 2.68 2.54 1.13 1.24 2.0237 The Bank of Tokyo - Mitsubishi 1.38 2.11 4.31 7.17 3.23 3.6438 The Development Bank of Singapore 3.75 2.06 1.83 2.16 1.92 2.3439 The Hongkong & Shanghai 2.97 2.23 2.38 2.78 2.50 2.5740 The Siam Commercial 1.56 1.12 1.73 1.30 0.37 1.2241 Toronto Dominion 9.67 0.68 1.85 1.58 0.00 2.7642 UFG / Sanwa 0.87 1.59 1.19 1.39 0.93 1.19
Average of 42 Foreign Banks in India 2.68 2.75 2.82 2.96 2.68 2.78[Source : IBA bulletin March 2002, 2003]
Table 4.2.5 shows the NII/AWF Ratio of foreign Banks the
overall average is highly impressive in all the years although there
are some fluctuations in some banks. The overall average of these 42
banks regarding efficiency in operational performance is more than
141

2.50% and it is a very good sign. This shows that the foreign banks
are earning income from other sources more than interest may be the
customers getting the services from these banks are not of loans but
of exchanges and other services.
In this table, the main feature is that, some banks have gotten
negative results. Mashreq and Sakura Bank, which are merged with
Sumitomo now, KBC Bank and Dresdner Bank have gotten ratios
which are negative in some years. No doubt, the performance of
Mashreq Bank has been extremely improved after 1997-98. But
Sakura performing poorly may be a reason of merger of Sumitomo.
The strong and good performance regarding this ratio is of
American Express, Citibank, Hongkong & Shangai Bank, Standard
Chartered ABN-Amro, Deutsche Bank (the highest), American
express Banks etc. The excellent foreign bank in NII/AWF Ratio is
J.P.Chase Manhattan Bank. Which has achieved NII/AWF Ratio of
12.46%, 16.17%, 21.75%, 16.93% & 12.22% respectively from
1997-98 to 2001-02. For a year only in 1998-99, Sonali Bank had
provided inspiration to other banks to perform like it with the ratio
of 21.72%.
142

The cause of Negative NII/AWF Ratio may be more Non-
Interest payment than Non-Interest Income.
Table 4.2.6 Non-Interest Income to Average Working Funds for all the five Banking groups
from 1997-98 to 2001-02 (in percent) 1997-1998
1998-1999
1999-2000
2000-2001
2001-2002
AVG (%) Banking Groups
1 SBI 1.66 1.57 1.84 1.67 1.82 1.712 Other Nationalized Banks 1.28 1.15 1.27 1.21 1.49 1.283 Old Private Banks 1.89 1.41 1.82 1.41 2.50 1.814 New Private Banks 2.80 1.94 2.19 1.66 2.05 2.135 Foreign Banks 2.68 2.75 2.82 2.96 2.68 2.78
AVG (%) 2.06 1.76 1.99 1.78 2.11 1.94
0
0.5
1
1.5
2
2.5
3
1997-1998
1998-1999
1999-2000
2000-2001
2001-2002
SBI Other Nationalized Banks Old Private Banks New Private Banks Foreign Banks
143

Above table no. 4.2.6 and above chart show Non-Interest
Income to Average Working Funds in % for all the banking groups
for five years from 1997-98 to 2001-02. As Interest Income was very
low in case of foreign banks, here Non-Interest Income, which is the
main source of Income of foreign banks is seen very attractive. The
culture of earning more interest, attitude of ignoring subsidiary
services is clearly reflected in above table & chart as Non-Interest
Income in case of SBI Group and other nationalized banks is seen
less in the most cases comparatively.
Non-Interest Income to Average Working Funds Ratio
Hypothesis Testing
The researcher wanted to find out that if there is any
significant difference regarding the performance related to Non-
Interest Income to Average Working Funds Ratio among all the five
banking groups during 1997-98 to 2001-02 or not. This was tested as
under.
144

Null Hypothesis :
There is no significant difference regarding the Non-Interest
Income to Average Working Funds among all the five banking
groups in the period during 1997-98 to 2001-02.
H0 = µ1 = µ2 = µ3 = µ4 = µ5
H1 = µ1 ≠ µ2 ≠ µ3 ≠ µ4 ≠ µ5
Anova Table Source of Variable
SS DF MS F Ratio 5% F Limit (From table F)
Between Sample 100.13 (5-1) = 4 25.03 295.91 F (4,20) 2.87 Within Sample 1.69 (25-5) = 20 0.08
Since the calculated value of F is 295.91, which is more than
the table value 2.87 at 5% level of significance, the null hypothesis
is rejected. It says that there is a significant difference between all
the five banking groups regarding non-interest income to average
working funds ratio.
4.3) Capital Adequacy Ratio (in Percent)
Capital adequacy Ratio is a solid indicator of Bank’s long-
term solvency. The RBI has bound the minimum 9% CAR based on
Tier. I/II capital. It is a Ratio between Net Worth and risk-weighted
assets. If this ratio is higher, it means that the bank is well
capitalized vis-à-vis its perceived risks.
145

Table 4.3.1 Capital Adequacy Ratio for SBI Group during 1997-98 to 2001-02
Capital Adequacy Ratio (in Percent) Banks
1997-1998
1998-1999
1999-2000
2000-2001
2001-2002
AVG
(%) PUBLIC SECTOR BANKS I.1. State Bank of India (SBI) 14.58 12.51 11.49 12.79 13.35 12.94II. ASSOCIATES OF SBI
2 State Bank of Hyderabad 10.83 10.65 10.86 12.28 13.42 11.613 State Bank of Patiala 13.24 12.47 12.60 12.37 14.03 12.944 State Bank of Travancore 10.27 11.09 11.09 11.79 12.78 11.405 State Bank of Bikaner & Jaipur 10.65 12.26 12.35 12.39 11.81 11.896 State Bank of Mysore 11.61 10.23 11.50 11.16 12.55 11.417 State Bank of Indore 9.83 12.35 11.26 12.73 13.20 11.878 State Bank of Saurashtra 18.14 14.35 14.48 13.89 12.54 14.68
Average of State Bank Group [I+II] 12.39 11.99 11.95 12.43 12.96 12.34[Source : IBA bulletin March 2002, 2003]
Table 4.3.1 shows CAR in SBI group. The average shows
more than or around 12% CAR in all the years. It is 3% more than
the minimum CAR. This shows that SBI group is well capitalized.
SBS, State Bank of Patiala and SBI main, State Bank of Bikaner &
Jaipur etc. are well capitalized to its perceived risks. It shows
operational efficiency also. Other Banks have also tried to maintain
good CAR. State Bank of Saurashtra has obtain the highest capital
adequacy ratio in all the years among the Banks of SBI group. It
shows a very good operational efficiency as well as capital
adequacy.
146

Table 4.3.2 Capital Adequacy Ratio for other nationalized Banks
during 1997-98 to 2001-02 Capital Adequacy Ratio (in
Percent) Banks 1997-1998
1998-1999
1999-2000
2000-2001
2001-2002
AVG
(%) III. NATIONALISED BANKS
9 Canara Bank 9.54 10.96 9.64 9.84 10.62 10.1210 Punjab National Bank 8.81 10.79 10.31 10.24 12.59 10.5511 Bank of Baroda 12.05 13.30 12.10 12.80 11.32 12.3112 Bank of India 9.11 11.45 10.57 12.23 10.68 10.8113 Central Bank of India 10.40 11.88 11.18 10.02 11.16 10.9314 Union Bank of India 10.86 10.09 11.42 10.86 11.88 11.0215 Indian Overseas Bank 9.34 10.15 9.15 10.24 9.58 9.6916 Syndicate Bank 10.50 9.57 11.45 11.72 17.90 12.2317 Oriental Bank of Commerce 15.28 14.10 12.72 11.81 7.64 12.3118 Indian Bank 1.41 -9.00 -12.00 - 1.70 -4.4719 Uco Bank 9.07 9.63 9.15 9.05 10.82 9.5420 Allahabad Bank 11.64 10.38 11.51 10.50 10.99 11.0021 United Bank of India 8.40 9.60 9.60 10.40 10.70 9.7422 Andhra Bank 12.37 11.02 13.36 13.42 10.70 12.1723 Bank of Maharashtra 10.90 9.76 11.66 10.64 12.12 11.0224 Corporation Bank 16.90 13.20 12.80 13.03 9.64 13.1125 Dena Bank 11.88 11.14 11.63 7.73 11.07 10.6926 Vijaya Bank 10.30 10.00 10.61 11.50 12.02 10.8927 Punjab & Sind Bank 11.39 10.94 11.57 11.42 12.25 11.51
Average of 19 Nationalised Banks [III] 10.53 9.95 9.92 10.39 10.81 10.32[Source : IBA bulletin March 2002, 2003]
The above table reveals that during these five years, other
nationalized bank’s performance regarding capital adequacy ratio is
average. It is around to 10%. The table shows that there is a very
poor condition regarding adequate capital in Indian bank. It is
negative and negligible during last 3 or 4 years. In the year of 2000-
147

01, Dena Bank’s CAR is also very low. In 2001-02, CAR of oriental
bank of commerce is seen of 7.64%, which hurts RBI guidelines-
advocating CAR of 9%. The other banks have maintained the
standards.
Table 4.3.3 Capital Adequacy Ratio for Old Private Sector Banks
during 1997-98 to 2001-02 Capital Adequacy Ratio
(in Percent) Banks 1997-1998
1998-1999
1999-2000
2000-2001
2001-2002
AVG
(%) PRIVATE SECTOR BANKS
1 Bharat Overseas Bank Ltd. 13.00 13.70 12.68 14.43 15.09 13.782 City Union Bank Ltd. 11.60 14.30 13.33 13.59 13.97 13.363 Development Credit Bank Ltd. 19.79 16.90 11.34 11.28 11.49 14.164 Lord Krishna Bank Ltd. 8.22 11.85 11.25 12.90 16.50 12.145 SBI Commercial & International l Bank Ltd. 27.69 28.90 24.32 19.85 22.10 24.576 Tamilnad Mercantile Bank Ltd. 19.11 18.40 18.02 17.59 18.02 18.237 The Bank of Rajasthan Ltd. 5.54 0.83 5.73 10.57 12.07 6.958 The Benares State Bank Ltd. 4.12 - - - - 4.129 The Catholic Syrian Bank Ltd. 3.04 6.06 5.94 6.08 9.57 6.14
10 The Dhanalakshmi Bank Ltd. 11.39 10.06 10.02 9.69 11.23 10.4811 The Federal Bank Ltd. 9.43 10.32 11.33 10.29 10.63 10.4012 The Ganesh Bank of Kurundwad Ltd. 8.04 8.26 9.14 9.11 10.08 8.9313 The Jammu & Kasmir Bank Ltd. 20.48 22.48 18.82 17.44 15.46 18.9414 The Karnataka Bank Ltd. 13.23 10.85 11.04 11.37 12.96 11.8915 The Karur Vysya Bank Ltd. 14.47 14.53 15.16 15.56 16.90 15.3216 The Lakshmi Vilas Bank Ltd. 10.35 9.64 10.45 10.21 11.54 10.4417 The Nainital Bank Ltd. 9.46 13.81 15.11 15.81 14.88 13.8118 The Nedungadi Bank Ltd. 12.85 10.24 9.04 - -1.99 7.5419 The Ratnakar Bank Ltd. 10.41 9.72 11.56 10.00 13.60 11.0620 The Sangli Bank Ltd. 10.98 11.58 12.13 11.47 11.64 11.5621 The South Indian Bank Ltd. 9.40 10.40 10.41 11.17 11.20 10.5222 The United Western Bank Ltd. 9.87 11.64 11.94 9.59 9.79 10.5723 The Vysya Bank Ltd. 12.48 10.63 12.24 12.05 11.57 11.79
Average of 23 Private Sector Banks [I] 11.95 12.50 11.78 11.31 12.65 12.04[Source : IBA bulletin March 2002, 2003]
148

Table 4.3.3 indicates the capital adequacy ratio of old private
sector banks. By observing this table, it can be said that the Jammu
& Kashmir Bank Ltd., The Tamilnad Mercantile Bank Ltd., and The
SBI commercial & International Bank Ltd., have the out-standing
performance regarding capital adequacy to their risk weighted assets.
It shows their long-term solvency also. The poor performance
regarding CAR can be seen in Catholic Syrian Bank, The Bank of
Rajasthan Ltd., and The Benares State Bank Ltd. Other Banks have
obtained CAR almost more than the RBI standards.
Table 4.3.4 Capital Adequacy Ratio for New Private Banks
during 1997-98 to 2001-02 Capital Adequacy Ratio
(in Percent) Banks 1997-1998
1998-1999
1999-2000
2000-2001
2001-2002
AVG
(%) NEW PRIVATE SECTOR BANKS 24 ICICI Bank Ltd. 13.48 11.06 19.64 11.57 12.82 13.7125 HDFC Bank Ltd. 13.92 11.86 12.19 11.09 4.16 10.6426 UTI Bank Ltd. 9.72 11.64 11.37 9.00 11.21 10.5927 Global Trust Bank Ltd. 10.28 11.97 13.68 12.71 13.93 12.5128 Indusind Bank Ltd. 17.91 15.16 13.24 15.00 11.44 14.5529 Centurion Bank Ltd. 20.00 8.45 9.31 9.61 9.59 11.3930 IDBI Bank Ltd. 9.82 11.26 11.80 11.72 12.51 11.4231 Bank Punjab Ltd. 16.34 14.64 9.81 11.02 10.65 12.49
Average of 8 New Private Sec.Banks [I] 13.93 12.01 12.63 11.47 10.79 12.16[Source : IBA bulletin March 2002, 2003]
149
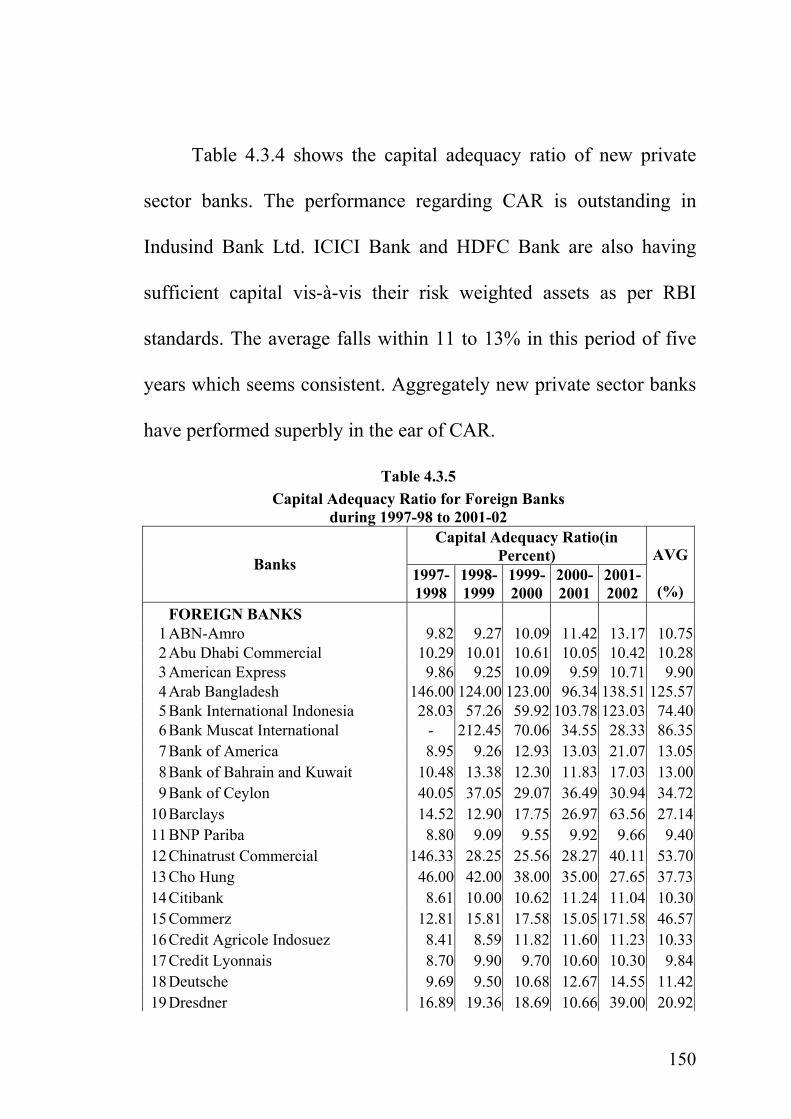
Table 4.3.4 shows the capital adequacy ratio of new private
sector banks. The performance regarding CAR is outstanding in
Indusind Bank Ltd. ICICI Bank and HDFC Bank are also having
sufficient capital vis-à-vis their risk weighted assets as per RBI
standards. The average falls within 11 to 13% in this period of five
years which seems consistent. Aggregately new private sector banks
have performed superbly in the ear of CAR.
Table 4.3.5 Capital Adequacy Ratio for Foreign Banks
during 1997-98 to 2001-02 Capital Adequacy Ratio(in
Percent) Banks 1997-1998
1998-1999
1999-2000
2000-2001
2001-2002
AVG
(%) FOREIGN BANKS
1 ABN-Amro 9.82 9.27 10.09 11.42 13.17 10.752 Abu Dhabi Commercial 10.29 10.01 10.61 10.05 10.42 10.283 American Express 9.86 9.25 10.09 9.59 10.71 9.904 Arab Bangladesh 146.00 124.00 123.00 96.34 138.51 125.575 Bank International Indonesia 28.03 57.26 59.92 103.78 123.03 74.406 Bank Muscat International - 212.45 70.06 34.55 28.33 86.357 Bank of America 8.95 9.26 12.93 13.03 21.07 13.058 Bank of Bahrain and Kuwait 10.48 13.38 12.30 11.83 17.03 13.009 Bank of Ceylon 40.05 37.05 29.07 36.49 30.94 34.72
10 Barclays 14.52 12.90 17.75 26.97 63.56 27.1411 BNP Pariba 8.80 9.09 9.55 9.92 9.66 9.4012 Chinatrust Commercial 146.33 28.25 25.56 28.27 40.11 53.7013 Cho Hung 46.00 42.00 38.00 35.00 27.65 37.7314 Citibank 8.61 10.00 10.62 11.24 11.04 10.3015 Commerz 12.81 15.81 17.58 15.05 171.58 46.5716 Credit Agricole Indosuez 8.41 8.59 11.82 11.60 11.23 10.3317 Credit Lyonnais 8.70 9.90 9.70 10.60 10.30 9.8418 Deutsche 9.69 9.50 10.68 12.67 14.55 11.4219 Dresdner 16.89 19.36 18.69 10.66 39.00 20.92
150

20 Ing Bank 12.91 12.79 21.15 15.00 12.47 14.8621 JP Chase Manhattan 13.03 12.53 45.86 43.79 85.88 40.2222 KBC - 95.00 18.51 23.01 96.75 58.3223 Krung Thai 347.22 236.00 197.74 148.99 167.65 219.5224 Mashreq 29.84 12.13 9.04 10.54 20.54 16.4225 MIZUHO Corporate Bank Ltd. -Fuji 43.45 23.62 25.29 18.38 11.14 24.3826 Morgan Guaranty Trust - 413.00 89.00 79.00 - 193.6727 Oman International 13.38 9.07 11.08 14.21 18.86 13.3228 Oversea-Chinese 90.93 94.00 98.34 168.11 192.12 128.7029 Sakura 11.84 10.29 15.01 16.21 - 13.3430 Societ Generale 10.74 12.50 13.95 13.93 12.82 12.7931 Sonali 27.80 38.39 24.91 88.14 113.64 58.5832 Standard Chartered 8.50 8.30 9.50 9.60 9.28 9.0433 Standard Chartered Grindlays 9.05 9.04 10.93 12.52 13.08 10.9234 State Bank of Mauritius 73.50 46.78 35.23 30.78 46.78 46.6135 Sumitomo 40.67 16.58 18.54 19.40 20.96 23.2336 The Bank of Nova Scotia 10.30 9.06 9.67 9.97 10.12 9.8237 The Bank of Tokyo - Mitsubishi 8.73 9.92 17.62 15.51 15.36 13.4338 The Development Bank of Singapore 31.47 23.26 18.14 15.93 13.31 20.4239 The Hongkong & Shanghai 9.82 9.31 10.30 12.37 10.92 10.5440 The Siam Commercial 30.00 39.00 30.06 33.23 -13.33 23.7941 Toronto Dominion 86.61 74.23 51.98 57.87 173.28 88.7942 UFG / Sanwa 30.35 31.97 36.17 34.91 29.44 32.57
Average of 42 Foreign Banks in India 35.34 45.10 31.57 33.11 46.32 38.29[Source : IBA bulletin March 2002, 2003]
Table 4.3.5 shows a highly fluctuated CAR in foreign banks within
this period of five years. The average of CAR in all the foreign Banks is
highly impressive. In some banks CAR is more than 50% and more than
100% also. This indicates that it may be over capitalized bank in relation
to its risk weighted assets. The business of foreign banks is very much
selective to some class and risk is minimum. On the other hand, capital is
sufficient. This may be a reason for this much good result. Even though
maintaining RBI guidelines of CAR, some foreign banks are seen weaker
151

comparatively. These banks are American Express Bank BNP Pariba
Bank, Credit Lynnais Bank, standard chartered Bank and The Bank of
Nova scotia.
Table 4.3.6 Capital Adequacy Ratio for all the five banking groups from 1997-98 to 2001-02
(in percent) 1997-1998
1998-1999
1999-2000
2000-2001
2001-2002
AVG (%) Banks Groups
1 SBI 12.39 11.99 11.95 12.43 12.96 12.342 Other Nationalized Banks 10.53 9.95 9.92 10.39 10.81 10.323 Old Private Banks 11.95 12.50 11.78 11.31 12.65 12.044 New Private Banks 13.93 12.01 12.63 11.47 10.79 12.165 Foreign Banks 35.34 45.10 31.57 33.11 46.32 38.29 AVG (%) 16.83 18.31 15.57 15.74 18.71 17.03
01020304050
1997-1998
1998-1999
1999-2000
2000-2001
2001-2002
SBI Other Nationalized Banks Old Private Banks New Private Banks Foreign Banks
Above stated Table no. 4.3.6 and chart represent Capital
Adequacy Ratio for all the five banking groups. Primarily CAR
152

represents the soundness of capital funds but on another side it
represents the performance of risk-weighted assets. CAR is seen at
the highest level in case of foreign banks. This does not only mean
that the capital funds are very much sound in foreign banks but is
also means that there is lack of courage in investing in risk-weighted
assets. Here, we must appreciate SBI group, other nationalized banks
group, Old Private Bank group, and New Private Bank group, which
have invested large amount in the core sector of India and shown
their attachment and firm intension for the development of nation.
As the risk-weighted assets are very high in the banking groups
except foreign banks, even though the capital funds are very sound,
their capital Adequacy Ratio is very low comparatively.
Capital Adequacy Ratio (CAR)
Hypothesis Testing
The researcher wanted to find out that if there is any
significant difference regarding the performance related to capital
Adequacy Ratio among all the five banking groups during 1997-98
to 2001-02 or not. This was tested as under.
153

Null Hypothesis :
There is no significant different in capital adequacy ratio
among all the five banking groups during 1997-98 to 2001-02.
H0 = µ1 = µ2 = µ3 = µ4 = µ5
H1 = µ1 ≠ µ2 ≠ µ3 ≠ µ4 ≠ µ5
Anova Table
Source of Variable
SS DF MS F Ratio 5% F Limit (From table F)
Between Sample 10288.59 (5-1) = 4 2572.15 5.21 F (4,20) 2.87 Within Sample 9866.55 (25-5) = 20 493.33
The above ANOVA table indicates that the calculated value of
F is 5.21, which is more than the table value of 2.87 at 5% level of
significance. Hence, the null hypothesis is rejected. It means that
there is a significant difference in capital adequacy ratio between all
the five banking groups.
Rejection Region Acceptance Region Area = 0.05
154

References 1. Comparative Performance of
Public sector Banks in India S. B. Swami & G. Subrahmanyam
2. Balance Sheet Analysis B. Ramchandra Rao Progressive Corporation Pvt. Ltd., Mumbai (1991) 3. Practical Financial Statement Analysis Foulke, A. Roy Tata Mcgraw Hill Publishing Co. Ltd., Mumbai. (1996) 4. Financial Management M.Y. Khan & P.K. Jain Tata Mcgraw Hill Publishing Co. Ltd., Mumbai. (1996) 5. Technical allocative and Scale Efficiency
of Public Sector Banks in India. Das A. (1997) R.B.I. occasional papers, 18 June-September
6. IBA Bulletin March-2002, 2003 7. www.rbi.org.in 8. Indian Journal of Accounting December, 2003.
NEW FRAMEWORK OF CAPITAL ADEQUACY: BASLE II G. Vasanthi
155

CHAPTER – 5
ANALYSIS OF PROFITABILITY OF INDIAN
BANKING SECTOR
5.1 OPERATING PROFIT TO AVERAGE WORKING
FUNDS RATIO
5.1.1 Operating Profit To Average Working Funds Ratio for SBI group during 1997-98 to 2001-02.
5.1.2 Operating Profit To Average Working Funds Ratio for other nationalized banks during 1997-98 to 2001-02.
5.1.3 Operating Profit To Average Working Funds Ratio for old private sector banks during 1997-98 to 2001-02.
5.1.4 Operating Profit To Average Working Funds Ratio for new private banks during 1997-98 to 2001-02.
5.1.5 Operating Profit To Average Working Funds Ratio for foreign banks during 1997-98 to 2001-02.
5.1.6 Operating Profit To Average Working Funds Ratio for for all the five banking groups during 1997-98 to 2001-02.
156

5.2 REPORTED NET PROFIT TO REPORTED NET
WORTH RATIO (RETURN ON ASSETS RATIO)
5.2.1. Return on Assets Ratio for SBI group during 1997-98 to 2001-02
5.2.2. Return on Assets Ratio for other nationalized banks during 1997-98 to 2001-02.
5.2.3. Return on Assets Ratio for old private sector banks during 1997-98 to 2001-02.
5.2.4. Return on Assets Ratio for new private banks during 1997-98 to 2001-02
5.2.5. Return on Assets Ratio for foreign banks during 1997-98 to 2001-02
5.2.6. Return on Assets Ratio for all the five banking groups during 1997-98 to 2001-02
157

Profitability is the most important parameter for performance
appraisal of any business organization. In the changing economic
environment, it is very important to get idea of profitability of
various banking groups. This chapter deals with the profitability
analysis of Indian Banking Sector.
The ratios, formulas and terms related to profitability of banks
are as under :
5.1 Operating Profit To Average Working Funds Ratio
This ratio relates bank’s operating profit with its average
working funds. The profit from operations is very much important as
well as its percentage to average working funds. Higher the ratio
shows higher profitability of a bank. The formula to calculate this
ratio is-
Operating Profit 2 100 Average Working Fund
158

Operating Profit (OP) :
Operating Profit means net profit before provisions and
contingencies. This is an indicator of a bank’s Profitability at the
operating level. In other words it shows a bank's operating
efficiency.
Average Working Funds (AWF)
This term is explained in chapter-4.
Working Funds (WF)
This term too is explained in chapter-4.
5.2 Return on Assets Ratio
This is another indicator to measure profitability. How much
return achieved on the assets, is an important factor. After the
deductions from operating profit, net profit is found. The formula of
this ratio is
Reported Net Profit ROA in % = 2 100
Reported Net Worth
159

Reported Net Profit To Reported Net Worth
(RNP/RNW) or Return on Assets (ROA) in % :
This ratio is the equivalent of the return on net worth ratio
used in other industries too. It is a good indicator of Profitability and
return on Shareholders’ funds.
Net Profit :
The net profit will be achieved by deducting provisions and
contingencies from the operating profit. It is an important indicator
to measure the profitability of a bank on any other organization.
Net Worth :
Net Worth can be found by deducting total liabilities from the
total assets. The another way to get net worth is total capital +
reserves & surplus. The bank’s long-term solvency can be measured
with the use of net worth. It is the strength of a bank.
5.1 Operating Profit To Average Working Funds Ratio
This ratio is a profitability parameter for the performance of a
bank. This Ratio relates to operating profit with average working
funds. It is an indicator of bank’s profitability at the operating level.
If this ratio improves, operating efficiency is believed increased.
160

Table 5.1.1 Operating Profit to Average Working Funds Ratio for SBI Group
during 1997-98 to 2001-02 Operating Profit as % to Average
Working Funds Banks 1997-1998
1998-1999
1999-2000
2000-2001
2001-2002
AVG
(%) PUBLIC SECTOR BANKS I.1. State Bank of India (SBI) 1.96 1.55 1.55 1.33 1.74 1.63II. ASSOCIATES OF SBI
2 State Bank of Hyderabad 2.85 2.30 2.81 2.44 2.51 2.583 State Bank of Patiala 2.48 2.34 3.24 3.19 2.71 2.794 State Bank of Travancore 2.06 1.30 1.75 1.78 3.40 2.065 State Bank of Bikaner & Jaipur 2.50 1.79 2.15 2.15 2.27 2.176 State Bank of Mysore 2.21 1.79 2.10 1.50 3.26 2.177 State Bank of Indore 2.37 2.50 2.32 2.91 2.36 2.498 State Bank of Saurashtra 2.12 1.91 2.46 1.59 1.95 2.01
Average of State Bank Group [I+II] 2.32 1.94 2.30 2.11 2.53 2.24
In SBI group, OP/AWF ratio has been decreased from 1997-98
to 2000-01 in SBI main. In Associate Banks, the OP of state Bank of
patiala has drastically improved from 2.48% to 3.19. There is a point
to be noted that in 98-99, all the Banks’ Ratio goes down except
State Bank of India, indicate the profit from the operation of banks is
low. The banks are weak in their operations. So it is challenge before
the management of banks to improve operations. The overall
average in 1998-99 goes down from 2.32 to 1.94%. Then again in
1999-2000, the performance related to operating level, is improved
in all the banks except State Banks of Indore. It remains almost
[Source : IBA bulletin March 2002, 2003]
161

consistent for the next year also. The table indicates the higher
profitability at operating level.
Table 5.1.2 Operating Profit to Average Working Funds Ratio for other nationalized Banks
during 1997-98 to 2001-02 Operating Profit as % to Average
Working Funds Banks 1997-1998
1998-1999
1999-2000
2000-2001
2001-2002
AVG
(%) III. NATIONALISED BANKS
9 Canara Bank 1.74 2.17 1.82 1.95 1.65 1.8710 Punjab National Bank 2.00 1.85 1.61 1.59 2.03 1.8211 Bank of Baroda 1.95 1.95 1.79 1.64 1.85 1.8412 Bank of India 1.61 1.41 1.24 1.34 2.02 1.5213 Central Bank of India 1.29 0.89 1.11 1.15 1.93 1.2714 Union Bank of India 1.46 1.13 1.24 1.44 2.29 1.5115 Indian Overseas Bank 0.75 0.59 0.70 1.04 1.34 0.8816 Syndicate Bank 0.76 0.89 1.13 1.05 2.64 1.2917 Oriental Bank of Commerce 2.60 2.30 2.20 2.00 1.78 2.1818 Indian Bank - - 0.11 0.25 1.01 0.4619 Uco Bank 0.09 0.21 0.81 0.91 1.74 0.7520 Allahabad Bank 1.65 1.42 1.32 1.26 2.84 1.7021 United Bank of India 1.28 0.30 0.47 0.71 1.19 0.7922 Andhra Bank 1.86 1.58 2.15 1.41 2.02 1.8023 Bank of Maharashtra 1.30 1.24 1.65 1.46 1.12 1.3524 Corporation Bank 3.23 2.28 2.82 3.15 1.52 2.6025 Dena Bank 2.55 1.59 1.43 0.38 1.96 1.5826 Vijaya Bank 0.81 1.13 1.10 1.36 1.04 1.0927 Punjab & Sind Bank 1.22 0.95 0.87 0.82 1.56 1.08
Average of 19 Nationalised Banks [III] 1.48 1.26 1.35 1.31 1.76 1.43[Source : IBA bulletin March 2002, 2003]
Table 5.1.2 shows the OP/AWF ratio for other 19 nationalized
banks. The overall average is very low compared to SBI group. It
was highest of 3.23% in 1997-98 and the lowest of 0.09% too in
162

1997-98. For Indian Bank, this ratio is not seen in 1997-98 & 1998-
99, after that too it is very much low. Same way, UCO Bank, Indian
Overseas Bank & Syndicate Bank are very much poor in case of
operating profit. That’s why the overall average has come down.
While in some banks, Operating efficiency has been high, because
the ratio is also high. This is a very good sign. Operating profit may
be more because of interest and Non-Interest Income are more.
Canara Bank, Punjab national Bank, Bank of Baroda, Oriental Bank
of Commerce, Corporation Bank & Dena Bank are very good at the
profitability point of view. But in Dena Bank, Operating profit has
gone down from 2.55% in 1997-98 to 0.38% in 2000-01.
This profitability trend goes down may be because of
competition with other private sector Banks. Since 1998-99, the
private sector banks are becoming more popular as they provide
good facilities and better banking environment to their customers.
Due to increasing banking share of private sector banks, interest and
Non-Interest Income might have come down in other nationalized
banks.
163

Table 5.1.3 Operating Profit to Average Working Funds Ratio for Old Private Sector Banks
during 1997-98 to 2001-02
Operating Profit as % to Average Working Funds Banks
1997-1998
1998-1999
1999-2000
2000-2001
2001-2002
AVG
(%) PRIVATE SECTOR BANKS
1 Bharat Overseas Bank Ltd. 1.68 1.17 1.50 2.37 2.93 1.932 City Union Bank Ltd. 1.98 1.79 3.12 2.81 2.92 2.523 Development Credit Bank Ltd. 3.60 1.59 2.56 1.86 2.47 2.424 Lord Krishna Bank Ltd. 1.68 0.91 1.61 1.24 2.93 1.675 SBI Commercial & International Bank Ltd. 2.27 2.32 3.19 1.31 1.86 2.196 Tamilnad Mercantile Bank Ltd. 4.02 2.73 2.63 3.08 2.82 3.067 The Bank of Rajasthan Ltd. 0.89 -0.31 0.47 1.36 1.69 0.828 The Benares State Bank Ltd. 0.13 -0.95 0.06 -0.70 - -0.379 The Catholic Syrian Bank Ltd. 1.02 0.22 0.98 1.63 2.60 1.29
10 The Dhanalakshmi Bank Ltd. 1.74 1.07 2.02 1.01 2.68 1.7011 The Federal Bank Ltd. 1.87 0.69 1.80 2.35 3.01 1.9412 The Ganesh Bank of Kurundwad Ltd. 9.92 0.59 0.89 0.44 1.14 2.6013 The Jammu & Kasmir Bank Ltd. 3.33 2.74 2.77 2.66 3.14 2.9314 The Karnataka Bank Ltd. 3.03 1.69 1.57 2.27 3.23 2.3615 The Karur Vysya Bank Ltd. 3.92 2.23 3.23 2.80 3.17 3.0716 The Lakshmi Vilas Bank Ltd. 2.05 1.70 2.73 2.49 2.72 2.3417 The Nainital Bank Ltd. 1.64 2.00 1.88 1.80 1.83 1.8318 The Nedungadi Bank Ltd. 2.23 1.08 1.77 0.04 2.20 1.4619 The Ratnakar Bank Ltd. 1.70 1.32 1.74 1.99 3.69 2.0920 The Sangli Bank Ltd. 2.83 1.15 1.43 1.31 1.50 1.6421 The South Indian Bank Ltd. 1.16 1.08 2.02 2.29 2.64 1.8422 The United Western Bank Ltd. 3.29 2.06 3.63 1.13 2.99 2.6223 The Vysya Bank Ltd. 1.98 0.91 1.62 1.36 1.91 1.56Average of 23 Private Sector Banks [I] 2.52 1.29 1.97 1.69 2.55 2.00[Source : IBA bulletin March 2002, 2003]
Table 5.1.3 shows the OP /AWF ratio of 23 Old Private Sector
Banks. Negative results means operating loss has been seen in some
Banks also. The average is good but not as good as SBI group. Only
1997-98 & 2001-02 have a good average and it is 2.52% & 2.55%
164

respectively. In Ganesh Bank in 1997-98, the ratio is of 9.92%
surprisingly and after that, the average has drastically fallen down.
The Jammu & Kashmir Bank Ltd. Which was India’s best Bank in
2001-02 (according to Financial Express Survey) has gotten a very
good profitability. The Karur Vysya Bank Ltd., United Western
Bank Ltd., Development & Credit Banks Ltd. are also having better
performance in profitability at operating level. As far as the poor
profitability is concerned, we must not some banks, which are The
Bank of Rajasthan Ltd., and The Benaras State Bank Ltd.
Table 5.1.4 Operating Profit to Average Working Funds Ratio for New Private Banks
during 1997-98 to 2001-02 Operating Profit as % to Average
Working Funds Banks 1997-1998
1998-1999
1999-2000
2000-2001
2001-2002
AVG
(%) NEW PRIVATE SECTOR BANKS 24 ICICI Bank Ltd. 4.31 2.57 2.81 2.35 1.92 2.7925 HDFC Bank Ltd. 4.49 3.52 4.18 2.83 0.35 3.0726 UTI Bank Ltd. 2.32 2.14 2.60 1.50 2.03 2.1227 Global Trust Bank Ltd. 3.93 2.40 4.13 2.32 2.29 3.0128 Indusind Bank Ltd. 4.56 2.29 3.29 2.51 0.52 2.6329 Centurion Bank Ltd. 2.42 1.16 1.61 1.08 1.85 1.6230 IDBI Bank Ltd. 2.32 1.67 2.22 1.39 2.47 2.0131 Bank Punjab Ltd. 3.11 2.36 2.22 2.13 2.85 2.53Average of 8 New Private Sec.Banks [I] 3.43 2.26 2.88 2.01 1.79 2.48
[Source : IBA bulletin March 2002, 2003]
165

Table 5.1.4 shows the operating efficiency of 8 new private
Banks. It is clear that the profitability at operating level is excellent
in each Bank in each year. However, the ratio trend goes down from
1997-98 to 01-02 because of may be lower operating profit or higher
working funds. But compared to all nationalized & private Banks
groups, this group has gotten the consistent performance. ICICI,
HDFC, Indusind Bank, & Global Trust Banks are better in
profitability. This shows an efficiency of these banks at operating
level. The strategies & policies of these banks may be more
attractive than others.
Table 5.1.5 Operating Profit to Average Working Funds Ratio for Foreign Banks
during 1997-98 to 2001-02 Operating Profit as % to Average
Working Funds Banks 1997-1998
1998-1999
1999-2000
2000-2001
2001-2002
AVG
(%) FOREIGN BANKS
1 ABN-Amro 4.03 4.13 3.92 3.61 3.68 3.872 Abu Dhabi Commercial 2.58 2.43 2.50 1.35 0.90 1.953 American Express 3.62 1.79 2.70 2.13 3.80 2.814 Arab Bangladesh 3.96 6.19 6.12 6.91 6.47 5.935 Bank International Indonesia 0.62 -5.79 -9.81 -8.05 0.22 -4.566 Bank Muscat International - - 0.88 1.20 1.93 1.347 Bank of America 4.94 3.10 2.15 3.46 3.47 3.428 Bank of Bahrain and Kuwait 0.18 1.00 2.14 1.75 2.72 1.569 Bank of Ceylon 8.28 7.19 10.12 5.75 5.50 7.37
10 Barclays 2.44 1.91 -0.45 -0.11 4.51 1.6611 BNP Pariba 4.05 3.01 2.66 1.53 -0.60 2.13
166
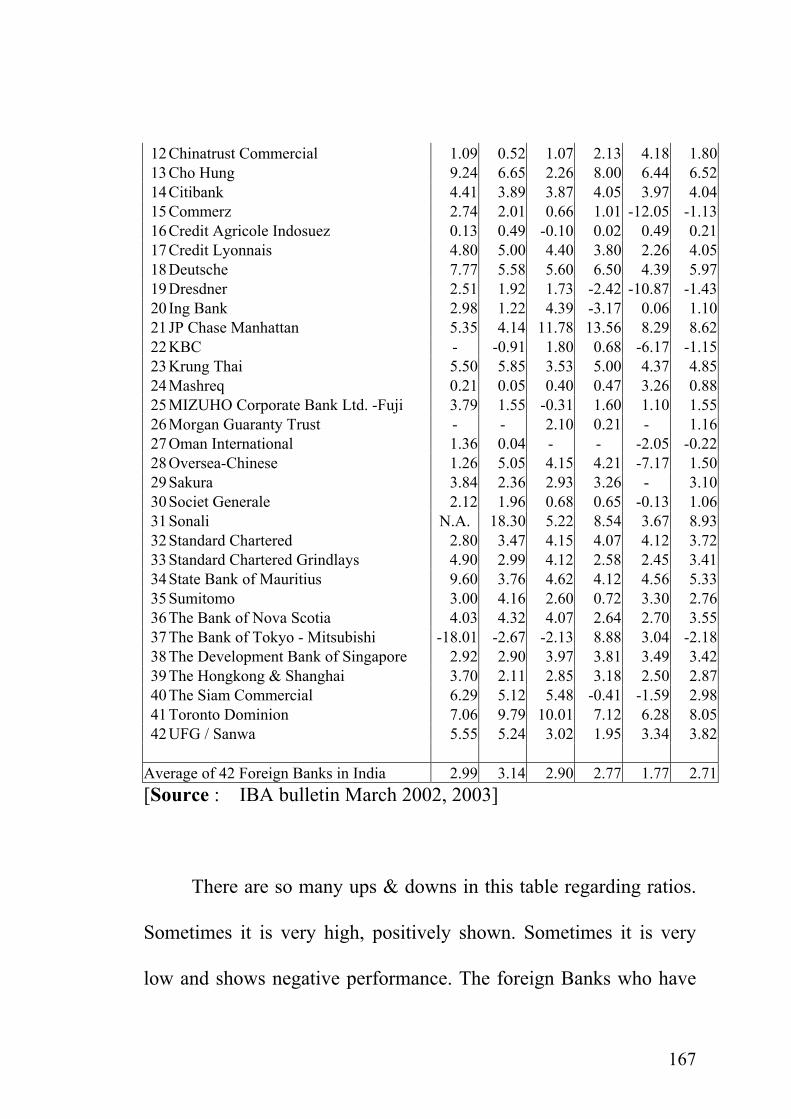
12 Chinatrust Commercial 1.09 0.52 1.07 2.13 4.18 1.8013 Cho Hung 9.24 6.65 2.26 8.00 6.44 6.5214 Citibank 4.41 3.89 3.87 4.05 3.97 4.0415 Commerz 2.74 2.01 0.66 1.01 -12.05 -1.1316 Credit Agricole Indosuez 0.13 0.49 -0.10 0.02 0.49 0.2117 Credit Lyonnais 4.80 5.00 4.40 3.80 2.26 4.0518 Deutsche 7.77 5.58 5.60 6.50 4.39 5.9719 Dresdner 2.51 1.92 1.73 -2.42 -10.87 -1.4320 Ing Bank 2.98 1.22 4.39 -3.17 0.06 1.1021 JP Chase Manhattan 5.35 4.14 11.78 13.56 8.29 8.6222 KBC - -0.91 1.80 0.68 -6.17 -1.1523 Krung Thai 5.50 5.85 3.53 5.00 4.37 4.8524 Mashreq 0.21 0.05 0.40 0.47 3.26 0.8825 MIZUHO Corporate Bank Ltd. -Fuji 3.79 1.55 -0.31 1.60 1.10 1.5526 Morgan Guaranty Trust - - 2.10 0.21 - 1.1627 Oman International 1.36 0.04 - - -2.05 -0.2228 Oversea-Chinese 1.26 5.05 4.15 4.21 -7.17 1.5029 Sakura 3.84 2.36 2.93 3.26 - 3.1030 Societ Generale 2.12 1.96 0.68 0.65 -0.13 1.0631 Sonali N.A. 18.30 5.22 8.54 3.67 8.9332 Standard Chartered 2.80 3.47 4.15 4.07 4.12 3.7233 Standard Chartered Grindlays 4.90 2.99 4.12 2.58 2.45 3.4134 State Bank of Mauritius 9.60 3.76 4.62 4.12 4.56 5.3335 Sumitomo 3.00 4.16 2.60 0.72 3.30 2.7636 The Bank of Nova Scotia 4.03 4.32 4.07 2.64 2.70 3.5537 The Bank of Tokyo - Mitsubishi -18.01 -2.67 -2.13 8.88 3.04 -2.1838 The Development Bank of Singapore 2.92 2.90 3.97 3.81 3.49 3.4239 The Hongkong & Shanghai 3.70 2.11 2.85 3.18 2.50 2.8740 The Siam Commercial 6.29 5.12 5.48 -0.41 -1.59 2.9841 Toronto Dominion 7.06 9.79 10.01 7.12 6.28 8.0542 UFG / Sanwa 5.55 5.24 3.02 1.95 3.34 3.82
Average of 42 Foreign Banks in India 2.99 3.14 2.90 2.77 1.77 2.71[Source : IBA bulletin March 2002, 2003]
There are so many ups & downs in this table regarding ratios.
Sometimes it is very high, positively shown. Sometimes it is very
low and shows negative performance. The foreign Banks who have
167

one or two branches in India, shows good performance at operating
level. But it is not the picture of the senses of Foreign Banks group.
Because major 1 to 12 Banks, Ratios are more important. Among
these Banks, CitiBank, Stanchart Bank, Deusche Bank, Bank of
America Cho Hung Bank, J.P. Chase Manhattan Bank, Sonali Bank,
Toronto Dominion Bank are the leading banks relating to operating
efficiency or profitability. The Non-Interest Incomes of these banks
were also higher and that’s why operating profit may be high. The
weaker banks in this census are Bank International Indonesia,
Commerze, Credit Agricole Indosuez, Dresdner, KBC, Oman
International and The Bank of Tokyo-Mitsubishi.
The overall average of this group is the excellent amongst all
the group which is above 2.50% almost in every year.
Table 5.1.6 Operating Profit to Average Working Funds Ratio for all the five Banking Groups
during 1997-98 to 2001-02 (in percent) 1999-2000
2000-20001 Banking Groups 1997-
1998 1998-1999
2001-2002
AVG (%)
1 SBI 2.32 1.94 2.30 2.11 2.53 2.242 Other Nationalised Banks 1.48 1.26 1.35 1.31 1.76 1.433 Old Private Banks 2.52 1.29 1.97 1.69 2.55 2.004 New Private Banks 3.43 2.26 2.88 2.01 1.79 2.485 Foreign Banks 2.99 3.14 2.90 2.77 1.77 2.71
AVG (%) 2.55 1.98 2.28 1.98 2.08 2.17
168
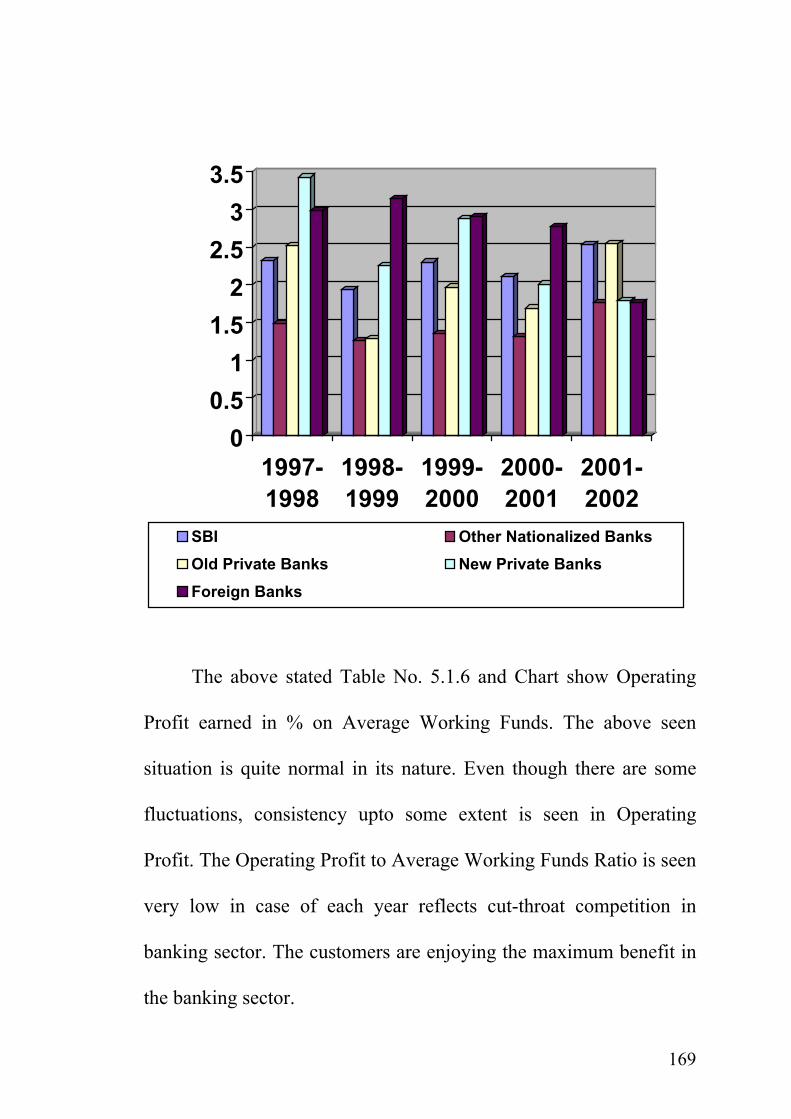
00.5
11.5
22.5
33.5
1997-1998
1998-1999
1999-2000
2000-2001
2001-2002
SBI Other Nationalized Banks Old Private Banks New Private Banks Foreign Banks
The above stated Table No. 5.1.6 and Chart show Operating
Profit earned in % on Average Working Funds. The above seen
situation is quite normal in its nature. Even though there are some
fluctuations, consistency upto some extent is seen in Operating
Profit. The Operating Profit to Average Working Funds Ratio is seen
very low in case of each year reflects cut-throat competition in
banking sector. The customers are enjoying the maximum benefit in
the banking sector.
169

Operating Profit To Average Working Funds Ratio
Hypothesis Testing
The researcher wanted to find out that if there is any
significant difference regarding the performance related to Operating
Profit to Average Working Funds Ratio among all the five banking
groups during 1997-98 to 2001-02 or not. This was tested as below.
Null Hypothesis :
There is no significant difference regarding Operating Profit to
Average Working Funds Ration among all the five banking groups
during 1997-98 to 2001-02.
H0 = µ1 = µ2 = µ3 = µ4 = µ5
H1 = µ1 ≠ µ2 ≠ µ3 ≠ µ4 ≠ µ5
ANOVA TABLE
Source of variable
SS Df. MS F Ratio 5% F limit(from
table F) Between sample 127.38 (5-1) = 4 31.85 8.67 F (4.20)
2.87 Within Sample 73.48 (25-5) = 20 3.67
170

The above anova table represents the analysis of variance
between and within the five banking groups. The anova is about
operating profit to average working funds ratio. It can be seen from
above table, that the table value of F is 2.87, and the calculated value
of F is 8.67 at 5% level of significance. Hence, the calculated value
is more than the table value. So null hypothesis is rejected. It
indicates that there is a significant difference regarding operating
profit to Average Working Funds Ratio among all the five banking
groups.
5.2 Reported Net Profit To Reported Net Worth Ratio
or Return on Assets in % :
This ratio is a profitability parameter for the performance of a
bank. It relates to net profit (after provisions, and taxes) with total
assets. It is an indicator of bank’s profitability and ability to get
return on assets. The higher the ratio is, a good sign for the bank.
171

Table 5.2.1
Return on Assets in % for SBI Group during 1997-98 to 2001-02
Return on Assets in % Banks 1997-
19981998-1999
1999-2000
2000-2001
2001-2002
AVG (%)
PUBLIC SECTOR BANKS I.1. State Bank of India (SBI) 1.04 0.46 0.75 0.50 0.68 0.69II. ASSOCIATES OF SBI
2 State Bank of Hyderabad 0.91 0.85 0.82 0.82 0.90 0.863 State Bank of Patiala 1.48 0.99 1.06 1.12 1.31 1.194 State Bank of Travancore 0.69 0.40 0.53 0.67 0.71 0.605 State Bank of Bikaner & Jaipur 1.08 0.98 1.06 0.80 1.03 0.996 State Bank of Mysore 3.56 0.49 0.58 0.27 0.63 1.117 State Bank of Indore 0.68 0.63 0.80 0.89 1.18 0.848 State Bank of Saurashtra 2.32 0.38 1.14 0.18 0.81 0.97
Average of State Bank Group [I+II] 1.47 0.65 0.84 0.66 0.91 0.90[Source : IBA bulletin March 2002, 2003]
Table 5.2.1 shows the ROA of SBI group. In 97-98 the ROA
average of whole the group is 1.47% in 98-99 it is 0.65%, 1999-2000
it is 0.84%, and in 2000-01, it is 0.66%.
If we begin from 1997-98, as far as Return on Assets is
concerned, State Bank of Patiala, State Bank of Mysore and State
Bank of Saurashtra are showing better profitability than other banks
in the group. The average of Return on Assets in % is 1.47% of this
group in 1997-98. But after this year, the average is seen below 1%,
which shows increasing competition among banking groups and it's
impact on SBI group.
172

Table 5.2.2 Return on Assets in % for other nationalized Banks
during 1997-98 to 2001-02 Return on Assets in %
Banks 1997-1998
1998-1999
1999-2000
2000-2001
2001-2002
AVG
(%) III. NATIONALISED BANKS
9 Canara Bank 0.47 0.47 0.43 0.43 0.97 0.5510 Punjab National Bank 1.20 0.80 0.75 0.73 0.03 0.7011 Bank of Baroda 1.00 0.81 0.90 0.45 0.73 0.7812 Bank of India 0.79 0.40 0.31 0.44 0.68 0.5213 Central Bank of India 0.61 0.43 0.38 0.10 0.30 0.3614 Union Bank of India 0.97 0.51 0.29 0.40 0.67 0.5715 Indian Overseas Bank 0.53 0.23 0.15 0.38 0.63 0.3816 Syndicate Bank 0.45 0.71 0.89 0.91 0.77 0.7517 Oriental Bank of Commerce 1.40 1.20 1.10 0.80 0.96 1.0918 Indian Bank - - - - 0.11 0.1119 Uco Bank -0.57 -0.36 0.18 0.14 0.51 -0.0220 Allahabad Bank 0.85 0.77 0.35 0.18 0.31 0.49
United Bank of India 0.07 0.09 0.17 0.10 0.52 0.19 Andhra Bank 0.84 0.78 0.76 0.59 0.92 0.78 Bank of Maharashtra 0.55 0.43 0.59 0.24 0.65 0.49 Corporation Bank 1.49 1.43 1.54 1.55 1.25 1.45 Dena Bank 0.86 0.75 0.38 - 0.06 0.51 Vijaya Bank 0.26 0.28 0.38 0.53 0.79 0.45 Punjab & Sind Bank 0.76 0.53 0.52 0.18 0.17 0.43 Average of 19 Nationalised Banks [III] 0.66 0.54 0.53 0.43 0.58 0.55
21222324252627
[Source : IBA bulletin March 2002, 2003]
Table 5.2.2 indicates the ROA for 19 other nationalized banks.
For this group, the overall average in each year is below 1%. It is the
lowest in 2000-01, which is only 0.43% that shows that profitability
of these nationalized banks has fallen down. The result of Indian
bank &Uco bank is negligible or negative respectively. Operating
173

profit ratio is also same. The united bank of India’s performance is
also very weak regarding profitability. The best performance in
operating profitability, can be seen in corporation bank, which is
higher in all the years. The Oriental Bank of Commerce follows
Corporation Bank with the good record of 1.09%. The syndicate
bank has improved the profitability in odd circumstances also.
Punjab national bank & Bank of Baroda are also showing good
performance of profitability. These all become possible while
operating profit is much higher. Net profit is depended naturally on
operating profit.
Table 5.2.3 Return on Assets in % for Old Private Sector Banks
during 1997-98 to 2001-02 Return on Assets in %
Banks 1997-1998
1998-1999
1999-2000
2000-2001
2001-2002
AVG
(%) PRIVATE SECTOR BANKS
1 Bharat Overseas Bank Ltd. 0.87 0.74 0.07 1.04 0.90 0.722 City Union Bank Ltd. 1.06 0.88 1.28 1.21 1.25 1.143 Development Credit Bank Ltd. 2.10 1.13 1.18 0.87 0.72 1.204 Lord Krishna Bank Ltd. 0.53 0.16 0.70 0.41 1.12 0.585 SBI Commercial & International Bank Ltd. 2.65 1.59 1.84 -6.50 0.44 0.006 Tamilnad Mercantile Bank Ltd. 1.98 1.43 1.32 1.37 1.22 1.467 The Bank of Rajasthan Ltd. -2.64 -1.90 0.30 0.74 0.78 -0.548 The Benares State Bank Ltd. 0.14 -2.86 -0.57 -1.19 - -1.129 The Catholic Syrian Bank Ltd. 0.34 0.02 0.25 0.38 1.04 0.41
10 The Dhanalakshmi Bank Ltd. 0.69 0.28 0.71 0.40 0.52 0.5211 The Federal Bank Ltd. 0.69 0.04 0.62 0.69 0.78 0.5612 The Ganesh Bank of Kurundwad Ltd. 11.43 11.90 11.55 11.08 0.50 9.29
174

13 The Jammu & Kasmir Bank Ltd. 1.16 1.14 1.13 1.32 1.74 1.3014 The Karnataka Bank Ltd. 1.72 0.97 0.77 0.73 1.12 1.0615 The Karur Vysya Bank Ltd. 1.73 1.19 1.90 1.70 2.04 1.7116 The Lakshmi Vilas Bank Ltd. 1.59 0.85 1.14 1.02 1.02 1.1217 The Nainital Bank Ltd. 0.45 0.79 0.95 0.93 0.86 0.8018 The Nedungadi Bank Ltd. 0.78 0.62 0.84 0.00 0.08 0.4619 The Ratnakar Bank Ltd. 0.92 0.92 0.83 0.77 0.99 0.8920 The Sangli Bank Ltd. 0.37 0.35 0.36 0.40 0.50 0.4021 The South Indian Bank Ltd. 0.68 0.17 0.65 0.89 0.94 0.6722 The United Western Bank Ltd. 1.13 0.95 1.16 0.00 0.45 0.7423 The Vysya Bank Ltd. 1.14 0.40 0.55 0.37 0.58 0.61
Average of 23 Private Sector Banks [I] 1.37 0.95 1.28 0.81 0.89 1.06[Source : IBA bulletin March 2002, 2003]
Seeing table 5.2.3, which is related to ROA for old private sector
banks, again, the profitability is the highest in 97-98 and then in 99-2000.
But, in 98-99, and 2000-01, it is much less like other Banks. In this group
also, there is Net loss in some banks who give negative results in this
Ratio. These Banks are The Bank of Rajasthan Ltd., The Benares state
Bank Ltd., and SBI Commercial & International Bank Ltd. (in 2000-01).
SBI Commercial & International Bank’s Ratio is -6.50% in 2000-01,
which affects the overall average of this group. The Nedungadi Bank &
United westan Bank Ltd’s Ratio for ROA is Nil. So that in 2000-01, the
average ratio looks down.
175

Table 5.2.4 Return on Assets in % for New Private Banks
during 1997-98 to 2001-02 Return on Assets in %
Banks 1997-1998
1998-1999
1999-2000
2000-2001
2001-2002
AVG
(%)
NEW PRIVATE SECTOR BANKS
24 ICICI Bank Ltd. 1.53 0.91 0.87 0.82 0.92 1.0125 HDFC Bank Ltd. 2.23 1.89 1.84 1.62 -3.80 0.7626 UTI Bank Ltd. 0.51 0.79 0.77 0.80 0.48 0.6727 Global Trust Bank Ltd. 2.12 1.36 1.44 0.85 1.20 1.3928 Indusind Bank Ltd. 1.81 0.60 0.70 0.47 0.24 0.7629 Centurion Bank Ltd. 1.39 0.92 0.82 0.13 0.73 0.8030 IDBI Bank Ltd. 0.91 0.90 1.35 0.41 0.47 0.8131 Bank Punjab Ltd. 2.09 1.53 1.04 0.93 0.89 1.30
Average of 8 New Private Sec. Banks 1.57 1.11 1.10 0.75 0.14 0.94[Source : IBA bulletin March 2002, 2003]
Table 5.2.4 shows the Return on Assets for new private sector
banks. The performance of each bank is almost consistent in almost
all the years. The best performance can be seen in HDFC Bank Ltd.
regarding profitability and Return On Assets except in 2001-02. The
centurion Bank’s performance is going down year by year related to
ROA except 2001-02. There may be cause of low profitability or
NPAS. The lowest performance below 1% is of UTI Bank. There is
a point to be noted in all the Banking group that overall ROA of
each group has declined in 1998-99. Again it improves in 1999-2000
or rather may be consistant. Again in 2000-01 it goes down. This
group has low average in 2000-01 because of Centurion Bank, IDBI
176

Bank and Indusind bank’s low ROA. However, it is more than
nationalized Banks. In 2001-02 ROA in % is the lowest of 5 years
may be showing the initial stage of branch expansion. Due to branch
expansion, a huge amount is invested in the assets. While return on
assets remains low naturally.
Table 5.2.5 Return on Assets in % for Foreign Banks
during 1997-98 to 2001-02 Return on Assets in %
Banks 1997-1998
1998-1999
1999-2000
2000-2001
2001-2002
AVG
(%) FOREIGN BANKS
1 ABN-Amro 2.33 2.20 1.58 0.40 1.43 1.592 Abu Dhabi Commercial 0.42 0.32 0.52 0.44 0.45 0.433 American Express 2.11 0.25 1.02 -0.62 0.26 0.604 Arab Bangladesh 1.96 3.67 3.05 3.68 2.25 2.925 Bank International Indonesia -3.69 -17.99 -8.10 -2.96 0.22 -6.506 Bank Muscat International - - 0.46 1.05 0.31 0.617 Bank of America 2.95 1.99 1.17 1.25 1.54 1.788 Bank of Bahrain and Kuwait 0.70 0.71 0.90 0.81 1.18 0.869 Bank of Ceylon 2.55 2.33 2.62 0.95 0.02 1.69
10 Barclays 1.71 0.33 -2.23 1.65 1.78 0.6511 BNP Pariba 0.98 1.06 0.94 0.33 -0.82 0.5012 Chinatrust Commercial 0.03 -0.26 0.25 0.64 0.95 0.3213 Cho Hung 4.15 2.34 0.51 3.16 1.18 2.2714 Citibank 2.85 2.32 3.40 3.24 1.41 2.6415 Commerz -0.20 0.33 0.44 0.18 -12.01 -2.2516 Credit Agricole Indosuez -1.54 -0.64 -9.83 -1.62 0.94 -2.5417 Credit Lyonnais -0.60 1.70 1.60 0.20 0.27 0.6318 Deutsche 3.58 1.11 1.10 1.71 1.91 1.8819 Dresdner 1.02 -1.57 -11.37 -24.38 -10.87 -9.4320 Ing Bank 2.04 0.03 -2.72 -3.96 -0.43 -1.0121 JP Chase Manhattan 3.65 1.86 2.87 6.66 3.18 3.6422 KBC - -0.91 0.82 0.30 -6.34 -1.5323 Krung Thai 5.90 4.31 1.69 2.21 0.03 2.8324 Mashreq -2.84 -2.78 -3.60 -3.10 1.54 -2.1625 MIZUHO Corporate Bank Ltd. -Fuji 3.70 0.16 -2.76 -3.53 -1.35 -0.7626 Morgan Guaranty Trust - 2.02 2.02 0.25 - 1.43
177

27 Oman International 1.01 - - - -3.99 -1.4928 Oversea-Chinese 0.92 4.84 - 0.74 -3.90 0.6529 Sakura 0.19 -3.35 -0.70 -2.11 - -1.4930 Societ Generale 0.93 -2.37 0.02 0.04 -1.89 -0.6531 Sonali N.A. 12.91 4.11 5.87 1.41 6.0832 Standard Chartered 1.04 3.12 3.65 3.14 1.89 2.5733 Standard Chartered Grindlays 2.27 1.49 4.02 2.67 -3.54 1.3834 State Bank of Mauritius 4.47 1.81 1.48 1.05 0.76 1.9135 Sumitomo 2.00 3.14 2.75 0.70 -2.97 1.1236 The Bank of Nova Scotia 0.84 2.14 1.91 1.28 0.91 1.4237 The Bank of Tokyo - Mitsubishi -26.29 -4.45 4.88 7.57 3.84 -2.8938 The Development Bank of Singapore 0.97 1.31 1.44 1.58 1.95 1.4539 The Hongkong & Shanghai 0.98 0.58 0.96 1.29 0.79 0.9240 The Siam Commercial 3.32 2.70 2.25 -2.28 -33.38 -5.4841 Toronto Dominion 5.76 3.48 2.90 4.84 2.99 3.9942 UFG / Sanwa 1.13 0.96 0.12 0.27 0.04 0.50
Average of 42 Foreign Banks in India 0.79 0.79 0.38 0.37 -1.15 0.24[Source : IBA bulletin March 2002, 2003]
The trend of ROA in foreign Banks for all these years is highly
fluctuated. It gets many fluctuations in every year. Sometimes it falls
in negative mark also. That shows inconsistency and negative
profitability with assets.
The best performance in ROA is of Arab Bangladesh Bank,
Citibank and Stanchart Bank. They have gotten more then 2% in the
most years and maintained it or improved it. The overall average is
below 1% in all the five years. There are only one or two branches of
most of the foreign Banks, and that single Branch’s result is
reflected on this overall average. One interesting matter in case of
most of the foreign banks is that, they want to maintain their
178

international status and services in case of each branch. So they
prefer the best location, the best construction, the best infrastructure
etc., so a huge investment is made in assets and naturally ROA in %
remains low.
Table 5.2.6 Return on Assets (in percent) for all the five banking groups during 1997-98 to 2001-02
Banking Groups 1997-1998
1998-1999
1999-2000
2000-20001
2001-2002
AVG (%)
1 SBI 1.47 0.65 0.84 0.66 0.91 0.902 Other Nationalised Banks 0.66 0.54 0.53 0.43 0.58 0.553 Old Private Banks 1.37 0.95 1.28 0.81 0.89 1.064 New Private Banks 1.57 1.11 1.10 0.75 0.14 0.945 Foreign Banks 0.79 0.79 0.38 0.37 -1.15 0.24 AVG (%) 1.17 0.81 0.83 0.60 0.27 0.74
-1.5-1
-0.50
0.51
1.52
1997-1998
1998-1999
1999-2000
2000-2001
2001-2002
SBI Other Nationalized Banks Old Private Banks New Private Banks Foreign Banks
179

The above stated Table no 5.2.6 and Chart represent Very low
Return On Assets. Among all the five banking groups, old private
banks are showing better scenario, while foreign banks are making
very poor show as far as Return On Assets is concerned.
Surprisingly in 2001-02, the foreign banks are showing negative
Return On Assets. It happens so mostly in case of foreign banks as
they spread their branches all over the world with a view to serve
their existing customers at their level best instead of merely
attracting the new customers.
Return On Assets in %
Hypothesis Testing
The researcher wanted to find that if there is any significant
difference regarding the performance related to Return On Assets among
all the five banking groups during 1997-98 to 2001-02 or not. This was
tested as below.
Null Hypothesis : There is no significant difference regarding Return On Assets
in % among all the banking groups during 1997-98 to 2001-02.
H0 = µ1 = µ2 = µ3 = µ4 = µ5
H1 = µ1 ≠ µ2 ≠ µ3 ≠ µ4 ≠ µ5
180

ANOVA TABLE
Source of variable SS Df Ms F Ratio 5% F limit (from table
F Between sample 20.29 (5-1)=4 5.07 52.73 F(4,20),2.87 Within sample 1.92 (25-5)=20 0.10
The above anova table shows that the calculated value of F is
52.73, which is more than the table value of 2.87, at 5% level of
significance. So, the null hypothesis is rejected again. It shows that
there is significant difference among all the five banking groups
from 1997-98 to 2001-02 related to performance of Return On
Assets in %.
181

References
1. Financial Management Chandra, Prasanna Tata McGrow Hill Publishing Co. Ltd.,
New Delhi (1997) 2. Financial Management I.M. Pandey Vikas Publishing House Pvt. Ltd., (1999) 3. Profitability of Public Sector Banks
- A Decomposition Model- RBI occasional papers 20 Das, Abhiman (1999) 4. IBA Bulletin March-2002, 2003 5. www.rbi.org.in
182
CHAPTER – 6
ANALYSIS OF CREDIT EFFICIENCY AND
PRODUCTIVITY OF INDIAN BANKING SECTOR.
6A) CREDIT EFFICIENCY
6A.1) TIER-I CAPITAL TO RISK-WEIGHTED ASSETS RATIO
6A.1.1) Tier-I Capital to Risk-Weighted Assets Ratio for SBI group during 1997-98 to 2001-02.
6A.1.2) Tier-I Capital to Risk-Weighted Assets Ratio for other nationalized banks during 1997-98 to 2001-02.
6A.1.3) Tier-I Capital to Risk-Weighted Assets Ratio for old private banks during 1997-98 to 2001-02.
6A.1.4) Tier-I Capital to Risk-Weighted Assets Ratio for new private banks during 1997-98 to 2001-02.
6A.1.5) Tier-I Capital to Risk-Weighted Assets Ratio for foreign banks during 1997-98 to 2001-02
6A.1.6) Tier-I Capital to Risk-Weighted Assets Ratio for all the five banking groups during 1997-98 to 2001-02.
183

6A.2) TIER-II CAPITAL TO RISK-WEIGHTED ASSETS
RATIO
6A.2.4) Tier-II Capital to Risk-Weighted Assets
Ratio for new private banks during 1997-98
to 2001-02.
6A.2.1) Tier-II Capital to Risk-Weighted Assets
Ratio for SBI group during 1997-98 to 2001-
02.
6A.2.2) Tier-II Capital to Risk-Weighted Assets
Ratio for other nationalized banks during
1997-98 to 2001-02.
6A.2.3) Tier-II Capital to Risk-Weighted Assets
Ratio for old private banks during 1997-98
to 2001-02.
6A.2.5) Tier-II Capital to Risk-Weighted Assets
Ratio for foreign banks during 1997-98 to
2001-02
6A.2.6) Tier-II Capital to Risk-Weighted Assets
Ratio for all the five banking groups during
1997-98 to 2001-02.
184

6A.3) NET NON-PERFORMING ASSETS TO NET
ADVANCES RATIO
6A.3.1) Net Non-Performing Assets To Net
Advances Ratio for SBI group during 1997-
98 to 2001-02.
6A.3.2) Net Non-Performing Assets To Net
Advances Ratio for other nationalized banks
during 1997-98 to 2001-02.
6A.3.3) Net Non-Performing Assets To Net
Advances Ratio for old private banks during
1997-98 to 2001-02.
6A.3.4) Net Non-Performing Assets To Net
Advances Ratio for new private banks
during 1997-98 to 2001-02.
6A.3.5) Net Non-Performing Assets To Net
Advances Ratio for foreign banks during
1997-98 to 2001-02.
6A.3.6) Net Non-Performing Assets To Net
Advances Ratio for all the five banking
groups during 1997-98 to 2001-02.
185

6B) PRODUCTIVITY
6B.1) BUSINESS PER EMPLOYEE (Rs. In lakh)
6B.1.1) Business Per Employee (Rs. In lakh) for SBI
group during 1997-98 to 2001-02.
6B.1.2) Business Per Employee (Rs. In lakh) for
other nationalized banks during 1997-98 to
2001-02.
6B.1.3) Business Per Employee (Rs. In lakh) for old
private banks during 1997-98 to 2001-02.
6B.1.4) Business Per Employee (Rs. In lakh) for new
private banks during 1997-98 to 2001-02.
6B.1.5) Business Per Employee (Rs. In lakh) for
foreign banks during 1997-98 to 2001-02.
6B.1.6) Business Per Employee (Rs. In lakh) for all
the five banking groups during 1997-98 to
2001-02.
186

6B.2) OPERATING PROFIT PER EMPLOYEE (Rs. In lakh)
6B.2.1) Operating Profit Per Employee (Rs. In lakh)
for SBI group during 1997-98 to 2001-02.
6B.2.2) Operating Profit Per Employee (Rs. In lakh)
for other nationalized banks during 1997-98
to 2001-02.
6B.2.3) Operating Profit Per Employee (Rs. In lakh)
for old private banks during 1997-98 to
2001-02.
6B.2.4) Operating Profit Per Employee (Rs. In lakh)
for new private banks during 1997-98 to
2001-02.
6B.2.5) Operating Profit Per Employee (Rs. In lakh)
for foreign banks during 1997-98 to 2001-
02.
6B.2.6) Operating Profit Per Employee (Rs. In lakh)
for all the five banking groups during 1997-
98 to 2001-02.
187

In this chapter, the two key parameters have been discussed.
One is the credit efficiency of banks and another is the productivity
of banks. Banks who are giving credit to all types of customers, have
to know whether this credit is efficient or not. To measure the credit
efficiency, three ratios are discussed here :
6A) Credit Efficiency :
To measure the credit efficiency of banks, the three ratios are
as under :
6A.1)Tier-I Capital To Risk-Weighted Assets Ratio :
Tier-I capital is called core capital. It includes the equity
capital and retained profits. Tier-I Capital is calculated with the risk-
weighted assets.
Tier-I Capital 2 100 Risk-Weighted Assets
6A.2)Tier-II capital To Risk-Weighted Assets Ratio :
Tier-II capital is called supplementary capital. It includes the
hidden reserves, revaluation reserves, general provisioning,
subordinated debt of maturity greater than 5 years, and hybrid debt
188

equity instruments such as cumulative preference shares and
convertible bonds. It is calculated with the risk-weighted assets.
Tier-II Capital 2 100 Risk-Weighted Assets
6A.3)Net Non-Performing Assets To Net Advances :
This ratio indicates how good are a bank’s provisioning
practices. If the ratio is lower, it is a very good sign of credit
efficiency of a bank. The higher ratio leads to weak performance of a
bank NPA is the latest debatable and manageable issue now a day
for every bank.
Net Non-Performing Assets 2 100
Net Advances
6A.1) Tier-I Capital To Risk-Weighted Assets Ratio :
Tier-I Capital is a core capital of a bank and by which strength
of a bank can be determined. The position of Tire I capital in
different banks for the period of five years from 1997-98 to 2001-02,
is as under :
189

Table 6A.1.1 Tier-I Capital To Risk-Weighted Assets Ratio for SBI Group
during 1997-98 to 2001-02 Tier-I Capital (in percent)
Banks 1997-1998
1998-1999
1999-2000
2000-2001
2001-2002
AVG
(%) PUBLIC SECTOR BANKS
State Bank of India (SBI) 10.69 9.36 8.28 8.58 9.22 9.23II. ASSOCIATES OF SBI
2 State Bank of Hyderabad N.A. N.A. 9.27 9.56 12.06 10.303 State Bank of Patiala 10.60 10.54 10.83 10.69 9.86 10.504 State Bank of Travancore 8.00 7.75 7.54 7.73 8.15 7.835 State Bank of Bikaner & Jaipur 8.40 10.45 11.09 11.62 6.70 9.656 State Bank of Mysore 7.62 7.49 7.38 6.76 9.97 7.847 State Bank of Indore 9.42 8.70 8.55 9.12 12.11 9.588 State Bank of Saurashtra 16.66 13.65 14.13 13.65 7.79 13.18
Average of State Bank Group [I+II] 8.92 8.49 9.63 9.71 9.48 9.25
I.1.
[Source : IBA bulletin March 2002, 2003]
Table No 6A1.1 discloses the Tier-I capital in state Bank of
India group, which has a set of 8 banks. Considering the periodical
average of each bank, it can be seen that the highest core capital is of
State Bank Of Saurashtra, that is 13.18%. State Bank of Hyderabad
and State Bank of Patiala have also the good ratio regarding Tier-I
capital, which is above 10%. There is little bit weak core capital
situation in State Bank of Mysore and State Bank of Travancore,
considering the periodical average. State Banks of India has
improved its performance regarding Tier-I capital in 2001-02
compared to previous 2 years.
190

Table 6A.1.2 Tier-I Capital To Risk-Weighted Assets Ratio for other nationalized Banks
during 1997-98 to 2001-02 Tier-I Capital (in percent)
Banks 1997-1998
1998-1999
1999-2000
2000-2001
2001-2002
AVG
(%) III. NATIONALISED BANKS
9 Canara Bank 8.81 8.57 7.77 7.31 6.22 7.7410 Punjab National Bank 5.45 6.42 6.73 6.84 8.80 6.8511 Bank of Baroda 9.47 9.05 8.86 8.49 7.56 8.6912 Bank of India 7.46 7.21 6.91 7.62 6.37 7.1113 Central Bank of India 7.20 7.21 6.65 5.74 6.56 6.6714 Union Bank of India 8.05 7.87 6.66 6.19 8.07 7.3715 Indian Overseas Bank 5.84 5.53 5.16 5.81 5.20 5.5116 Syndicate Bank 5.92 5.49 7.21 7.88 16.80 8.6617 Oriental Bank of Commerce 15.28 14.05 12.54 11.45 4.36 11.5418 Indian Bank 0.71 -9.00 -12.00 - 0.85 -4.8619 Uco Bank 6.07 7.22 6.59 5.36 6.17 6.2820 Allahabad Bank 6.68 6.57 7.10 6.70 9.60 7.3321 United Bank of India 6.60 8.10 8.20 7.00 6.37 7.2522 Andhra Bank 11.82 10.44 10.01 9.78 6.34 9.6823 Bank of Maharashtra 8.67 7.89 7.41 6.39 8.47 7.7724 Corporation Bank 16.00 12.80 12.70 13.00 4.89 11.8825 Dena Bank 7.71 6.91 7.07 4.38 6.16 6.4526 Vijaya Bank 7.40 5.70 6.01 8.04 8.84 7.2027 Punjab & Sind Bank 7.08 7.73 7.51 6.87 8.86 7.61
Average of 19 Nationalized Banks [III] 8.01 7.15 6.79 7.10 7.18 7.25[Source : IBA bulletin March 2002, 2003]
Table 6A.1.2 focuses on the situation of Tier-I capital in other
nationalized Banks. Considering the year wise average of whole the
group, the average declines in 1999-2000 and again improved and
reached to 7.18% in 2001-2002. However, the year wise average of
this group is quite less than of SBI group.
Considering the periodical average, Oriental bank of
commerce has gained above 10% ratio of Tier-I capital in spite of
191

lower ratio in 2001-02. The other consistent bank is Corporation
Bank, which has maintained the Tier-I ratio around 12% in spite of
poor performance regarding core capital in the year 2001-02. Other
banks have achieved this ratio almost within 5 to 8%, except the
negative result of Indian Bank.
Table 6A.1.3
Tier-I Capital To Risk-Weighted Assets Ratio for Old Private Sector Banks during 1997-98 to 2001-02
Tier-I Capital (in percent) Banks 1997-
1998 1998-1999
1999-2000
2000-2001
2001-2002
AVG
(%) PRIVATE SECTOR BANKS
1 Bharat Overseas Bank Ltd. 11.78 12.97 12.29 12.48 12.55 12.412 City Union Bank Ltd. 11.60 14.24 13.05 13.26 12.81 12.993 Development Credit Bank Ltd. 18.47 16.01 10.83 10.69 10.93 13.394 Lord Krishna Bank Ltd. 5.47 9.11 9.70 8.60 12.75 9.135 SBI Commercial & International Bank Ltd. 26.96 28.37 24.12 19.48 21.11 24.016 Tamilnad Mercantile Bank Ltd. 17.62 17.15 15.99 15.81 16.88 16.697 The Bank of Rajasthan Ltd. 4.86 0.42 5.10 8.91 10.01 5.868 The Benares State Bank Ltd. 3.76 - - - - 3.769 The Catholic Syrian Bank Ltd. 2.22 3.56 3.89 4.47 5.97 4.02
10 The Dhanalakshmi Bank Ltd. 9.13 8.50 7.66 7.33 9.36 8.4011 The Federal Bank Ltd. 9.18 6.48 7.72 7.72 6.96 7.6112 The Ganesh Bank of Kurundwad Ltd. 4.08 4.11 4.66 5.26 6.36 4.8913 The Jammu & Kashmir Bank Ltd. 14.28 19.47 15.51 14.33 12.41 15.2014 The Karnataka Bank Ltd. 11.85 10.62 10.64 11.06 11.10 11.0515 The Karur Vysya Bank Ltd. 12.96 13.28 14.48 15.12 15.62 14.2916 The Lakshmi Vilas Bank Ltd. 9.93 9.64 8.10 8.52 8.44 8.9317 The Nainital Bank Ltd. 8.37 12.86 14.32 13.72 12.92 12.4418 The Nedungadi Bank Ltd. 8.47 6.76 5.73 - -1.99 4.7419 The Ratnakar Bank Ltd. 7.63 8.05 10.60 9.42 11.93 9.5320 The Sangli Bank Ltd. 6.40 7.39 8.54 8.37 9.14 7.9721 The South Indian Bank Ltd. 6.30 8.40 8.07 8.36 7.68 7.7622 The United Western Bank Ltd. 9.58 7.99 8.55 6.62 6.98 7.9423 The Vysya Bank Ltd. 12.28 9.27 8.20 8.44 7.97 9.23
Average of 23 Private Sector Banks [I] 10.14 10.20 9.90 9.48 10.36 10.02[Source : IBA bulletin March 2002, 2003]
192

Table 6A.1.3 focuses the Tier-I capital in old private sector
banks. The ratio for periodical average can be seen higher than
previous groups. There are some notable results regarding periodical
average of Tier-I capital in this group. These are of SBI commercial
and International Bank Ltd., Tamilnad Mercantile Bank Ltd., the
Jammu & Kashmir Bank Ltd. and the Karur Vysya Bank Ltd. They
have made the overall average of 10.02%, which is very much
attractive. The average rose from the year 2000-01 to 2001-02 from
9.48% to 10.36% in this group which shows a better capital strength
for the banks.
Table 6A.1.4 Tier-I Capital To Risk-Weighted Assets Ratio for New Private Banks
during 97-98 to 01-02 Tier-I Capital (in percent)
Banks 1997-1998
1998-1999
1999-2000
2000-2001
2001-2002
AVG
(%) NEW PRIVATE SECTOR BANKS 24 ICICI Bank Ltd. 12.46 13.38 17.42 10.42 8.47 12.4325 HDFC Bank Ltd. 10.21 8.34 9.56 8.69 2.58 7.8826 UTI Bank Ltd. 9.63 11.60 7.99 5.84 7.44 8.5027 Global Trust Bank Ltd. 9.49 7.62 9.85 8.79 10.81 9.3128 Indusind Bank Ltd. 17.91 15.11 12.09 12.56 7.47 13.0329 Centurion Bank Ltd. 20.00 8.45 6.31 6.88 6.36 9.6030 IDBI Bank Ltd. 9.82 11.21 8.43 7.89 10.45 9.5631 Bank of Punjab Ltd. 16.34 14.64 9.81 8.52 6.42 11.15
Average of 8 New Private Sec.Banks [I] 13.23 11.29 10.18 8.70 7.50 10.18[Source : IBA bulletin March 2002, 2003]
193
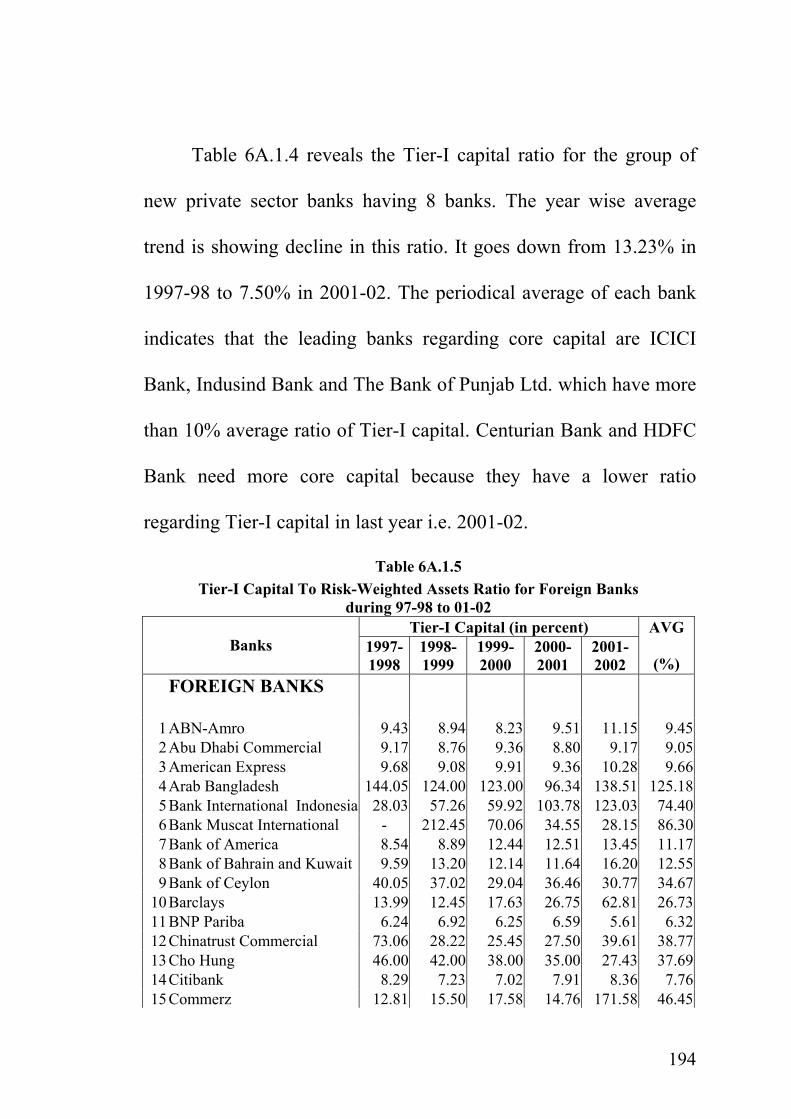
Table 6A.1.4 reveals the Tier-I capital ratio for the group of
new private sector banks having 8 banks. The year wise average
trend is showing decline in this ratio. It goes down from 13.23% in
1997-98 to 7.50% in 2001-02. The periodical average of each bank
indicates that the leading banks regarding core capital are ICICI
Bank, Indusind Bank and The Bank of Punjab Ltd. which have more
than 10% average ratio of Tier-I capital. Centurian Bank and HDFC
Bank need more core capital because they have a lower ratio
regarding Tier-I capital in last year i.e. 2001-02.
Table 6A.1.5 Tier-I Capital To Risk-Weighted Assets Ratio for Foreign Banks
during 97-98 to 01-02 Tier-I Capital (in percent)
1997-1998
1998-1999
1999-2000
2000-2001
2001-2002
AVG
(%)
FOREIGN BANKS
1 ABN-Amro 9.43 8.94 8.23 9.51 11.15 9.452 Abu Dhabi Commercial 9.17 8.76 9.36 8.80 9.17 9.053 American Express 9.68 9.08 9.91 9.36 10.28 9.664 Arab Bangladesh 144.05 124.00 123.00 96.34 138.51 125.185 Bank International Indonesia 28.03 57.26 59.92 103.78 123.03 74.406 Bank Muscat International - 212.45 70.06 34.55 28.15 86.307 Bank of America 8.54 8.89 12.44 12.51 13.45 11.178 Bank of Bahrain and Kuwait 9.59 13.20 12.14 11.64 16.20 12.559 Bank of Ceylon 40.05 37.02 29.04 36.46 30.77 34.67
10 Barclays 13.99 12.45 17.63 26.75 62.81 26.7311 BNP Pariba 6.24 6.92 6.25 6.59 5.61 6.3212 Chinatrust Commercial 73.06 28.22 25.45 27.50 39.61 38.7713 Cho Hung 46.00 42.00 38.00 35.00 27.43 37.6914 Citibank 8.29 7.23 7.02 7.91 8.36 7.7615 Commerz 12.81 15.50 17.58 14.76 171.58 46.45
Banks
194

16 Credit Agricole Indosuez 7.83 8.08 11.29 11.16 11.02 9.8817 Credit Lyonnais 7.80 8.90 8.50 9.50 9.10 8.7618 Deutsche 9.69 9.50 10.68 12.51 13.67 11.2119 Dresdner 16.89 19.36 18.69 10.66 39.00 20.9220 Ing Bank 12.91 12.79 21.15 15.00 12.39 14.8521 JP Chase Manhattan 13.00 12.53 45.86 43.77 85.21 40.0722 KBC - 95.00 18.51 22.86 96.75 58.2823 Krung Thai 342.00 236.00 197.42 148.75 166.21 218.0824 Mashreq 29.26 12.13 9.04 10.42 20.31 16.2325 MIZUHO Corporate Bank Ltd. -Fuji 43.45 23.62 25.29 18.21 11.01 24.3226 Morgan Guaranty Trust - 413.00 89.00 79.00 - 193.6727 Oman International a 13.01 9.07 9.65 12.82 17.28 12.3728 Oversea-Chinese 90.93 94.00 98.34 167.82 191.78 128.5729 Sakura 11.84 10.29 15.01 16.07 - 13.3030 Societ Generale 10.37 12.21 13.71 13.28 11.60 12.2331 Sonali 27.80 38.39 24.91 88.14 113.64 58.5832 Standard Chartered 6.90 6.80 6.00 6.70 6.90 6.6633 Standard Chartered Grindlays 6.58 6.48 5.98 6.90 6.54 6.5034 State Bank of Mauritius 73.50 46.69 35.16 30.55 46.20 46.4235 Sumitomo 40.67 16.58 18.43 19.24 20.86 23.16
The Bank of Nova Scotia 10.29 9.06 9.59 9.71 9.6837 The Bank of Tokyo- Mitsubishi 8.73 9.92 17.62 15.51 15.21 13.4038 The Development Bank of Singapore 31.47 23.26 18.13 15.56 12.73 20.2339 The Hongkong & Shanghai 6.62 6.58 5.68 8.63 7.47 7.0040 The Siam Commercial 30.00 39.00 29.97 33.05 -13.51 23.7041 Toronto Dominion 86.28 73.58 51.21 56.60 172.05 87.9442 UFG / Sanwa 30.35 31.97 36.17 34.91 29.44 32.57
Average of 42 Foreign Banks in India 33.03 44.68 30.88 32.35 45.22 37.23
36 9.73
[Source : IBA bulletin March 2002, 2003]
Table No. 6A.1.5 shows a very fluctuated Tier-I capital ratio
for the foreign banks. The remarkable and unbelievable higher ratios
are found in some foreign banks like Arab Bangladesh, Morgan
Guaranty Trust Bank, Krung Thai, Oversea-Chinese. The leading
foreign Banks having more branches like ABN–Amro Bank,
American Express Bank, Citibank and Stanchart Bank have the
195

periodical average ratio of Tier-I capital is less than 10%. The
overall average of whole the group for the period of five years is
37.23, which is showing very strengthening position of core capital
in foreign banks.
Table 6A.1.6 Tier-I Capital To Risk-Weighted Assets Ratio for all the five banking groups
during 1997-98 to 2001-02 (in percent)
Banking Groups
1997-1998
1998-1999
1999-2000
2000-2001
2001-2002
AVG (%)
1 SBI 8.92 8.49 9.63 9.71 9.48 9.252 Other Nationalized Banks 8.01 7.15 6.79 7.10 7.18 7.253 Old Private Banks 10.14 10.20 9.90 9.48 10.36 10.024 New Private Banks 13.23 11.29 10.18 8.70 7.50 10.185 Foreign Banks 33.03 44.68 30.88 32.35 45.22 37.23
AVG (%) 14.67 16.36 13.48 13.47 15.95 14.78
0
10
20
30
40
50
1997-1998
1998-1999
1999-2000
2000-2001
2001-2002
SBI Other Nationalized Banks Old Private Banks New Private Banks Foreign Banks
In Table No. 6A.1.6 and Chart Tier-I Capital, which comprises
of equity capital and retained profits is seen remarkably high in case
196

of foreign banks group and remarkably low in case of SBI group and
other nationalized banks group. According to the researcher, Tier-I
capital reflects the real strength of any bank or banking group. Here
one has to think about risk-weighted assets too. In case of foreign
banks, their Tier-I capital is seen quite more and their risk-weighted
assets are seen quite less in comparison with other banking groups.
This matter shows shrewd attitude of foreign banks. While in case of
SBI group and other nationalized banks group, their core capital is
very low and their risk-weighted assets are very high with
comparison to other banking groups. So their average of five years is
seen lower. Old Private Sector Banks and New Private Banks are
showing in- between satisfactory performance.
Tier-I Capital To Risk Weighted Assets Ratio
Hypothesis Testing
The researcher wanted to find out that if there is any
significant difference regarding the performance related to Tier-I
Capital To Risk-Weighed Assets Ratio among all the five banking
groups during 1997-98 to 2001-02 or not. This was tested as under.
197

Null Hypothesis :
There is no significant difference in Tier-I capital To Risk-
Weighted Assets Ratio among all the five banking groups during
1997-98 to 2001-02.
Ho = µ1 = µ2 = µ3 = µ4 = µ5
H1 = µ1 ≠ µ2 ≠ µ3 ≠ µ4 ≠ µ5
ANOVA TABLE Source of variable SS Df ms F Ratio 5% F limit
(from table F)
Between sample 8864.25 (5-1) = 4 2216.60 5.22 F (4,20) 2.87Within sample 8497.84 (25-5) = 20 424.89 The above anova table discloses that the calculated value of F
is 5.22, which is more than its table value at 5% level of
significance. Hence, null hypothesis is rejected. It indicates that
there is a definite and significant difference in all the banking groups
regarding Tier-I capital. The core capital is different in all the
banking groups for the period of 5 years from 1997-98 to 2001-02.
6A.2) Tier-II Capital To Risk-Weighted Assets Ratio :
Tier-II capital is a supplementary capital for the banks with
reference to Tier-I capital. The situation of this ratio is as under for
all the five banking groups :
198

Table 6A.2.1 Tier-II Capital To Risk-Weighted Assets Ratio for SBI Group
during 1997-98 to 2001-02 Tier-II Capital (in percent)
Banks 1997-1998
1998-1999
1999-2000
2000-2001
2001-2002
AVG
(%) PUBLIC SECTOR BANKS I.1. State Bank of India (SBI) 3.89 3.15 3.21 4.21 4.13 3.72II. ASSOCIATES OF SBI
2 State Bank of Hyderabad N.A. N.A. 1.59 2.72 1.36 1.893 State Bank of Patiala 2.64 1.93 1.77 1.68 4.17 2.444 State Bank of Travancore 3.48 2.52 3.55 4.06 4.63 3.655 State Bank of Bikaner & Jaipur 2.25 1.81 1.26 0.77 5.11 2.246 State Bank of Mysore 3.99 2.74 4.12 4.40 2.58 3.577 State Bank of Indore 0.41 3.65 2.71 3.61 1.09 2.298 State Bank of Saurashtra 1.48 0.70 0.35 0.24 4.75 1.50
Average of State Bank Group [I+II] 2.27 2.06 2.32 2.71 3.48 2.57[Source : IBA bulletin March 2002, 2003]
The reserves and surplus position of the banks can be seen by
Tier-II Capital Showing in table 6A.2.1. In the year 2001-02, the
ratio is 3.48 for the whole group, which reflect improvement than
previous years.
The reason for this improvement is the higher ratio in this year
for State Bank of Patiala, State Bank of Travancore and State Bank
of Bikaner & Jaipur as well as State Bank of Saurashtra. These
banks have improved the situation of subordinate capital, which is a
good sign. Still the periodical averages for State Bank of Hyderabad
and State Bank of Saurashtra have yet to be improved, as they are
less than 2% mostly.
199

Table 6A.2.2 Tier-II Capital To Risk-Weighted Assets Ratio for other nationalised Banks
during 1997-98 to 2001-02 Tier-II Capital (in percent)
Banks 1997-1998
1998-1999
1999-2000
2000-2001
2001-2002
AVG
(%) III. NATIONALISED BANKS
9 Canara Bank 0.73 2.39 1.87 2.53 4.40 2.3810 Punjab National Bank 3.36 4.37 3.58 3.40 3.79 3.7011 Bank of Baroda 2.58 4.25 3.24 4.31 3.76 3.6312 Bank of India 1.65 4.24 3.66 4.61 4.31 3.6913 Central Bank of India 3.20 4.67 4.53 4.28 4.60 4.2614 Union Bank of India 2.81 2.22 4.76 4.67 3.81 3.6515 Indian Overseas Bank 3.50 4.62 3.99 4.43 4.38 4.1816 Syndicate Bank 4.57 4.08 4.24 3.84 1.10 3.5717 Oriental Bank of Commerce 0.00 0.05 0.18 0.36 3.28 0.7718 Indian Bank 0.70 - - - 0.85 0.7819 Uco Bank 3.00 2.41 2.56 3.69 4.65 3.2620 Allahabad Bank 4.96 3.81 4.41 3.80 1.39 3.6721 United Bank of India 1.80 1.50 1.40 3.40 4.33 2.4922 Andhra Bank 0.55 0.58 3.35 3.64 4.36 2.5023 Bank of Maharashtra 2.23 1.87 4.25 4.25 3.65 3.2524 Corporation Bank 0.90 0.40 0.10 0.03 4.75 1.2425 Dena Bank 4.17 4.23 4.56 3.35 4.91 4.2426 Vijaya Bank 2.90 4.30 4.60 3.46 3.18 3.6927 Punjab & Sind Bank 4.31 3.21 4.06 4.55 3.39 3.90
Average of 19 Nationalised Banks [III] 2.52 2.80 3.12 3.29 3.63 3.07[Source : IBA bulletin March 2002, 2003]
The above table indicates the situation of other nationalized
banks regarding Tier-II capital. The year wise average for whole the
group is an indicator of progressive performance regarding Tier-II
capital. It increases from 2.52% in 97-98 to 3.63 in the year 2001-02.
Yet some banks have to improve their position of Tier-II capital as
they have less then 2% ratio. These banks are oriental Bank of
200

commerce Indian Bank and corporation Bank. How ever,
corporation Bank has increased the capacity in last year i.e. 2001-02.
Table 6A.2.3 Tier-II Capital To Risk-Weighted Assets Ratio for Old Private Sector Banks
during 97-98 to 01-02 Tier-II Capital (in percent)
Banks 1997-1998
1998-1999
1999-2000
2000-2001
2001-2002
AVG
(%) PRIVATE SECTOR BANKS
1 Bharat Overseas Bank Ltd. 1.22 0.73 0.39 1.95 2.54 1.372 City Union Bank Ltd. - 0.06 0.28 0.33 1.16 0.463 Development Credit Bank Ltd. 1.32 0.89 0.51 0.59 0.56 0.774 Lord Krishna Bank Ltd. 2.75 2.74 1.55 4.30 3.75 3.025 SBI Commercial & International Bank Ltd. 0.73 0.53 0.20 0.37 0.99 0.566 Tamilnad Mercantile Bank Ltd. 1.49 1.25 2.03 1.78 1.14 1.547 The Bank of Rajasthan Ltd. 0.68 0.42 0.63 1.66 2.06 1.098 The Benares State Bank Ltd. 0.36 - - - - 0.369 The Catholic Syrian Bank Ltd. 0.82 2.50 2.05 1.61 3.60 2.12
10 The Dhanalakshmi Bank Ltd. 2.26 1.56 2.36 2.36 1.87 2.0811 The Federal Bank Ltd. 0.25 3.84 3.61 2.57 3.67 2.7912 The Ganesh Bank of Kurundwad Ltd. 3.96 4.15 4.48 3.85 3.72 4.0313 The Jammu & Kashmir Bank Ltd. 6.20 5.02 3.31 3.11 3.05 4.1414 The Karnataka Bank Ltd. 1.38 0.23 0.40 0.31 1.86 0.8415 The Karur Vysya Bank Ltd. 1.51 1.25 0.68 0.44 1.28 1.0316 The Lakshmi Vilas Bank Ltd. 0.42 0.00 2.35 1.69 3.10 1.5117 The Nainital Bank Ltd. 1.09 0.95 0.79 2.09 1.96 1.3818 The Nedungadi Bank Ltd. 4.38 3.48 3.31 - - 3.7219 The Ratnakar Bank Ltd. 2.78 1.67 0.96 0.58 1.67 1.5320 The Sangli Bank Ltd. 4.58 4.19 3.59 3.10 2.50 3.5921 The South Indian Bank Ltd. 3.10 2.00 2.34 2.81 3.52 2.7522 The United Western Bank Ltd. 0.29 3.65 3.39 2.97 2.81 2.6223 The Vysya Bank Ltd. 0.20 1.36 4.04 3.61 3.60 2.56
Average of 23 Private Sector Banks [I] 1.82 1.85 1.88 1.83 2.29 1.93[Source : IBA bulletin March 2002, 2003]
Table 6A.2.3 shows the position of various banks of old
private sector banks. During the first four years of this study, the
overall average remains consistent for whole the group at lower than
201
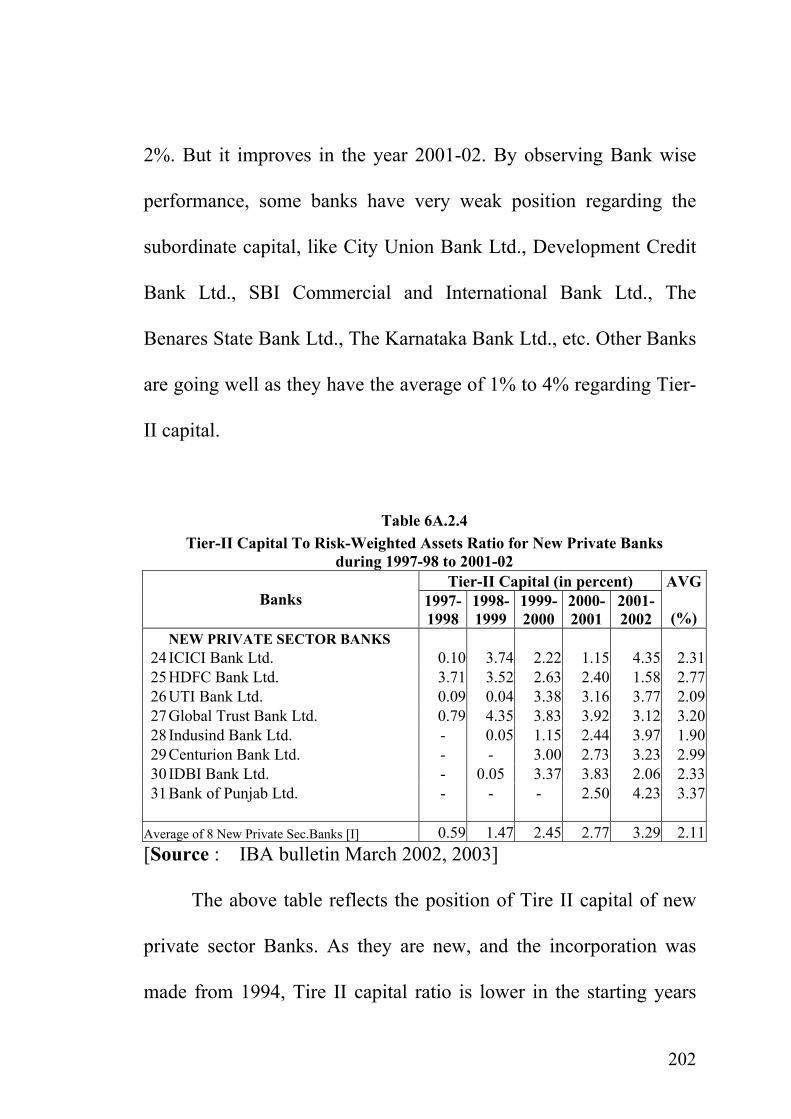
2%. But it improves in the year 2001-02. By observing Bank wise
performance, some banks have very weak position regarding the
subordinate capital, like City Union Bank Ltd., Development Credit
Bank Ltd., SBI Commercial and International Bank Ltd., The
Benares State Bank Ltd., The Karnataka Bank Ltd., etc. Other Banks
are going well as they have the average of 1% to 4% regarding Tier-
II capital.
Table 6A.2.4 Tier-II Capital To Risk-Weighted Assets Ratio for New Private Banks
during 1997-98 to 2001-02 Tier-II Capital (in percent)
Banks 1997-1998
1998-1999
1999-2000
2000-2001
2001-2002
AVG
(%) NEW PRIVATE SECTOR BANKS 24 ICICI Bank Ltd. 0.10 3.74 2.22 1.15 4.35 2.3125 HDFC Bank Ltd. 3.71 3.52 2.63 2.40 1.58 2.7726 UTI Bank Ltd. 0.09 0.04 3.38 3.16 3.77 2.0927 Global Trust Bank Ltd. 0.79 4.35 3.83 3.92 3.12 3.2028 Indusind Bank Ltd. - 0.05 1.15 2.44 3.97 1.9029 Centurion Bank Ltd. - - 3.00 2.73 3.23 2.9930 IDBI Bank Ltd. - 0.05 3.37 3.83 2.06 2.3331 Bank of Punjab Ltd. - - - 2.50 4.23 3.37
Average of 8 New Private Sec.Banks [I] 0.59 1.47 2.45 2.77 3.29 2.11[Source : IBA bulletin March 2002, 2003]
The above table reflects the position of Tire II capital of new
private sector Banks. As they are new, and the incorporation was
made from 1994, Tire II capital ratio is lower in the starting years
202

i.e. 1997-98 and 1998-99 for some banks. However, all the banks
excluding HDFC Bank have improved the position of supplementary
capital. The year wise average is going up for whole the group from
0.59% to 3.29%. That is a good sign for credit efficiency.
Table 6A.2.5 Tier-II Capital To Risk-Weighted Assets Ratio for Foreign Banks
during 1997-98 to 2001-02 Tier-II Capital (in percent)
Banks 1997-1998
1998-1999
1999-2000
2000-2001
2001-2002
AVG
(%) FOREIGN BANKS
1 ABN-Amro 0.39 0.33 1.86 1.91 2.02 1.302 Abu Dhabi Commercial 1.12 1.25 1.25 1.25 1.25 1.223 American Express 0.18 0.17 0.18 0.23 0.43 0.244 Arab Bangladesh - - - - - - 5 Bank International Indonesia - - - - - - 6 Bank Muscat International - - - - 0.18 0.187 Bank of America 0.41 0.37 0.49 0.52 7.62 1.888 Bank of Bahrain and Kuwait 0.89 0.18 0.16 0.19 0.83 0.459 Bank of Ceylon - 0.03 0.03 0.03 0.17 0.07
10 Barclays 0.53 0.45 0.12 0.22 0.75 0.4111 BNP Pariba 2.56 2.17 3.30 3.33 4.05 3.0812 Chinatrust Commercial 73.27 0.03 0.11 0.77 0.50 14.9413 Cho Hung - - - - 0.22 0.2214 Citibank 0.32 2.77 3.60 3.33 2.68 2.5415 Commerz - 0.31 - 0.29 - 0.3016 Credit Agricole Indosuez 0.58 0.48 0.53 0.44 0.21 0.4517 Credit Lyonnais 0.90 1.00 1.20 1.10 1.20 1.0818 Deutsche - - - 0.16 0.88 0.5219 Dresdner - - - - - - 20 Ing Bank - - - - 0.08 0.0821 JP Chase Manhattan 0.03 - - 0.02 0.67 0.2422 KBC - - - 0.15 - 0.1523 Krung Thai 5.22 - 0.32 0.24 1.44 1.8124 Mashreq 0.58 - - 0.12 0.23 0.3125 MIZUHO Corporate Bank Ltd. -Fuji - - - 0.17 0.13 0.1526 Morgan Guaranty Trust - - - - - - 27 Oman International a 0.37 - 1.43 1.39 1.58 1.1928 Oversea-Chinese - - - 0.29 0.34 0.32
203

29 Sakura - - - 0.14 - 0.1430 Societ Generale 0.37 0.29 0.24 0.65 1.25 0.5631 Sonali - - - - - - 32 Standard Chartered 1.60 1.50 3.50 2.90 2.38 2.3833 Standard Chartered Grindlays 2.47 2.56 4.95 5.62 6.54 4.4334 State Bank of Mauritius - 0.09 0.07 0.23 0.58 0.2435 Sumitomo - - 0.11 0.16 0.10 0.1236 The Bank of Nova Scotia 0.01 - 0.08 0.26 0.39 0.1937 The Bank of Tokyo - Mitsubishi - - - - 0.15 0.1538 The Development Bank of Singapore - - 0.01 0.37 0.58 0.3239 The Hongkong & Shanghai 3.20 2.77 4.62 3.74 3.45 3.5640 The Siam Commercial - - 0.09 0.18 0.18 0.1541 Toronto Dominion 0.33 0.65 0.77 1.27 1.23 0.8542 UFG / Sanwa - - - - - -
Average of 42 Foreign Banks in India 2.27 0.41 0.69 0.75 1.11 1.05[Source : IBA bulletin March 2002, 2003]
The position of Tier-II capital in foreign banks can be seen in
Table no.6A.2.5. as all the banks generally are in the initial stage of
their business, Tier-II capital can not be there. In some banks, it is
-(-), in some banks, it is negligible (-), and in some banks, it is less
than 1%. The notable performance regarding subordinate capital like
reserves, surplus and cumulative preference shares, Stanchart Bank
and Stanchart Grindlays Bank as well as BNP Pariba Bank and The
Hong Kong & Shanghai Bank are ahead from others. In 1997-98 in
case of Chinatrust Commercial Bank, this ratio is the highest ever in
the group of 73.27%.
204

Table 6A.2.6 Tier-II Capital To Risk-Weighted Assets Ratio for all the five banking groups
during 1997-98 to 2001-02 (in percent)
Banking Groups
1997-1998
1998-1999
1999-2000
2000-2001
2001-2002
AVG (%)
1 SBI 2.27 2.06 2.32 2.71 3.48 2.572 Other Nationalised Banks 2.52 2.80 3.12 3.29 3.63 3.073 Old Private Banks 1.82 1.85 1.88 1.83 2.29 1.934 New Private Banks 0.59 1.47 2.45 2.77 3.29 2.115 Foreign Banks 2.27 1.050.41 0.69 0.75 1.11
AVG (%) 1.89 1.72 2.09 2.27 2.76 2.15
0
1
2
3
4
1997-1998
1998-1999
1999-2000
2000-2001
2001-2002
SBI Other Nationalized Banks Old Private Banks New Private Banks Foreign Banks
The above Table No. 6A.2.6 and Chart represent Tier-II
capital relationship with Risk-Weighted Assets of all the five
banking groups. Tier-II capital comprises of subordinate capital. The
above chart represents almost adverse scenario than that of Tier-I
capital chart. Here the chart shows the least Tier-II Capital to Risk-
205

Weighted Assets of foreign banks group except 1997-98. The Tier-II
capital to Risk-Weighted Assets is seen remarkably high in case of
SBI group and other nationalized banks group. This means that Tier-
II capital to Risk-Weighted Assets is mostly very high in the capital
structure of the banks in SBI group and of the banks in other
nationalized banks group. Once again the shrewdness of foreign
banks is reflected here.
Tier-II Capital To Risk-Weighted Assets Ratio
Hypothesis Testing
The Researcher wanted to find out that if there is any
significant difference regarding the performance related to Tier-II
Capital To Risk-Weighted Assets Ratio among all the five banking
groups during 1997-98 to 2001-02 or not. This was tested as under.
Null hypothesis :
There is no significant difference in Tire II Capital To Risk-
Weighted Assets Ratio among all the five banking groups during
1997-98 to 2001-02.
Ho = µ1 = µ2 = µ3 = µ4 = µ5
H µ1 ≠ µ2 ≠ µ3 ≠ µ4 ≠ µ5 1 =
206

ANOVA TABLE
Source of Variable
SS df MS F Ratio 5% F limit (From table F)
Between sample 135.62 (5-1) = 4 33.91 8.22 F (4, 20) 2.87Within sample 82.50 (25-5) = 20 4.13
The above anova table reveals that the table value of F is 2.87
at 5% level of significance, while the calculated value of F is 8.22.
As the calculated value of F is more than its table value, null
hypothesis is rejected again. It shows that there is a significant
difference in Tier-II Capital- supplementary capital in all the five
banking groups. Nationalized banks have a better average than other
groups.
6A.3) Net Non-Performing Assets To Net Advance Ratio:
This is a credit efficiency parameter. It indicates how good are
a Bank’s provisioning practices and gets recovery from advances. If
the ratio is lower, it is a sign of credit efficiency. There is a big
problem of NPAs for all the banks now a day. Some regulations
from RBI related to NPAs have been also imposed.
207

Table 6A.3.1
Net NPAs to Net Advances Ratio for SBI Group during 1997-98 to 2001-02
Net NPAs to Net Advances (in percent) Banks 1997-
1998 1998-1999
1999-2000
2000-2001
2001-2002
AVG
(%) PUBLIC SECTOR BANKS I.1. State Bank of India (SBI) 6.07 7.18 6.41 6.03 5.63 6.26II. ASSOCIATES OF SBI
2 State Bank of Hyderabad 10.88 8.78 7.30 7.82 5.72 8.103 State Bank of Patiala 7.04 8.23 6.09 4.92 4.97 6.254 State Bank of Travancore 12.21 10.80 8.58 7.75 3.58 8.585 State Bank of Bikaner & Jaipur 7.13 10.45 10.14 7.83 7.36 8.586 State Bank of Mysore 10.75 10.55 8.12 7.65 2.94 8.007 State Bank of Indore 10.96 10.10 7.55 5.91 4.95 7.898 State Bank of Saurashtra 6.57 7.70 7.87 7.30 5.77 7.04
Average of State Bank Group [I+II] 8.95 9.22 7.76 6.90 5.12 7.59[Source : IBA bulletin March 2002, 2003]
Table 6.3.1 shows the NPA /NA in percentages for the SBI
group. By observing the average, it goes up from 1997-98 to 1998-
99 and than goes down respectively. However, the ratio is high, this
trend is good. It shows the improvement in credit efficiency. The
high ratio of NPA, which is not good, can be seen in State Bank of
Hyderabad, State Bank of Travancore, State Bank of Bikaner &
Jaipur and State Bank of Mysore. Other banks from this group have
normal ratio of NPA, somewhat higher than private banks. This
shows average credit efficiency not much more efficient. May be the
208

reason of giving advances without preventions or rural advances or
industrial advances. The recovery efficiency is also weak in this
group.
Table 6A.3.2 Net NPAs to Net Advances Ratio for other nationalised Banks
during 1997-98 to 2001-02 Net NPAs to Net Advances (in percent)
Banks 1997-1998
1998-1999
1999-2000
2000-2001
2001-2002
AVG
(%) III. NATIONALISED BANKS
9 Canara Bank 7.52 7.09 5.28 4.84 10.57 7.0610 Punjab National Bank 9.57 8.96 8.52 6.69 2.45 7.2411 Bank of Baroda 6.60 7.70 6.95 6.77 5.06 6.6212 Bank of India 7.34 7.55 8.61 6.72 6.02 7.2513 Central Bank of India 12.21 9.79 9.84 9.72 5.81 9.4714 Union Bank of India 7.66 8.70 7.97 6.87 3.89 7.0215 Indian Overseas Bank 6.26 7.30 7.65 7.01 7.98 7.2416 Syndicate Bank 5.78 3.93 3.17 4.05 2.31 3.8517 Oriental Bank of Commerce 4.50 4.50 3.80 3.60 16.31 6.5418 Indian Bank 26.01 21.67 16.18 10.06 8.28 16.4419 Uco Bank 11.14 10.83 8.75 6.35 6.32 8.6820 Allahabad Bank 15.09 12.54 12.24 11.23 3.20 10.8621 United Bank of India 14.10 14.70 12.70 10.50 11.70 12.7422 Andhra Bank 2.92 4.26 3.47 2.96 5.32 3.7923 Bank of Maharashtra 8.59 8.72 6.97 7.41 4.52 7.2424 Corporation Bank 2.93 1.98 1.92 1.98 5.45 2.8525 Dena Bank 8.28 7.67 13.47 18.37 6.26 10.8126 Vijaya Bank 7.56 6.72 6.09 6.23 7.90 6.9027 Punjab & Sind Bank 10.84 10.48 9.39 12.27 6.02 9.80
Average of 19 Nationalised Banks [III] 9.21 8.69 8.05 7.56 6.60 8.02[Source : IBA bulletin March 2002, 2003]
209

For getting more business, some banks offer advances on
higher risk. After giving advances, no efficiency to recover that
money can be seen in nationalized banks. The govt. policies for
giving advances in rural &industrial areas reflect in this table.
The above table shows higher NPA ratio, which leads to weak
performance related to credit efficiency. A bank can move to
progress only if its credit efficiency is good. But, hear, we can see
that the average of NPA in this group is very high. Indian Bank,
Allahabad Bank, united Bank of India Dena Bank and Punjab &
Sind Bank are very much weak related to credit efficiency.
Again the Corporation Bank’s NPA ratio is very much low,
that shows efficiency in credit /recovery. That’s why, other ratios
gives good favour to this bank. Andhra Bank and Syndicate Bank
are also good in the race of credit efficiency and recovery
operations.
210

Table 6A.3.3 Net NPAs to Net Advances Ratio for Old Private Sector Banks
during 1997-98 to 2001-02 Net NPAs to Net Advances
(in percent) Banks 1997-1998
1998-1999
1999-2000
2000-2001
2001-2002
AVG
(%) PRIVATE SECTOR BANKS
1 Bharat Overseas Bank Ltd. 4.40 4.13 6.39 4.14 4.38 4.692 City Union Bank Ltd. 7.54 7.96 7.26 8.20 8.22 7.843 Development Credit Bank Ltd. 5.02 4.79 5.86 5.94 6.47 5.624 Lord Krishna Bank Ltd. 14.09 20.60 13.94 12.92 9.85 14.285 SBI Commercial & International Bank Ltd. 7.89 21.88 13.96 22.56 23.43 17.946 Tamilnad Mercantile Bank Ltd. 5.37 5.67 5.77 5.99 6.66 5.897 The Bank of Rajasthan Ltd. 9.14 9.50 9.65 - 8.86 9.298 The Benares State Bank Ltd. 16.85 29.71 24.70 23.70 - 23.749 The Catholic Syrian Bank Ltd. 11.27 14.88 12.41 9.99 9.92 11.69
10 The Dhanalakshmi Bank Ltd. 11.01 12.33 11.08 11.34 11.66 11.4811 The Federal Bank Ltd. 5.28 7.53 8.56 10.08 8.60 8.0112 The Ganesh Bank of Kurundwad Ltd. 6.18 7.03 9.93 10.12 14.08 9.4713 The Jammu & Kashmir Bank Ltd. 4.57 3.79 3.22 2.45 1.88 3.1814 The Karnataka Bank Ltd. 3.06 4.99 5.73 6.93 5.90 5.3215 The Karur Vysya Bank Ltd. 1.87 4.35 3.77 4.73 6.33 4.2116 The Lakshmi Vilas Bank Ltd. 6.07 6.72 5.38 6.47 9.13 6.7517 The Nainital Bank Ltd. 5.99 2.84 0.82 - - 3.2218 The Nedungadi Bank Ltd. 9.41 12.23 15.65 21.04 31.05 17.88
The Ratnakar Bank Ltd. 6.84 7.79 8.70 7.58 8.60 7.9020 The Sangli Bank Ltd. 9.43 8.26 7.56 6.64 5.97 7.5721 The South Indian Bank Ltd. 6.35 11.06 8.67 7.13 6.64 7.9722 The United Western Bank Ltd. 5.73 8.28 4.83 9.48 10.72 7.8123 The Vysya Bank Ltd. 8.45 14.31 9.11 4.77 4.59 8.25
Average of 23 Private Sector Banks [I] 7.47 10.03 8.82 8.79 9.22 8.87
19
[Source : IBA bulletin March 2002, 2003]
The above table shows that the average of NPA ratio in old
private Banks is very high. Almost it is around or above 8% in 1998-
99. It is 10.03% in 1998-99, which is very high. The Catholic Syrian
211

Bank Ltd., The Nedungadi Bank Ltd., The Dhanalakshmi Bank Ltd.,
Lord Krishna Bank Ltd., The Benares State Bank Ltd., & SBI
Commercial & International Bank Ltd., are very much poor in
performance related to credit efficiency. That shows the weak
operations of these banks in providing advances and getting recovery
from the customers. Non-reliable & prompt advances to get more
business are highly given here. The good performance can be seen in
Jammu & Kashmir Bank Ltd., The Karur Vysya Bank Ltd., The
Nainital Bank Ltd., Bharat Overseas Bank Ltd., and The Karnataka
Bank Ltd.
Table 6A.3.4 Net NPAs to Net Advances Ratio for New Private Banks
during 1997-98 to 2001-02 Net NPAs to Net Advances (in
percent) Banks 1997-1998
1998-1999
1999-2000
2000-2001
2001-2002
AVG
(%) NEW PRIVATE SECTOR BANKS 24 ICICI Bank Ltd. 1.14 2.88 1.53 2.19 2.93 2.1325 HDFC Bank Ltd. 1.18 0.73 1.09 0.45 5.82 1.8526 UTI Bank Ltd. 5.63 6.32 4.54 3.43 9.23 5.8327 Global Trust Bank Ltd. 2.98 2.15 0.87 3.75 0.50 2.0528 Indusind Bank Ltd. 3.96 7.20 5.98 5.25 5.48 5.5729 Centurion Bank Ltd. 0.38 3.73 2.70 2.96 2.21 2.4030 IDBI Bank Ltd. 0.32 1.28 1.95 5.24 6.59 3.0831 Bank of Punjab Ltd. 1.14 3.66 2.32 2.31 2.74 2.43
Average of 8 New Private Sec.Banks [I] 2.09 3.49 2.62 3.20 4.44 3.17[Source : IBA bulletin March 2002, 2003]
212

The above table is looking very much impressive related to
NPA ratio because the average in all the years is comparatively very
low to other groups. It is below to 3.5% from 1997-98 to 2000-01. It
is a good sign of credit efficiency & recovery of this group.
Most impressive performance related to credit efficiency in
this group is of ICICI Bank, and HDFC Bank (the best). Others have
the average performance around 3 to 5%, but batter than old private
and nationalized banks.
The poor performance in this group is of Indusind Bank,
because it works in local industrial areas and gives advances as to
most of the industrial groups. Because of the slack period over 5
years recovery problem are there UTI Bank has also low credit
efficiency related to other banks in the group.
Table 6A.3.5 Net NPAs to Net Advances Ratio for Foreign Banks
during 1997-98 to 2001-02 Net NPAs to Net Advances (in
percent) Banks 1997-1998
1998-1999
1999-2000
2000-2001
2001-2002
AVG
(%) FOREIGN BANKS
1 ABN-Amro 0.42 0.45 0.30 1.22 1.34 0.752 Abu Dhabi Commercial 5.94 3.59 2.10 1.92 13.43 5.403 American Express 1.21 2.32 4.32 6.20 7.56 4.324 Arab Bangladesh - - 6.07 4.24 1.39 3.905 Bank International Indonesia - 10.53 48.78 50.75 61.39 42.866 Bank Muscat International - - 2.38 0.81 1.10 1.43
213

7 Bank of America 0.17 - 1.85 0.68 0.18 0.728 Bank of Bahrain and Kuwait 15.20 11.34 7.69 11.51 11.40 11.439 Bank of Ceylon 9.62 16.43 22.14 28.74 23.88 20.16
10 Barclays 9.30 3.35 - - 36.04 16.2311 BNP Pariba - 0.63 0.08 0.64 1.62 0.7412 Chinatrust Commercial - 4.73 4.61 3.76 - 4.3713 Cho Hung 1.41 1.88 1.48 0.91 0.47 1.2314 Citibank 0.57 2.08 1.05 0.70 0.40 0.9615 Commerz 3.88 7.06 7.14 13.64 100.00 26.3416 Credit Agricole Indosuez 16.40 24.75 6.13 1.21 0.36 9.7717 Credit Lyonnais 3.10 - 4.10 3.50 3.80 3.6318 Deutsche 1.28 1.28 5.33 1.23 0.38 1.9019 Dresdner 12.33 16.16 13.50 29.45 - 17.8620 Ing Bank - 5.67 13.26 5.94 26.82 12.9221 JP Chase Manhattan - - 0.00 - - 0.0022 KBC - - - 0.24 - 0.2423 Krung Thai - - - - 35.36 35.3624 Mashreq 22.49 24.21 20.96 13.39 - 20.2625 MIZUHO Corporate Bank Ltd. -Fuji - 6.02 10.28 3.24 4.75 6.0726 Morgan Guaranty Trust - - 0.00 - - 0.0027 Oman International 25.40 38.03 33.79 37.11 41.52 35.1728 Oversea-Chinese - - 15.97 18.44 100.00 44.8029 Sakura 3.61 12.59 16.49 1.03 - 8.4330 Societ Generale 14.24 11.94 8.53 7.27 0.52 8.5031 Sonali - - - - 1.58 1.5832 Standard Chartered 2.42 3.18 2.04 1.53 0.40 1.9133 Standard Chartered Grindlays 0.59 0.26 0.03 0.41 0.59 0.3834 State Bank of Mauritius 1.79 10.55 7.76 18.93 16.30 11.0735 Sumitomo - - 16.13 16.76 18.52 17.1436 The Bank of Nova Scotia 2.80 2.80 1.15 2.04 2.72 2.3037 The Bank of Tokyo - Mitsubishi 15.20 13.45 2.40 0.01 - 7.7738 The Development Bank of Singapore 9.18 4.93 0.00 - - 4.7039 The Hongkong & Shanghai 1.99 0.91 1.04 0.99 2.27 1.4440 The Siam Commercial - 10.51 5.17 39.18 71.95 31.7041 Toronto Dominion - - - - - - 42 UFG / Sanwa 0.69 12.33 17.67 9.61 12.69 10.60
Average of 42 Foreign Banks in India 4.90 6.28 7.42 8.03 15.02 8.33[Source : IBA bulletin March 2002, 2003]
NPA ratio in foreign banks is as equal as old private banks and
nationalized banks. Major 10 to 12 banks, which are on Top have the
214

lower ratio of NPA that shows the higher credit efficiency. These
Banks are Citibank, The Hongkong & Shanghi Bank, Stanchart
Bank, ABN-Amro Bank, Bank of America, Deutsche Bank, BNP
Pariba Bank, etc. These banks’ NPA Ratio is less than 1% to 2%.
The average reflects the poor performance of single branch
banks, which is not so much important. Some of these banks have
the NPA Ratio more than 15% to 20%. The good credit efficiency
may be due to careful advances to reliable customers and efficient
and prompt recovery from the customers. The worst performance
seen in this area is in Bank International Indonesia, Commerze
Bank, Krung Thai Bank, Oman International Bank, Oversea-Chinese
Bank and The Siam Commercial Bank.
Table 6A.3.6 Net NPAs to Net Advances Ratio for all the five banking groups during 1997-98
to 2001-02 (in percent)
Banking Groups
1997-1998
1998-1999
1999-2000
2000-2001
2001-2002
AVG (%)
1 SBI 8.95 9.22 7.76 6.90 5.12 7.592 Other Nationalized Banks 9.21 8.69 8.05 7.56 6.60 8.02
Old Private Banks 7.47 10.03 8.82 8.79 9.22 8.874 New Private Banks 2.09 3.49 2.62 3.20 4.44 3.175 Foreign Banks 4.90 6.28 7.42 8.03 15.02 8.33
AVG (%) 6.52 7.54 6.94 6.90 8.08 7.20
3
215

02468
10121416
1997-1998
1998-1999
1999-2000
2000-2001
2001-2002
SBI Other Nationalized Banks Old Private Banks New Private Banks Foreign Banks
The above Table no 6A.3.6. and Chart exhibit the Net Non-
Performing Assets to Net Advances Ratio as far as the credit
efficiency is concerned. If this ratio is higher, we have to believe that
the credit efficiency is lower. By seeing the above table and chart we
can know that as this ratio is the lowest of new private banks among
all the five banking group, the credit efficiency of new private banks
group must be very high. Surprisingly this ratio is seen very high in
old private sector banks group and in foreign banks. Due to the
absence of effective provisions of securitisation Act, this ratio is
216

seen very high in case of SBI group and other nationalized banks
group too.
Net NPAs to Net Advances Ratio
Hypothesis Testing
The researcher wanted to find out that if there is any
significant difference regarding the performance related to Net Non-
Performing Assets to Net Advances Ratio among all the five
banking groups during 1997-98 to 2001-02 or not. This was tested as
under.
Null Hypothesis :
There is no significant difference in Non Performing Assets to
Net Advances Ratio among all the five banking groups during 1997-
98 to 2001-02.
Ho = µ1 = µ2 = µ3 = µ4 = µ5
H1 = µ1 ≠ µ2 ≠ µ3 ≠ µ4 ≠ µ5
ANOVA TABLE Source of variable
SS df MS F Ratio 5% F limit (from table F)
Between Sample 1483.43 (5-1) = 4 370.86 5.68 F (4,20) 2.87 Within Sample 1305.16 (25-5) = 20 65.26
217

The above table indicates that the table value of F is 2.87 at
0.05 level of significance. As the calculated value of F is 5.68, which
is more than its table value, so null hypothesis is rejected. There is a
difference in all the banking group regarding the ratio of Net NPA to
Net Advances. The average is the lowest in new private banks and
highest in old private banks, which is a very warning factor for old
private banks.
6B) PRODUCTIVITY :
The last parameter for the appraisal of banks is labour
productivity, which can be measured by the following two ratios.
6B.1)Business Per employee (Rs. in lakh) :
This is a productivity parameter. It comes in Rs. in lakh. This
ratio is an indicator of degree of labour or employee’s productivity
of Banks Naturally, if the ratio is higher, it indicates more
productivity of labour in Banks. The analysis of BPE is as under in
each group.
Business :
Business is equal to aggregate of deposits plus aggregate
advances.
218

Employees :
In case of the foreign banks, employees in India as at the end
of the year. Employees in India include officers, clerks and
subordinates (part time and full time). However, in the case of all
other banks, employees means total employees, that is inclusive of
employees based overseas as at the end of the year.
This ratio shows the productivity of the employees. The
formula is __
Business Business Per Employee (In Rs.) =
No. of Employees
Table 6B.1.1
Business per Employee (Rs. in lakh) for SBI Group during 1997-98 to 2001-02
Business per Employee (Rs. in lakh) Bank 1997-
1998 1998-1999
1999-2000
2000-2001
2001-2002
AVG
PUBLIC SECTOR BANKS I.1. State Bank of India (SBI) 75.44 93.64 111.20 136.58 186.84 120.74II. ASSOCIATES OF SBI
2 State Bank of Hyderabad 90.00 109.00 126.00 165.00 132.34 124.473 State Bank of Patiala 91.23 106.67 123.62 143.45 191.64 131.324 State Bank of Travancore 89.81 99.97 121.65 157.32 186.75 131.105 State Bank of Bikaner & Jaipur 63.24 74.17 86.47 105.19 136.14 93.046 State Bank of Mysore 62.35 70.75 81.61 112.15 191.16 103.607 State Bank of Indore 75.02 80.52 96.23 126.00 157.44 107.04
State Bank of Saurashtra 79.28 82.10 98.28 123.87 172.16 111.14 Average of State Bank Group [I+II] 78.30 89.60 105.63 133.70 169.31 115.31
8
[Source : IBA bulletin March 2002, 2003]
219

Table 6B.1.1 shows the BPE (Rs. in lakh) for SBI group. The
overall average trend is going higher that can be seen in this table. In
SBI group Rs.78.3 lakh was the Business per employee. It improves
in every year and reaches at Rs. 169.31 lakh in 2001-02. The
productivity seems better because of competition and strategically
administration. There may be any other reason for looking better
improvement in 2000-01 & 2001-02 and that is VRS. Because of
VRS, the no. of employees had gone down and so that the BPE Ratio
is looking high. The highest BPE of Rs. 191.64 lakh is seen in case
of State Bank of Patiala in 2001-02 of which average is the highest
in SBI group during 1997-98 to 2001-02.
Table 6B.1.2 Business per Employee (Rs. in lakh) for other nationalised Banks
during 1997-98 to 2001-02 Business per Employee (Rs. in lakh)
Banks 1997-1998
1998-1999
1999-2000
2000-2001
2001-2002
AVG
III. NATIONALISED BANKS 9 Canara Bank 102.33 116.88 135.20 190.67 169.48 142.91
10 Punjab National Bank 75.65 89.58 106.48 141.95 219.86 126.7011 Bank of Baroda 117.24 134.75 142.82 166.11 245.42 161.2712 Bank of India 99.14 131.00 135.65 184.26 225.75 155.1613 Central Bank of India 66.38 79.55 93.30 110.38 193.61 108.6414 Union Bank of India 96.98 112.94 135.44 183.23 203.27 146.3715 Indian Overseas Bank 90.79 103.78 116.87 141.40 172.65 125.1016 Syndicate Bank 53.26 88.83 111.36 133.68 292.16 135.8617 Oriental Bank of Commerce 134.80 169.70 218.20 263.20 213.81 199.94
220
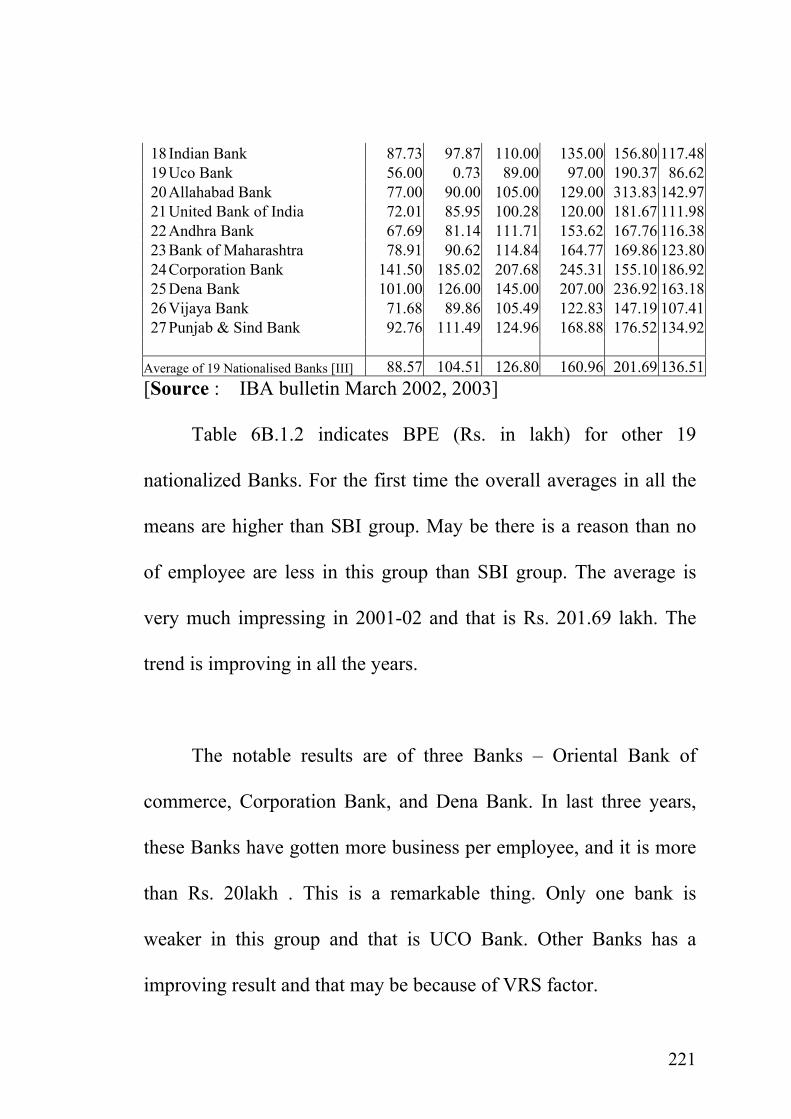
18 Indian Bank 87.73 97.87 110.00 135.00 156.80 117.4819 Uco Bank 56.00 0.73 89.00 97.00 190.37 86.6220 Allahabad Bank 77.00 90.00 105.00 129.00 313.83 142.9721 United Bank of India 72.01 85.95 100.28 120.00 181.67 111.9822 Andhra Bank 67.69 81.14 111.71 153.62 167.76 116.3823 Bank of Maharashtra 78.91 90.62 114.84 164.77 169.86 123.8024 Corporation Bank 141.50 185.02 207.68 245.31 155.10 186.9225 Dena Bank 101.00 126.00 145.00 207.00 236.92 163.1826 Vijaya Bank 71.68 89.86 105.49 122.83 147.19 107.4127 Punjab & Sind Bank 92.76 111.49 124.96 168.88 176.52 134.92
Average of 19 Nationalised Banks [III] 88.57 104.51 126.80 160.96 201.69 136.51[Source : IBA bulletin March 2002, 2003]
Table 6B.1.2 indicates BPE (Rs. in lakh) for other 19
nationalized Banks. For the first time the overall averages in all the
means are higher than SBI group. May be there is a reason than no
of employee are less in this group than SBI group. The average is
very much impressing in 2001-02 and that is Rs. 201.69 lakh. The
trend is improving in all the years.
The notable results are of three Banks – Oriental Bank of
commerce, Corporation Bank, and Dena Bank. In last three years,
these Banks have gotten more business per employee, and it is more
than Rs. 20lakh . This is a remarkable thing. Only one bank is
weaker in this group and that is UCO Bank. Other Banks has a
improving result and that may be because of VRS factor.
221

Table 6B.1.3 Business per Employee (Rs. in lakh)for Old Private Sector Banks
during 1997-98 to 2001-02 Business per Employee (Rs. in lakh)
Banks 1997-1998
1998-1999
1999-2000
2000-2001
2001-2002
AVG
PRIVATE SECTOR BANKS 1 Bharat Overseas Bank Ltd. 158.00 188.00 205.00 233.00 274.03 211.612 City Union Bank Ltd. 116.31 138.89 155.94 167.35 219.31 159.563 Development Credit Bank Ltd. 173.00 227.82 344.00 429.39 443.44 323.534 Lord Krishna Bank Ltd. 154.00 149.00 200.00 226.00 246.41 195.085 SBI Commercial & International Bank Ltd. 391.00 575.38 724.99 706.37 762.18 631.986 Tamilnad Mercantile Bank Ltd. 117.97 141.48 180.28 214.94 246.98 180.337 The Bank of Rajasthan Ltd. 93.94 99.00 111.37 123.55 138.06 113.188 The Benares State Bank Ltd. 66.95 71.79 86.03 100.13 - 81.239 The Catholic Syrian Bank Ltd. 84.00 94.00 107.00 125.42 146.06 111.30
10 The Dhanalakshmi Bank Ltd. 120.57 131.17 153.66 184.28 202.91 158.5211 The Federal Bank Ltd. 142.00 153.00 161.00 190.00 225.23 174.2512 The Ganesh Bank of Kurundwad Ltd. 70.98 81.76 94.77 105.40 113.68 93.3213 The Jammu & Kashmir Bank Ltd. 116.00 137.00 175.00 212.00 297.69 187.5414 The Karnataka Bank Ltd. 127.46 156.29 177.68 210.28 251.42 184.63
The Karur Vysya Bank Ltd. 126.00 137.00 169.00 192.00 231.77 171.1516 The Lakshmi Vilas Bank Ltd. 100.23 124.58 158.00 192.00 209.11 156.7817 The Nainital Bank Ltd. 59.76 70.13 79.05 93.07 114.72 83.3518 The Nedungadi Bank Ltd. 87.39 107.92 133.34 145.80 125.38 119.9719 The Ratnakar Bank Ltd. 82.29 90.47 114.75 145.87 162.54 119.1820 The Sangli Bank Ltd. 54.93 59.38 66.82 74.58 105.32 72.2121 The South Indian Bank Ltd. 85.00 109.00 129.00 171.00 247.52 148.3022 The United Western Bank Ltd. 113.00 139.00 179.00 212.00 213.59 171.3223 The Vysya Bank Ltd. 111.76 123.89 186.14 199.59 231.88 170.65
Average of 23 Private Sector Banks [I] 119.68 143.74 177.91 202.35 236.78 176.09
15
[Source : IBA bulletin March 2002, 2003]
Table 6B.1.3 shows the BPE Ratio in old 23 private sector
Banks. The notable point is above Rs. 100 lakh in each year (overall)
and in 2001-02 it is Rs. 236.78 lakh per employee. Yet the overall
average would go high, but there is an effect of low productivity of
222

employees in Sangli Bank Ltd., The Ganesh Bank of Kurundwad
Ltd., and The Nainital Bank Ltd. The highest productivity of labour
can be seen in and SBI Commercial and International Bank Ltd.
related to BPE (Rs. in lakh). Many of these Banks have gotten
improvement in productivity till 2001-02. The higher productivity of
this group than SBI group and other nationalized banks group may
be because of motivation provide to employees in old private banks.
Table 6B.1.4 Business per Employee (Rs. in lakh) for New Private Banks
during 1997-98 to 2001-02 Business per Employee (Rs. in lakh)
Banks 1997-1998
1998-1999
1999-2000
2000-2001
2001-2002
AVG
NEW PRIVATE SECTOR BANKS
24 ICICI Bank Ltd. 420.17 513.91 829.52 815.22 519.90 619.7425 HDFC Bank Ltd. 460.00 522.00 922.00 643.00 534.81 616.3626 UTI Bank Ltd. 993.00 1000.00 1101.00 959.00 826.13 975.8327 Global Trust Bank Ltd. 809.00 690.00 855.00 832.00 653.86 767.9728 Indusind Bank Ltd. 1747.51 1506.19 1656.91 1582.36 1024.07 1503.4129 Centurion Bank Ltd. 755.01 553.62 688.73 636.16 689.88 664.6830 IDBI Bank Ltd. 913.06 923.01 923.01 684.67 1893.54 1067.4631 Bank of Punjab Ltd. 290.57 379.57 712.05 545.68 1024.96 590.57
Average of 8 New Private Sec.Banks [I] 798.54 761.04 961.03 837.26 895.89 850.75[Source : IBA bulletin March 2002, 2003]
The new private sector banks have a unique motivation and
incentive programmes. These banks give targets to the employees
223

and after achieving it, they are highly motivated and get many of
incentives. These programmes affect on the BPE. Moreover these
Banks provide a wide service network under one roof, so the overall
average related to BPE in these 8 new private banks is highly
impressive. It starts from Rs. 798.54 lakh per employee in 1997-98
then Rs. 761.04 lakh in 1998-99, then Rs. 961.03 lakh in 1999-2000
and Rs. 837.26 lakh in 2000-01. And the amount of Rs. 895.89 lakh
in 2001-02.
This is a very good sign and shows very high productivity of
employees. The greatest performance can be seen in Indusind Bank
Ltd., and IDBI Bank Ltd. These Banks have gotten more than
Rs.100 lakh in the average of five years.
All these private banks (23+8) are showing brighter
performance related to this ratio compared to SBI group and Other
Nationalized Banks group. The average of BPE in new private
Banks are at least 5 to 6 times more than nationalized Banks. There
may be the reasons of less business and overstaffing in SBI group
and other nationalized banks group as well as less motivation for
employees in this groups.
224

Table 6B.1.5 Business per Employee (Rs. in lakh) for Foreign Banks
during 1997-98 to 2001-02 Business per Employee (Rs. in lakh)
Banks 1997-1998
1998-1999
1999-2000
2000-2001
2001-2002 AVG
FOREIGN BANKS 1 ABN-Amro 649.11 731.53 857.06 868.15 975.18 816.212 Abu Dhabi Commercial 775.16 880.66 1033.87 2454.49 2392.25 1507.293 American Express 342.44 314.40 290.24 252.92 764.25 392.854 Arab Bangladesh 133.26 133.05 151.18 218.13 252.29 177.585 Bank International Indonesia 385.19 195.60 490.33 306.40 86.76 292.866 Bank Muscat International - 75.29 278.57 367.11 863.20 396.047 Bank of America 997.27 997.74 1221.14 1978.32 1640.04 1366.908 Bank of Bahrain and Kuwait - 611.90 736.80 808.00 810.81 741.889 Bank of Ceylon 458.00 460.00 560.00 757.00 735.15 594.03
10 Barclays 319.00 581.32 412.10 366.53 435.31 422.8511 BNP Pariba 394.98 465.66 555.25 553.45 623.66 518.6012 Chinatrust Commercial 127.35 447.63 661.78 689.79 635.34 512.3813 Cho Hung 512.96 728.45 710.00 766.01 1161.94 775.8714 Citibank 803.75 831.89 1160.64 1336.24 1811.40 1188.7815 Commerz 710.18 752.21 464.83 520.63 252.00 539.9716 Credit Agricole Indosuez 784.45 697.02 565.93 835.59 1362.09 849.0217 Credit Lyonnais 1029.35 875.89 1228.12 1581.04 1639.95 1270.8718 Deutsche 674.33 743.77 757.13 835.25 980.79 798.2519 Dresdner 673.32 593.31 593.48 2968.29 - 1207.1020 Ing Bank 294.69 702.66 252.43 409.54 415.47 414.9621 JP Chase Manhattan 14.32 6.29 65.49 93.91 223.86 80.7722 KBC - - 443.56 910.59 496.45 616.8723 Krung Thai 52.35 54.79 119.92 174.86 126.73 105.7324 Mashreq 429.06 558.83 591.24 574.51 1385.73 707.8725 MIZUHO Corporate Bank Ltd. -Fuji 501.88 570.67 693.02 544.30 888.77 639.7326 Morgan Guaranty Trust - - 124.11 217.39 - 170.7527 Oman International a 606.51 741.85 818.23 938.40 741.16 769.2328 Oversea-Chinese 297.29 334.94 307.40 211.05 29.88 236.1129 Sakura 691.28 640.60 615.02 608.14 - 638.7630 Societ Generale 104.46 677.20 669.00 475.50 367.93 458.8231 Sonali N.A. 66.99 120.81 66.83 69.39 81.0132 Standard Chartered 276.63 311.12 570.01 617.78 984.08 551.9233 Standard Chartered Grindlays 333.08 370.60 404.74 442.72 309.73 372.1734 State Bank of Mauritius 754.65 899.80 1304.40 1292.10 985.60 1047.3135 Sumitomo 732.99 1086.94 760.18 1189.13 568.27 867.5036 The Bank of Nova Scotia 843.18 1054.22 833.77 1300.40 2062.10 1218.7337 The Bank of Tokyo - Mitsubishi 584.87 569.74 381.66 354.55 521.98 482.5638 The Development Bank of Singapore 432.23 478.20 753.28 830.89 1237.57 746.43
225
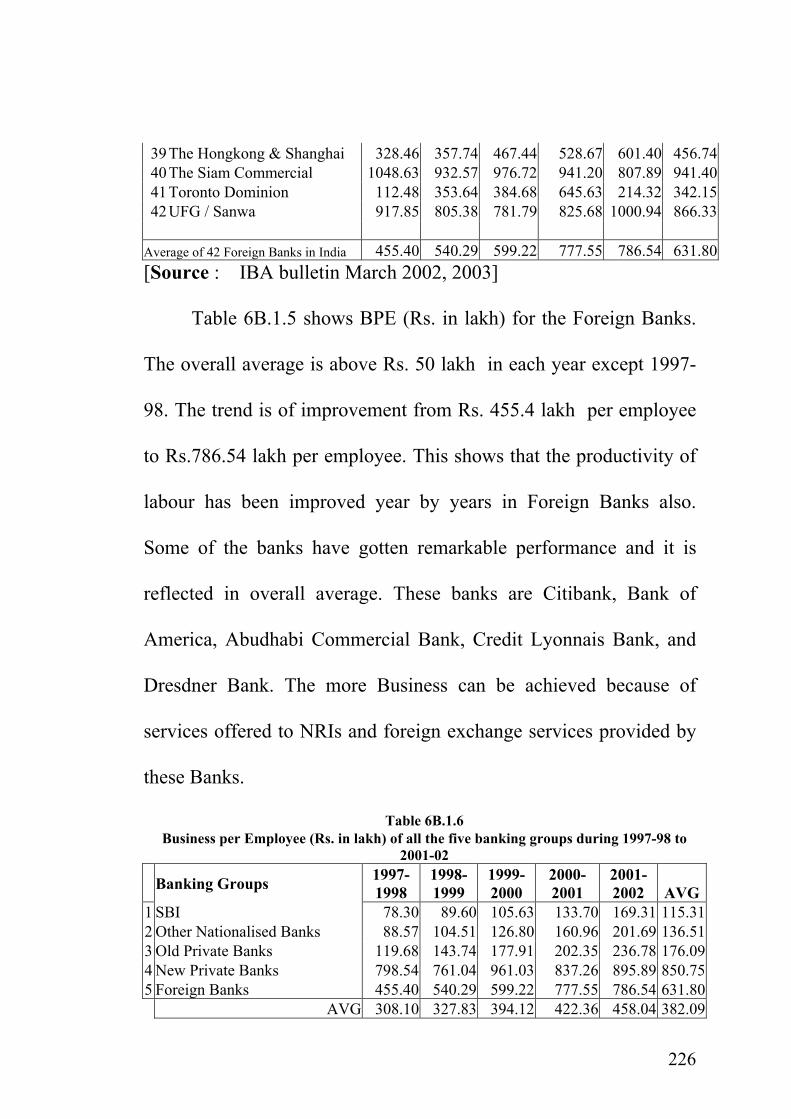
39 The Hongkong & Shanghai 328.46 357.74 467.44 528.67 601.40 456.7440 The Siam Commercial 1048.63 932.57 976.72 941.20 807.89 941.4041 Toronto Dominion 112.48 353.64 384.68 645.63 214.32 342.1542 UFG / Sanwa 917.85 805.38 781.79 825.68 1000.94 866.33
Average of 42 Foreign Banks in India 455.40 540.29 599.22 777.55 786.54 631.80[Source : IBA bulletin March 2002, 2003]
Table 6B.1.5 shows BPE (Rs. in lakh) for the Foreign Banks.
The overall average is above Rs. 50 lakh in each year except 1997-
98. The trend is of improvement from Rs. 455.4 lakh per employee
to Rs.786.54 lakh per employee. This shows that the productivity of
labour has been improved year by years in Foreign Banks also.
Some of the banks have gotten remarkable performance and it is
reflected in overall average. These banks are Citibank, Bank of
America, Abudhabi Commercial Bank, Credit Lyonnais Bank, and
Dresdner Bank. The more Business can be achieved because of
services offered to NRIs and foreign exchange services provided by
these Banks.
Table 6B.1.6 Business per Employee (Rs. in lakh) of all the five banking groups during 1997-98 to
2001-02
Banking Groups 1997-1998
1998-1999
1999-2000
2000-2001
2001-2002 AVG
1 SBI 78.30 89.60 105.63 133.70 169.31 115.312 Other Nationalised Banks 88.57 104.51 126.80 160.96 201.69 136.513 Old Private Banks 119.68 143.74 177.91 202.35 236.78 176.094 New Private Banks 798.54 761.04 961.03 837.26 895.89 850.755 Foreign Banks 455.40 540.29 599.22 777.55 786.54 631.80 AVG 308.10 327.83 394.12 422.36 458.04 382.09
226

0200400600800
1000
1997-1998
1998-1999
1999-2000
2000-2001
2001-2002
SBI Other Nationalized Banks Old Private Banks New Private Banks Foreign Banks
In above Table No. 6B.1.6 and Chart, Business Per employee
(Rs. in lakh) is stated year wise in case of all the five banking groups
during 1997-98 to 2001-02. The acceleration implemented by new
private banks and foreign banks is clearly reflected in above Table
No. 6B.1.6 and in the Chart. New private banks offer Handsome
remuneration and attractive offers package to their staff for
achieving higher business. The staff members of new private banks
almost devote their 3/5 time to their bank to avail financial as well as
non-financial benefits. With this strategy, the new private banks
achieve their business targets upto their expectations. The foreign
banks have limited braches and valuable customers in India, so their
227

Business Per employee (Rs. in lakh) is too seen higher than other
banking groups except new private banks group. As the trade unions
are very strong, number of employees are very high, dedication of
employees is very less and the volume of cut-throat competition
faced by SBI group, other nationalized banks group and old private
banks group is very high, their Business Per employee (Rs. in lakh)
is quite less compared to new private banks groups and foreign
banks group.
Business Per employee (Rs. in lakh)
Hypothesis Testing
The researcher wanted to find out that if there is any
significant difference regarding the performance related to Business
Per Employee (Rs. in lakh) among all the five banking groups during
1997-98 to 2001-02 or not. This was tested as under.
Null hypothesis :
There is no significant difference in Business Per Employee among
all the five banking groups during 1997-98 to 2001-02.
Ho = µ1 = µ2 = µ3 = µ4 = µ5
H1 = µ1 ≠ µ2 ≠ µ3 ≠ µ4 ≠ µ5
228
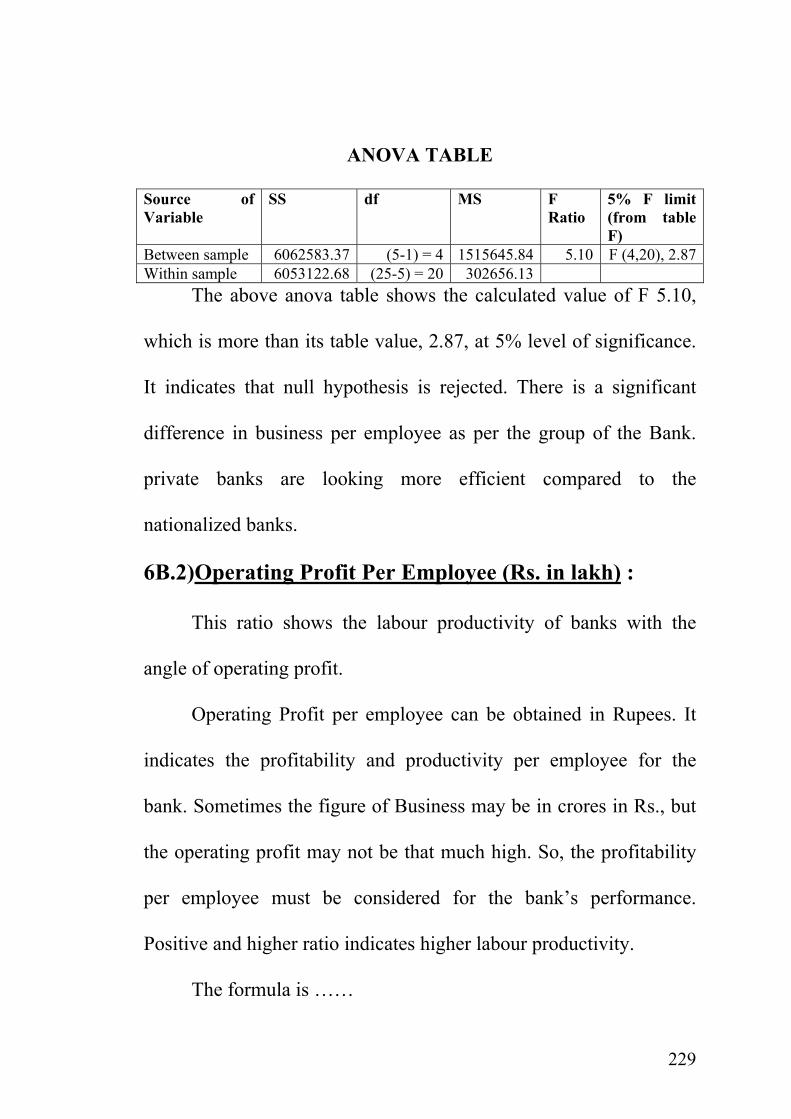
ANOVA TABLE
Source of Variable
SS df F Ratio
F (4,20), 2.87
MS 5% F limit (from table F)
Between sample 6062583.37 (5-1) = 4 1515645.84 5.10 Within sample 6053122.68 (25-5) = 20 302656.13 The above anova table shows the calculated value of F 5.10,
which is more than its table value, 2.87, at 5% level of significance.
It indicates that null hypothesis is rejected. There is a significant
difference in business per employee as per the group of the Bank.
private banks are looking more efficient compared to the
nationalized banks.
6B.2)Operating Profit Per Employee (Rs. in lakh) :
This ratio shows the labour productivity of banks with the
angle of operating profit.
Operating Profit per employee can be obtained in Rupees. It
indicates the profitability and productivity per employee for the
bank. Sometimes the figure of Business may be in crores in Rs., but
the operating profit may not be that much high. So, the profitability
per employee must be considered for the bank’s performance.
Positive and higher ratio indicates higher labour productivity.
The formula is ……
229

Operating Profit Operating Profit Per Employee (In Rs.) =
No. of Employees
The result and the analysis of each bank and bank group of
Indian Banking sector is as under :
Operating Profit
Explained in Chapter-5.
No. Of Employees
As earlier explained in this Chapter
Table 6B.2.1 Operating Profit Per Employee (Rs. in lakh) for SBI Group
during 1997-98 to 2001-02 Operating Profit per Employee
(Rs. in lakh) Banks 1997-1998
1998-1999
1999-2000
2000-2001
2001-2002
AVG
PUBLIC SECTOR BANKS I.1. State Bank of India (SBI) 0.77 0.43 0.87 0.70 1.16 0.79II. ASSOCIATES OF SBI
2 State Bank of Hyderabad 0.68 0.76 0.87 1.13 1.24 0.943 State Bank of Patiala 1.09 0.77 0.99 1.23 1.68 1.154 State Bank of Travancore 0.51 0.35 0.54 0.85 1.91 0.835 State Bank of Bikaner & Jaipur 1.30 1.14 0.86 0.77 0.67 0.956 State Bank of Mysore 1.13 1.05 1.42 0.26 1.97 1.177 State Bank of Indore 1.33 1.67 1.87 2.60 1.10 1.718 State Bank of Saurashtra 1.58 0.31 1.09 0.21 1.00 0.84
Average of State Bank Group [I+II] 1.05 0.81 1.06 0.97 1.34 1.05[Source : IBA bulletin March 2002, 2003]
Table 6B.2.1. shows OPPE (Rs in lakh) for the SBI group.
Naturally, this ratio is related with Operating profit, so that, the
230

profitability trend discussed previously will affect on this ratio. The
OPPE Ratio can be seen around Rs. 1 lakh by observing the average.
SBI, State Bank of Travancore and State Bank of Saurashtra have a
low profitability per employee in average. The performance of the
employees related to profitability is very much impressive in State
Bank of Indore.
If the BPE is high but OPPE is low, there may be the reasons
of more expenses and or Non-Planned expenses.
Table 6B.2.2
Operating Profit per Employee (Rs. in lakh) for other nationalised Banks during 1997-98 to 2001-02
Profit per Employee (Rs. in lakh) Banks 1997-
1998 1998-1999
1999-2000
2000-2001
2001-2002
AVG
III. NATIONALISED BANKS 9 Canara Bank 0.39 0.43 0.45 0.63 0.40 0.46
10 Punjab National Bank 0.72 0.57 0.63 0.80 1.58 0.8611 Bank of Baroda 1.00 0.91 1.07 0.59 1.40 0.9912 Bank of India 0.69 0.38 0.33 0.57 1.16 0.6313 Central Bank of India 0.35 0.30 0.31 0.10 1.03 0.4214 Union Bank of India 0.81 0.52 0.33 0.55 1.55 0.7515 Indian Overseas Bank 0.40 0.20 0.14 0.45 0.41 0.3216 Syndicate Bank 0.39 0.42 0.66 0.81 3.01 1.0617 Oriental Bank of Commerce 1.50 1.60 1.90 1.50 0.11 1.3218 Indian Bank - - - - 0.15 0.1519 Uco Bank -0.30 -0.20 0.12 0.12 0.93 0.1320 Allahabad Bank 0.57 0.60 0.31 0.19 2.36 0.8121 United Bank of India 0.04 0.07 0.15 0.10 0.23 0.1222 Andhra Bank 0.50 0.61 0.82 0.95 0.97 0.7723 Bank of Maharashtra 0.34 0.32 0.56 0.32 0.98 0.5024 Corporation Bank 1.73 1.89 2.20 2.55 0.64 1.8025 Dena Bank 0.71 0.76 0.45 - 1.22 0.7926 Vijaya Bank 0.17 0.22 0.36 0.53 0.66 0.3927 Punjab & Sind Bank 0.53 0.46 0.51 0.13 1.11 0.55
Average of 19 Nationalised Banks [III] 0.55 0.53 0.59 0.57 1.05 0.66[Source : IBA bulletin March 2002, 2003]
231

The OPPE in 19 nationalized Banks can be seen in Table
6B.2.2. By observing the overall average of this group, seems below
0.60 (Rs. in lakh) upto 2000-01 is very frustrating. But the average
of this group improves in 2001-02 and touches Rs. 1.05 lakh.
The Indian Bank has gotten no positive operating profitability
per employee for first four years while UCO Bank has shown
negative operating profitability in first two years. Only two Banks
are impressive in this group related to OPPE and these are oriental
Bank of commerce and Corporation Bank. There is an interesting
point that some of this banks have gotten fine business but not
operating profitability per employee. The Operating expenses in
these banks may be so much high that profitability per employee
goes down. May be the other reason of non-planed expenses. Again
good performance of Corporation Bank can be seen here.
Table 6B.2.3 Operating Profit per Employee (Rs. in lakh) for Old Private Sector Banks during
1997-98 to 2001-02 Operating Profit per Employee
(Rs. in lakh) Banks 1997-1998
1998-1999
1999-2000
2000-2001
2001-2002
AVG
PRIVATE SECTOR BANKS 1 Bharat Overseas Bank Ltd. 1.07 1.08 0.10 1.67 3.13 1.412 City Union Bank Ltd. 0.83 0.90 1.48 1.58 2.09 1.383 Development Credit Bank Ltd. 2.36 1.67 2.26 2.35 2.54 2.244 Lord Krishna Bank Ltd. 0.59 0.18 0.93 0.65 2.09 0.89
232

5 SBI Commercial & International Bank Ltd. 10.01 7.21 9.63 -36.20 3.06 -1.266 Tamilnad Mercantile Bank Ltd. 1.86 1.64 1.89 2.29 2.48 2.037 The Bank of Rajasthan Ltd. -2.00 -1.54 0.28 0.75 0.94 -0.318 The Benares State Bank Ltd. 0.07 -1.43 -0.40 -1.04 - -0.709 The Catholic Syrian Bank Ltd. 0.23 0.01 0.21 0.37 1.23 0.41
10 The Dhanalakshmi Bank Ltd. 0.67 0.28 0.82 0.52 0.79 0.6211 The Federal Bank Ltd. 0.82 0.04 0.72 7.00 1.31 1.9812 The Ganesh Bank of Kurundwad Ltd. 0.04 0.04 0.09 0.16 0.41 0.1513 The Jammu & Kashmir Bank Ltd. 0.88 1.36 1.91 2.58 4.00 2.1514 The Karnataka Bank Ltd. 1.48 1.08 1.00 1.11 2.20 1.3715 The Karur Vysya Bank Ltd. 1.77 1.39 2.60 2.52 3.79 2.4116 The Lakshmi Vilas Bank Ltd. 1.09 0.73 1.37 1.38 1.56 1.2317 The Nainital Bank Ltd. 0.26 0.50 0.69 0.79 0.89 0.6318 The Nedungadi Bank Ltd. 0.48 0.53 0.91 0.00 0.07 0.4019 The Ratnakar Bank Ltd. 0.59 0.55 0.64 0.75 1.27 0.7620 The Sangli Bank Ltd. 0.18 0.20 0.24 0.30 0.49 0.2821 The South Indian Bank Ltd. 0.51 0.15 0.64 1.11 1.69 0.8222 The United Western Bank Ltd. 0.99 1.08 1.64 0.00 0.77 0.9023 The Vysya Bank Ltd. 1.21 0.50 0.76 0.63 1.28 0.88
Average of 23 Private Sector Banks [I] 1.13 0.79 1.32 -0.38 1.73 0.92[Source : IBA bulletin March 2002, 2003]
Table 6B.2.3 shows the OPPE (Rs. in lakh) for old 23 private
banks. The overall average goes down from 1997-98 to 1998-99,
again it improves in 1999-2000 and declines very much in 2000-01
as it goes negative. It is – 0.38 in 2000-01. Once again in 2001-02 it
improves satisfactorily and reaches upto Rs. 1.73 lakh per employee.
There is a point to be noted that BPE ratio is higher in 2000-01, But
OPPE Ratio is negative. A major reason for this result is very much
negative. OPPE in SBI Commercial and International Bank Ltd. This
is – 36.20 and it is reflected in overall average.
233

The other reason of negative or low OPPE in average is
negative or low OPPE in The Bank of Rajasthan Ltd., and The
Benares State Bank Ltd.
The good and consistent performance can be seen in The
Jammu & Kashmir Bank Ltd, which was the first ranked in 2001-02,
Development Credit Bank Ltd., Tamilnad Merchantile Bank Ltd.,
and The Karur Vysya Bank Ltd.
Table 6B.2.4 Operating Profit Employee (Rs. in lakh) for New Private Banks
during 1997-98 to 2001-02 Operating Profit per Employee
(Rs. in lakh) Banks 1997-1998
1998-1999
1999-2000
2000-2001
2001-2002
AVG
NEW PRIVATE SECTOR BANKS 24 ICICI Bank Ltd. 8.33 7.11 10.92 10.45 3.74 8.11
25 HDFC Bank Ltd. 9.57 9.96 9.60 8.61 -
16.77 4.1926 UTI Bank Ltd. 4.00 6.00 6.91 7.27 3.51 5.5427 Global Trust Bank Ltd. 15.00 9.00 12.00 7.00 7.94 10.1928 Indusind Bank Ltd. 25.96 8.46 10.93 6.98 3.34 11.1329 Centurion Bank Ltd. 15.45 4.81 9.14 7.04 4.34 8.1630 IDBI Bank Ltd. 6.06 7.34 11.15 2.50 6.88 6.7931 Bank of Punjab Ltd. 6.43 6.13 6.03 4.94 7.79 6.26
Average of 8 New Private Sec.Banks [I] 11.35 7.35 9.59 6.85 2.60 7.55[Source : IBA bulletin March 2002, 2003]
Table 6B.2.4. shows the operating profitability per employee
(Rs. in lakh). By seeing average, it can be said that it has gone down
in 1998-99 and 2000-01. This is because of lows operating profit in
234

both these years. There are much of ups & downs in the performance
related OPPE of Global Trust Bank Ltd., & Indusind Banks Ltd., the
shocking negative operating profitability is seen of -16.77 (Rs. in
lakh) in HDFC Bank Ltd., in 2001-02, which affects the average of
new private banks group for that year. In 2000-01, ICICI has the
largest OPPE and it is Rs. 10.45 lakh. This may be the result of its
merger, high targets, training & development programmes of
employees and higher operating Profit.
The average OPPE is much more higher in this group than all
the other groups.
Table 6B.2.5 Operating Profit per Employee (Rs. in lakh) for Foreign Banks
during 1997-98 to 2001-02 Operating Profit per Employee
(Rs. in lakh) Banks 1997-1998
1998-1999
1999-2000
2000-2001
2001-2002
AVG
FOREIGN BANKS 1 ABN-Amro 14.11 17.55 13.91 3.80 13.32 12.542 Abu Dhabi Commercial 2.53 2.64 4.39 10.36 10.46 6.083 American Express 7.58 0.86 3.17 -2.11 2.79 2.464 Arab Bangladesh 4.20 9.77 9.42 14.92 10.06 9.675 Bank International Indonesia -22.10 -53.06 -44.00 - 1.24 -29.486 Bank Muscat International - N.A. 3.77 6.63 2.08 4.167 Bank of America 15.43 20.22 30.14 23.42 29.37 23.728 Bank of Bahrain and Kuwait - 4.16 5.60 5.70 9.47 6.239 Bank of Ceylon 14.00 11.00 16.00 6.00 0.14 9.43
10 Barclays 7.81 3.06 -16.27 14.28 35.28 8.8311 BNP Pariba 5.91 6.84 6.25 19.60 -6.90 6.3412 Chinatrust Commercial 0.91 -1.58 1.92 4.87 5.75 2.3713 Cho Hung 27.46 35.18 4.93 27.84 40.77 27.24
235

14 Citibank 7.81 7.64 19.22 19.34 22.14 15.2315 Commerz -1.65 2.42 3.63 1.89 -169.19 -32.5816 Credit Agricole Indosuez -14.04 -5.19 -63.14 -20.05 15.66 -17.3517 Credit Lyonnais -5.15 15.26 15.81 2.36 3.91 6.4418 Deutsche 21.56 9.80 9.86 17.81 27.64 17.3319 Dresdner 9.44 -10.08 -76.36 -413.99 - -122.7520 Ing Bank 2.95 0.32 -19.33 -23.56 -3.32 -8.59
JP Chase Manhattan 10.13 4.26 17.41 30.06 38.61 20.0922 KBC - 2.33 5.61 4.29 -44.53 -8.0823 Krung Thai 20.88 17.66 7.82 9.88 0.12 11.27
Mashreq -10.25 -16.58 -24.73 -38.24 23.36 -13.2925 MIZUHO Corporate Bank Ltd. -Fuji 16.40 1.20 -26.79 -25.01 -11.81 -9.2026 Morgan Guaranty Trust - - 24.09 4.24 - 14.1727 Oman International - - - - -45.39 -45.3928 Oversea-Chinese 3.84 21.43 - 4.44 -16.02 3.4229 Sakura 15.70 -24.90 -4.80 -14.83 - -7.2130 Societ Generale 9.70 21.40 0.10 0.30 -16.56 2.9931 Sonali N.A. 11.30 6.00 5.77 1.32 6.10
Standard Chartered 2.49 0.14 10.27 11.21 9.4733 Standard Chartered Grindlays 6.86 5.33 5.77 2.85 -12.60 1.6434 State Bank of Mauritius 37.86 16.20 20.60 14.10 8.58 19.4735 Sumitomo 1.06 28.89 1.88 -14.65 -21.54 -0.8736 The Bank of Nova Scotia 0.73 17.42 14.35 15.70 16.06 12.85
37 The Bank of Tokyo - Mitsubishi -
104.15 -16.15 13.62 23.51 17.29 -13.1838 The Development Bank of Singapore 4.79 9.28 14.49 22.48 35.98 17.4039 The Hongkong & Shanghai 2.88 2.11 4.36 6.62 4.97 4.1940 The Siam Commercial 38.29 26.47 22.20 -25.89 -345.18 -56.8241 Toronto Dominion 13.77 23.74 31.99 37.57 19.72 25.3642 UFG / Sanwa 8.81 7.23 1.02 2.23 0.46 3.95
Average of 42 Foreign Banks in India 4.25 5.61 1.77 -4.86 -6.83 -0.01
21
24
32 23.25
[Source : IBA bulletin March 2002, 2003]
Table 6B.2.5 shows OPPE (Rs. in lakh) for the foreign banks.
There are much more fluctuations in almost all the banks. Some
times the PPE is too high, some time it is too low and sometimes
highly negative. In the year 2000-01 & 2001-02 the average is
236

negative and that is respectively -4.86 (Rs. in lakh) & -6.83 (Rs. in
lakh). It is highly negative. Again the single branch bank's result is
reflected on this average Dresdner Bank's business is very much
impressive, but operating profitability per employee is highly
negative in 2000-01 which is –413.99 (Rs. in lakh). This shows very
high operating expenses or non-planned expenses or losses written-
off.
Bank of America, Cho Hung Bank, CitiBank, State Bank of
Mauritius and Toronto Dominion Bank, are very consistent and
impressive in OPPE. They have gotten good business as well as
operating profitability per employee.
Table 6B.2.6 Operating Profit per Employee (Rs. in lakh) in all the five banking groups during
1997-98 to 2001-02
Banking Groups 1997-1998
1998-1999
1999-2000
2000-2001
2001-2002 AVG
1 SBI 1.05 0.81 1.06 0.97 1.34 1.052 Other Nationalised Banks 0.55 0.53 0.59 0.57 1.05 0.663 Old Private Banks 1.13 0.79 1.32 -0.38 1.73 0.924 New Private Banks 11.35 7.35 9.59 6.85 2.60 7.555 Foreign Banks 4.25 5.61 1.77 -4.86 -6.83 -0.01 AVG 3.67 3.02 2.87 0.63 -0.02 2.03
237

-10-505
1015
1997-1998
1998-1999
1999-2000
2000-2001
2001-2002
SBI Other Nationalized Banks Old Private Banks New Private Banks Foreign Banks
Above Table No. 6B.2.6 and Chart exhibit operating profit per
employee (Rs. in lakh) for all the five banking groups during 1997-
98 to 2001-02. Operating Profit Per Employee (Rs. in lakh) is a
better parameter than Business Per Employee (Rs. in lakh) as far as
labour productivity is concerned. We can not Judge the labour
productivity only by business but by operating profit in better way.
Sometimes it happens that the business may be more while operating
profit may be less. Here in case of foreign banks it happens so. New
Private Banks group is able to maintain the highest Operating Profit
Per Employee (Rs. in lakh). Simultaneously with the highest
238

Business Per Employee (Rs. in lakh). While in case of foreign banks
group, shocking scenario is seen. It's Business Per Employee (Rs. in
lakh) is better than other banking groups except new private banks
group, though it's Operating Profit Per Employee (Rs. in lakh) is
worse than all other banking groups in 2000-01 & 2001-02.
Operating Profit Per Employee (Rs. in lakh)
Hypothesis Testing
The researcher wanted to find out that if there is any
significant difference regarding the performance related to Operating
Profit Per Employee (Rs. in lakh) among all the five banking groups
during 1997-98 to 2001-02 or not. This was tested as under.
Null hypothesis :
There is no significant difference in Operating Profit Per Employee
(Rs. in lakh) among all the five banking groups during 1997-98 to
2001-02.
Ho = µ1 = µ2 = µ3 = µ4 = µ5
H1 = µ1 ≠ µ2 ≠ µ3 ≠ µ4 ≠ µ5
239

ANOVA TABLE
Source of Variable
SS df MS F Ratio 5% F limit (from table F)
Between sample 466.19 (5-1) = 4 116.55 5.61 F (4,20) 2.87Within sample 415.40 (25-5) = 20 20.77
The above anova table indicates that the table value of F is
2.87 at 5% level of significance and the calculated value of F is 5.61.
As the calculated value of F is more than its table value null
hypothesis is rejected. It means that the performance regarding
operating profit is different in all the five banking groups. Private
banks are ahead than SBI group and other nationalized banks group
regarding operating profit per employee because of better labour
productivity.
240

Reference
1. Financial Management - Principles & Practice S.N. Maheshwari Sultan Chand & Sons New Delhi. 2. Principles of Management for Bankers C.B. Gupta Sultan Chand & Sons New Delhi 3. IBA Bulletin - March 2002, 2003 4. www.rbi.org.in 5. Banking International Trade & Public Finance D.M. Mithani Himalaya Publishing House 6. Banking Theory and Practice (Law & Foreign Exchange) 6th edition K.C. Shekhar
Vikas Publishing House Pvt. Ltd.,
241

CHAPTER – 7
SUMMARY, FINDINGS AND SUGGESTIONS
I) FINDINGS :
THE COMPARISON OF PERFORMANCE OF ALL
THE FIVE BANKING GROUPS :
II)
Table No. 7.1 Distribution of No. of Banks in terms of
their operational efficiency
Table No. 7.2 Distribution of No. of Banks in terms of
their profitability.
Table No. 7.3 Distribution of No. of Banks in terms of
their credit efficiency
Table No. 7.4 Distribution of No. of Banks in terms of
their productivity
242

III) SUGGESTIONS :
Indian banking sector has a long journey of growth since 1955,
started with the nationalization of the State Bank of India. The first
nationalization phase was in 1969, and the second phase in 1980, it
lead to rapid expansion of Banks branches all over India. Deposit
mobilization and priority sector lending in highly protected
environment with extremely regulated framework adversely affected
the financial resource mobilization and allocation by the commercial
banks. The reforms again needed in this industry. In 1991, The
Narsimham Committee report gave a new dimension to Indian
Banking sector. The private Banks and foreign banks have entered in
the market. So, now, there is a global competition in the banking
industry in India.
As an effect of liberalization, privatization and globalaisation
policy, there have not only been rapid expansion in the number of
banking institutions in the country, but the banking horizon of the
country has also changed significantly. The foreign banks, which
accounted for only 32% of the total number of banks in the country
in 1991, grew up to 42% by 2001. In view of the fact that the public
243

sector banks that have been operating in an extremely protected
economic environment and may lost out in the wave of competition
from the private and foreign banks, the schemes of financial
assistance for capital restructuring for the economically weak public
sector banks were also introduced during last decade. Besides to
that, the public sector banks were also given time to meet the
prudential and capital adequacy norms as well as norms to manage
Non-Performing Assets. So, most of the public sector banks are now
working on the concept of universal banking and service oriented
banking. The whole process of reforms has intensified competition
leading to overall improvement in financial performance.
In this study, the financial performance of all the commercial
banks has been evaluated. All the banks have been divided into five
groups and for each bank and each group, different types of
parameters have been used with the help of ratios to evaluate the
financial performance for the period of five years from the year
1997-98 to 2001-02. The four parameters are operational efficiency,
profitability, credit efficiency and productivity.
244

After evaluating the individual performance, group wise
evaluation was made in previous chapters. In this chapter, the
researcher has made an attempt to review the overall efficiency
related to each ratio in each parameter. The average of five years has
been taken into the consideration for the comparison of each group.
The major findings are as under.
I) FINDINGS
1. The operational efficiency in all the banking groups was
significantly differing in this analysis; basic three ratios have
been calculated. Interest Income as % to Average Working
Funds in SBI group is fluctuating. In 1998-99, the ratio
indicates the weak performance of State Bank of Patiala, SBI
main and State Bank of Travancore. It indicated that the ability
of leverage on its average total resources against operational
income was low.
On this aspect, the other nationalized banks were
consistent in performance. Andhra Bank, Corporation Bank,
245

Dena Bank, CBI, and Oriental Bank of Commerce are
performing effectively in banking business where as UCO
Bank and IOB, were weak. The old private banks performance
was excellent. Same trend can be observed in new private
sector banks also. Foreign Banks shows a very little ability.
Thus, the efficiency related to leverage aspects was not
remarkable in foreign banks group.
2. Non-Interest Income to Average Working Funds Ratio of SBI
group showed consistent average among all associate banks.
But, State Bank of Patiala showed lower ratio relating to
NII/AWF. On other side, other nationalized banks, have weak
performance in this efficiency ratio on an average, it reflected
lower ratio than SBI group. The old private sector banks
indicated effective performance for this ratio. But The Nainital
Bank Ltd., had performed very weak efficiency. In case of new
private sector banks, they were very good to this ratio. It
showed that through the operational efficiency, this group has
earned more income from non-conventional resources; where
as nationalized banks were slightly weak. The foreign banks
246

performance was remarkable. But few foreign banks indicated
fluctuating trends.
3. Capital Adequacy Ratio was comparatively high than RBI
guideline in all the associate banks of SBI group. e.g. SBI
main Bank of Patiala and State Bank of Saurashtra. Which
indicated effective operational efficiency. But some other
nationalized banks were little bit behind to the minimum
standard fixed by RBI. Other nationalized banks growth shows
high fluctuations during the period of study. Old private sector
banks showed mixed ratio. The Jammu & Kashmir Bank Ltd.,
The Tamilnad Mercantile Bank Ltd., The SBI Commercial &
International Bank Ltd., were outstanding where as The Bank
of Rajasthan Ltd., The Benareas State Bank Ltd., showed poor
performance in long term solvency. But New Private Sector
Banks showed outstanding performance. Foreign Banks also
indicated good performance on this aspect.
4. The profitability is an important aspect of performance
appraisal, which indicated the ability to perform various tasks
in the most effective way. The overall profitability of Indian
247

Banking Sector had been significantly differed in all the five
groups during the period of study. Operating Profit to Average
Working Funds Ratio in SBI group was constant. But there
was some drastic change in State Bank of Patiala during the
year 1999-2000. In other nationalized banks, the overall
average was very low as compared to SBI group. The
profitability trend had gone down in this group. For old private
sector banks, this Operating Profit to Average Working Funds
Ratio was moderate and some fluctuations were seen during
the period of study. Against this, new private sector bank
indicated the excellent profitability in each bank as well as in
each year. Foreign Banks recorded negative and positive
trends of profitability. Few banks had performed excellent, but
some of the foreign banks reflected slightly negative picture in
terms of profitability.
5. The Return On Assets in SBI group indicated fluctuating trend
in average of all banks. Where as for other nationalized banks
overall average of each year was below 1% and average during
the period of study of all the units is 0.55%, which indicated
248

sad picture of the profitability. The performance of operating
profit was not proper. In case of old private sector banks, the
picture was not much more different from other nationalized
banks. But, for new private sector banks, the performance was
consistant in all the banks during the period of study. while in
case of foreign banks, the ROA is highly fluctuating and some
time sad too.
6. In this study, the significant difference was found among all
the five banking group regarding all the ratios relating to credit
efficiency. Tier-I capital, which is a core capital of a bank and
shows the soundness of a bank was tested. In SBI group, Tier I
capital ratio had shown increasing trend in 1999-2000 and
2000-01. But after that the trend had gone down because of
weak performance of State Bank of Bikaner & Jaipur. Tier I
capital of State Bank of Saurashtra and State Bank of Patiala
was found tremendous. In other nationalized banks,
performance regarding to this ratio was weaker compared to
SBI group. Corporation Bank and Oriental Bank of commerce
had very sound position during the period of study except the
249
year 2001-02. In case of old private sector banks, good capital
strength could be seen and it was higher compared to SBI
group Capital soundness of new private sector banks was very
good during the initial 3 years of study. But after that, the ratio
had shown decreasing trend during the year 2000-01 and
2001-02. Whereas, foreign banks are looking highly sound
regarding this ratio. The average is at least 4 to 5 times more
than other banking groups.
7. The another aspect of credit efficiency is Tier II capital, the
subordinate capital of a bank. In SBI group, the position was
consistently improved during the period of study. State Bank
of Saurashtra had a very poor performance till 2000-01. But
after that, the position of Tier-II capital was improved. In case
of other nationalized banks, the average had shown
improvement year by year. The major attraction in this group
is Corporation Bank, which had improved magically. The
average of Tier II capital in Old Private Sector Banks is
slightly less than the other nationalized banks group. New
private sector banks had consistently improved the trend in
250

Tier II capital and a very good contribution was from Global
Trust Bank Ltd., and Bank of Punjab Ltd. Foreign Bank group
had also less Tier II capital because of its initial stage in
Banking Sector. However, the notable performance was of
Standard Chartered Bank Standard Chartered Grindlays Bank,
Chinatrust Commercial Bank, BNP Pariba Bank and Hong
Kong & Shanghai Bank.
8. The third aspect of credit efficiency was taken by the
researcher was net NPA to Net advances, which was a solid
problem for the banks. NPA of SBI group is quite high,
however, showed decreasing trend during the period of study.
State Banks of Bikaner & Jaipur had a very high NPA
compared to others. Other nationalized banks had shown
higher NPA compared to SBI group. Even though, the trend
was decreasing was a very good sign. Indian Bank, Allahabad
Bank, and United Bank of India were trying to control on
NPA, but the ratio was very high Allahabad Bank had reduced
the ratio in 2001-02 which was only 3.20%. Old private sector
banks had also the higher ratio of NPA and it was 10.03% in
251

the year of 1998-99, which showed poor credit efficiency. The
Nedungadi Bank Ltd., The Dhanalakshmi Bank Ltd., The
Benares State Bank Ltd. and SBI Commercial and
International Bank Ltd., were very poor in recovery. The
performance regarding NPA to Net Advance in % was found
excellent in case of new private sector banks which was below
4.5% during the period of study. Surprisingly increasing NPA
trend was found in case of foreign banks.
9. Productivity was also another parameter in this study. The
researcher has found a significant difference in labour
productivity among all the five banking groups. Two ratios
had been calculated to evaluate labour productivity. First was
Business per employee which was found in (Rs. in lakh). In
case of SBI group BPE was showing improvement during the
period of study which reached from Rs. 78.30 lakh to Rs.
169.31 lakh in 2001-02. All the banks had made good
business. More business was found in other nationalized banks
compared to SBI group. Oriental Bank of commerce, Bank of
Baroda, Dena Bank and Corporation Bank were found
252

outstanding regarding BPE. Old private sector Banks had
performed somehow better than other nationalized banks with
slight increase. But the performance of new private sector
banks and foreign banks was excellent regarding BPE. It
showed that they had earned maximum business by using
minimum human resources.
10. The second ratio regarding productivity was found as
Operating Profit Per Employee (Rs. in lakh). Bank can make
more business, but it is also important to earn more profit per
employee. In SBI group OPPE was found around Rs. 1 lakh
only. State Bank of Indore had shown extra-ordinary
performance. Very poor picture was found in case of other
nationalized banks, regarding OPPE, which was below Rs. 1
lakh till the year 2000-01. Some banks in this group were very
frustrating, like Indian Bank Uco Bank, Indian Overases Bank,
etc. Compared to this group, old private sector banks have a
mixed and fluctuating performance. In the year 2000-01, the
average goes negative because of highly negative ratio of SBI
Commercial and International Bank because of a big loss of
253

the bank. The Bank of Rajasthan Ltd., and The Benares State
Bank Ltd., were also very frustrating regarding operating
profit. Again, in case of new private sector banks, OPPE was
found very high in each year and in each bank except HDFC
Bank in 2001-02. The ratio is very much high compared to
other groups, but however, it shows decreasing trend excellent
1999-2000. Operating Profit condition in foreign banks was
highly fluctuated which had shown fluctuations with too many
positive and negative trends. It may be the effect of a single
branch business and more revenue expenses of foreign banks.
During last two years of this study, foreign banks have the
negative result in average regarding operating profit per
employee.
II) THE COMPARISON OF PERFORMANCE OF
ALL THE FIVE BANKING GROUPS.
The researcher has compared all the five banking groups
regarding each parameter of performance as under.
254

TABLE NO 7.1
Distribution of No. of Banks in terms of their operational
efficiency
Number & type of Bank Parameters SBI Other
Nationalized Banks
OPSB NPSB FB ALL SCBS
1 Interest Income To Average Working Funds Ratio (in percent) 3 to 6.99 7 to 9.99 10 to 12.99 13 & above
0440
03
6 1
1180
0
200
1 1
0
3 20 18
439561
2 Non Interest Income To Average Working Funds Ratio (in percent) Negative 0 to 0.99 1 to 2.99 8 19 21 8 26 823 & 4.99 5 & above
00
00
00
00
02
00
0 0
0 0
1 3
9 3
15
93
3 Capital Adequacy Ratio (in percent) Negative 0 to 8.99 5
5
9 to 14.99 15 & above
0080
10
180
0
144
0 0 8 0
0 0
19 23
1
6727
100 100
100
[Source : Computed from IBA bulletin March 2002, 2003]
255

Above table No. 7.1 shows that operational efficiency was
measured by studying three ratios. Each ratio was divided into
various groups and then the study was made whether the particular
bank comes in which group.
The first ratio is Interest Income to Average Working Funds
Ratio. It was divided into four groups 3 to 6.99 %, 7 to 9.99%, 10 to
12.99% and above 13%. This part shows that in SBI group, 4 Banks
have achieved a periodical average of 7% to 10% and other 4 Banks
have achieved average in 10% to 12% group. Very lower ratio has
been found in one new private sector bank and 3 foreign banks that
is below 7%. 8 nationalized, 20 old private Sector Banks, 6 new
private sector Banks and 18 foreign banks have a very good average
in Interest Income to Average Working Funds and the average is in
the group of 10% to13%.Only one foreign Bank has the excellent
performance which is more then 13% regarding Interest Income. It
can be said that old private Sector Banks have better performance
regarding this ratio than others.
256

The second ratio in operation efficiency is Non-Interest
Income to Average Working Funds ratio which was divided into 5
groups - Negative, 0 to 0.99%, 1 to 2.99 %,. 3 to 4.99 %, and 5 or
above 5%. This ratio comparison indicates that only one foreign
bank has gotten the negative result. All the banks from SBI group,
other nationalized and new private Sector Banks have the periodical
average regarding this ratio in the group of 1% to 3%. Nine foreign
Banks have the ratio between 3% to 5% and other 3 foreign Banks
have the ratio more then 5%. It shows that foreign banks are leading
in the race of Non-Interest Income. Other four groups have almost
nearer performance regarding this ratio.
The third ratio in this category is Capital Adequacy Ratio. This
ratio is also an indicator of bank’s long term solvency. According to
the RBI’s norms, minimum capital adequacy ratio should be 9% at
this time (2001-02). As this is only an average of five years period, it
shows the general trend. All the banks of SBI group, 18 other
nationalized banks, 14 old private banks, all the new private banks
257

and 19 foreign banks have fulfilled the norms because they have
Capital Adequacy Ratio more than 9% and below 15%.
258

Table 7.2
Distribution of No. of Banks in terms of their Profitability
Number & type of Bank Parameters SBI Other
Nationalized banks .
OPSB NPSB FB ALL SCBS
1 Operating Profit to Average Working Funds Ratio (in percent) Negative 0 to 2.99 3 to 5.99
0
6 & above
080
01900
12020
0 6 2 0
6 17 14 5
770185
2 Return On Assets (in percent) Negative 0 to 0.99 1 to 2.99 3 & 4.99 5 & above
06200
116200
213701
0 5 3 0 0
13 11 15 2 1
16512922
100
100
[Source : Computed from IBA bulletin March 2002, 2003]
Table 7.2 reveals the average profitability for the period of five
years of all the five banking groups. Profitability parameter includes
two ratios – Operating profit to average working funds and Return
on Assets.
The first ratio is Operating Profit to Average Working Funds
Ratio. It can be seen from the above table that all the banks of SBI
group and other nationalized bank have the periodical average of
Operating Profit to Average Working Funds Ratio more than 0 but
259

below 3%. This is the average performance. Very weak performance
can be seen in 1 old private bank and 6 foreign banks. 2 new private
and 2 old private banks as well as 14 foreign Banks have a good
average of Operating Profit to Average Working Funds Ratio. It
shows a very good profitability in banking operations. 5 foreign
banks have an extraordinary performance regarding profitability as it
goes up to 6% or above to it. It is clear that the private banks are
achieving higher profitability than nationalized banks.
The second ratio is Return On Assets. If the average is higher,
it is a good sign for profitability and credibility of a Bank. By
observing the above table, 16 banks from all the groups have the
negative average which is a sign of inefficiency. Most of the banks
in all the five groups have the periodical average more than 0 but
less than 1%. The interesting thing is that, 2 banks of SBI group, 2
other nationalized banks, 7 old private banks, 3 new private banks
and 15 foreign banks remain with average between 1 to 3%
regarding Return On Assets. Again 3 foreign banks have a very good
average regarding this ratio.
260

Table 7.3
Distribution of No. of Banks in terms of their credit efficiency
Number & type of Bank Parameters SBI Other
Nationalized Banks
OPSB NPSB FB ALL SCBS
1 Tier I Capital to Risk-Weighted Assets Ratio (in percent) Negative 0 to 4.99 5 to 9.99 10 to 14.99 15 & above
00530
019000
04
1063
0 0 5 3 0
0 0
11 8
23
023312026
2 Tire II Capital to Risk-Weighted Assets Ratio (in percent) Negative 0 to 0.99 1 to 1.99 2 & 2.99 3 & above
00233
0213
13
05765
0 0 1 5 2
0 30 6 2 4
037171927
3 Net NPA to Net Advances Ratio (in percent) 0 to 1.99 2 to 4.99 5 & 9.99 10 & above
0080
03
124
04
136
1 5 2 0
15 6 6
15
16184125
100 100 100
[Source : Computed from IBA bulletin March 2002, 2003]
Table 7.3 shows the distribution of banks in terms of their
credit efficiency. This parameter includes three ratios – Tier I capital
to Risk-Weighted Assets Ratio, Tier II capital to Risk-Weighted
Assets Ratio and Net Non-Performing Assets to Net Advances Ratio
in %.
261

In reference to Tier-I Capital, higher ratio leads to good
performance. All the other nationalized banks and four old private
banks have less than 5% average of Tier-I capital. The extraordinary
capital strength can be seen which falls in 10 to 15%, in 3 banks of
SBI group, 6 old private banks, 3 new private banks and 8 foreign
banks. Besides 23 foreign banks among 42 banks, have the excellent
capital strength more than 15% average of Tier I capital.
The Tier II capital is also an indicator of good capital structure
as well as credit efficiency. Higher ratio is a good sign of bank’s
performance. Most interesting part in this table can be observed in
Tier-II capital because the nationalized banks are performing very
well compared to private banks including foreign banks. Most of the
nationalized banks have the average more than 3% regarding Tier-II
capital.
Regarding the Net Non-Performing Assets, which is the latest
challenge for all the banks, the performance of new private sector
banks seems very good because no bank has the ratio more than
10%. The lower ratio indicates a good credit efficiency. All the
nationalized banks have not a very good credit efficiency because
262

they fall in the category of 5 to 10%. 3 other nationalized banks have
tried to reduce the NPA by maintaining the ratio in 2% to 4.99%.
Foreign banks group has two equal no. of banks, below 5% and
more than 5% but upto 9.99%, which is also notable.
Table 7.4
Distribution of No. of Banks in terms of their Productivity
Number & type of Bank Parameters SBI Other
Nationalized Banks
OPSB NPSB FB ALL SCBS
1 Business Per Employee (Rs. In lakh) 50 to 99.99 100 to 249.99 250 to 449.99 500 to 749.99 750 & above
17000
118000
417110
0 0 0 4 4
2 4
10 11 15
846111619
2 Profit Per Employee (Rs. In lakh) Negative 0 to0.99 1 to 1.99 2 to 4.99 5 to 9.99 10 & above
053000
0163000
3115400
0 0 0 1 5 2
13 0 1 7 9
12
163212121414
100 100
[Source : Computed from IBA bulletin March 2002, 2003]
The Fourth parameter of financial performance is productivity
with reference to employees. Table No. 7.4 shows the distribution of
banks in terms of their productivity. The productivity parameter
includes two ratios – Business Per Employee (Rs. in lakh) and Profit
Per Employee, (Rs. in lakh). The banks having good amount of
263
profit may not be efficient because of the large number of
employees.
Again new private sector banks and foreign banks have not
only good business, but the good periodical average of business per
employee. No nationalized bank has the business above Rs. 250 lakh
per employee. The situation is almost same for old private banks.
There are 4 new private banks and 15 foreign banks who have
achieved more than Rs. 750 lakh Business per employee. This is an
excellent performance because of higher incentives and high targets
in private sector.
The another ratio is relating profit per employee. It may be
possible that profit per employee is lower although a very good
business per employee. So, the higher profit per employee is also
needed for availing good productivity. By observing the table, all the
nationalized banks including SBI group have the Profit Per
Employee less than Rs. 2 lakh. In old private sector banks, different
types of results from negative to Rs. 5 lakh. But all the new private
banks have a very good average regarding this ratio and it is Rs. 5
lakh or more than Rs, 5 lakh. From 42 foreign banks, 13 have
264

negative results and 12 have the result of Rs. 10 lakh or more than
that. In case of Profit Per Employee among all the five banking
groups, new private banks are leading in the race.
III) SUGGESTIONS FOR THE STUDY
By referring all these findings, there are some suggestions by
the researcher for better performance of the banks. These
suggestions are as under :
IMPLEMENTATION OF THE RESTRUCTURING PLAN
Successful implementation of any Restructuring Plan requires
the wholehearted involvement and sustained efforts of staff at all
levels. Accordingly, the Plan should be prepared, discussed and
vetted at various levels - with further discussions with Unions and
Association for carrying the entire team along and getting a
commitment for whole-hearted support from them. Vertical
Integration Programmes involving various cadres in the Bank should
be organized to create necessary congenial and conducive climate
for forging ahead as a team in the implementation of the Plan.
There should be greater transparency and involvement of the
tiers in the Bank, which are fundamental to the successful
265

implementation the Plan. The most important part of the
restructuring exercise is that there is an effective and continuous
communication channel so that message of growth and performance,
even if it be a small achievement, reaches all staff quickly thus
enthusing them to perform better.
MONITORING THE PLAN
The Plan drawn up should be followed up effectively to
achieve the desired results. The field level functionaries at the
Circle/Regional level should be called for periodical Review
Meetings, say every Quarter, to discuss the results as also the
strategies proposed by them to achieve the accepted goals. The
Heads of the Circle/Region should be asked to visit/conduct
meetings at the branch level to review the progress made by them
vis-à-vis Plan targets and also provide solutions to problems faced
by them to achieve the results.
STRATEGIES FOR RESTRUCTURING
1. Improving The Spread
It is necessary to reduce cost to the maximum extent possible
to ensure that the bank is able to maintain a decent spread.
266

Improving the deposit mix with higher proportion of low cost
deposits is the best way to contain the interest cost. Further, non-
salary non-interest expenditure should be contained to the barest
minimum. Wherever possible, branches may be considered for
rationalization, as a means to cut costs. The number of tiers in the
organization could be curtailed not only to reduce expenditure but
also to make the organization compact and dynamic. Capital
Expenditure other than those for Technological Upgradation should
be subject to a stringent scrutiny and allowed only if absolutely
essential. Even in respect of capital expenditure for Technology
Upgradation, the cost vis-à-vis the benefit thereof, the sustenance of
the technology for a reasonably long period and the provisions
available for further upgradation should be thoroughly analyzed.
Unutilized/under-untilized premises and other assets should be sold
or rented out to augment income. Loss making Subsidiaries/branches
should be considered for hiving off.
In an environment of intense competition on interest rates,
with bankers vying with each other to lure borrowers by offering
finer rates and terms, it may not be possible to augment interest
267

income in a big way. At best, they may look for non-interest or fee
based income to compensate for the loss of interest income. The
surest way to achieve better spreads, therefore, is by containing cost.
2. TACKLING NON PERFORMING ASSETS (NPAs)
NPAs are a severe drain on the profitability of the banks. On
the one hand, no income on such accounts can be recognized and on
the other hand, certain amount of provision has to be made from the
profits, depending on the asset classification and availability of
security.
This has a double-impact on profitability - No interest on such
dead asset and Need to maintain capital on the Risk Weighted Asset.
Profits of majority of Public Sector Banks were affected by the
sudden introduction of the concept of NPAs and Income
Recognition. Some banks landed up in losses and some of them
continued to incur losses for quite some time, due to their historical
legacy of such NPA accounts, and they were categorized as 'Weak
Banks'.
In the circumstances, the recovery of NPAs is vital. In fact, it
tantamounts to booking of new business, as capital is freed and can
268

be deployed profitably in the creation of new assets. The problem of
tackling NPAs has two aspects - one of recovery of NPAs and the
other of avoidance of slippage. The latter is more important and it
calls for improved credit assessment and credit processes. Though
several measures are initiated with regard to recovery of NPAs, the
generation of fresh NPAs, every year is a matter of grave concern.
While recovery of NPAs can be tackled to some extent through
compromise settlements, filing of cases in DRTs, conduct of
Recovery Camps etc., slippage can be avoided through proper
training to staff members in credit skills and through proper
monitoring and collection processes. Once this improved level of
knowledge is achieved, credit as a product can be more proactively
sold, rather than reactively granted as in the past.
Some of the steps to tackle the problem of NPAs are:
• Building an effective credit appraisal system within the Bank
and bringing professionalism in appraisal.
• Monitoring of assets on an ongoing basis with intelligence on
the industry to which the borrower belongs and initiating the
trouble shooting exercise at the beginning itself.
269

• Building a sound and reliable information base through
networking.
• Establishing a tested credit-risk evaluation model with features
for risk management in dynamic market conditions.
• Evolving policies with focus and thrust on sound risk
management systems.
• Putting in place proper control mechanism for feedback and
analysis for corrective action.
• Eliminating the fear psychosis and creating a climate of
confidence among the Bank personnel through proper
motivation and creating a healthy environment based on trust
and confidence.
• Setting NPA management as the organizational goal and
ensuring that the spirit pervades all through the organization.
• Motivating employees and giving adequate training in te
nuances of recovery mechanism.
• Ensuring changes in the mindset to cope with the market
realities in Credit Risk and NPA management.
270

Banks should develop proper risk forecasting techniques, which
should enable them to check generation of fresh NPAs.
More than recovery of NPAs, the checking of further slippage
of standard assets into NPAs is very vital in the restructuring
process. An effective monitoring mechanism is called for to oversee
the standard assets. In this direction, the system of Special Mention
Accounts is a welcome introduction to put the banks on notice about
the impending dangers.
3. LEADERSHIP AND MANAGING CHANGE
Change in the leadership style is one of the main contributory
factors for a successful restructuring of an organization. There is a
need for a dynamic and visionary leadership at the top level to
provide the broad framework of strategy and values within which the
organization can move forward and satisfy the various stakeholders.
The person should have a shared vision and should possess the
qualities required of an effective leader. This will lead to a total
transformation in the mindset of the staff down the line and will
improve the initiative and decision making skills, courage, will-
power to stand by the decisions, etc at all levels. One core quality of
271

all successful leaders is their total commitment to the highest values
of integrity.
It requires such a leader to restructure of turnaround a 'weak'
organization which has several odds stacked against it. He or She
should not only be a Leader by Example, but also a Leader by
staring. As our President, Bharat Ratna A.P.J. Abdul Kalam, has put
it "A quality leader should be a person with a vision and should be
brave enough to support change. The traditional role of leader as a
Commander has to change to that to a Coach. Instead of being a
Manager, he should be a mentor. A leader instead of demanding
Respect, should facilitate Self-Respect". A Bank on the path of
restructuring should have such leaders to pull it out of its deep-
rooted problems.
At the Circle / Regional level, there is a need for integrative
leadership, taking the Corporate Vision, Values and Strategy and
making it operational within the unit and in relation to possible
conflicting interest as between contiguous units, and also
interpreting it according to the needs of the particular context of the
272

unit. This level of leadership will additionally require the
development of appropriate systems and process for operational
needs.
At the Branch level, the leader should achieve the targeted
results with the requisite quality and efficiency. He should have an
orientation towards results and the tactics of pleasing the customer.
At the branch level, the leader should be capable of unlocking the
potential in the individuals in the team. It is for the Chief Executive
to identify his core team by hand picking them and giving them
suitable postings for a quick turnaround. They should be given not
only responsibilities but also adequate authority and then asked to
show results. The persons who show results should be suitably
rewarded through promotions, postings, overseas training etc.
Managers / Circle Managers should have a say in the postings
/ promotions of staff members working under them which will
enable them to have good command over them for enlisting their full
support and ensuring better results.
273

4. TECHNOLOGY UPGRADATION
In the deregulated environment, technology will be the key to
reducing transaction costs, offering customized products and
managing risks. The world is being swept by technological changes,
and technology related products are having shorter life cycles and,
therefore, bank executives must start formally planning as to how
their institutions would survive and thrive in the new banking
environment. It will, of course, be a very big challenge but in
meeting this challenge lies their future.
A giant leap forward on the technology front has to be taken
now. It needs to be understood that every future business is an
information business. However, in adopting technology, there will
be challenges in managing personal, in training the workforce, in
educating customers, in infrastructure support that is not evenly
available across their large networks-all have to be addressed. The
high investment has to be justified with increased business volumes.
Relocating the back-office functions in every branch to a centralized
location can, to some extent, do this.
274

It is important to remember that technology is only an
enabler. Success lies in aligning technology with the business
strategy and redefining processes to get maximum advantage.
5. INNOVATION
Innovation with technology can add to a Bank's competitive
edge in rendering services to its clients. If it is not possible to be the
first in the market, the next best is to become a fast follower i.e. to
quickly adapt to the new idea and operationalise it at the earliest. It
is necessary to stay ahead, constantly upgrade the products and
create new markets. Those who develop innovative methods to
reduce cost and provide cheaper and quality products and services at
reasonable prices will win.
6. MANAGING COMPETITION
Banks, apart from competing with each other, are facing
competition from Post Offices, Mutual Funds, Stoke Markets,
Financial Institutions, Non-Banking Financial Institutions etc.
Deregulation of interest rates has increased the intensity of
competition. The competition is more pronounced in metro and
275

urban centres, as private and foreign players have not entered the
rural and semi-urban areas in a big way because of disproportionate
return vis-à-vis cost involved. With the entry of new Private Sector
Banks, the state owned Banks have lost their market monopolies and
face stringent competition. Success for weak Banks will depend
primarily on their organizational effectiveness and imaginative
corporate planning combined with organizational restructuring. Any
further delay in the recoup of operational efficiency will prove an
irreparable loss.
7. HUMAN RESOURECES MANAGEMENT
The employees of a Bank which need restructuring will
normally be low in morale, with a bleak outlook about the future.
With such employees, it is very difficult to plan a quick turnaround.
Hence, it is necessary for the management to first build confidence
in the minds of the employees that their future is in safe hands and
that if all the employees and the management work in unison with
one mission and total commitment, the Bank would turnaround at
the quickest possible time.
276

Human resource management basically deals with finding the
right people, placing them in the right job, training and developing
them for better performance, providing career path, sustaining their
motivation through proper and timely rewards/recognition so that
both the employer and the employee can achieve their objectives.
One of the keys to early turnaround is a motivating HR policy.
Optimal Utilization of human resources is imperative. There must be
a comprehensive plan to ensure that sufficient skilled personnel are
available to match the organizational needs. The organization should
function smoothly by placing the right kind of people at the right
place at the right time and cost. The manpower planning should
address important issues like recruitment, proper training, incentive
to the talented staff and punishment to the inactive. There should be
proper tools to measure various competencies and to match them
with the key responsibility areas. Apart from performance appraisal
system, there should be well-laid internal system to gauge the
acumen of each of the employee, as also their potential to take up
higher responsibility with commitment. The appraiser should be a
capable person himself to assess the performance of the employee.
277

There should be a system of communicating the deficiencies to the
employee concerned to give him an opportunity to correct himself.
This can be achieved through motivation including self-motivation
and attitudinal change.
To reap the full benefits of the HR, the policy on HRM should
be thoroughly positive, motivating, and transparent and which
should make every employee feel that they are part of the
organisation and they are part of the decision making process. The
policy should be redefined to making the employees committed to
the organisation and to the changes that are taking place and to face
the future challenges as a cohesive team.
8. RETAINING CUSTOMER LOYALTY
Retaining customer loyalty is one of the important ingredients
in the restructuring process. In fact, it is cheaper to retain an existing
customer than to get a new one. Also, a dissatisfied customer can
spread a bad image about the Bank, which would be detrimental to
the turnaround process. No organisation on the turnaround path can
afford adverse publicity. Any spread of rumor about the financial
278

viability of a weak bank is likely to trigger a panic reaction, which
will be difficult to contain. A satisfied customer, on the other hand,
will be a good Ambassador to the Bank and facilitate growth and
new business.
While all state-run banks offer the same sovereign buffer for
the deposits placed with them, it is only the service that is rendered
which makes customers to continue to bank with a weak Bank.
Customer service has turned a full circle and has become a fulcrum
of all the activities of all classes of banks. Further, gone are the days
when customers of state-run banks had to stand in queues to verify
their balance, deposit and withdraw cash. These days, it is becoming
patently clear that sustained competitive advantage in the market is
possible only through improvement in quality and efficiency of
services rather than new product features alone. In other words, the
services sector is a standing testimony to the adage "Customer is the
King".
Banks need to focus more on quality of services in tune with
the expectations of the public at large. This is more so for banks
which are under or in need of restructuring. Now customers are
279

highly discerning and have a very low tolerance for poor service.
They have a greater propensity to switch service providers. Hence,
weak banks should identify and anticipate customer requirements
and develop the capability of servicing those needs. Relationship
management is the name of the game in the banking industry today
and customers never had it so good before. In a savings-driven
economy like ours, banks have finally come of age and the emphasis
is now on making the customer feel that he is the master. In an ever
changing environment where loyalties are fickle and competition is
fierce, weak banks should woo customers with a plethora of value
added services, as now the race is to be better than the best.
CONCLUSION
The above strategies, if implemented and monitored closely,
will ensure the early restructuring / turnaround of a bank. The
quality of products, services and process will be highly critical for
the success of any business enterprise in the new era. Only the
business that offers top quality products and services will succeed in
the days to come. The road ahead has immense potential and
280

opportunities but with challenges at every turn. It is only those banks
which adapt themselves to the changes, innovate and introduce new
technologies to meet the needs of the customer will succeed. Banks
which have new and innovative business models in place will be
geared to meet the challenges and compete effectively in the market.
It is these banks which would attain higher reaches of success in the
days to come.
281
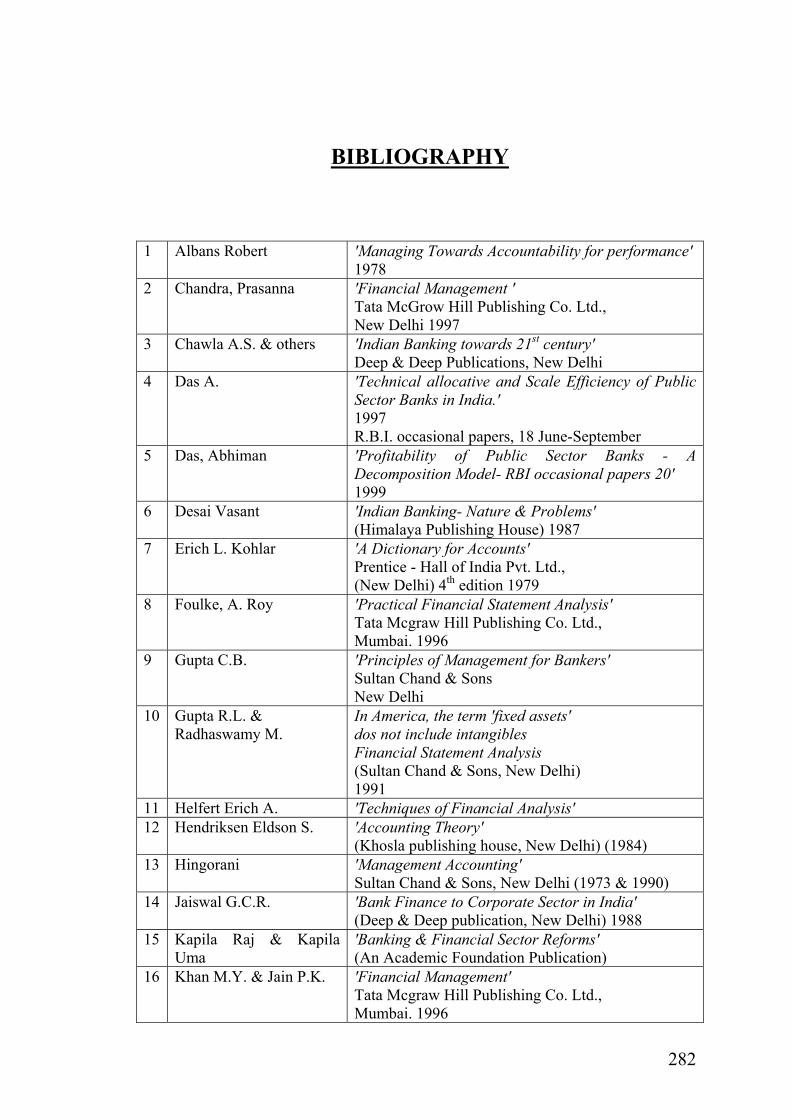
BIBLIOGRAPHY
1 Albans Robert 'Managing Towards Accountability for performance' 1978
2 Chandra, Prasanna 'Financial Management ' Tata McGrow Hill Publishing Co. Ltd., New Delhi 1997
3 Chawla A.S. & others 'Indian Banking towards 21st century' Deep & Deep Publications, New Delhi
4 Das A. 'Technical allocative and Scale Efficiency of Public Sector Banks in India.' 1997 R.B.I. occasional papers, 18 June-September
5 Das, Abhiman 'Profitability of Public Sector Banks - A Decomposition Model- RBI occasional papers 20' 1999
6 Desai Vasant 'Indian Banking- Nature & Problems' (Himalaya Publishing House) 1987
7 Erich L. Kohlar 'A Dictionary for Accounts' Prentice - Hall of India Pvt. Ltd., (New Delhi) 4th edition 1979
8 Foulke, A. Roy 'Practical Financial Statement Analysis' Tata Mcgraw Hill Publishing Co. Ltd., Mumbai. 1996
9 Gupta C.B. 'Principles of Management for Bankers' Sultan Chand & Sons New Delhi
10 Gupta R.L. & Radhaswamy M.
In America, the term 'fixed assets' dos not include intangibles Financial Statement Analysis (Sultan Chand & Sons, New Delhi) 1991
11 Helfert Erich A. 'Techniques of Financial Analysis' 12 Hendriksen Eldson S. 'Accounting Theory'
(Khosla publishing house, New Delhi) (1984) 13 Hingorani 'Management Accounting'
Sultan Chand & Sons, New Delhi (1973 & 1990) 14 Jaiswal G.C.R. 'Bank Finance to Corporate Sector in India'
(Deep & Deep publication, New Delhi) 1988 15 Kapila Raj & Kapila
Uma 'Banking & Financial Sector Reforms' (An Academic Foundation Publication)
16 Khan M.Y. & Jain P.K. 'Financial Management' Tata Mcgraw Hill Publishing Co. Ltd., Mumbai. 1996
282

17 Kothari C.R. 'Research Methodology' 18 Maheshwari S.N. 'Financial Management - Principles & Practice'
Sultan Chand & Sons New Delhi.
19 Mascon Michael 'Management individual and Organizational effectiveness' (Harpar & Rowput, New York) 1981
20 Mithani D.M. 'Banking International Trade & Public Finance' Himalaya Publishing House
21 Pandey I.M. 'Financial Management' Vikas Publishing House Pvt. Ltd., 1999
22 Ramchandra Rao B. 'Balance Sheet Analysis' Progressive Corporation Pvt. Ltd., Mumbai (1991)
23 Sharma K.R. 'Research Methodology' National Publishing House, (Jaipur & New Delhi) (2002)
24 Shekhar K.C. 'Banking Theory and Practice (Law & Foreign Exchange)' 6th edition Vikas Publishing House Pvt. Ltd.,
25 Stanley B. 'A Hirt foundation of financial management' (Homewood guineas: Richard growin inc.) 3rd edition (1984)
26 Swami S.B. & Subrahmanyam G.
'Comparative Performance of Public sector Banks in India'
27 Tannon M. L. 'Tannon's Banking Law & Practice' (India Law House, New Delhi) 1999
Tondon Prakash 'Banking Century' (VIKING) 1988.
29 Tripathi P.C. 'Research Methodology' Sultan Chand & Sons, New Delhi, 1991
28
283

JOURNALS 1. Bank Quest
October - December - 2002
2. Bank Quest
The Journal of Indian Institute of Banking & Finance
October-December 2003
3. 'Best Banks 2002'
Business India
(December-2002)
4. 'Charted Financial Analyst'
June-1997, December-1998.
5. IBA Bulletin
March-2002
6. 'IBA Bulletin'
September-2002,
November-2002,
February-2003.
7. IBA Bulletin
March-2003
8. Indian Journal of Accounting
December, 2003.
9. 'India's Best Banks'
The Financial Express
(Survey - 2002)
284

WEB SITES
1. www.banker'sindia.com
2. www.bankreport.rbi.org.in
3. www.bisnet.com
4. www.rbi.org.in
5. www.report.rbi.org.in
285
![Qcl 14-v3 [best practices]-[sjmsom]_[riddhima gohil]](https://static.fdocuments.net/doc/165x107/55cd2196bb61ebb5378b457c/qcl-14-v3-best-practices-sjmsomriddhima-gohil.jpg)


![General arrangement drawing - South Somersetcip.southsomerset.gov.uk/Planning/StreamDocPage/obj.pdf?DocNo=... · Waind Gohil Architects’ [WGA] General Arrangement drawings [GA],](https://static.fdocuments.net/doc/165x107/5ada8c9f7f8b9a6d318cea32/general-arrangement-drawing-south-gohil-architects-wga-general-arrangement.jpg)


![[XLS]wcd.gujarat.gov.in · Web viewChetna J.Matroja Minaben D.Gohil Dahej 5 Parmar Street Daxaben Somabhai Dahej 6 In Agar Arunaben D.Sindha Daxaben Ganpat Narnavi Makiben G.Patel](https://static.fdocuments.net/doc/165x107/5b0bfd907f8b9a952f8b59ba/xlswcd-viewchetna-jmatroja-minaben-dgohil-dahej-5-parmar-street-daxaben-somabhai.jpg)