Saudi Petrochemical Sector › ScheduleReports › 82c2b1a1_TasiPetroS… · Saudi Petrochemicals...
34
Saudi Petrochemicals Sector Petrochemicals –Industrial Saudi Arabia 25 May 2015 January 18, 2010 US$110bn 30.3% US$253mn Market cap Free float Avg. daily volume Disclosures Please refer to the important disclosures at the back of this report. Powered by EFA Platform Key themes Although an oversupply situation prevails, changes in the oil industry dynamics has resulted in a jump in crude prices over the last few weeks. This has helped petrochemical product prices move up to a certain extent although the uptrend sustainability remains to be seen as global economic growth remains uneven and industrial outlook in China remains weak. These factors will pose headwinds for Saudi petrochemical players. Implications Based on Q1 results, crude and petrochemical product price trends, global macroeconomic situation and company-specific reasons, we have adjusted our earnings and dividend estimates. We have revised target prices across the board and adjusted ratings of two companies as well. What do we think? Stock Rating Price Target SABIC Overweight SAR125.5 SAFCO Neutral SAR127.4 Sipchem Neutral SAR34.3 NIC Neutral SAR26.3 Yansab Neutral SAR52.6 APC Neutral SAR59.8 SPC Underweight SAR14.1 YTD Performance (Rebased to 100) 80 100 120 140 160 Jan-15 Feb-15 Mar-15 Apr-15 May-15 SABIC Sipchem SAFCO NIC Yansab APC SPC TASI Source: Bloomberg, Al Rajhi Capital Note: Market data is of May 12, 2015 closing. Research Department ARC Research Team Tel +966 11 211 9370, [email protected] Saudi Petrochemical Sector Headwinds persist; Valuations expensive Demand dampness and lower petrochemical product prices have impacted the performance of Saudi petrochemical companies in Q1. Since then, oil prices have surged and product prices have followed its trend. However, the sustainability of the product price uptick remains to be seen amid oil price volatility. Also, an uneven global economic growth and a muted industrial scenario in China indicate demand dampness over the near term. Based on Q1 results, crude and petrochemical product price trends, macroeconomic situation in key markets and company-specific reasons, we have revised our earnings and dividend estimates. We continue with our Overweight rating on SABIC. We have revised down our rating on SAFCO and SPC to Neutral and Underweight respectively. We have Neutral rating on rest of the petrochemical stocks under our coverage. Oil and global economy: After dipping to a six-year low of ~US$45 a barrel in mid-January, Brent surged to US$69 as a fall in the rig count in the US, drop in the inventory levels and a stable demand from Asia boosted sentiments. However, a pending deal of the Western powers with Iran, which would lift the oil embargo (not immediately though), and continuation of OPEC’s production policy has restrained a further surge. Additionally, industrial activities remained lackluster in China as demand from some of its key markets remained lull. As a result, Saudi companies posted dismal Q1 numbers (net profit 53% down y-o-y). Based on oil market dynamics, we expect prices to be in the $60-70 range for the rest of 2015. Although, product prices have jumped in the last few weeks, we believe it is primarily due to higher oil prices rather than demand strength. Shale exploration brings in petrochemical investments: A sharp jump in shale exploration in recent years along with proven high reserves have emboldened leading producers to undertake new/debottlenecking projects in North America. These producers will be able to keep ethylene cash costs low as compared to their naphtha peers. This will keep global petrochemical prices under check, impacting the bottom-lines and margins of Saudi players. In need of long-term strategies: Saudi companies, despite government support, have limited themselves to being producers of basic/intermediate products. Given the scenario, we believe Saudi players need to move downstream in the value chain, either through vertical integration organically or inorganically. This will bolster their product portfolio and improve their long- term profitability. However, such projects would require shifting toward heavier feedstock. Valuation expensive: The announcement of the date of opening up of the market to foreign investors brought in cheers among Saudi investors. Sentiments drove petrochemical sector stocks, which jumped in the range of 7% to 35% QTD (except SAFCO). Saudi Petrochemical Index currently trades at 17.4x (P/E 2015E), in line with its global peer group - MSCI World Chemicals Index and S&P Chemicals Index – averages of 17.8x and 17.9x respectively. We do not see any more expansion in valuation multiples. Based on Q1 results, oil and petrochemical market dynamics and company-specific reasons, we have revised target prices of the companies under coverage, except Yansab. SABIC remains our favorite in Saudi petrochemical space. We have revised our rating on SAFCO to Neutral due to urea price pressure and multiple delays in the commencement of its fifth unit. Also, we have downgraded SPC to Underweight given its failure to attend structural problems.
Transcript of Saudi Petrochemical Sector › ScheduleReports › 82c2b1a1_TasiPetroS… · Saudi Petrochemicals...
Saudi Petrochemicals Sector Petrochemicals –Industrial Saudi Arabia
25 May 2015
January 18, 2010
US$110bn 30.3% US$253mn Market cap Free float Avg. daily volume
Disclosures Please refer to the important disclosures at the back of this report. Powered by EFA Platform
Key themes
Although an oversupply situation prevails, changes in the oil industry dynamics has resulted in a jump in crude prices over the last few weeks. This has helped petrochemical product prices move up to a certain extent although the uptrend sustainability remains to be seen as global economic growth remains uneven and industrial outlook in China remains weak. These factors will pose headwinds for Saudi petrochemical players.
Implications
Based on Q1 results, crude and petrochemical product price trends, global macroeconomic situation and company-specific reasons, we have adjusted our earnings and dividend estimates. We have revised target prices across the board and adjusted ratings of two companies as well.
What do we think?
Stock Rating Price Target
SABIC Overweight SAR125.5
SAFCO Neutral SAR127.4
Sipchem Neutral SAR34.3
NIC Neutral SAR26.3
Yansab Neutral SAR52.6
APC Neutral SAR59.8
SPC Underweight SAR14.1
YTD Performance (Rebased to 100)
80
100
120
140
160
Jan-15 Feb-15 Mar-15 Apr-15 May-15
SABIC Sipchem SAFCO NIC
Yansab APC SPC TASI Source: Bloomberg, Al Rajhi Capital Note: Market data is of May 12, 2015 closing.
Research Department ARC Research Team
Tel +966 11 211 9370, [email protected]
Saudi Petrochemical Sector Headwinds persist; Valuations expensive Demand dampness and lower petrochemical product prices have impacted the
performance of Saudi petrochemical companies in Q1. Since then, oil prices
have surged and product prices have followed its trend. However, the
sustainability of the product price uptick remains to be seen amid oil price
volatility. Also, an uneven global economic growth and a muted industrial
scenario in China indicate demand dampness over the near term. Based on Q1
results, crude and petrochemical product price trends, macroeconomic
situation in key markets and company-specific reasons, we have revised our
earnings and dividend estimates. We continue with our Overweight rating on
SABIC. We have revised down our rating on SAFCO and SPC to Neutral and
Underweight respectively. We have Neutral rating on rest of the petrochemical
stocks under our coverage.
Oil and global economy: After dipping to a six-year low of ~US$45 a barrel in
mid-January, Brent surged to US$69 as a fall in the rig count in the US, drop in
the inventory levels and a stable demand from Asia boosted sentiments.
However, a pending deal of the Western powers with Iran, which would lift the
oil embargo (not immediately though), and continuation of OPEC’s production
policy has restrained a further surge. Additionally, industrial activities remained
lackluster in China as demand from some of its key markets remained lull. As a
result, Saudi companies posted dismal Q1 numbers (net profit 53% down y-o-y).
Based on oil market dynamics, we expect prices to be in the $60-70 range for the
rest of 2015. Although, product prices have jumped in the last few weeks, we
believe it is primarily due to higher oil prices rather than demand strength.
Shale exploration brings in petrochemical investments: A sharp jump in
shale exploration in recent years along with proven high reserves have
emboldened leading producers to undertake new/debottlenecking projects in
North America. These producers will be able to keep ethylene cash costs low as
compared to their naphtha peers. This will keep global petrochemical prices
under check, impacting the bottom-lines and margins of Saudi players.
In need of long-term strategies: Saudi companies, despite government
support, have limited themselves to being producers of basic/intermediate
products. Given the scenario, we believe Saudi players need to move
downstream in the value chain, either through vertical integration organically or
inorganically. This will bolster their product portfolio and improve their long-
term profitability. However, such projects would require shifting toward heavier
feedstock.
Valuation expensive: The announcement of the date of opening up of the
market to foreign investors brought in cheers among Saudi investors.
Sentiments drove petrochemical sector stocks, which jumped in the range of 7%
to 35% QTD (except SAFCO). Saudi Petrochemical Index currently trades at
17.4x (P/E 2015E), in line with its global peer group - MSCI World Chemicals
Index and S&P Chemicals Index – averages of 17.8x and 17.9x respectively. We
do not see any more expansion in valuation multiples. Based on Q1 results, oil
and petrochemical market dynamics and company-specific reasons, we have
revised target prices of the companies under coverage, except Yansab. SABIC
remains our favorite in Saudi petrochemical space. We have revised our rating
on SAFCO to Neutral due to urea price pressure and multiple delays in the
commencement of its fifth unit. Also, we have downgraded SPC to Underweight
given its failure to attend structural problems.

Saudi Petrochemicals
Sector Petrochemicals –Industrial
Disclosures Please refer to the important disclosures at the back of this report. 2
Crude & petrochemical dynamics Oil volatile; petrochemicals prices range-bound Uptick in oil prices boosting optimism… Brent crude, after halving from the peak seen in June 2014, continued to remain under
pressure and touched a low of US$45 in January 2015. However, the steep fall in crude prices
made oil exploration uneconomic, especially for unconventional oil explorers in the US. This
has resulted in a sharp decline in the rig count, which has fallen to 668 (as of May 10, source:
BHI), a fall for straight 22 weeks and the lowest since September 2010. The drop in US oil
production coupled the geo-political unrest in the Middle East (Yemen unrest, Syria and Iraq
crises) has led to an upward pressure on crude prices, which has jumped ~48% from its
recent low crossing US$69 a barrel mark. The rise in Brent prices pushed up naphtha, which
surged ~49% since the January-low, supporting petrochemical prices. However, Brent prices
have fallen to ~US$66, pressuring naphtha prices, which will have a trickle down impact on
the petrochemical product prices in absence of strong demand environment.
…however supply situation still remains ample Over the past seven years, oil demand has risen just over 6mbpd (source: US EIA) or at an
average of ~1mbpd a year. Interestingly, most of the incremental demand has been taken care
of by the rise in US shale production, while OPEC production remained stagnated. For 2015,
the US energy agency anticipates a 1mbpd demand growth (vs. 0.9mbpd in 2014) while
nearly all the incremental demand is expected to be met by rising shale production indicating
tepid demand for OPEC oil. The US EIA expects an incremental demand of 1.1mbpd y-o-y in
2015 to touch 93.6mbpd while supply is up 1mbpd to 95.2mbpd indicating oversupply. OPEC
has been pumping oil at record levels with average production standing at 31.3mbpd in April
(source: Bloomberg). An oversupply situation, the likelihood of lifting sanctions on Iran and
maintaining production status-quo at the OPEC June meeting are expected to keep a tab on
oil prices over the near term. We expect oil price to hover in the range of US$60-70 a barrel
for the rest of 2015. However, a sudden disruption in Iraq or Libya due to the prevailing
geopolitical tensions and a faster-than-expected economic/industrial recovery in Euro zone
and China can be viewed as upside risks.
Figure 1 Brent & naphtha recover, although remain range-bound Figure 2 Growth in oil supply globally
0
20
40
60
80
100
120
Jun-14 Sep-14 Dec-14 Mar-15
Brent Naphtha
1.3
-1.8
1.4
0.3
1.4
-1.0
0.1
0.1
0.6
0.6
0.4
1.0
1.21.6
0.9
-0.4
1.1
-0.2-0.5
0.20.4
-0.2
-2.0
-1.0
0.0
1.0
2.0
3.0
4.0
2008 2009 2010 2011 2012 2013 2014 2015E
mbpd
OPEC US Rest of the world Source: Bloomberg, Al Rajhi Capital Note: Rebased to 100 Source: US EIA, Al Rajhi Capital
Petrochemical prices jump; albeit remain lower y-o-y Petrochemical prices have climbed up double-digit as crude prices rose over 20% YTD (over
43% since the lowest point seen in January). However, product prices still very much lower y-
o-y. In addition to low oil prices, we attribute lower product prices to weak manufacturing
scenario in China and muted demand in Europe. Having said that, we do not expect product
prices to jump considerably from current levels unless oil prices move up on a sustained
basis. Additionally, strong positives in the Chinese and European industrial scenario would
be needed to push up petrochemical prices.

Saudi Petrochemicals
Sector Petrochemicals –Industrial
Disclosures Please refer to the important disclosures at the back of this report. 3
Ethylene (+23.4% YTD) and propylene (10.6%) prices moved upward primarily shutdown at
Shell’s Moerdijk cracker in the Netherlands and other crackers running at a higher rate amid
supply tightness due to outage of some plants (source: ICIS). A tighter supply-demand
balance was seen in Asia due to a limited supply from Europe and the Middle East, resulting
in a strong price uptick over the last couple of months. Given the current macroeconomic and
crude price scenarios we expect ethylene to move in the range of US$1200-1300 a ton while
propylene prices should be in the range of US$1100-1200 a ton over the next few months.
An uptick in ethylene prices coupled with a tight inventory position and shutdowns in the
Middle East pushed up polyethylene (PE) prices over the past couple of months. Overall
HDPE and LDPE prices moved up 6.9% and 11.5% YTD respectively although they continued
to be lower y-o-y. Similar dynamics apply to polypropylene (PP), whose prices climbed 16.4%
YTD. We anticipate PE prices to be in the range of US$1350-1550 (both grades included),
while PP should trade at prices of US$1300-1400 a ton over the near term.
Figure 3 Ethylene and propylene prices Figure 4 Polyethylene and polypropylene prices
600
800
1000
1200
1400
1600
1800
Jan-14 May-14 Sep-14 Jan-15 May-15 Sep-15
US$/ton
Ethylene Propylene
900
1100
1300
1500
1700
Jan-14 May-14 Sep-14 Jan-15 May-15 Sep-15
US$/ton
Polyethylene Polypropylene Source: Bloomberg, Al Rajhi Capital Source: Bloomberg, Al Rajhi Capital
Mono-ethylene glycol (MEG) prices continue to be governed by crude and ethylene price
trends. This, along with a limited availability of feedstock in Europe, lower operating rates
and a few plant shutdowns in Asia have tightened the supply situation (source: ICIS), which
resulted in firming of MEG prices (+29% YTD). Demand for MEG, which has applications in
anti-freeze and polyethylene terephthalate (PET) industries, is expected to remain steady as
the winter season comes to an end but PET industries operations pickup in summer. Further,
shutdowns in Europe and Middle East (Yansab) will support MEG prices in the near term.
We expect MEG prices to hover in the range of US$1200-1300 over the next few months.
After a weak Q1, methanol prices picked up following the crude trend. After this uptick we
expect prices to remain stable around its long-term average of around US$350 a ton.
Figure 5 MEG prices Figure 6 Methanol prices
800
900
1000
1100
1200
1300
1400
Jan-14 Apr-14 Jul-14 Oct-14 Jan-15 Apr-15 Jul-15 Oct-15
200
300
400
500
600
Jan-14 May-14 Sep-14 Jan-15 May-15 Sep-15
US$/ton
Source: Bloomberg, Al Rajhi Capital Source: Bloomberg, Al Rajhi Capital
Saudi Petrochemicals
Sector Petrochemicals –Industrial
Disclosures Please refer to the important disclosures at the back of this report. 4
Polyvinyl chloride (PVC) prices have posted healthy gains (+12.6% YTD) primarily on the
back of shutdowns across the world that led to tight supplies amid a steady rise in demand
(source: ICIS). The price uptick was seen across geographies including Asia, Europe and
Americas. We believe demand will remain stable and expect PVC prices to move in the range
of US$850-950 a ton over the coming months.
Polystyrene (PS) prices have jumped sharply over the past few weeks as feedstock prices
improved and warmer weather boosted construction activities in Europe and North America.
However, in Asia, demand remained soft as manufacturers from China saw a weaker order
book. Manufacturers continue to keep a cautious outlook and are reluctant to build their
inventories. We expect PS to have a flat year and anticipate that prices will remain in the
range of US$1450-1550 a ton.
Figure 7 PVC prices Figure 8 Polystyrene prices
600
700
800
900
1000
1100
Jan-14 May-14 Sep-14 Jan-15 May-15 Sep-15
US$/ton
750
1000
1250
1500
1750
2000
Jan-14 May-14 Sep-14 Jan-15 May-15 Sep-15
US$/ton
Source: Bloomberg, Al Rajhi Capital Source: Bloomberg, Al Rajhi Capital
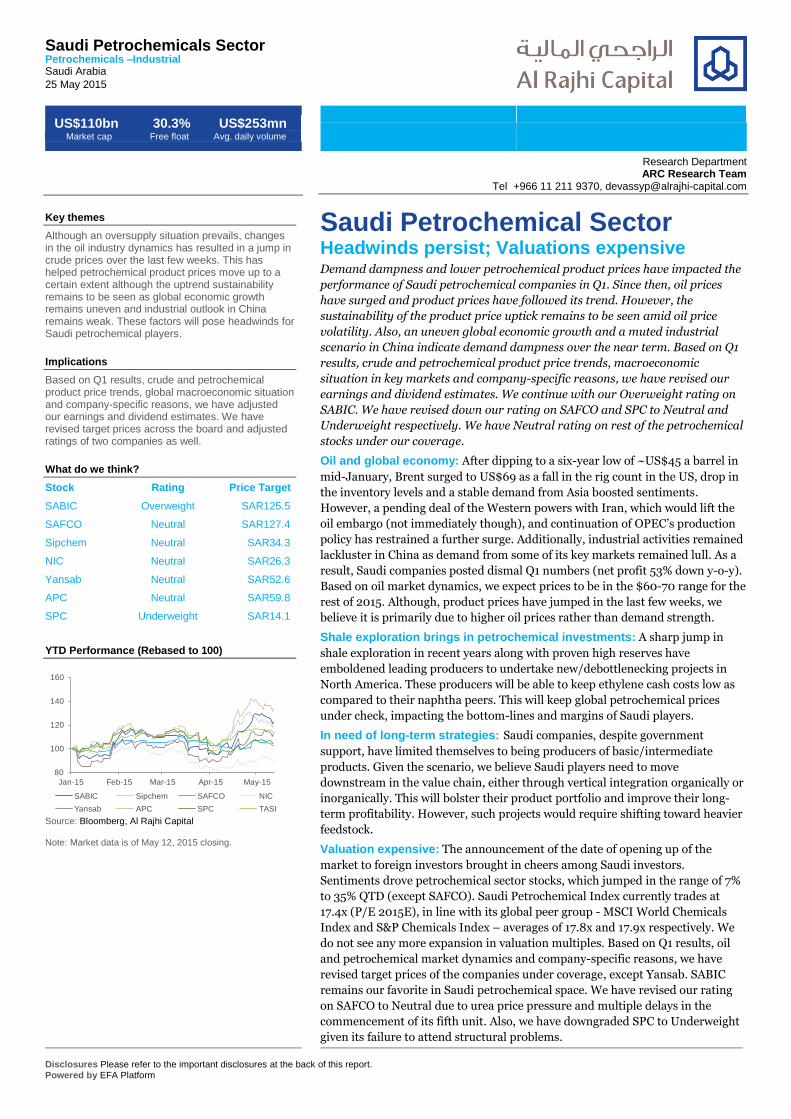
On the fertilizer front, urea prices fell sequentially as well as on a y-o-y basis, primarily due to
a revised fertilizer export tax policy set by China that boosted supply volumes in the market.
Average ammonia and urea prices for Q1 stood at US$425 and US$343 a ton. We expect
prices to remain soft till Q2 and move up marginally in H2, when agriculture season is at its
peak in Asia. We anticipate ammonia and urea price to hover in the range of US$375-450 and
US$275-325 a ton over the coming months. However addition of new capacities (600 kiloton
in Asia and 3.1mn ton in North Africa) and a continued oversupply from China would exert a
strong downward pressure on urea prices according to us.
Figure 9 Ammonia prices Figure 10 Urea prices
200
300
400
500
600
700
Jan-14 Apr-14 Jul-14 Oct-14 Jan-15 Apr-15 Jul-15 Oct-15
US$/ton
100
200
300
400
500
Jan-14 Apr-14 Jul-14 Oct-14 Jan-15 Apr-15 Jul-15 Oct-15
US$/ton
Source: Bloomberg, Al Rajhi Capital Source: Bloomberg, Al Rajhi Capital
Saudi Petrochemicals
Sector Petrochemicals –Industrial
Disclosures Please refer to the important disclosures at the back of this report. 5
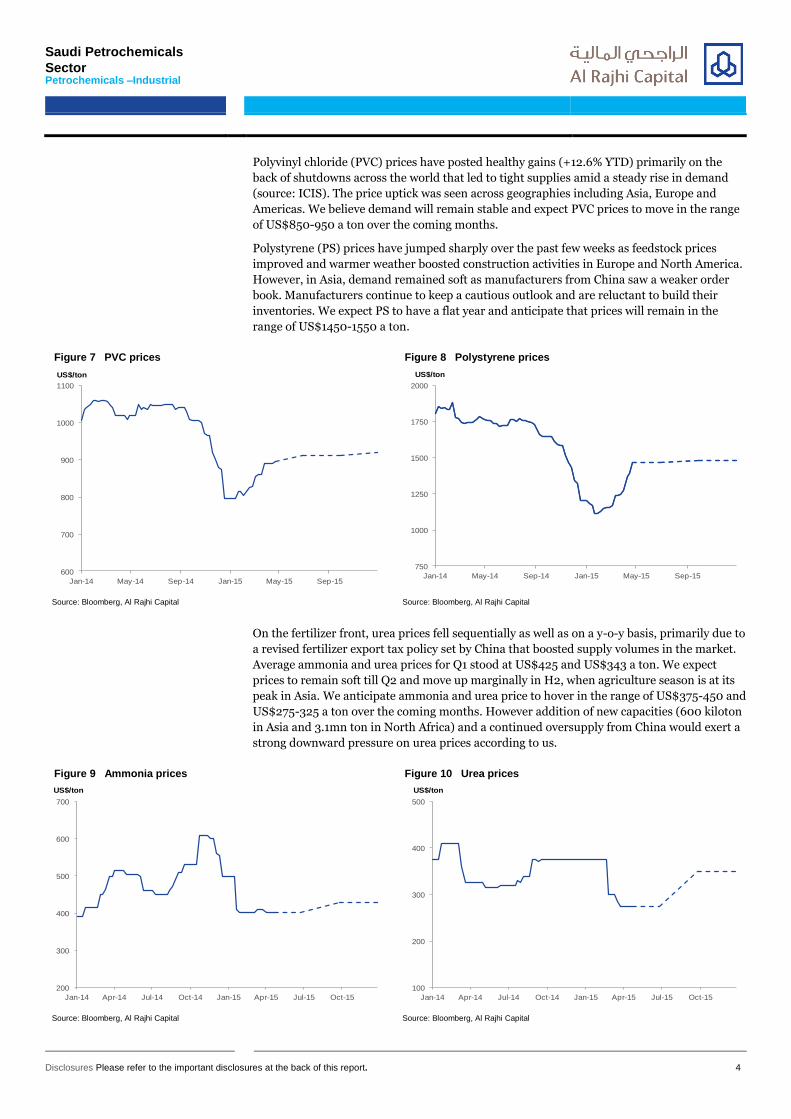
Shale gas: Posing a threat A rise in shale exploration activities in North America has triggered a revolution in the
natural gas scenario and that development is poised to reshape the global gas and
petrochemical industries over the medium-term. The US natural gas production has risen at
a CAGR (2007-2014) of ~4% to 31.9 trillion cubic feet (tcf), although the contribution from
the shale wells has jumped ~32% (CAGR) to approximately 14tcf. Shale production despite
the jump, stood at 7.2% of the proven reserves indicating higher supplies suggesting an
anticipated rise in production over the coming years.
Figure 11 US Shale gas production has risen significantly Figure 12 Natural gas prices under pressure on ample supply
0
5,000
10,000
15,000
20,000
25,000
30,000
35,000
2007 2008 2009 2010 2011 2012 2013 2014
bcf
Total natural gas withdrawals Gas wells Shale wells
0
2
4
6
8
10
12
14
Jan-08 Jan-09 Jan-10 Jan-11 Jan-12 Jan-13 Jan-14 Jan-15
US$/mmBTU
Source: US EIA, Al Rajhi Capital Source: US EIA, Al Rajhi Capital
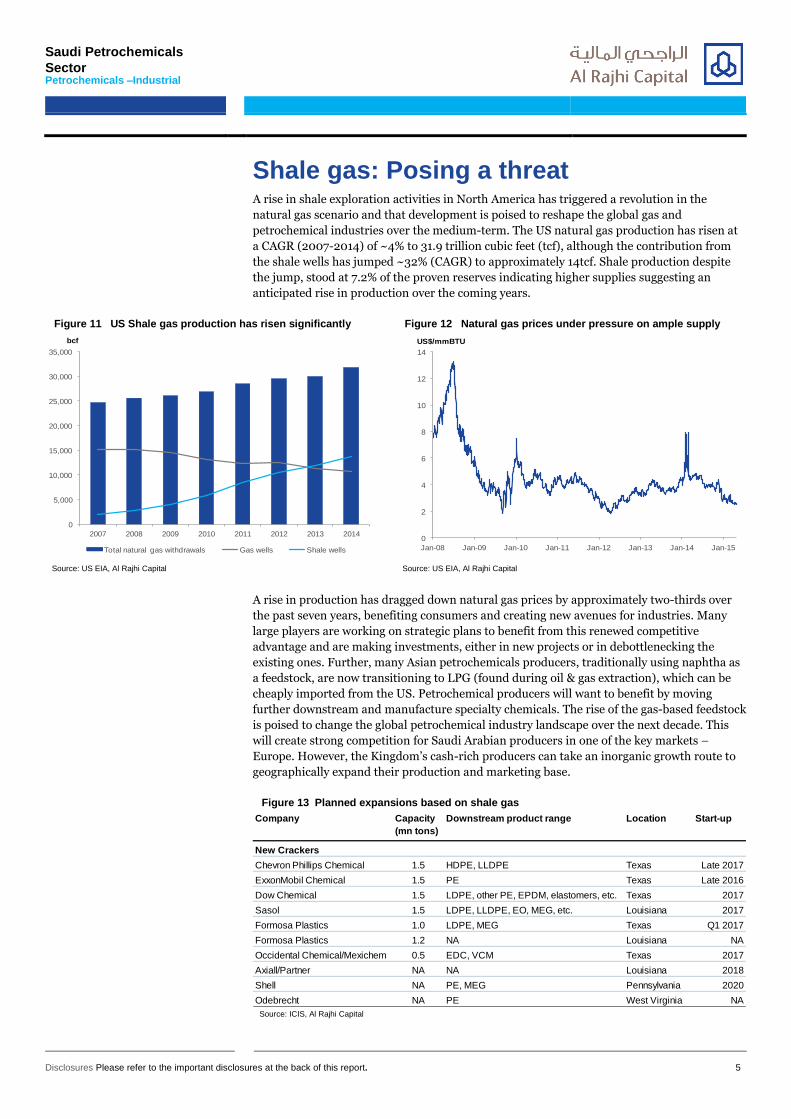
A rise in production has dragged down natural gas prices by approximately two-thirds over
the past seven years, benefiting consumers and creating new avenues for industries. Many
large players are working on strategic plans to benefit from this renewed competitive
advantage and are making investments, either in new projects or in debottlenecking the
existing ones. Further, many Asian petrochemicals producers, traditionally using naphtha as
a feedstock, are now transitioning to LPG (found during oil & gas extraction), which can be
cheaply imported from the US. Petrochemical producers will want to benefit by moving
further downstream and manufacture specialty chemicals. The rise of the gas-based feedstock
is poised to change the global petrochemical industry landscape over the next decade. This
will create strong competition for Saudi Arabian producers in one of the key markets –
Europe. However, the Kingdom’s cash-rich producers can take an inorganic growth route to
geographically expand their production and marketing base.
Figure 13 Planned expansions based on shale gas
Company Capacity
(mn tons)
Downstream product range Location Start-up
New Crackers
Chevron Phillips Chemical 1.5 HDPE, LLDPE Texas Late 2017
ExxonMobil Chemical 1.5 PE Texas Late 2016
Dow Chemical 1.5 LDPE, other PE, EPDM, elastomers, etc. Texas 2017
Sasol 1.5 LDPE, LLDPE, EO, MEG, etc. Louisiana 2017
Formosa Plastics 1.0 LDPE, MEG Texas Q1 2017
Formosa Plastics 1.2 NA Louisiana NA
Occidental Chemical/Mexichem 0.5 EDC, VCM Texas 2017
Axiall/Partner NA NA Louisiana 2018
Shell NA PE, MEG Pennsylvania 2020
Odebrecht NA PE West Virginia NA Source: ICIS, Al Rajhi Capital

Saudi Petrochemicals
Sector Petrochemicals –Industrial
Disclosures Please refer to the important disclosures at the back of this report. 6
Saudi Petrochemical Sector Integration and innovation to be key drivers
Downstream movement and advancement in product portfolio needed Saudi petrochemical producers historically have been at an advantage given their access to
cheap feedstock. However, the limited gas availability and its increasing demand have
prompted the government to stop subsidized gas allocation to new petrochemical complexes.
Consequently, the newly-commissioned projects and those in the pipeline will have to depend
on liquid feedstock. e.g. The Sadara Complex (an Aramco - Dow JV) will be the first complex
in the GCC region that will crack naphtha and use it for downstream production. Although
the liquid feedstock is offered at a sizeable discount to international market prices in Saudi
Arabia, dependence on this will expose these projects to feedstock price volatility. While gas-
based feedstock producers (who receive gas at a fixed cost) will benefit/lose on a rise/drop in
product prices, profitability of naphtha-based producers will depend on whether the rise/fall
in crude (and in turn naphtha) prices has been factored in prices of the end products.
Despite being at an advantage, only a few Saudi producers have strategically moved
downstream and created an integrated petrochemical value chain (e.g. Sipchem) while many
producers continue to engage in manufacturing basic/intermediate products, limiting margin
growth. Further, we believe most Saudi players tend to lag in terms of research &
development investments, which hold them back from introducing innovative products. With
new and highly-integrated petrochemical facilities being built on the back of the shale boom,
we believe the vertical integration and product innovation will be the key growth drivers for
Saudi petrochemical producers going forward.
Foreign investment expectations drive up valuations
Valuations expensive; higher than historical averages With exceptions of SAFCO, Sipchem and APC, which moved up marginally, all other
petrochemical stocks under coverage had posted negative returns during January to March
2015 period. However, the news of opening up of the market to foreign investors boosted
investor sentiments resulting in a double-digit surge in stock prices (viz. APC: +35% QTD,
SABIC: +28.7%, Yansab: +27.6%) of most of the stocks pushing up valuations. Petrochemical
sector is considered to be among the core sectors in which a major portion of foreign capital
is expected to come as the industry benefits from strong government support primarily in the
form of allocation of subsidized feedstock.
Currently, Saudi Petrochemical Index (17.4x, 2015E) trades at a premium to the broader
TASI (16.4x) and largely in line to its global peer sector indices – the MSCI World Chemical
Index (17.8x) and the S&P500 Chemical Index (17.9x). We found that Saudi Petrochemical
Index trades at a premium to its historic average (12-month blended forward P/E over the
last five years) of 16.6x, indicating expensive valuations.
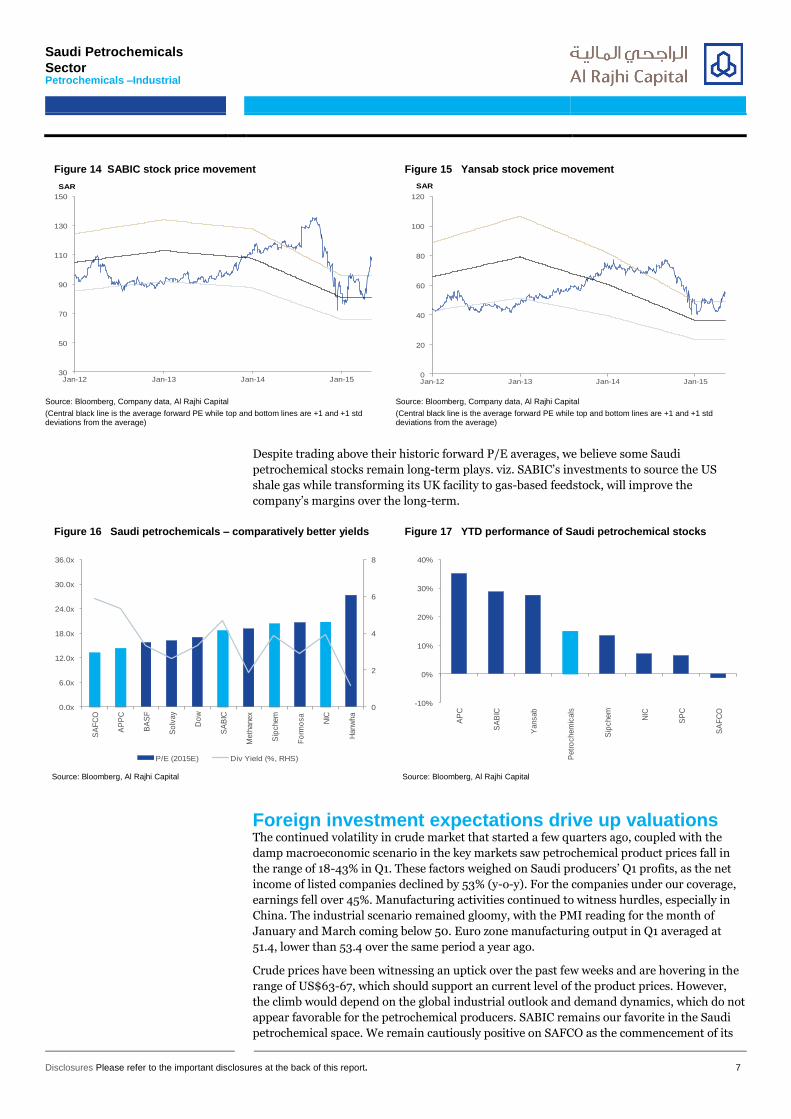
We analyzed the stocks under our coverage and found their performance similar to that of the
Petrochemical Index. We also found that prices of petrochemical stocks under our coverage
are above one standard deviation of historic expected P/E, indicating valuations are
stretched. Below, we chart examples of SABIC and Yansab, whose price movement has
crossed the upper P/E band as the stocks jumped in the last couple of weeks following the
finalization of date of opening up of Tadawul.
Saudi Petrochemicals
Sector Petrochemicals –Industrial
Disclosures Please refer to the important disclosures at the back of this report. 7
Figure 14 SABIC stock price movement Figure 15 Yansab stock price movement
30
50
70
90
110
130
150
Jan-12 Jan-13 Jan-14 Jan-15
SAR
0
20
40
60
80
100
120
Jan-12 Jan-13 Jan-14 Jan-15
SAR
Source: Bloomberg, Company data, Al Rajhi Capital
(Central black line is the average forward PE while top and bottom lines are +1 and +1 std deviations from the average)
Source: Bloomberg, Company data, Al Rajhi Capital
(Central black line is the average forward PE while top and bottom lines are +1 and +1 std deviations from the average)
Despite trading above their historic forward P/E averages, we believe some Saudi
petrochemical stocks remain long-term plays. viz. SABIC’s investments to source the US
shale gas while transforming its UK facility to gas-based feedstock, will improve the
company’s margins over the long-term.
Figure 16 Saudi petrochemicals – comparatively better yields Figure 17 YTD performance of Saudi petrochemical stocks
0
2
4
6
8
0.0x
6.0x
12.0x
18.0x
24.0x
30.0x
36.0x
SA
FC
O
AP
PC
BA
SF
So
lvay
Do
w
SA
BIC
Meth
anex
Sip
chem
Fo
rmo
sa
NIC
Hanw
ha
P/E (2015E) Div Yield (%, RHS)
-10%
0%
10%
20%
30%
40%
AP
C
SA
BIC
Yansab
Petr
ochem
icals
Sip
chem
NIC
SP
C
SA
FC
O
Source: Bloomberg, Al Rajhi Capital Source: Bloomberg, Al Rajhi Capital
Foreign investment expectations drive up valuations The continued volatility in crude market that started a few quarters ago, coupled with the
damp macroeconomic scenario in the key markets saw petrochemical product prices fall in
the range of 18-43% in Q1. These factors weighed on Saudi producers’ Q1 profits, as the net
income of listed companies declined by 53% (y-o-y). For the companies under our coverage,
earnings fell over 45%. Manufacturing activities continued to witness hurdles, especially in
China. The industrial scenario remained gloomy, with the PMI reading for the month of
January and March coming below 50. Euro zone manufacturing output in Q1 averaged at
51.4, lower than 53.4 over the same period a year ago.
Crude prices have been witnessing an uptick over the past few weeks and are hovering in the
range of US$63-67, which should support an current level of the product prices. However,
the climb would depend on the global industrial outlook and demand dynamics, which do not
appear favorable for the petrochemical producers. SABIC remains our favorite in the Saudi
petrochemical space. We remain cautiously positive on SAFCO as the commencement of its

Saudi Petrochemicals
Sector Petrochemicals –Industrial
Disclosures Please refer to the important disclosures at the back of this report. 8
fifth unit should trigger earnings growth although lower urea prices will pose hurdles. We are
Neutral on rest of the companies for now. The commencement of the EVA/LDPE plant
should offer earnings and margin growth for Sipchem. SPC has decided to undertake
restructuring initiatives at its Al Waha and Acrylic Acid units, which would bring in expenses
related to the same. Meanwhile, Yansab will be undertaking a prolonged shutdown, which
will impact its Q2 profits.
Figure 18 Q1 performance of petrochemical companies under coverage
SAR mn
Q1 2014 Q1 2015% change y-o-y Q1 2014 Q1 2015% change y-o-y
SABIC 49,221 35,564 -27.7% 6441.7 3934.6 -38.9%
SAFCO 1,178 962 -18.3% 842.5 590.0 -30.0%
Sipchem 917 826 -9.9% 68.7 80.6 17.4%
NIC 4,414 3,942 -10.7% 320.8 -332.5 NM
Yansab 2,318 1,717 -25.9% 555.7 285.1 -48.7%
APC 669 468 -30.1% 137.5 89.6 -34.8%
SPC 321 262 -18.4% 99.9 -49.5 NM
Total 59,038 43,741 -25.9% 8,467 4,598 -45.7%
Revenues Net income
Source: Bloomberg, Tadawul, Al Rajhi Capital
Lower earnings to impact dividends Saudi petrochemical players have witnessed a rapid growth over the past few years on the
back of strong government support and favorable business dynamics. The free cash flow
(FCF) of the companies under our coverage has risen at 27.6% CAGR (2010-2014), while the
cash positioned strengthened to SAR87.6bn at 10% CAGR. Debts have come down by a
significant volume over the same period. A shortage of feedstock in the Kingdom has
restrained organic growth, while almost none of the players have attempted to grow
inorganically at the global levels. With strong coffers, we believe petrochemical companies
would continue to dividend payouts over the near-term. However, with earnings expected to
decline in 2015, we anticipate a fall in dividend per share for most of the companies under
our coverage.
Figure 19 Robust coffers to aid dividend payment
0
15,000
30,000
45,000
60,000
75,000
0
20,000
40,000
60,000
80,000
100,000
2010 2011 2012 2013 2014
SAR mnSAR mn
Total Cash FCF (RHS)
Source: Bloomberg, Al Rajhi Capital
Saudi Petrochemicals
Sector Petrochemicals –Industrial
Disclosures Please refer to the important disclosures at the back of this report. 9
Risks Geopolitical situation may impact supply scenario: The prevailing civil war in Libya and
Iraq has been destabilizing oil production over the past few months. The cooling off scenario
may boost production, while a rise in conflict may result in lower production levels, which
may impact oil prices either ways. If the Iran nuclear deal succeeds and the embargo is taken
off, an additional supply from Iran may come in the market sharply pressurizing oil
downward.
A sharp jump/decline in oil prices: Petrochemical product prices still move largely in
tandem with crude prices despite a decline in oil-petrochemical prices correlation. A sudden
surge/drop in crude prices culminating in a high/low oil price environment will
positively/negatively impact the earnings of petrochemical companies over the coming
quarters.
Global macroeconomic scenario: Demand for petrochemical products can be positively
correlated to global economic and industrial growth. Improved industrial activities in China
and a rise in demand from end markets (Europe/Asia) can result in an uptick in
petrochemical prices, positively impacting the bottom-lines of Saudi petrochemical
companies.
Rise in feedstock prices: Saudi petrochemical companies receive ethane feedstock at highly
subsidized rates. With gas paucity looming over the Kingdom over the past few years, the
government has been mulling revision in feedstock prices. Although this seems to be a rare
event in the global oil/gas supply glut environment, a potential rise in feedstock prices will
affect the earnings of Saudi producers and also dent their margins.
Saudi Basic Industries Corp Petrochemicals – Industrial SABIC AB: Saudi Arabia
25 May 2015
Rating OVERWEIGHT
Target price SAR125.5 (22.0% upside)
Current price SAR102.5
Disclosures Please refer to the important disclosures at the back of this report. Powered by EFA Platform 10
Key themes & implications
SABIC has been battling low product prices, which have been affected by downcast crude prices. We believe this to be a strong near-term headwind, which will impact the company’s earnings and margins. However, a large project pipeline, impending shale gas investments and transformation of its Europe facility should boost earnings and margins over the medium term. Meanwhile, opening up of the Saudi stock market will act a catalyst and help in valuation expansion.
Share information
Market cap (SAR/US$) 308.6bn / 82.28bn
52-week range 72.52 - 135.5
Daily avg. volume (US$) 128mn
Shares outstanding 3,000mn
Free float (est.) 21%
Performance 1M 3M 12M
Absolute 17.5% 8.2% -13.5%
Relative to index 10.6% 4.7% -11.5%
Major Shareholder:
Public Investments Funds (PIF) 70.0%
GOSI 5.6%
Valuation
12-13A 12-14A 12-15E 12-16E
P/E (x) 12.2 13.2 18.1 16.1
P/B (x) 2.0 1.9 1.9 1.8
EV/EBITDA (x) 7.0 7.2 8.3 7.7
Dividend Yield 4.9% 5.3% 4.9% 4.9% Source: Company data, Al Rajhi Capital
Performance
72.0
76.4
80.8
85.1
89.5
93.9
98.3
102.6
107.0
66
76
86
96
106
116
126
136
146
Price Close Relative to TADAWUL FF (RHS)
-10
30
70
05/14 08/14 11/14 02/15
RS
I10
Source: Bloomberg, Company data, Al Rajhi Capital
Company summary
Established in 1976, SABIC is the largest listed company in the GCC region. The company is 70% owned by the Saudi government, providing it a solid financial and regulatory backing. SABIC has grown from producing 6mtpa of petrochemicals in the 1980s to over 60mtpa currently, and accounts for over 80% of Saudi Arabia’s petrochemical output.
SABIC Long-term value play SABIC is among the top petrochemical companies worldwide and is the largest
and most stable enterprise in the GCC region. The company has been reeling
under pressure over the past couple of quarters on account of a steep drop in
product prices and a demand sluggishness in its key markets. Further, heavy
dependence on the fixed-price ethane feedstock has dented its margins. Despite
these near-term issues, we believe SABIC is a value play over the long-term as
the company is working on trimming down feedstock costs by employing shale
gas feedstock at its European operations. Further, the opening up of the Saudi
market is expected to be a key driver for SABIC’s valuations as investors will
seek to take position in a operationally healthy, government supported mature
company. Additionally, the company’s robust balance sheet allows it to make
value-boosting investments/acquisitions. Also, SABIC’s dividend yield of ~5%
remains attractive among dividend-seeking investors. We continue with our
Overweight rating on stock and revise target price to SAR125.5 a share (earlier
SAR106.1).
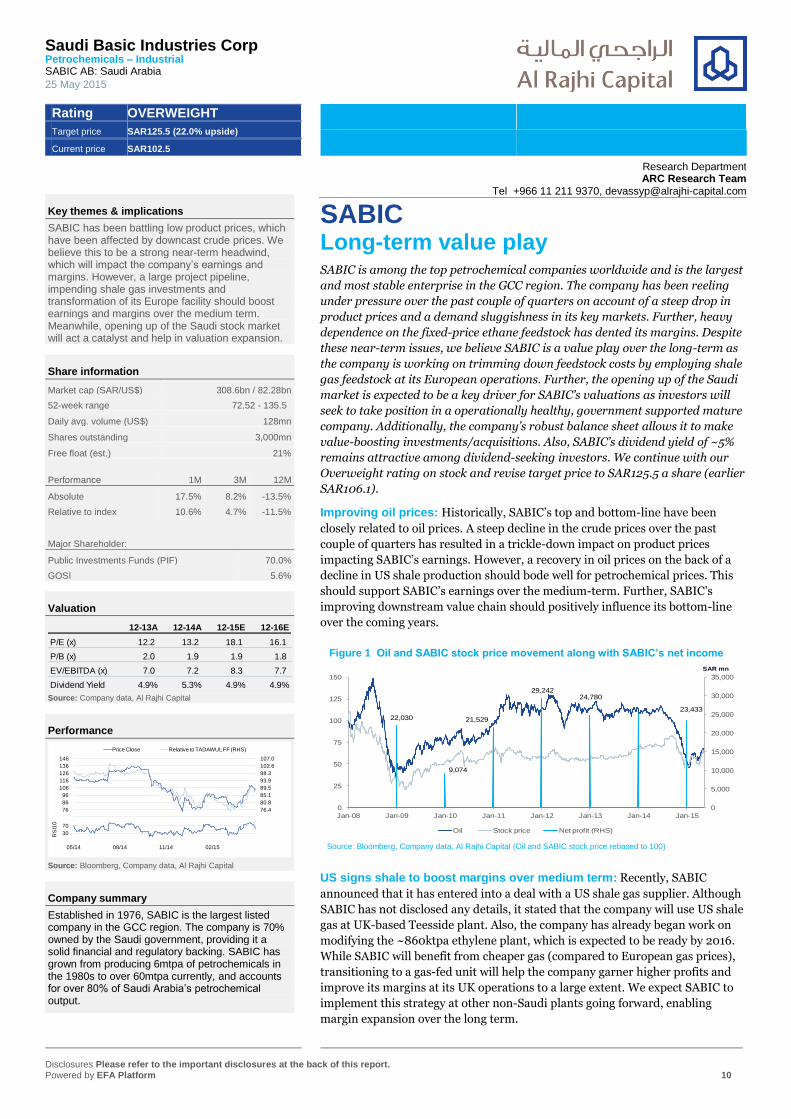
Improving oil prices: Historically, SABIC’s top and bottom-line have been
closely related to oil prices. A steep decline in the crude prices over the past
couple of quarters has resulted in a trickle-down impact on product prices
impacting SABIC’s earnings. However, a recovery in oil prices on the back of a
decline in US shale production should bode well for petrochemical prices. This
should support SABIC’s earnings over the medium-term. Further, SABIC’s
improving downstream value chain should positively influence its bottom-line
over the coming years.
Figure 1 Oil and SABIC stock price movement along with SABIC’s net income
0
5,000
10,000
15,000
20,000
25,000
30,000
35,000
0
25
50
75
100
125
150
Jan-08 Jan-09 Jan-10 Jan-11 Jan-12 Jan-13 Jan-14 Jan-15
SAR mn
Oil Stock price Net profit (RHS)
22,030
9,074
21,529
29,24224,780
23,433
Source: Bloomberg, Company data, Al Rajhi Capital (Oil and SABIC stock price rebased to 100)
US signs shale to boost margins over medium term: Recently, SABIC
announced that it has entered into a deal with a US shale gas supplier. Although
SABIC has not disclosed any details, it stated that the company will use US shale
gas at UK-based Teesside plant. Also, the company has already began work on
modifying the ~860ktpa ethylene plant, which is expected to be ready by 2016.
While SABIC will benefit from cheaper gas (compared to European gas prices),
transitioning to a gas-fed unit will help the company garner higher profits and
improve its margins at its UK operations to a large extent. We expect SABIC to
implement this strategy at other non-Saudi plants going forward, enabling
margin expansion over the long term.
Research Department ARC Research Team
Tel +966 11 211 9370, [email protected]
SABIC Petrochemicals – Industrial 25 May 2015
Disclosures Please refer to the important disclosures at the back of this report. 11
SABIC to attract foreign investments: SABIC – Saudi Arabia’s largest company by market
cap and revenues – receives strong support from the government. The company’s widespread
geographic footprint, healthy operations, diverse product portfolio and robust balance sheet
are expected to draw investors, once the Saudi stock market opens its doors to qualified
foreign investors in June 2015. We believe opening up of Tadawul to foreign direct
investment would be a key catalyst for SABIC’s valuation expansion.
Healthy yield for dividend-seeking investors: SABIC’s strong coffers (cash of ~SAR80bn
as of Q1 2015) cushions the blow of any uncertain intermittent performance and enables it to
pay dividends on a regular basis. The company paid dividends of SAR5 a share in both
FY2012 and FY2013 (payout: ~60%), and increased DPS to SAR5.5 in FY2014 (payout:
~70%). However, we expect SABIC to decrease DPS to SAR5 in 2015 (payout: ~90%) on
account of lower earnings y-o-y due to weak petrochemical prices and sluggish demand. This
translates to a healthy dividend yield of 4.9% at current prices.
Valuation: SABIC’s currently trades at a forward P/E of 18.1x, in line with that of the MSCI
World Chemical Index (17.8x) and S&P500 Chemical Index (17.9x) . However, given the
project the company’s investment plans, project pipeline and the opening up of the market,
we believe the company is a long-term value play despite near-term headwinds. Using the
blended methodology of weighted average of DCF and Relative Valuation, we arrive at a
target price of SAR125.5 a share. Given the upside, we have an Overweight rating on the
company.
Risks
1. SABIC’s performance depends significantly on petrochemical product prices, which in turn
depend on crude prices. A sudden surge/decline in oil prices will impact product prices
resulting in higher/lower-than expected earnings.
2. In a bid to expand inorganically, SABIC may make high-cost acquisitions, which could
dilute its EPS.

SABIC Petrochemicals – Industrial 25 May 2015
Disclosures Please refer to the important disclosures at the back of this report. 12
Income Statement (SARmn) 12-12A 12-13A 12-14A 12-15E 12-16E
Revenue 189,026 189,038 188,899 156,535 170,078
Cost of Goods Sold (134,701) (133,729) (136,375) (113,096) (122,456)
Gross Profit 54,325 55,310 52,524 43,438 47,622
Government Charges
S.G. & A. Costs (13,390) (12,719) (13,615) (10,957) (11,905)
Operating EBIT 40,935 42,591 38,909 32,481 35,716
Cash Operating Costs (134,677) (132,416) (135,213) (109,005) (119,540)
EBITDA 54,348 56,622 53,686 47,530 50,538
Depreciation and Amortisation (13,413) (14,031) (14,777) (15,049) (14,822)
Operating Profit 40,935 42,591 38,909 32,481 35,716
Net financing income/(costs) (113) (200) 540 531 461
Forex and Related Gains
Provisions - - - - -
Other Income
Other Expenses - - - - -
Net Profit Before Taxes 40,822 42,391 39,449 33,012 36,177
Taxes (2,500) (2,300) (2,100) (1,750) (1,917)
Minority Interests (13,542) (14,863) (13,915) (14,205) (15,101)
Net profit available to shareholders 24,780 25,228 23,433 17,057 19,159
Dividends (15,000) (15,000) (16,500) (15,000) (14,996)
Transfer to Capital Reserve
12-12A 12-13A 12-14A 12-15E 12-16E
Adjusted Shares Out (mn) 3,000 3,000 3,000 3,000 3,000
CFPS (SAR) 17.24 18.04 17.38 15.44 16.36
EPS (SAR) 8.26 8.41 7.81 5.69 6.39
DPS (SAR) 5.00 5.00 5.50 5.00 5.00
Growth 12-12A 12-13A 12-14A 12-15E 12-16E
Revenue Growth -0.5% 0.0% -0.1% -17.1% 8.7%
Gross Profit Growth -12.6% 1.8% -5.0% -17.3% 9.6%
EBITDA Growth -10.4% 4.2% -5.2% -11.5% 6.3%
Operating Profit Growth -16.2% 4.0% -8.6% -16.5% 10.0%
Net Profit Growth -15.3% 1.8% -7.1% -27.2% 12.3%
EPS Growth -15.3% 1.8% -7.1% -27.2% 12.3%
Margins 12-12A 12-13A 12-14A 12-15E 12-16E
Gross profit margin 28.7% 29.3% 27.8% 27.8% 28.0%
EBITDA margin 28.8% 30.0% 28.4% 30.4% 29.7%
Operating Margin 21.7% 22.5% 20.6% 20.8% 21.0%
Pretax profit margin 21.6% 22.4% 20.9% 21.1% 21.3%
Net profit margin 13.1% 13.3% 12.4% 10.9% 11.3%
Other Ratios 12-12A 12-13A 12-14A 12-15E 12-16E
ROCE 14.1% 14.4% 13.1% 10.7% 11.6%
ROIC 16.5% 17.7% 17.8% 14.9% 15.6%
ROE 17.3% 16.6% 14.7% 10.4% 11.5%
Effective Tax Rate 6.1% 5.4% 5.3% 5.3% 5.3%
Capex/Sales 5.7% 6.2% 8.3% 8.0% 8.0%
Dividend Payout Ratio 60.5% 59.5% 70.4% 87.9% 78.3%
Valuation Measures 12-12A 12-13A 12-14A 12-15E 12-16E
P/E (x) 12.5 12.2 13.2 18.1 16.1
P/CF (x) 6.0 5.7 5.9 6.7 6.3
P/B (x) 2.1 2.0 1.9 1.9 1.8
EV/Sales (x) 2.3 2.1 2.0 2.5 2.3
EV/EBITDA (x) 8.0 7.0 7.2 8.3 7.7
EV/EBIT (x) 10.6 9.3 9.9 12.2 10.9
EV/IC (x) 1.9 1.9 1.9 1.8 1.8
Dividend Yield 4.9% 4.9% 5.3% 4.9% 4.9% Source: Company data, Al Rajhi Capital
SABIC Petrochemicals – Industrial 25 May 2015
Disclosures Please refer to the important disclosures at the back of this report. 13
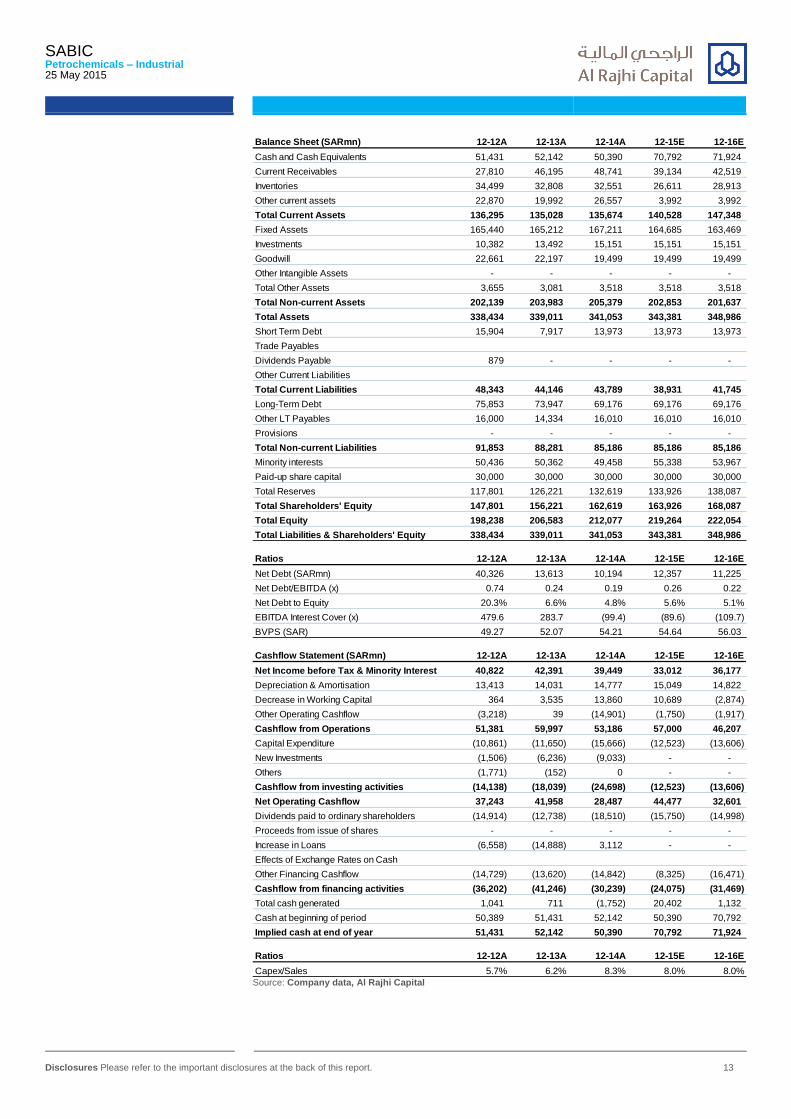
Balance Sheet (SARmn) 12-12A 12-13A 12-14A 12-15E 12-16E
Cash and Cash Equivalents 51,431 52,142 50,390 70,792 71,924
Current Receivables 27,810 46,195 48,741 39,134 42,519
Inventories 34,499 32,808 32,551 26,611 28,913
Other current assets 22,870 19,992 26,557 3,992 3,992
Total Current Assets 136,295 135,028 135,674 140,528 147,348
Fixed Assets 165,440 165,212 167,211 164,685 163,469
Investments 10,382 13,492 15,151 15,151 15,151
Goodwill 22,661 22,197 19,499 19,499 19,499
Other Intangible Assets - - - - -
Total Other Assets 3,655 3,081 3,518 3,518 3,518
Total Non-current Assets 202,139 203,983 205,379 202,853 201,637
Total Assets 338,434 339,011 341,053 343,381 348,986
Short Term Debt 15,904 7,917 13,973 13,973 13,973
Trade Payables
Dividends Payable 879 - - - -
Other Current Liabilities
Total Current Liabilities 48,343 44,146 43,789 38,931 41,745
Long-Term Debt 75,853 73,947 69,176 69,176 69,176
Other LT Payables 16,000 14,334 16,010 16,010 16,010
Provisions - - - - -
Total Non-current Liabilities 91,853 88,281 85,186 85,186 85,186
Minority interests 50,436 50,362 49,458 55,338 53,967
Paid-up share capital 30,000 30,000 30,000 30,000 30,000
Total Reserves 117,801 126,221 132,619 133,926 138,087
Total Shareholders' Equity 147,801 156,221 162,619 163,926 168,087
Total Equity 198,238 206,583 212,077 219,264 222,054
Total Liabilities & Shareholders' Equity 338,434 339,011 341,053 343,381 348,986
Ratios 12-12A 12-13A 12-14A 12-15E 12-16E
Net Debt (SARmn) 40,326 13,613 10,194 12,357 11,225
Net Debt/EBITDA (x) 0.74 0.24 0.19 0.26 0.22
Net Debt to Equity 20.3% 6.6% 4.8% 5.6% 5.1%
EBITDA Interest Cover (x) 479.6 283.7 (99.4) (89.6) (109.7)
BVPS (SAR) 49.27 52.07 54.21 54.64 56.03
Cashflow Statement (SARmn) 12-12A 12-13A 12-14A 12-15E 12-16E
Net Income before Tax & Minority Interest 40,822 42,391 39,449 33,012 36,177
Depreciation & Amortisation 13,413 14,031 14,777 15,049 14,822
Decrease in Working Capital 364 3,535 13,860 10,689 (2,874)
Other Operating Cashflow (3,218) 39 (14,901) (1,750) (1,917)
Cashflow from Operations 51,381 59,997 53,186 57,000 46,207
Capital Expenditure (10,861) (11,650) (15,666) (12,523) (13,606)
New Investments (1,506) (6,236) (9,033) - -
Others (1,771) (152) 0 - -
Cashflow from investing activities (14,138) (18,039) (24,698) (12,523) (13,606)
Net Operating Cashflow 37,243 41,958 28,487 44,477 32,601
Dividends paid to ordinary shareholders (14,914) (12,738) (18,510) (15,750) (14,998)
Proceeds from issue of shares - - - - -
Increase in Loans (6,558) (14,888) 3,112 - -
Effects of Exchange Rates on Cash
Other Financing Cashflow (14,729) (13,620) (14,842) (8,325) (16,471)
Cashflow from financing activities (36,202) (41,246) (30,239) (24,075) (31,469)
Total cash generated 1,041 711 (1,752) 20,402 1,132
Cash at beginning of period 50,389 51,431 52,142 50,390 70,792
Implied cash at end of year 51,431 52,142 50,390 70,792 71,924
Ratios 12-12A 12-13A 12-14A 12-15E 12-16E
Capex/Sales 5.7% 6.2% 8.3% 8.0% 8.0% Source: Company data, Al Rajhi Capital
SAFCO Petrochemicals – Industrial SAFCO AB: Saudi Arabia
25 May 2015
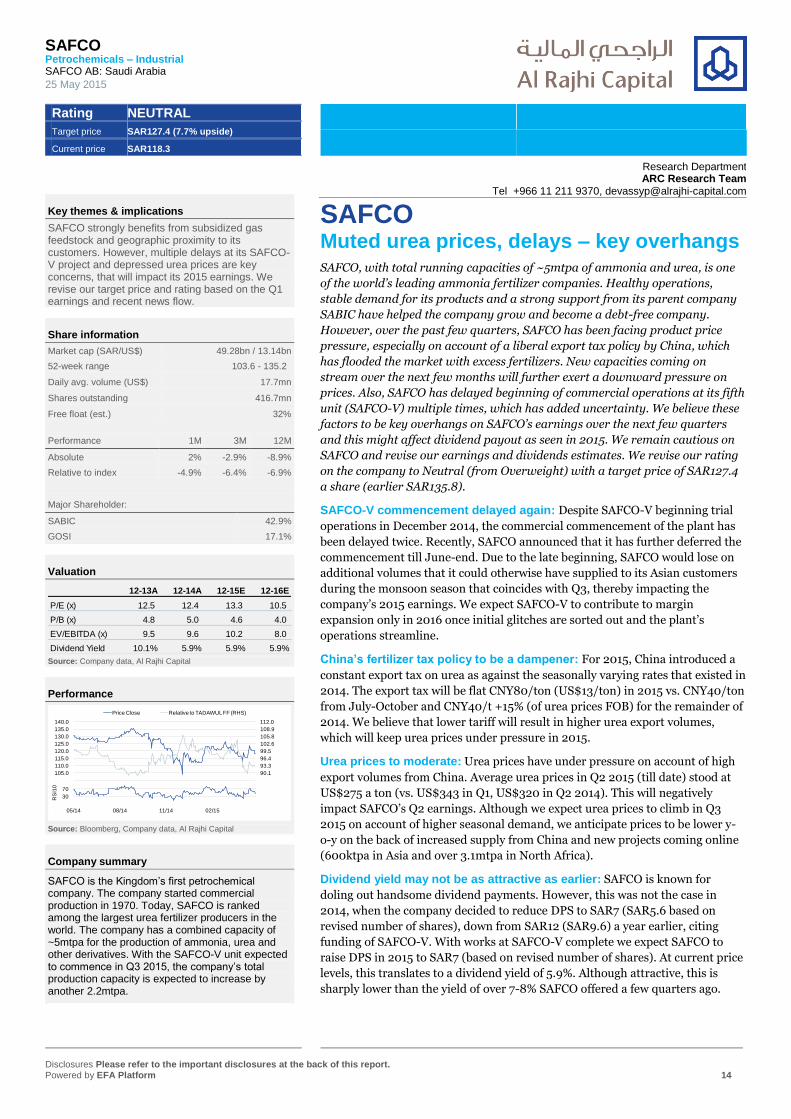
Rating NEUTRAL
Target price SAR127.4 (7.7% upside)
Current price SAR118.3
Disclosures Please refer to the important disclosures at the back of this report. Powered by EFA Platform 14
Key themes & implications
SAFCO strongly benefits from subsidized gas feedstock and geographic proximity to its customers. However, multiple delays at its SAFCO-V project and depressed urea prices are key concerns, that will impact its 2015 earnings. We revise our target price and rating based on the Q1 earnings and recent news flow.
Share information
Market cap (SAR/US$) 49.28bn / 13.14bn
52-week range 103.6 - 135.2
Daily avg. volume (US$) 17.7mn
Shares outstanding 416.7mn
Free float (est.) 32%
Performance 1M 3M 12M
Absolute 2% -2.9% -8.9%
Relative to index -4.9% -6.4% -6.9%
Major Shareholder:
SABIC 42.9%
GOSI 17.1%
Valuation
12-13A 12-14A 12-15E 12-16E
P/E (x) 12.5 12.4 13.3 10.5
P/B (x) 4.8 5.0 4.6 4.0
EV/EBITDA (x) 9.5 9.6 10.2 8.0
Dividend Yield 10.1% 5.9% 5.9% 5.9% Source: Company data, Al Rajhi Capital
Performance
87.0
90.1
93.3
96.4
99.5
102.6
105.8
108.9
112.0
100.0
105.0
110.0
115.0
120.0
125.0
130.0
135.0
140.0
Price Close Relative to TADAWUL FF (RHS)
-10
30
70
05/14 08/14 11/14 02/15
RS
I10
Source: Bloomberg, Company data, Al Rajhi Capital
Company summary
SAFCO is the Kingdom’s first petrochemical company. The company started commercial production in 1970. Today, SAFCO is ranked among the largest urea fertilizer producers in the world. The company has a combined capacity of ~5mtpa for the production of ammonia, urea and other derivatives. With the SAFCO-V unit expected to commence in Q3 2015, the company’s total production capacity is expected to increase by another 2.2mtpa.
SAFCO Muted urea prices, delays – key overhangs SAFCO, with total running capacities of ~5mtpa of ammonia and urea, is one
of the world’s leading ammonia fertilizer companies. Healthy operations,
stable demand for its products and a strong support from its parent company
SABIC have helped the company grow and become a debt-free company.
However, over the past few quarters, SAFCO has been facing product price
pressure, especially on account of a liberal export tax policy by China, which
has flooded the market with excess fertilizers. New capacities coming on
stream over the next few months will further exert a downward pressure on
prices. Also, SAFCO has delayed beginning of commercial operations at its fifth
unit (SAFCO-V) multiple times, which has added uncertainty. We believe these
factors to be key overhangs on SAFCO’s earnings over the next few quarters
and this might affect dividend payout as seen in 2015. We remain cautious on
SAFCO and revise our earnings and dividends estimates. We revise our rating
on the company to Neutral (from Overweight) with a target price of SAR127.4
a share (earlier SAR135.8).
SAFCO-V commencement delayed again: Despite SAFCO-V beginning trial
operations in December 2014, the commercial commencement of the plant has
been delayed twice. Recently, SAFCO announced that it has further deferred the
commencement till June-end. Due to the late beginning, SAFCO would lose on
additional volumes that it could otherwise have supplied to its Asian customers
during the monsoon season that coincides with Q3, thereby impacting the
company’s 2015 earnings. We expect SAFCO-V to contribute to margin
expansion only in 2016 once initial glitches are sorted out and the plant’s
operations streamline.
China’s fertilizer tax policy to be a dampener: For 2015, China introduced a
constant export tax on urea as against the seasonally varying rates that existed in
2014. The export tax will be flat CNY80/ton (US$13/ton) in 2015 vs. CNY40/ton
from July-October and CNY40/t +15% (of urea prices FOB) for the remainder of
2014. We believe that lower tariff will result in higher urea export volumes,
which will keep urea prices under pressure in 2015.
Urea prices to moderate: Urea prices have under pressure on account of high
export volumes from China. Average urea prices in Q2 2015 (till date) stood at
US$275 a ton (vs. US$343 in Q1, US$320 in Q2 2014). This will negatively
impact SAFCO’s Q2 earnings. Although we expect urea prices to climb in Q3
2015 on account of higher seasonal demand, we anticipate prices to be lower y-
o-y on the back of increased supply from China and new projects coming online
(600ktpa in Asia and over 3.1mtpa in North Africa).
Dividend yield may not be as attractive as earlier: SAFCO is known for
doling out handsome dividend payments. However, this was not the case in
2014, when the company decided to reduce DPS to SAR7 (SAR5.6 based on
revised number of shares), down from SAR12 (SAR9.6) a year earlier, citing
funding of SAFCO-V. With works at SAFCO-V complete we expect SAFCO to
raise DPS in 2015 to SAR7 (based on revised number of shares). At current price
levels, this translates to a dividend yield of 5.9%. Although attractive, this is
sharply lower than the yield of over 7-8% SAFCO offered a few quarters ago.
Research Department ARC Research Team
Tel +966 11 211 9370, [email protected]

SAFCO Petrochemicals – Industrial 25 May 2015
Disclosures Please refer to the important disclosures at the back of this report. 15
Valuation: Using blended methodology of weighted average of DCF and Relative Valuation,
we arrive at a target price of SAR127.4 vs. earlier SAR135.8 a share (based on revised number
of shares). With limited upside potential, we revise our rating to Neutral (earlier Overweight).
Risks
1. An unexpectedly higher/lower supply from China could create a supply glut/erode supply
in the market strongly influence urea prices, impacting earnings.
2. A change in monsoon pattern can affect urea demand and hurt SAFCO’s bottom-line.
SAFCO Petrochemicals – Industrial 25 May 2015
Disclosures Please refer to the important disclosures at the back of this report. 16
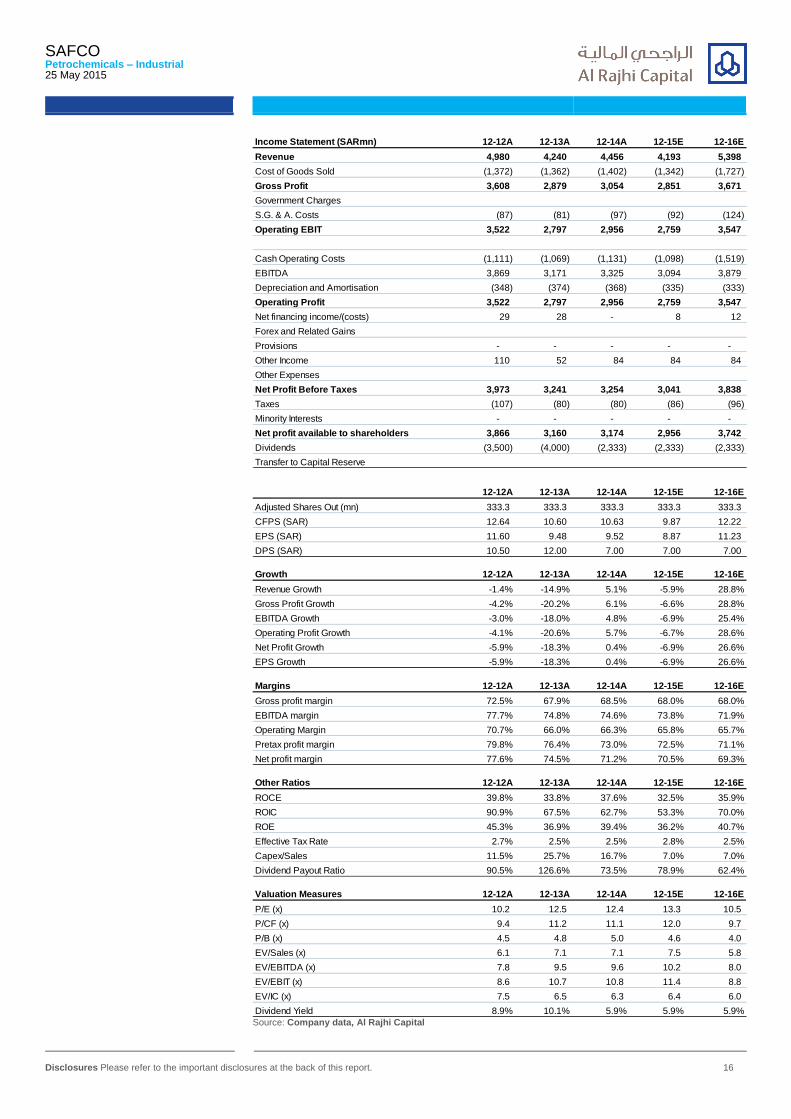
Income Statement (SARmn) 12-12A 12-13A 12-14A 12-15E 12-16E
Revenue 4,980 4,240 4,456 4,193 5,398
Cost of Goods Sold (1,372) (1,362) (1,402) (1,342) (1,727)
Gross Profit 3,608 2,879 3,054 2,851 3,671
Government Charges
S.G. & A. Costs (87) (81) (97) (92) (124)
Operating EBIT 3,522 2,797 2,956 2,759 3,547
Cash Operating Costs (1,111) (1,069) (1,131) (1,098) (1,519)
EBITDA 3,869 3,171 3,325 3,094 3,879
Depreciation and Amortisation (348) (374) (368) (335) (333)
Operating Profit 3,522 2,797 2,956 2,759 3,547
Net financing income/(costs) 29 28 - 8 12
Forex and Related Gains
Provisions - - - - -
Other Income 110 52 84 84 84
Other Expenses
Net Profit Before Taxes 3,973 3,241 3,254 3,041 3,838
Taxes (107) (80) (80) (86) (96)
Minority Interests - - - - -
Net profit available to shareholders 3,866 3,160 3,174 2,956 3,742
Dividends (3,500) (4,000) (2,333) (2,333) (2,333)
Transfer to Capital Reserve
12-12A 12-13A 12-14A 12-15E 12-16E
Adjusted Shares Out (mn) 333.3 333.3 333.3 333.3 333.3
CFPS (SAR) 12.64 10.60 10.63 9.87 12.22
EPS (SAR) 11.60 9.48 9.52 8.87 11.23
DPS (SAR) 10.50 12.00 7.00 7.00 7.00
Growth 12-12A 12-13A 12-14A 12-15E 12-16E
Revenue Growth -1.4% -14.9% 5.1% -5.9% 28.8%
Gross Profit Growth -4.2% -20.2% 6.1% -6.6% 28.8%
EBITDA Growth -3.0% -18.0% 4.8% -6.9% 25.4%
Operating Profit Growth -4.1% -20.6% 5.7% -6.7% 28.6%
Net Profit Growth -5.9% -18.3% 0.4% -6.9% 26.6%
EPS Growth -5.9% -18.3% 0.4% -6.9% 26.6%
Margins 12-12A 12-13A 12-14A 12-15E 12-16E
Gross profit margin 72.5% 67.9% 68.5% 68.0% 68.0%
EBITDA margin 77.7% 74.8% 74.6% 73.8% 71.9%
Operating Margin 70.7% 66.0% 66.3% 65.8% 65.7%
Pretax profit margin 79.8% 76.4% 73.0% 72.5% 71.1%
Net profit margin 77.6% 74.5% 71.2% 70.5% 69.3%
Other Ratios 12-12A 12-13A 12-14A 12-15E 12-16E
ROCE 39.8% 33.8% 37.6% 32.5% 35.9%
ROIC 90.9% 67.5% 62.7% 53.3% 70.0%
ROE 45.3% 36.9% 39.4% 36.2% 40.7%
Effective Tax Rate 2.7% 2.5% 2.5% 2.8% 2.5%
Capex/Sales 11.5% 25.7% 16.7% 7.0% 7.0%
Dividend Payout Ratio 90.5% 126.6% 73.5% 78.9% 62.4%
Valuation Measures 12-12A 12-13A 12-14A 12-15E 12-16E
P/E (x) 10.2 12.5 12.4 13.3 10.5
P/CF (x) 9.4 11.2 11.1 12.0 9.7
P/B (x) 4.5 4.8 5.0 4.6 4.0
EV/Sales (x) 6.1 7.1 7.1 7.5 5.8
EV/EBITDA (x) 7.8 9.5 9.6 10.2 8.0
EV/EBIT (x) 8.6 10.7 10.8 11.4 8.8
EV/IC (x) 7.5 6.5 6.3 6.4 6.0
Dividend Yield 8.9% 10.1% 5.9% 5.9% 5.9% Source: Company data, Al Rajhi Capital

SAFCO Petrochemicals – Industrial 25 May 2015
Disclosures Please refer to the important disclosures at the back of this report. 17
Balance Sheet (SARmn) 12-12A 12-13A 12-14A 12-15E 12-16E
Cash and Cash Equivalents 3,594 2,140 1,640 2,350 3,472
Current Receivables 843 876 744 671 864
Inventories 423 342 387 377 486
Other current assets 232 10 10 10 10
Total Current Assets 5,092 3,368 2,781 3,408 4,832
Fixed Assets 3,500 4,320 4,792 4,750 4,796
Investments 1,263 1,528 1,193 1,193 1,193
Goodwill 144 217 127 127 127
Other Intangible Assets - - - - -
Total Other Assets 33 26 31 31 31
Total Non-current Assets 4,940 6,092 6,143 6,101 6,147
Total Assets 10,032 9,460 8,925 9,510 10,979
Short Term Debt 40 - - - -
Accounts Payable 523 431 247 210 270
Accrued Expenses - - - - -
Zakat Payable 131 257 263 263 263
Dividends Payable - - - - -
Other Current Liabilities - - - - -
Total Current Liabilities 693 688 510 473 533
Long-Term Debt - - - - -
Other LT Payables - - - - -
Provisions 482 503 553 553 553
Total Non-current Liabilities 482 503 553 553 553
Minority interests - - - - -
Paid-up share capital 3,333 3,333 3,333 3,333 3,333
Total Reserves 5,524 4,935 4,528 5,151 6,559
Total Shareholders' Equity 8,857 8,269 7,862 8,484 9,893
Total Equity 8,857 8,269 7,862 8,484 9,893
Total Liabilities & Shareholders' Equity 10,032 9,460 8,925 9,510 10,979
Ratios 12-12A 12-13A 12-14A 12-15E 12-16E
Net Debt (SARmn) (3,554) (2,140) (1,640) (2,350) (3,472)
Net Debt/EBITDA (x) (0.92) (0.67) (0.49) (0.76) (0.90)
Net Debt to Equity -40.1% -25.9% -20.9% -27.7% -35.1%
EBITDA Interest Cover (x) (132.0) (114.2) (377.3) (330.2)
BVPS (SAR) 26.57 24.81 23.59 25.45 29.68
Cashflow Statement (SARmn) 12-12A 12-13A 12-14A 12-15E 12-16E
Net Income before Tax & Minority Interest 3,973 3,241 3,254 3,041 3,838
Depreciation & Amortisation 348 374 368 335 333
Decrease in Working Capital 156 (171) (366) 45 (241)
Other Operating Cashflow (506) (0) - (86) (97)
Cashflow from Operations 3,971 3,444 3,257 3,336 3,832
Capital Expenditure (573) (1,090) (746) (293) (378)
New Investments - - - - -
Others 287 207 303 - -
Cashflow from investing activities (287) (883) (443) (293) (378)
Net Operating Cashflow 3,684 2,561 2,814 3,043 3,454
Dividends paid to ordinary shareholders (3,370) (3,975) (3,313) (2,333) (2,333)
Proceeds from issue of shares - - - - -
Increase in Loans - (40) - - -
Effects of Exchange Rates on Cash
Other Financing Cashflow - - - - -
Cashflow from financing activities (3,370) (4,015) (3,313) (2,333) (2,333)
Total cash generated 314 (1,454) (500) 710 1,121
Cash at beginning of period 3,280 3,594 2,140 1,640 2,350
Implied cash at end of year 3,594 2,140 1,640 2,350 3,471
Ratios 12-12A 12-13A 12-14A 12-15E 12-16E
Capex/Sales 11.5% 25.7% 16.7% 7.0% 7.0% Source: Company data, Al Rajhi Capital
Sipchem Petrochemicals – Industrial SIPCHEM AB: Saudi Arabia
25 May 2015
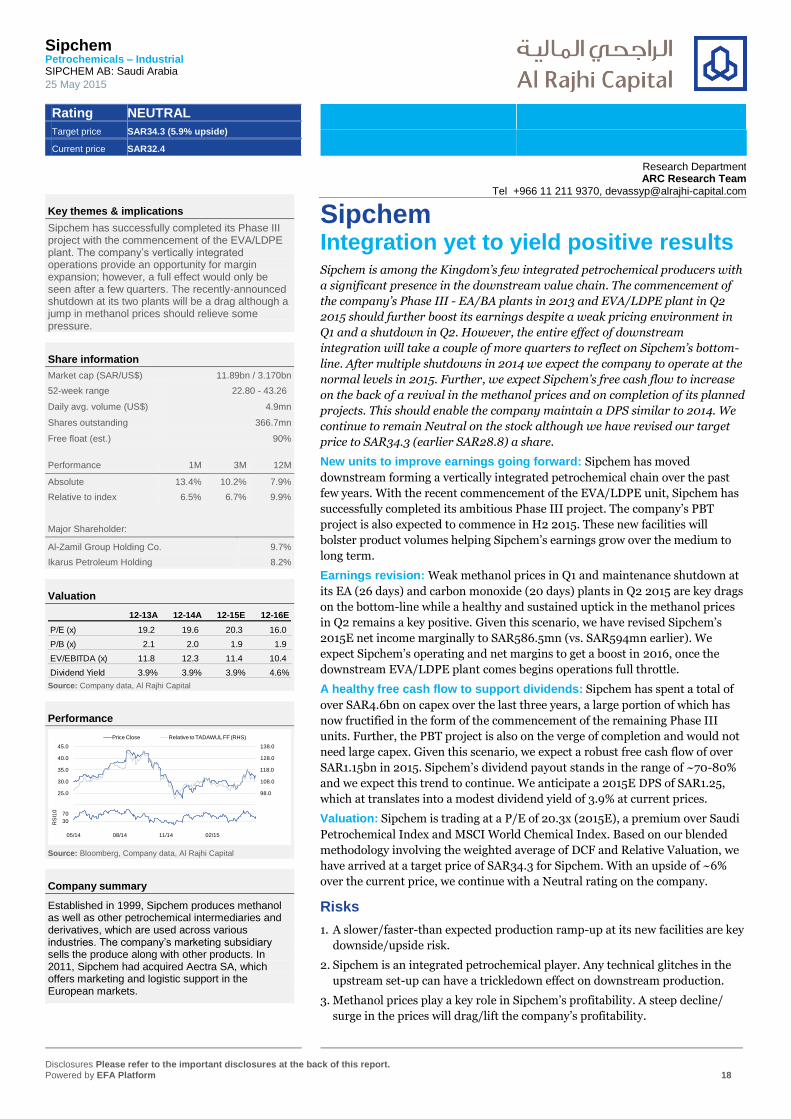
Rating NEUTRAL
Target price SAR34.3 (5.9% upside)
Current price SAR32.4
Disclosures Please refer to the important disclosures at the back of this report. Powered by EFA Platform 18
Key themes & implications
Sipchem has successfully completed its Phase III project with the commencement of the EVA/LDPE plant. The company’s vertically integrated operations provide an opportunity for margin expansion; however, a full effect would only be seen after a few quarters. The recently-announced shutdown at its two plants will be a drag although a jump in methanol prices should relieve some pressure.
Share information
Market cap (SAR/US$) 11.89bn / 3.170bn
52-week range 22.80 - 43.26
Daily avg. volume (US$) 4.9mn
Shares outstanding 366.7mn
Free float (est.) 90%
Performance 1M 3M 12M
Absolute 13.4% 10.2% 7.9%
Relative to index 6.5% 6.7% 9.9%
Major Shareholder:
Al-Zamil Group Holding Co. 9.7%
Ikarus Petroleum Holding 8.2%
Valuation
12-13A 12-14A 12-15E 12-16E
P/E (x) 19.2 19.6 20.3 16.0
P/B (x) 2.1 2.0 1.9 1.9
EV/EBITDA (x) 11.8 12.3 11.4 10.4
Dividend Yield 3.9% 3.9% 3.9% 4.6% Source: Company data, Al Rajhi Capital
Performance
88.0
98.0
108.0
118.0
128.0
138.0
20.0
25.0
30.0
35.0
40.0
45.0
Price Close Relative to TADAWUL FF (RHS)
-10
30
70
05/14 08/14 11/14 02/15
RS
I10
Source: Bloomberg, Company data, Al Rajhi Capital
Company summary
Established in 1999, Sipchem produces methanol as well as other petrochemical intermediaries and derivatives, which are used across various industries. The company’s marketing subsidiary sells the produce along with other products. In 2011, Sipchem had acquired Aectra SA, which offers marketing and logistic support in the European markets.
Sipchem Integration yet to yield positive results Sipchem is among the Kingdom’s few integrated petrochemical producers with
a significant presence in the downstream value chain. The commencement of
the company’s Phase III - EA/BA plants in 2013 and EVA/LDPE plant in Q2
2015 should further boost its earnings despite a weak pricing environment in
Q1 and a shutdown in Q2. However, the entire effect of downstream
integration will take a couple of more quarters to reflect on Sipchem’s bottom-
line. After multiple shutdowns in 2014 we expect the company to operate at the
normal levels in 2015. Further, we expect Sipchem’s free cash flow to increase
on the back of a revival in the methanol prices and on completion of its planned
projects. This should enable the company maintain a DPS similar to 2014. We
continue to remain Neutral on the stock although we have revised our target
price to SAR34.3 (earlier SAR28.8) a share.
New units to improve earnings going forward: Sipchem has moved
downstream forming a vertically integrated petrochemical chain over the past
few years. With the recent commencement of the EVA/LDPE unit, Sipchem has
successfully completed its ambitious Phase III project. The company’s PBT
project is also expected to commence in H2 2015. These new facilities will
bolster product volumes helping Sipchem’s earnings grow over the medium to
long term.
Earnings revision: Weak methanol prices in Q1 and maintenance shutdown at
its EA (26 days) and carbon monoxide (20 days) plants in Q2 2015 are key drags
on the bottom-line while a healthy and sustained uptick in the methanol prices
in Q2 remains a key positive. Given this scenario, we have revised Sipchem’s
2015E net income marginally to SAR586.5mn (vs. SAR594mn earlier). We
expect Sipchem’s operating and net margins to get a boost in 2016, once the
downstream EVA/LDPE plant comes begins operations full throttle.
A healthy free cash flow to support dividends: Sipchem has spent a total of
over SAR4.6bn on capex over the last three years, a large portion of which has
now fructified in the form of the commencement of the remaining Phase III
units. Further, the PBT project is also on the verge of completion and would not
need large capex. Given this scenario, we expect a robust free cash flow of over
SAR1.15bn in 2015. Sipchem’s dividend payout stands in the range of ~70-80%
and we expect this trend to continue. We anticipate a 2015E DPS of SAR1.25,
which at translates into a modest dividend yield of 3.9% at current prices.
Valuation: Sipchem is trading at a P/E of 20.3x (2015E), a premium over Saudi
Petrochemical Index and MSCI World Chemical Index. Based on our blended
methodology involving the weighted average of DCF and Relative Valuation, we
have arrived at a target price of SAR34.3 for Sipchem. With an upside of ~6%
over the current price, we continue with a Neutral rating on the company.
Risks
1. A slower/faster-than expected production ramp-up at its new facilities are key
downside/upside risk.
2. Sipchem is an integrated petrochemical player. Any technical glitches in the
upstream set-up can have a trickledown effect on downstream production.
3. Methanol prices play a key role in Sipchem’s profitability. A steep decline/
surge in the prices will drag/lift the company’s profitability.
Research Department ARC Research Team
Tel +966 11 211 9370, [email protected]
Sipchem Petrochemicals – Industrial 25 May 2015
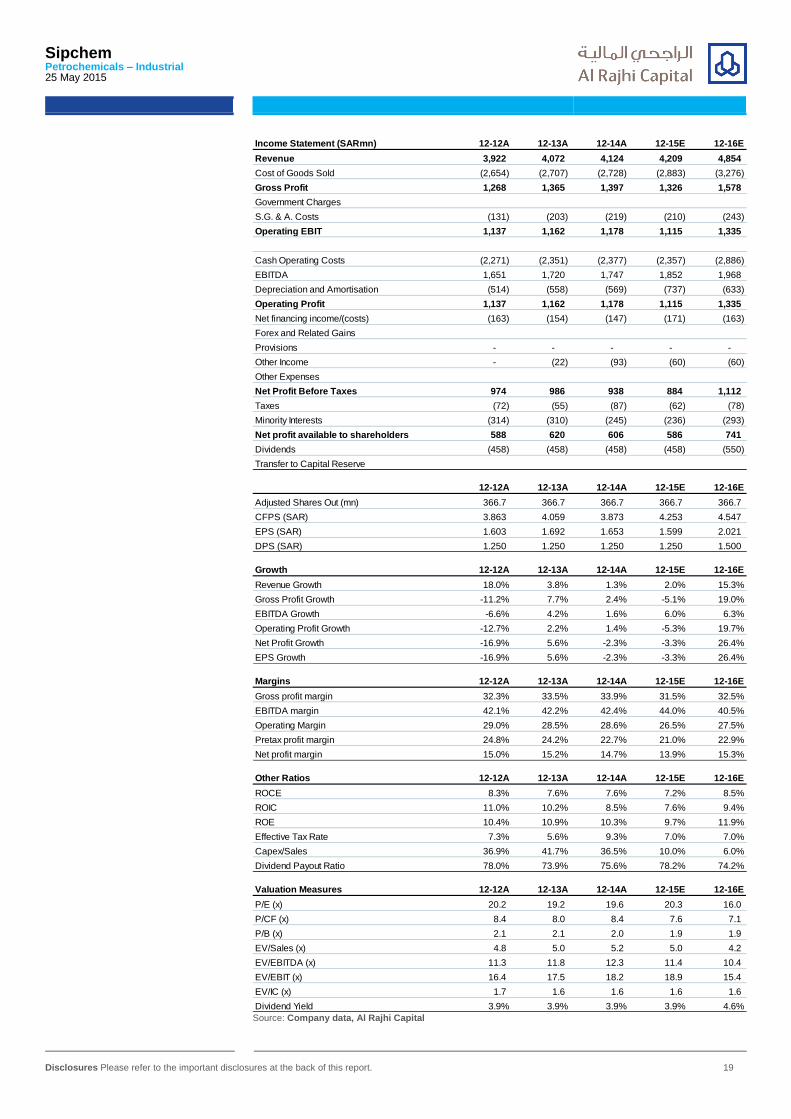
Disclosures Please refer to the important disclosures at the back of this report. 19
Income Statement (SARmn) 12-12A 12-13A 12-14A 12-15E 12-16E
Revenue 3,922 4,072 4,124 4,209 4,854
Cost of Goods Sold (2,654) (2,707) (2,728) (2,883) (3,276)
Gross Profit 1,268 1,365 1,397 1,326 1,578
Government Charges
S.G. & A. Costs (131) (203) (219) (210) (243)
Operating EBIT 1,137 1,162 1,178 1,115 1,335
Cash Operating Costs (2,271) (2,351) (2,377) (2,357) (2,886)
EBITDA 1,651 1,720 1,747 1,852 1,968
Depreciation and Amortisation (514) (558) (569) (737) (633)
Operating Profit 1,137 1,162 1,178 1,115 1,335
Net financing income/(costs) (163) (154) (147) (171) (163)
Forex and Related Gains
Provisions - - - - -
Other Income - (22) (93) (60) (60)
Other Expenses
Net Profit Before Taxes 974 986 938 884 1,112
Taxes (72) (55) (87) (62) (78)
Minority Interests (314) (310) (245) (236) (293)
Net profit available to shareholders 588 620 606 586 741
Dividends (458) (458) (458) (458) (550)
Transfer to Capital Reserve
12-12A 12-13A 12-14A 12-15E 12-16E
Adjusted Shares Out (mn) 366.7 366.7 366.7 366.7 366.7
CFPS (SAR) 3.863 4.059 3.873 4.253 4.547
EPS (SAR) 1.603 1.692 1.653 1.599 2.021
DPS (SAR) 1.250 1.250 1.250 1.250 1.500
Growth 12-12A 12-13A 12-14A 12-15E 12-16E
Revenue Growth 18.0% 3.8% 1.3% 2.0% 15.3%
Gross Profit Growth -11.2% 7.7% 2.4% -5.1% 19.0%
EBITDA Growth -6.6% 4.2% 1.6% 6.0% 6.3%
Operating Profit Growth -12.7% 2.2% 1.4% -5.3% 19.7%
Net Profit Growth -16.9% 5.6% -2.3% -3.3% 26.4%
EPS Growth -16.9% 5.6% -2.3% -3.3% 26.4%
Margins 12-12A 12-13A 12-14A 12-15E 12-16E
Gross profit margin 32.3% 33.5% 33.9% 31.5% 32.5%
EBITDA margin 42.1% 42.2% 42.4% 44.0% 40.5%
Operating Margin 29.0% 28.5% 28.6% 26.5% 27.5%
Pretax profit margin 24.8% 24.2% 22.7% 21.0% 22.9%
Net profit margin 15.0% 15.2% 14.7% 13.9% 15.3%
Other Ratios 12-12A 12-13A 12-14A 12-15E 12-16E
ROCE 8.3% 7.6% 7.6% 7.2% 8.5%
ROIC 11.0% 10.2% 8.5% 7.6% 9.4%
ROE 10.4% 10.9% 10.3% 9.7% 11.9%
Effective Tax Rate 7.3% 5.6% 9.3% 7.0% 7.0%
Capex/Sales 36.9% 41.7% 36.5% 10.0% 6.0%
Dividend Payout Ratio 78.0% 73.9% 75.6% 78.2% 74.2%
Valuation Measures 12-12A 12-13A 12-14A 12-15E 12-16E
P/E (x) 20.2 19.2 19.6 20.3 16.0
P/CF (x) 8.4 8.0 8.4 7.6 7.1
P/B (x) 2.1 2.1 2.0 1.9 1.9
EV/Sales (x) 4.8 5.0 5.2 5.0 4.2
EV/EBITDA (x) 11.3 11.8 12.3 11.4 10.4
EV/EBIT (x) 16.4 17.5 18.2 18.9 15.4
EV/IC (x) 1.7 1.6 1.6 1.6 1.6
Dividend Yield 3.9% 3.9% 3.9% 3.9% 4.6% Source: Company data, Al Rajhi Capital
Sipchem Petrochemicals – Industrial 25 May 2015
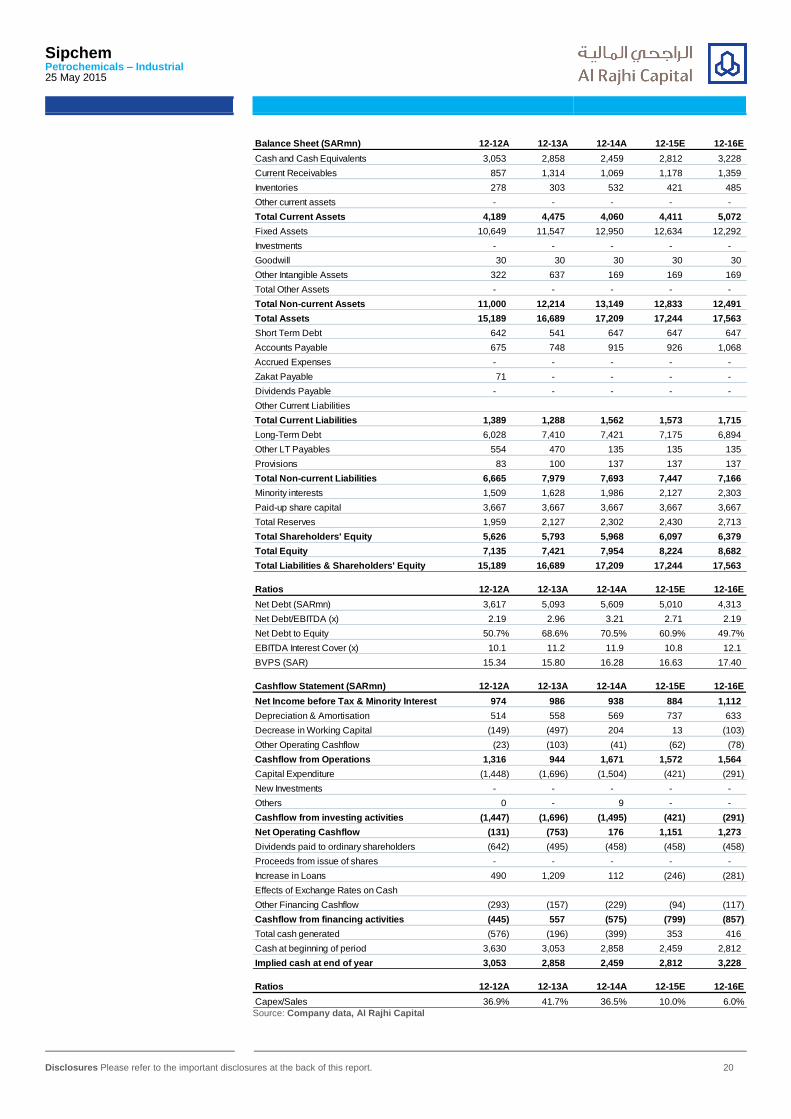
Disclosures Please refer to the important disclosures at the back of this report. 20
Balance Sheet (SARmn) 12-12A 12-13A 12-14A 12-15E 12-16E
Cash and Cash Equivalents 3,053 2,858 2,459 2,812 3,228
Current Receivables 857 1,314 1,069 1,178 1,359
Inventories 278 303 532 421 485
Other current assets - - - - -
Total Current Assets 4,189 4,475 4,060 4,411 5,072
Fixed Assets 10,649 11,547 12,950 12,634 12,292
Investments - - - - -
Goodwill 30 30 30 30 30
Other Intangible Assets 322 637 169 169 169
Total Other Assets - - - - -
Total Non-current Assets 11,000 12,214 13,149 12,833 12,491
Total Assets 15,189 16,689 17,209 17,244 17,563
Short Term Debt 642 541 647 647 647
Accounts Payable 675 748 915 926 1,068
Accrued Expenses - - - - -
Zakat Payable 71 - - - -
Dividends Payable - - - - -
Other Current Liabilities
Total Current Liabilities 1,389 1,288 1,562 1,573 1,715
Long-Term Debt 6,028 7,410 7,421 7,175 6,894
Other LT Payables 554 470 135 135 135
Provisions 83 100 137 137 137
Total Non-current Liabilities 6,665 7,979 7,693 7,447 7,166
Minority interests 1,509 1,628 1,986 2,127 2,303
Paid-up share capital 3,667 3,667 3,667 3,667 3,667
Total Reserves 1,959 2,127 2,302 2,430 2,713
Total Shareholders' Equity 5,626 5,793 5,968 6,097 6,379
Total Equity 7,135 7,421 7,954 8,224 8,682
Total Liabilities & Shareholders' Equity 15,189 16,689 17,209 17,244 17,563
Ratios 12-12A 12-13A 12-14A 12-15E 12-16E
Net Debt (SARmn) 3,617 5,093 5,609 5,010 4,313
Net Debt/EBITDA (x) 2.19 2.96 3.21 2.71 2.19
Net Debt to Equity 50.7% 68.6% 70.5% 60.9% 49.7%
EBITDA Interest Cover (x) 10.1 11.2 11.9 10.8 12.1
BVPS (SAR) 15.34 15.80 16.28 16.63 17.40
Cashflow Statement (SARmn) 12-12A 12-13A 12-14A 12-15E 12-16E
Net Income before Tax & Minority Interest 974 986 938 884 1,112
Depreciation & Amortisation 514 558 569 737 633
Decrease in Working Capital (149) (497) 204 13 (103)
Other Operating Cashflow (23) (103) (41) (62) (78)
Cashflow from Operations 1,316 944 1,671 1,572 1,564
Capital Expenditure (1,448) (1,696) (1,504) (421) (291)
New Investments - - - - -
Others 0 - 9 - -
Cashflow from investing activities (1,447) (1,696) (1,495) (421) (291)
Net Operating Cashflow (131) (753) 176 1,151 1,273
Dividends paid to ordinary shareholders (642) (495) (458) (458) (458)
Proceeds from issue of shares - - - - -
Increase in Loans 490 1,209 112 (246) (281)
Effects of Exchange Rates on Cash
Other Financing Cashflow (293) (157) (229) (94) (117)
Cashflow from financing activities (445) 557 (575) (799) (857)
Total cash generated (576) (196) (399) 353 416
Cash at beginning of period 3,630 3,053 2,858 2,459 2,812
Implied cash at end of year 3,053 2,858 2,459 2,812 3,228
Ratios 12-12A 12-13A 12-14A 12-15E 12-16E
Capex/Sales 36.9% 41.7% 36.5% 10.0% 6.0% Source: Company data, Al Rajhi Capital
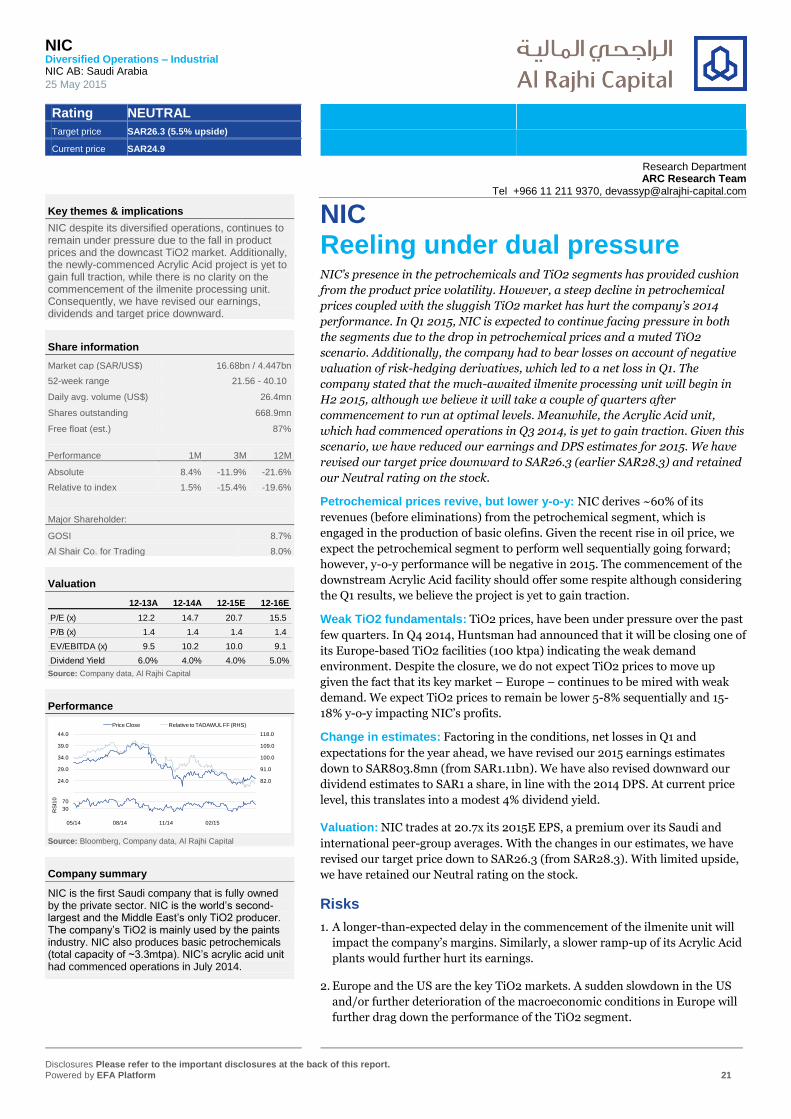
NIC Diversified Operations – Industrial NIC AB: Saudi Arabia
25 May 2015
Rating NEUTRAL
Target price SAR26.3 (5.5% upside)
Current price SAR24.9
Disclosures Please refer to the important disclosures at the back of this report. Powered by EFA Platform 21
Key themes & implications
NIC despite its diversified operations, continues to remain under pressure due to the fall in product prices and the downcast TiO2 market. Additionally, the newly-commenced Acrylic Acid project is yet to gain full traction, while there is no clarity on the commencement of the ilmenite processing unit. Consequently, we have revised our earnings, dividends and target price downward.
Share information
Market cap (SAR/US$) 16.68bn / 4.447bn
52-week range 21.56 - 40.10
Daily avg. volume (US$) 26.4mn
Shares outstanding 668.9mn
Free float (est.) 87%
Performance 1M 3M 12M
Absolute 8.4% -11.9% -21.6%
Relative to index 1.5% -15.4% -19.6%
Major Shareholder:
GOSI 8.7%
Al Shair Co. for Trading 8.0%
Valuation
12-13A 12-14A 12-15E 12-16E
P/E (x) 12.2 14.7 20.7 15.5
P/B (x) 1.4 1.4 1.4 1.4
EV/EBITDA (x) 9.5 10.2 10.0 9.1
Dividend Yield 6.0% 4.0% 4.0% 5.0% Source: Company data, Al Rajhi Capital
Performance
73.0
82.0
91.0
100.0
109.0
118.0
19.0
24.0
29.0
34.0
39.0
44.0
Price Close Relative to TADAWUL FF (RHS)
-10
30
70
05/14 08/14 11/14 02/15
RS
I10
Source: Bloomberg, Company data, Al Rajhi Capital
Company summary
NIC is the first Saudi company that is fully owned by the private sector. NIC is the world’s second-largest and the Middle East’s only TiO2 producer. The company’s TiO2 is mainly used by the paints industry. NIC also produces basic petrochemicals (total capacity of ~3.3mtpa). NIC’s acrylic acid unit had commenced operations in July 2014.
NIC Reeling under dual pressure NIC’s presence in the petrochemicals and TiO2 segments has provided cushion
from the product price volatility. However, a steep decline in petrochemical
prices coupled with the sluggish TiO2 market has hurt the company’s 2014
performance. In Q1 2015, NIC is expected to continue facing pressure in both
the segments due to the drop in petrochemical prices and a muted TiO2
scenario. Additionally, the company had to bear losses on account of negative
valuation of risk-hedging derivatives, which led to a net loss in Q1. The
company stated that the much-awaited ilmenite processing unit will begin in
H2 2015, although we believe it will take a couple of quarters after
commencement to run at optimal levels. Meanwhile, the Acrylic Acid unit,
which had commenced operations in Q3 2014, is yet to gain traction. Given this
scenario, we have reduced our earnings and DPS estimates for 2015. We have
revised our target price downward to SAR26.3 (earlier SAR28.3) and retained
our Neutral rating on the stock.
Petrochemical prices revive, but lower y-o-y: NIC derives ~60% of its
revenues (before eliminations) from the petrochemical segment, which is
engaged in the production of basic olefins. Given the recent rise in oil price, we
expect the petrochemical segment to perform well sequentially going forward;
however, y-o-y performance will be negative in 2015. The commencement of the
downstream Acrylic Acid facility should offer some respite although considering
the Q1 results, we believe the project is yet to gain traction.
Weak TiO2 fundamentals: TiO2 prices, have been under pressure over the past
few quarters. In Q4 2014, Huntsman had announced that it will be closing one of
its Europe-based TiO2 facilities (100 ktpa) indicating the weak demand
environment. Despite the closure, we do not expect TiO2 prices to move up
given the fact that its key market – Europe – continues to be mired with weak
demand. We expect TiO2 prices to remain be lower 5-8% sequentially and 15-
18% y-o-y impacting NIC’s profits.
Change in estimates: Factoring in the conditions, net losses in Q1 and
expectations for the year ahead, we have revised our 2015 earnings estimates
down to SAR803.8mn (from SAR1.11bn). We have also revised downward our
dividend estimates to SAR1 a share, in line with the 2014 DPS. At current price
level, this translates into a modest 4% dividend yield.
Valuation: NIC trades at 20.7x its 2015E EPS, a premium over its Saudi and
international peer-group averages. With the changes in our estimates, we have
revised our target price down to SAR26.3 (from SAR28.3). With limited upside,
we have retained our Neutral rating on the stock.
Risks
1. A longer-than-expected delay in the commencement of the ilmenite unit will
impact the company’s margins. Similarly, a slower ramp-up of its Acrylic Acid
plants would further hurt its earnings.
2. Europe and the US are the key TiO2 markets. A sudden slowdown in the US
and/or further deterioration of the macroeconomic conditions in Europe will
further drag down the performance of the TiO2 segment.
Research Department ARC Research Team
Tel +966 11 211 9370, [email protected]
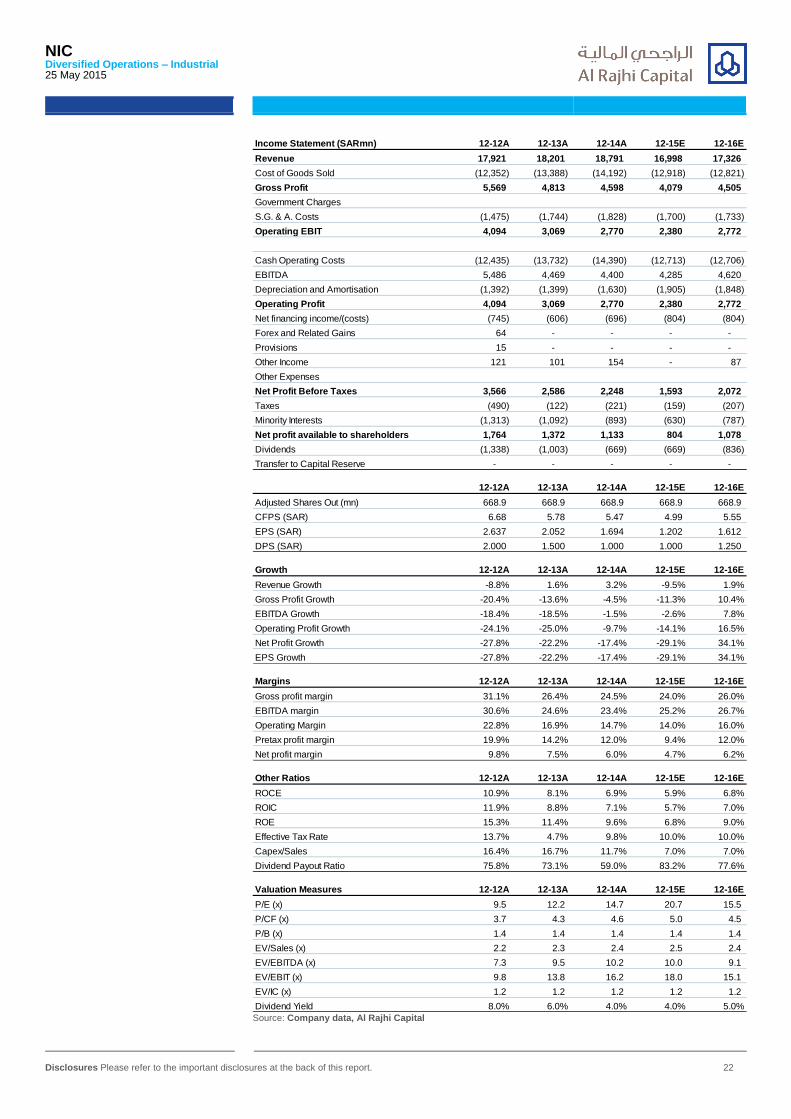
NIC Diversified Operations – Industrial 25 May 2015
Disclosures Please refer to the important disclosures at the back of this report. 22
Income Statement (SARmn) 12-12A 12-13A 12-14A 12-15E 12-16E
Revenue 17,921 18,201 18,791 16,998 17,326
Cost of Goods Sold (12,352) (13,388) (14,192) (12,918) (12,821)
Gross Profit 5,569 4,813 4,598 4,079 4,505
Government Charges
S.G. & A. Costs (1,475) (1,744) (1,828) (1,700) (1,733)
Operating EBIT 4,094 3,069 2,770 2,380 2,772
Cash Operating Costs (12,435) (13,732) (14,390) (12,713) (12,706)
EBITDA 5,486 4,469 4,400 4,285 4,620
Depreciation and Amortisation (1,392) (1,399) (1,630) (1,905) (1,848)
Operating Profit 4,094 3,069 2,770 2,380 2,772
Net financing income/(costs) (745) (606) (696) (804) (804)
Forex and Related Gains 64 - - - -
Provisions 15 - - - -
Other Income 121 101 154 - 87
Other Expenses
Net Profit Before Taxes 3,566 2,586 2,248 1,593 2,072
Taxes (490) (122) (221) (159) (207)
Minority Interests (1,313) (1,092) (893) (630) (787)
Net profit available to shareholders 1,764 1,372 1,133 804 1,078
Dividends (1,338) (1,003) (669) (669) (836)
Transfer to Capital Reserve - - - - -
12-12A 12-13A 12-14A 12-15E 12-16E
Adjusted Shares Out (mn) 668.9 668.9 668.9 668.9 668.9
CFPS (SAR) 6.68 5.78 5.47 4.99 5.55
EPS (SAR) 2.637 2.052 1.694 1.202 1.612
DPS (SAR) 2.000 1.500 1.000 1.000 1.250
Growth 12-12A 12-13A 12-14A 12-15E 12-16E
Revenue Growth -8.8% 1.6% 3.2% -9.5% 1.9%
Gross Profit Growth -20.4% -13.6% -4.5% -11.3% 10.4%
EBITDA Growth -18.4% -18.5% -1.5% -2.6% 7.8%
Operating Profit Growth -24.1% -25.0% -9.7% -14.1% 16.5%
Net Profit Growth -27.8% -22.2% -17.4% -29.1% 34.1%
EPS Growth -27.8% -22.2% -17.4% -29.1% 34.1%
Margins 12-12A 12-13A 12-14A 12-15E 12-16E
Gross profit margin 31.1% 26.4% 24.5% 24.0% 26.0%
EBITDA margin 30.6% 24.6% 23.4% 25.2% 26.7%
Operating Margin 22.8% 16.9% 14.7% 14.0% 16.0%
Pretax profit margin 19.9% 14.2% 12.0% 9.4% 12.0%
Net profit margin 9.8% 7.5% 6.0% 4.7% 6.2%
Other Ratios 12-12A 12-13A 12-14A 12-15E 12-16E
ROCE 10.9% 8.1% 6.9% 5.9% 6.8%
ROIC 11.9% 8.8% 7.1% 5.7% 7.0%
ROE 15.3% 11.4% 9.6% 6.8% 9.0%
Effective Tax Rate 13.7% 4.7% 9.8% 10.0% 10.0%
Capex/Sales 16.4% 16.7% 11.7% 7.0% 7.0%
Dividend Payout Ratio 75.8% 73.1% 59.0% 83.2% 77.6%
Valuation Measures 12-12A 12-13A 12-14A 12-15E 12-16E
P/E (x) 9.5 12.2 14.7 20.7 15.5
P/CF (x) 3.7 4.3 4.6 5.0 4.5
P/B (x) 1.4 1.4 1.4 1.4 1.4
EV/Sales (x) 2.2 2.3 2.4 2.5 2.4
EV/EBITDA (x) 7.3 9.5 10.2 10.0 9.1
EV/EBIT (x) 9.8 13.8 16.2 18.0 15.1
EV/IC (x) 1.2 1.2 1.2 1.2 1.2
Dividend Yield 8.0% 6.0% 4.0% 4.0% 5.0% Source: Company data, Al Rajhi Capital

NIC Diversified Operations – Industrial 25 May 2015
Disclosures Please refer to the important disclosures at the back of this report. 23
Balance Sheet (SARmn) 12-12A 12-13A 12-14A 12-15E 12-16E
Cash and Cash Equivalents 6,456 5,179 4,539 6,288 7,223
Current Receivables 2,505 3,948 4,144 3,739 3,638
Inventories 5,514 5,846 6,011 5,099 5,198
Other current assets 2,013 1,017 1,377 1,377 1,377
Total Current Assets 16,488 15,989 16,071 16,504 17,436
Fixed Assets 23,596 25,086 25,898 25,183 24,548
Investments 1,029 1,615 1,635 1,635 1,635
Goodwill 2,566 3,666 3,639 3,639 3,639
Other Intangible Assets 1,043 - - - -
Total Other Assets 854 777 891 891 891
Total Non-current Assets 29,087 31,143 32,063 31,348 30,713
Total Assets 45,575 47,133 48,135 47,852 48,150
Short Term Debt 3,431 5,067 4,261 4,261 4,261
Accounts Payable 1,337 1,567 1,370 1,190 1,213
Accrued Expenses 823 2,263 1,937 1,700 1,733
Zakat Payable - - - - -
Dividends Payable 64 - - - -
Other Current Liabilities 639 - 7 7 7
Total Current Liabilities 6,296 8,896 7,575 7,158 7,214
Long-Term Debt 17,591 17,383 20,117 20,117 20,117
Other LT Payables 390 886 1,005 1,005 1,005
Provisions 1,689 394 333 333 333
Total Non-current Liabilities 19,670 18,663 21,454 21,454 21,454
Minority interests 7,542 7,580 7,426 7,426 7,426
Paid-up share capital 6,689 6,689 6,689 6,689 6,689
Total Reserves 5,378 5,304 4,990 5,125 5,367
Total Shareholders' Equity 12,067 11,993 11,679 11,814 12,056
Total Equity 19,610 19,573 19,105 19,240 19,482
Total Liabilities & Shareholders' Equity 45,575 47,133 48,135 47,852 48,150
Ratios 12-12A 12-13A 12-14A 12-15E 12-16E
Net Debt (SARmn) 14,567 17,271 19,839 18,090 17,155
Net Debt/EBITDA (x) 2.66 3.86 4.51 4.22 3.71
Net Debt to Equity 74.3% 88.2% 103.8% 94.0% 88.1%
EBITDA Interest Cover (x) 7.4 7.4 6.3 5.3 5.7
BVPS (SAR) 18.04 17.93 17.46 17.66 18.02
Cashflow Statement (SARmn) 12-12A 12-13A 12-14A 12-15E 12-16E
Net Income before Tax & Minority Interest 3,566 2,586 2,248 1,593 2,072
Depreciation & Amortisation 1,392 1,399 1,630 1,905 1,848
Decrease in Working Capital (194) 685 (604) 899 58
Other Operating Cashflow (1,763) (1,401) (1,045) (789) (994)
Cashflow from Operations 3,002 3,269 2,229 3,607 2,984
Capital Expenditure (2,935) (3,045) (2,201) (1,190) (1,213)
New Investments (149) (64) (126) - -
Others (170) (166) (94) - -
Cashflow from investing activities (3,254) (3,276) (2,420) (1,190) (1,213)
Net Operating Cashflow (253) (7) (191) 2,418 1,771
Dividends paid to ordinary shareholders (836) (1,340) (1,005) (669) (836)
Proceeds from issue of shares - - - - -
Increase in Loans 2,931 1,124 1,602 - -
Effects of Exchange Rates on Cash - - - - -
Other Financing Cashflow (23) (1,054) (1,045) - -
Cashflow from financing activities 2,072 (1,270) (448) (669) (836)
Total cash generated 1,819 (1,277) (640) 1,749 935
Cash at beginning of period 4,637 6,456 5,179 4,539 6,288
Implied cash at end of year 6,456 5,179 4,539 6,288 7,223
Ratios 12-12A 12-13A 12-14A 12-15E 12-16E
Capex/Sales 16.4% 16.7% 11.7% 7.0% 7.0% Source: Company data, Al Rajhi Capital

Yansab Petrochemicals – Industrial YANSAB AB: Saudi Arabia
25 May 2015
Rating NEUTRAL
Target price SAR52.6 (-2.4% upside)
Current price SAR53.9
Disclosures Please refer to the important disclosures at the back of this report. Powered by EFA Platform 24
Key themes & implications
A sharp fall in oil prices and a prolonged shutdown are expected to negatively impact Yansab’s performance this year. We expect these factors to result in a lower DPS although at the current market price, it translates into a decent dividend yield.
Share information
Market cap (SAR/US$) 30.31bn / 8.08bn
52-week range 40.16 - 77.47
Daily avg. volume (US$) 14.2mn
Shares outstanding 562.5mn
Free float (est.) 37%
Performance 1M 3M 12M
Absolute 22.3% 10.2% -23.1%
Relative to index 15.4% 6.7% -21.1%
Major Shareholder:
SABIC 51.0%
GOSI 11.5%
Valuation
12-13A 12-14A 12-15E 12-16E
P/E (x) 11.5 12.2 18.3 14.2
P/B (x) 2.0 1.9 1.9 1.9
EV/EBITDA (x) 8.4 7.8 10.3 8.8
Dividend Yield 5.6% 5.6% 4.6% 5.6% Source: Company data, Al Rajhi Capital
Performance
64.0
74.0
84.0
94.0
104.0
36.0
46.0
56.0
66.0
76.0
Price Close Relative to TADAWUL FF (RHS)
-10
30
70
05/14 08/14 11/14 02/15
RS
I10
Source: Bloomberg, Company data, Al Rajhi Capital
Company summary
Established in 2006, Yansab began commercial production in 2010. A SABIC subsidiary, Yansab is involved in production of a wide range of olefins, including ethylene, polyethylene, propylene and polypropylene, etc.
Yansab Shutdown to impact earnings Yansab, which is one of the Kingdom’s largest petrochemical producers, is
engaged in the manufacture of basic petrochemical products. Despite strong
support from its parent company SABIC and healthy operating rates, its
revenue and earnings have come under pressure in the last two quarters on
account of a steep decline in product prices. However, product prices have been
picking up over the past few weeks indicating 2015 may not be as bad for
Yansab as we had expected earlier, although planned shutdown that will last in
the range of 35-60 days at some units will impact the company’s earnings to a
certain extent. A healthy cash position coupled with no capex plans should
enable it to continue its semiannual dividend payout, which it began in H2
2013. Nonetheless, given the weak earnings scenario y-o-y, we have lowered
our dividend estimate for 2015. We keep target price at SAR52.6 and continue
with a Neutral rating on the stock.
Basic product portfolio impacts margins: Yansab’s revenue generating
products comprise basic petrochemicals such as ethylene, polyethylene,
polypropylene, ethylene glycol. These products have a high correlation with
crude prices. The weak product price scenario impacted Yansab’s Q1 earnings
more than we had expected. However, prices of these products have been
improving lately on the back of a jump in the crude prices although prices
remain lower y-o-y. Despite the rise in product prices Yansab is expected to feel
the margin squeeze as it depends on ethane feedstock (it received gas feedstock
at a fixed subsidized price). We expect operating margin to be ~25% in 2015 vs.
29.9% in 2014 and 32% in 2013.
Earnings revision: Product prices have improved over the last few weeks and
we expect them to remain stable or witness an uptrend going forward based on
the current oil price trajectory. This will improve Yansab’s top-line for 2015.
However, Yansab, which had not had any planned maintenance activities since
Q4 2013, has undertaken a maintenance shutdown for 35-60 days in Q2. This,
coupled with fixed-cost feedstock, is expected to impact the company’s earnings.
Based on these factors, we have revised our 2015 revenues and EPS estimates.
We expect Yansab’s revenues to climb to SAR7.8bn (vs. 7.3bn estimated earlier).
However, a high cost of sales in Q1 and maintenance shutdown in Q2 is expected
to bring down Yansab’s EPS to SAR2.95 (vs. 3.17).
Strong coffers to aid dividend payment: Yansab has built a robust balance
sheet since it commenced operations commercially. The company’s cash &
equivalents have risen at ~39% CAGR (2011-2014), while bringing down debt to
half over the same period. Additionally, Yansab has no capex plans, which makes
the cash available for distribution. Our analysis points out that the dividends will
be covered despite the potential poor earnings scenario. At the current price
levels, a SAR2.5 DPS (2015E) translates into a decent 4.6% dividend yield.
Valuation: Yansab trades at a forward P/E of 18.3x, a slight premium over its
peer-group average and MSCI World Chemical Index. We do not see a multiple
expansion over the near-term on account of damp product prices and the
prolonged shutdown. We keep the target price at SAR52.6 and maintain a
Neutral rating on the stock.
Research Department ARC Research Teamm
Tel +966 11 211 9370, [email protected]
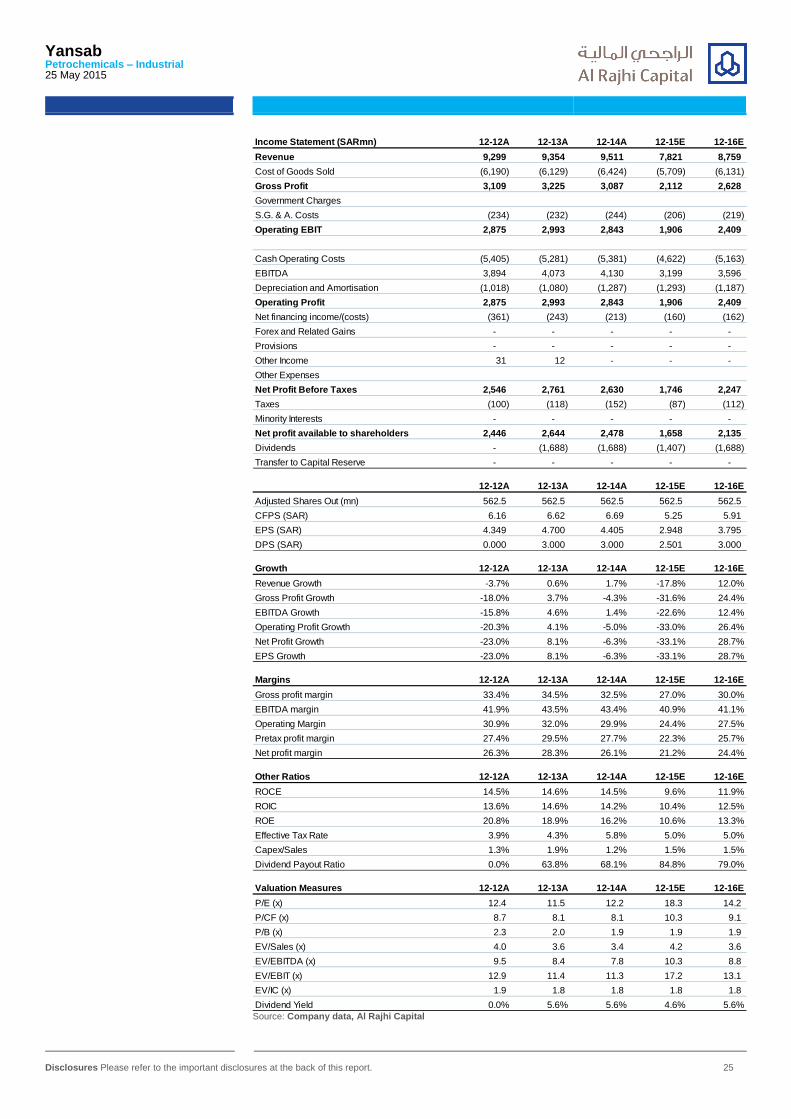
Yansab Petrochemicals – Industrial 25 May 2015
Disclosures Please refer to the important disclosures at the back of this report. 25
Income Statement (SARmn) 12-12A 12-13A 12-14A 12-15E 12-16E
Revenue 9,299 9,354 9,511 7,821 8,759
Cost of Goods Sold (6,190) (6,129) (6,424) (5,709) (6,131)
Gross Profit 3,109 3,225 3,087 2,112 2,628
Government Charges
S.G. & A. Costs (234) (232) (244) (206) (219)
Operating EBIT 2,875 2,993 2,843 1,906 2,409
Cash Operating Costs (5,405) (5,281) (5,381) (4,622) (5,163)
EBITDA 3,894 4,073 4,130 3,199 3,596
Depreciation and Amortisation (1,018) (1,080) (1,287) (1,293) (1,187)
Operating Profit 2,875 2,993 2,843 1,906 2,409
Net financing income/(costs) (361) (243) (213) (160) (162)
Forex and Related Gains - - - - -
Provisions - - - - -
Other Income 31 12 - - -
Other Expenses
Net Profit Before Taxes 2,546 2,761 2,630 1,746 2,247
Taxes (100) (118) (152) (87) (112)
Minority Interests - - - - -
Net profit available to shareholders 2,446 2,644 2,478 1,658 2,135
Dividends - (1,688) (1,688) (1,407) (1,688)
Transfer to Capital Reserve - - - - -
12-12A 12-13A 12-14A 12-15E 12-16E
Adjusted Shares Out (mn) 562.5 562.5 562.5 562.5 562.5
CFPS (SAR) 6.16 6.62 6.69 5.25 5.91
EPS (SAR) 4.349 4.700 4.405 2.948 3.795
DPS (SAR) 0.000 3.000 3.000 2.501 3.000
Growth 12-12A 12-13A 12-14A 12-15E 12-16E
Revenue Growth -3.7% 0.6% 1.7% -17.8% 12.0%
Gross Profit Growth -18.0% 3.7% -4.3% -31.6% 24.4%
EBITDA Growth -15.8% 4.6% 1.4% -22.6% 12.4%
Operating Profit Growth -20.3% 4.1% -5.0% -33.0% 26.4%
Net Profit Growth -23.0% 8.1% -6.3% -33.1% 28.7%
EPS Growth -23.0% 8.1% -6.3% -33.1% 28.7%
Margins 12-12A 12-13A 12-14A 12-15E 12-16E
Gross profit margin 33.4% 34.5% 32.5% 27.0% 30.0%
EBITDA margin 41.9% 43.5% 43.4% 40.9% 41.1%
Operating Margin 30.9% 32.0% 29.9% 24.4% 27.5%
Pretax profit margin 27.4% 29.5% 27.7% 22.3% 25.7%
Net profit margin 26.3% 28.3% 26.1% 21.2% 24.4%
Other Ratios 12-12A 12-13A 12-14A 12-15E 12-16E
ROCE 14.5% 14.6% 14.5% 9.6% 11.9%
ROIC 13.6% 14.6% 14.2% 10.4% 12.5%
ROE 20.8% 18.9% 16.2% 10.6% 13.3%
Effective Tax Rate 3.9% 4.3% 5.8% 5.0% 5.0%
Capex/Sales 1.3% 1.9% 1.2% 1.5% 1.5%
Dividend Payout Ratio 0.0% 63.8% 68.1% 84.8% 79.0%
Valuation Measures 12-12A 12-13A 12-14A 12-15E 12-16E
P/E (x) 12.4 11.5 12.2 18.3 14.2
P/CF (x) 8.7 8.1 8.1 10.3 9.1
P/B (x) 2.3 2.0 1.9 1.9 1.9
EV/Sales (x) 4.0 3.6 3.4 4.2 3.6
EV/EBITDA (x) 9.5 8.4 7.8 10.3 8.8
EV/EBIT (x) 12.9 11.4 11.3 17.2 13.1
EV/IC (x) 1.9 1.8 1.8 1.8 1.8
Dividend Yield 0.0% 5.6% 5.6% 4.6% 5.6% Source: Company data, Al Rajhi Capital
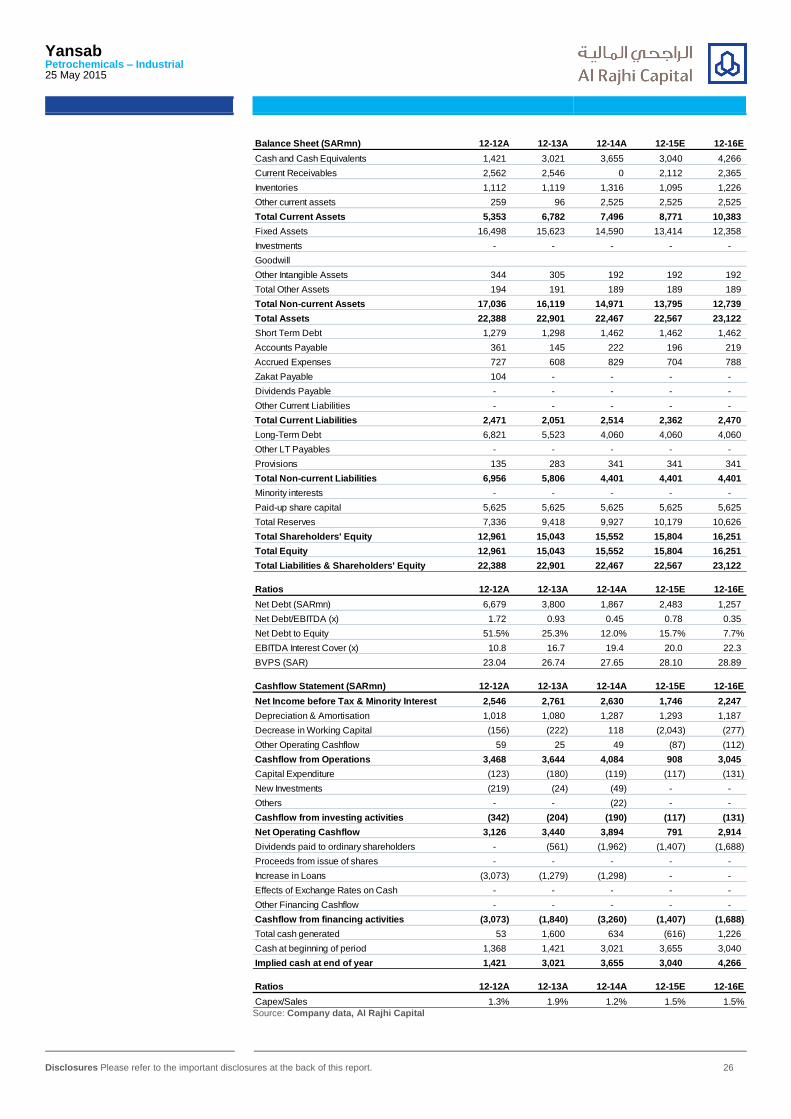
Yansab Petrochemicals – Industrial 25 May 2015
Disclosures Please refer to the important disclosures at the back of this report. 26
Balance Sheet (SARmn) 12-12A 12-13A 12-14A 12-15E 12-16E
Cash and Cash Equivalents 1,421 3,021 3,655 3,040 4,266
Current Receivables 2,562 2,546 0 2,112 2,365
Inventories 1,112 1,119 1,316 1,095 1,226
Other current assets 259 96 2,525 2,525 2,525
Total Current Assets 5,353 6,782 7,496 8,771 10,383
Fixed Assets 16,498 15,623 14,590 13,414 12,358
Investments - - - - -
Goodwill
Other Intangible Assets 344 305 192 192 192
Total Other Assets 194 191 189 189 189
Total Non-current Assets 17,036 16,119 14,971 13,795 12,739
Total Assets 22,388 22,901 22,467 22,567 23,122
Short Term Debt 1,279 1,298 1,462 1,462 1,462
Accounts Payable 361 145 222 196 219
Accrued Expenses 727 608 829 704 788
Zakat Payable 104 - - - -
Dividends Payable - - - - -
Other Current Liabilities - - - - -
Total Current Liabilities 2,471 2,051 2,514 2,362 2,470
Long-Term Debt 6,821 5,523 4,060 4,060 4,060
Other LT Payables - - - - -
Provisions 135 283 341 341 341
Total Non-current Liabilities 6,956 5,806 4,401 4,401 4,401
Minority interests - - - - -
Paid-up share capital 5,625 5,625 5,625 5,625 5,625
Total Reserves 7,336 9,418 9,927 10,179 10,626
Total Shareholders' Equity 12,961 15,043 15,552 15,804 16,251
Total Equity 12,961 15,043 15,552 15,804 16,251
Total Liabilities & Shareholders' Equity 22,388 22,901 22,467 22,567 23,122
Ratios 12-12A 12-13A 12-14A 12-15E 12-16E
Net Debt (SARmn) 6,679 3,800 1,867 2,483 1,257
Net Debt/EBITDA (x) 1.72 0.93 0.45 0.78 0.35
Net Debt to Equity 51.5% 25.3% 12.0% 15.7% 7.7%
EBITDA Interest Cover (x) 10.8 16.7 19.4 20.0 22.3
BVPS (SAR) 23.04 26.74 27.65 28.10 28.89
Cashflow Statement (SARmn) 12-12A 12-13A 12-14A 12-15E 12-16E
Net Income before Tax & Minority Interest 2,546 2,761 2,630 1,746 2,247
Depreciation & Amortisation 1,018 1,080 1,287 1,293 1,187
Decrease in Working Capital (156) (222) 118 (2,043) (277)
Other Operating Cashflow 59 25 49 (87) (112)
Cashflow from Operations 3,468 3,644 4,084 908 3,045
Capital Expenditure (123) (180) (119) (117) (131)
New Investments (219) (24) (49) - -
Others - - (22) - -
Cashflow from investing activities (342) (204) (190) (117) (131)
Net Operating Cashflow 3,126 3,440 3,894 791 2,914
Dividends paid to ordinary shareholders - (561) (1,962) (1,407) (1,688)
Proceeds from issue of shares - - - - -
Increase in Loans (3,073) (1,279) (1,298) - -
Effects of Exchange Rates on Cash - - - - -
Other Financing Cashflow - - - - -
Cashflow from financing activities (3,073) (1,840) (3,260) (1,407) (1,688)
Total cash generated 53 1,600 634 (616) 1,226
Cash at beginning of period 1,368 1,421 3,021 3,655 3,040
Implied cash at end of year 1,421 3,021 3,655 3,040 4,266
Ratios 12-12A 12-13A 12-14A 12-15E 12-16E
Capex/Sales 1.3% 1.9% 1.2% 1.5% 1.5% Source: Company data, Al Rajhi Capital
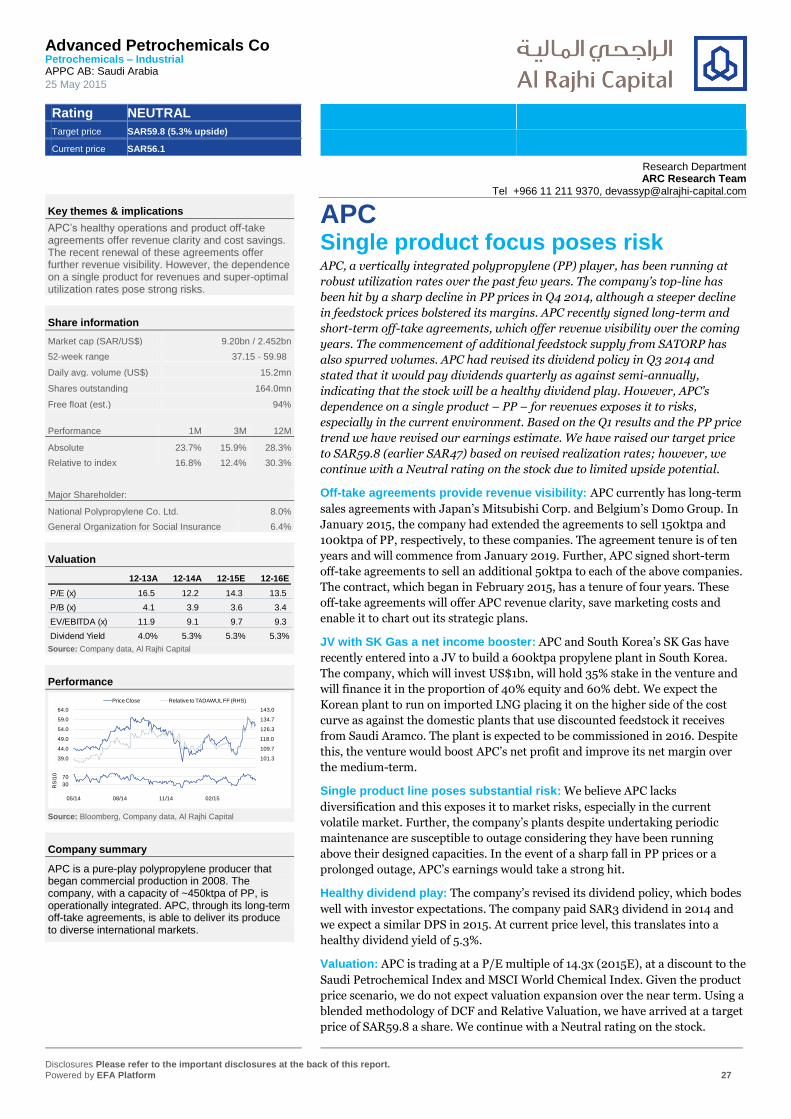
Advanced Petrochemicals Co Petrochemicals – Industrial APPC AB: Saudi Arabia
25 May 2015
Rating NEUTRAL
Target price SAR59.8 (5.3% upside)
Current price SAR56.1
Disclosures Please refer to the important disclosures at the back of this report. Powered by EFA Platform 27
Key themes & implications
APC’s healthy operations and product off-take agreements offer revenue clarity and cost savings. The recent renewal of these agreements offer further revenue visibility. However, the dependence on a single product for revenues and super-optimal utilization rates pose strong risks.
Share information
Market cap (SAR/US$) 9.20bn / 2.452bn
52-week range 37.15 - 59.98
Daily avg. volume (US$) 15.2mn
Shares outstanding 164.0mn
Free float (est.) 94%
Performance 1M 3M 12M
Absolute 23.7% 15.9% 28.3%
Relative to index 16.8% 12.4% 30.3%
Major Shareholder:
National Polypropylene Co. Ltd. 8.0%
General Organization for Social Insurance 6.4%
Valuation
12-13A 12-14A 12-15E 12-16E
P/E (x) 16.5 12.2 14.3 13.5
P/B (x) 4.1 3.9 3.6 3.4
EV/EBITDA (x) 11.9 9.1 9.7 9.3
Dividend Yield 4.0% 5.3% 5.3% 5.3% Source: Company data, Al Rajhi Capital
Performance
93.0
101.3
109.7
118.0
126.3
134.7
143.0
34.0
39.0
44.0
49.0
54.0
59.0
64.0
Price Close Relative to TADAWUL FF (RHS)
-10
30
70
05/14 08/14 11/14 02/15
RS
I10
Source: Bloomberg, Company data, Al Rajhi Capital
Company summary
APC is a pure-play polypropylene producer that began commercial production in 2008. The company, with a capacity of ~450ktpa of PP, is operationally integrated. APC, through its long-term off-take agreements, is able to deliver its produce to diverse international markets.
APC Single product focus poses risk APC, a vertically integrated polypropylene (PP) player, has been running at
robust utilization rates over the past few years. The company’s top-line has
been hit by a sharp decline in PP prices in Q4 2014, although a steeper decline
in feedstock prices bolstered its margins. APC recently signed long-term and
short-term off-take agreements, which offer revenue visibility over the coming
years. The commencement of additional feedstock supply from SATORP has
also spurred volumes. APC had revised its dividend policy in Q3 2014 and
stated that it would pay dividends quarterly as against semi-annually,
indicating that the stock will be a healthy dividend play. However, APC’s
dependence on a single product – PP – for revenues exposes it to risks,
especially in the current environment. Based on the Q1 results and the PP price
trend we have revised our earnings estimate. We have raised our target price
to SAR59.8 (earlier SAR47) based on revised realization rates; however, we
continue with a Neutral rating on the stock due to limited upside potential.
Off-take agreements provide revenue visibility: APC currently has long-term
sales agreements with Japan’s Mitsubishi Corp. and Belgium’s Domo Group. In
January 2015, the company had extended the agreements to sell 150ktpa and
100ktpa of PP, respectively, to these companies. The agreement tenure is of ten
years and will commence from January 2019. Further, APC signed short-term
off-take agreements to sell an additional 50ktpa to each of the above companies.
The contract, which began in February 2015, has a tenure of four years. These
off-take agreements will offer APC revenue clarity, save marketing costs and
enable it to chart out its strategic plans.
JV with SK Gas a net income booster: APC and South Korea’s SK Gas have
recently entered into a JV to build a 600ktpa propylene plant in South Korea.
The company, which will invest US$1bn, will hold 35% stake in the venture and
will finance it in the proportion of 40% equity and 60% debt. We expect the
Korean plant to run on imported LNG placing it on the higher side of the cost
curve as against the domestic plants that use discounted feedstock it receives
from Saudi Aramco. The plant is expected to be commissioned in 2016. Despite
this, the venture would boost APC’s net profit and improve its net margin over
the medium-term.
Single product line poses substantial risk: We believe APC lacks
diversification and this exposes it to market risks, especially in the current
volatile market. Further, the company’s plants despite undertaking periodic
maintenance are susceptible to outage considering they have been running
above their designed capacities. In the event of a sharp fall in PP prices or a
prolonged outage, APC’s earnings would take a strong hit.
Healthy dividend play: The company’s revised its dividend policy, which bodes
well with investor expectations. The company paid SAR3 dividend in 2014 and
we expect a similar DPS in 2015. At current price level, this translates into a
healthy dividend yield of 5.3%.
Valuation: APC is trading at a P/E multiple of 14.3x (2015E), at a discount to the
Saudi Petrochemical Index and MSCI World Chemical Index. Given the product
price scenario, we do not expect valuation expansion over the near term. Using a
blended methodology of DCF and Relative Valuation, we have arrived at a target
price of SAR59.8 a share. We continue with a Neutral rating on the stock.
Research Department ARC Research Team
Tel +966 11 211 9370, [email protected]

APC Petrochemicals – Industrial 25 May 2015
Disclosures Please refer to the important disclosures at the back of this report. 28
Income Statement (SARmn) 12-12A 12-13A 12-14A 12-15E 12-16E
Revenue 2,472 2,786 3,036 2,643 2,745
Cost of Goods Sold (2,086) (2,174) (2,256) (1,929) (2,004)
Gross Profit 387 611 781 714 741
Government Charges
S.G. & A. Costs (40) (46) (46) (48) (47)
Operating EBIT 346 566 735 666 694
Cash Operating Costs (1,929) (2,012) (2,093) (1,774) (1,852)
EBITDA 544 773 944 869 893
Depreciation and Amortisation (197) (208) (209) (203) (198)
Operating Profit 346 566 735 666 694
Net financing income/(costs) (18) (9) 16 (24) (12)
Forex and Related Gains
Provisions - - - - -
Other Income
Other Expenses
Net Profit Before Taxes 328 557 751 642 682
Taxes - - - - -
Minority Interests - - - - -
Net profit available to shareholders 328 557 751 642 682
Dividends (328) (369) (492) (492) (492)
Transfer to Capital Reserve
12-12A 12-13A 12-14A 12-15E 12-16E
Adjusted Shares Out (mn) 164.0 164.0 164.0 164.0 164.0
CFPS (SAR) 3.20 4.66 5.85 5.15 5.37
EPS (SAR) 2.002 3.396 4.582 3.917 4.160
DPS (SAR) 2.000 2.250 3.000 3.000 3.000
Growth 12-12A 12-13A 12-14A 12-15E 12-16E
Revenue Growth -11.4% 12.7% 9.0% -13.0% 3.9%
Gross Profit Growth -32.9% 58.2% 27.7% -8.6% 3.9%
EBITDA Growth -27.6% 42.2% 22.1% -7.9% 2.8%
Operating Profit Growth -35.1% 63.3% 30.0% -9.4% 4.3%
Net Profit Growth -36.0% 69.7% 34.9% -14.5% 6.2%
EPS Growth -36.0% 69.7% 34.9% -14.5% 6.2%
Margins 12-12A 12-13A 12-14A 12-15E 12-16E
Gross profit margin 15.6% 22.0% 25.7% 27.0% 27.0%
EBITDA margin 22.0% 27.8% 31.1% 32.9% 32.5%
Operating Margin 14.0% 20.3% 24.2% 25.2% 25.3%
Pretax profit margin 13.3% 20.0% 24.7% 24.3% 24.9%
Net profit margin 13.3% 20.0% 24.7% 24.3% 24.9%
Other Ratios 12-12A 12-13A 12-14A 12-15E 12-16E
ROCE 13.6% 20.9% 21.2% 18.4% 18.2%
ROIC 14.0% 23.7% 32.1% 27.9% 29.3%
ROE 16.1% 25.9% 32.5% 26.2% 26.0%
Effective Tax Rate 0.0% 0.0% 0.0% 0.0% 0.0%
Capex/Sales 3.9% 4.0% 5.2% 9.0% 9.0%
Dividend Payout Ratio 99.9% 66.3% 65.5% 76.6% 72.1%
Valuation Measures 12-12A 12-13A 12-14A 12-15E 12-16E
P/E (x) 28.0 16.5 12.2 14.3 13.5
P/CF (x) 17.5 12.0 9.6 10.9 10.4
P/B (x) 4.5 4.1 3.9 3.6 3.4
EV/Sales (x) 3.9 3.3 2.8 3.2 3.0
EV/EBITDA (x) 17.5 11.9 9.1 9.7 9.3
EV/EBIT (x) 27.5 16.3 11.7 12.7 12.0
EV/IC (x) 4.0 4.0 3.6 3.6 3.5
Dividend Yield 3.6% 4.0% 5.3% 5.3% 5.3% Source: Company data, Al Rajhi Capital
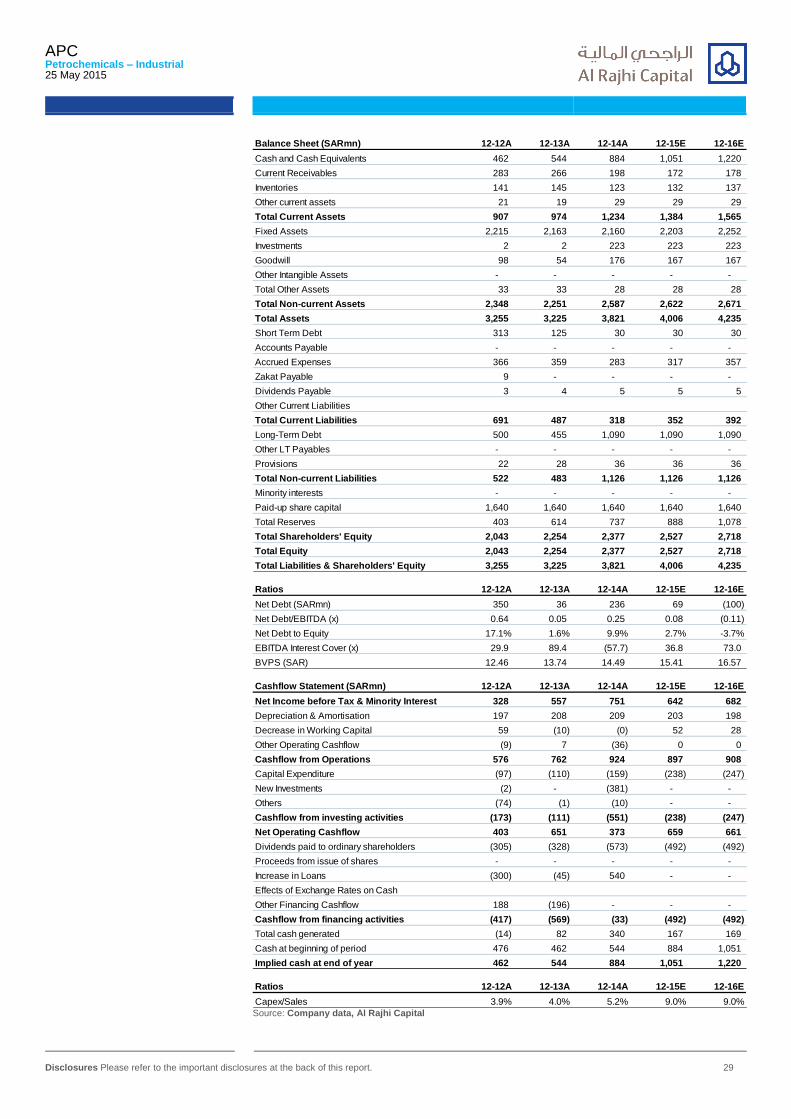
APC Petrochemicals – Industrial 25 May 2015
Disclosures Please refer to the important disclosures at the back of this report. 29
Balance Sheet (SARmn) 12-12A 12-13A 12-14A 12-15E 12-16E
Cash and Cash Equivalents 462 544 884 1,051 1,220
Current Receivables 283 266 198 172 178
Inventories 141 145 123 132 137
Other current assets 21 19 29 29 29
Total Current Assets 907 974 1,234 1,384 1,565
Fixed Assets 2,215 2,163 2,160 2,203 2,252
Investments 2 2 223 223 223
Goodwill 98 54 176 167 167
Other Intangible Assets - - - - -
Total Other Assets 33 33 28 28 28
Total Non-current Assets 2,348 2,251 2,587 2,622 2,671
Total Assets 3,255 3,225 3,821 4,006 4,235
Short Term Debt 313 125 30 30 30
Accounts Payable - - - - -
Accrued Expenses 366 359 283 317 357
Zakat Payable 9 - - - -
Dividends Payable 3 4 5 5 5
Other Current Liabilities
Total Current Liabilities 691 487 318 352 392
Long-Term Debt 500 455 1,090 1,090 1,090
Other LT Payables - - - - -
Provisions 22 28 36 36 36
Total Non-current Liabilities 522 483 1,126 1,126 1,126
Minority interests - - - - -
Paid-up share capital 1,640 1,640 1,640 1,640 1,640
Total Reserves 403 614 737 888 1,078
Total Shareholders' Equity 2,043 2,254 2,377 2,527 2,718
Total Equity 2,043 2,254 2,377 2,527 2,718
Total Liabilities & Shareholders' Equity 3,255 3,225 3,821 4,006 4,235
Ratios 12-12A 12-13A 12-14A 12-15E 12-16E
Net Debt (SARmn) 350 36 236 69 (100)
Net Debt/EBITDA (x) 0.64 0.05 0.25 0.08 (0.11)
Net Debt to Equity 17.1% 1.6% 9.9% 2.7% -3.7%
EBITDA Interest Cover (x) 29.9 89.4 (57.7) 36.8 73.0
BVPS (SAR) 12.46 13.74 14.49 15.41 16.57
Cashflow Statement (SARmn) 12-12A 12-13A 12-14A 12-15E 12-16E
Net Income before Tax & Minority Interest 328 557 751 642 682
Depreciation & Amortisation 197 208 209 203 198
Decrease in Working Capital 59 (10) (0) 52 28
Other Operating Cashflow (9) 7 (36) 0 0
Cashflow from Operations 576 762 924 897 908
Capital Expenditure (97) (110) (159) (238) (247)
New Investments (2) - (381) - -
Others (74) (1) (10) - -
Cashflow from investing activities (173) (111) (551) (238) (247)
Net Operating Cashflow 403 651 373 659 661
Dividends paid to ordinary shareholders (305) (328) (573) (492) (492)
Proceeds from issue of shares - - - - -
Increase in Loans (300) (45) 540 - -
Effects of Exchange Rates on Cash
Other Financing Cashflow 188 (196) - - -
Cashflow from financing activities (417) (569) (33) (492) (492)
Total cash generated (14) 82 340 167 169
Cash at beginning of period 476 462 544 884 1,051
Implied cash at end of year 462 544 884 1,051 1,220
Ratios 12-12A 12-13A 12-14A 12-15E 12-16E
Capex/Sales 3.9% 4.0% 5.2% 9.0% 9.0% Source: Company data, Al Rajhi Capital
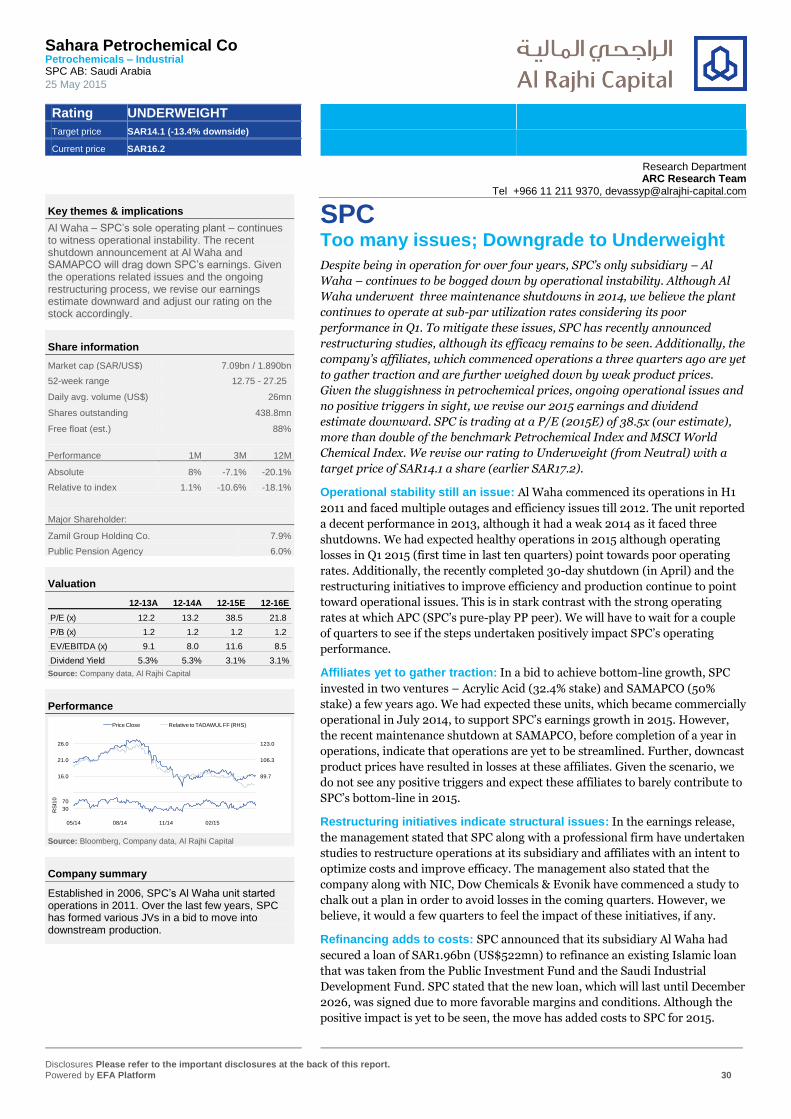
Sahara Petrochemical Co Petrochemicals – Industrial SPC AB: Saudi Arabia
25 May 2015
Rating UNDERWEIGHT
Target price SAR14.1 (-13.4% downside)
Current price SAR16.2
Disclosures Please refer to the important disclosures at the back of this report. Powered by EFA Platform 30
Key themes & implications
Al Waha – SPC’s sole operating plant – continues to witness operational instability. The recent shutdown announcement at Al Waha and SAMAPCO will drag down SPC’s earnings. Given the operations related issues and the ongoing restructuring process, we revise our earnings estimate downward and adjust our rating on the stock accordingly.
Share information
Market cap (SAR/US$) 7.09bn / 1.890bn
52-week range 12.75 - 27.25
Daily avg. volume (US$) 26mn
Shares outstanding 438.8mn
Free float (est.) 88%
Performance 1M 3M 12M
Absolute 8% -7.1% -20.1%
Relative to index 1.1% -10.6% -18.1%
Major Shareholder:
Zamil Group Holding Co. 7.9%
Public Pension Agency 6.0%
Valuation
12-13A 12-14A 12-15E 12-16E
P/E (x) 12.2 13.2 38.5 21.8
P/B (x) 1.2 1.2 1.2 1.2
EV/EBITDA (x) 9.1 8.0 11.6 8.5
Dividend Yield 5.3% 5.3% 3.1% 3.1% Source: Company data, Al Rajhi Capital
Performance
73.0
89.7
106.3
123.0
11.0
16.0
21.0
26.0
Price Close Relative to TADAWUL FF (RHS)
-10
30
70
05/14 08/14 11/14 02/15
RS
I10
Source: Bloomberg, Company data, Al Rajhi Capital
Company summary
Established in 2006, SPC’s Al Waha unit started operations in 2011. Over the last few years, SPC has formed various JVs in a bid to move into downstream production.
SPC Too many issues; Downgrade to Underweight
Despite being in operation for over four years, SPC’s only subsidiary – Al
Waha – continues to be bogged down by operational instability. Although Al
Waha underwent three maintenance shutdowns in 2014, we believe the plant
continues to operate at sub-par utilization rates considering its poor
performance in Q1. To mitigate these issues, SPC has recently announced
restructuring studies, although its efficacy remains to be seen. Additionally, the
company’s affiliates, which commenced operations a three quarters ago are yet
to gather traction and are further weighed down by weak product prices.
Given the sluggishness in petrochemical prices, ongoing operational issues and
no positive triggers in sight, we revise our 2015 earnings and dividend
estimate downward. SPC is trading at a P/E (2015E) of 38.5x (our estimate),
more than double of the benchmark Petrochemical Index and MSCI World
Chemical Index. We revise our rating to Underweight (from Neutral) with a
target price of SAR14.1 a share (earlier SAR17.2).
Operational stability still an issue: Al Waha commenced its operations in H1
2011 and faced multiple outages and efficiency issues till 2012. The unit reported
a decent performance in 2013, although it had a weak 2014 as it faced three
shutdowns. We had expected healthy operations in 2015 although operating
losses in Q1 2015 (first time in last ten quarters) point towards poor operating
rates. Additionally, the recently completed 30-day shutdown (in April) and the
restructuring initiatives to improve efficiency and production continue to point
toward operational issues. This is in stark contrast with the strong operating
rates at which APC (SPC’s pure-play PP peer). We will have to wait for a couple
of quarters to see if the steps undertaken positively impact SPC’s operating
performance.
Affiliates yet to gather traction: In a bid to achieve bottom-line growth, SPC
invested in two ventures – Acrylic Acid (32.4% stake) and SAMAPCO (50%
stake) a few years ago. We had expected these units, which became commercially
operational in July 2014, to support SPC’s earnings growth in 2015. However,
the recent maintenance shutdown at SAMAPCO, before completion of a year in
operations, indicate that operations are yet to be streamlined. Further, downcast
product prices have resulted in losses at these affiliates. Given the scenario, we
do not see any positive triggers and expect these affiliates to barely contribute to
SPC’s bottom-line in 2015.
Restructuring initiatives indicate structural issues: In the earnings release,
the management stated that SPC along with a professional firm have undertaken
studies to restructure operations at its subsidiary and affiliates with an intent to
optimize costs and improve efficacy. The management also stated that the
company along with NIC, Dow Chemicals & Evonik have commenced a study to
chalk out a plan in order to avoid losses in the coming quarters. However, we
believe, it would a few quarters to feel the impact of these initiatives, if any.
Refinancing adds to costs: SPC announced that its subsidiary Al Waha had
secured a loan of SAR1.96bn (US$522mn) to refinance an existing Islamic loan
that was taken from the Public Investment Fund and the Saudi Industrial
Development Fund. SPC stated that the new loan, which will last until December
2026, was signed due to more favorable margins and conditions. Although the
positive impact is yet to be seen, the move has added costs to SPC for 2015.
Research Department ARC Research Team
Tel +966 11 211 9370, [email protected]

SPC Petrochemicals – Industrial 25 May 2015
Disclosures Please refer to the important disclosures at the back of this report. 31
Downward revision on earnings and dividend: Given the shutdowns announced at Al
Waha and SAMAPCO, and poor operating rates at the former, we have revised our 2015E
earnings downward to SAR183.8mn (vs. 412mn earlier). We expect this to have a knock-
down effect and hence have lowered our DPS estimate to SAR0.50 a share (vs. SAR0.85 a
share earlier).
Earnings weakness, premium valuations; downgrade to Underweight: Our revised
estimates lead to a 2015E P/E of 38.5x, more than double of that of the Saudi Petrochemical
Index and MSCI World Chemical Index. We do not see any positive triggers for the company
over the next few quarters and hence revise our rating on the stock to Underweight with a
target price of SAR14.1 a share (earlier SAR17.2).
Risks
1. The downside risks have been factored in the current scenario although the multiple
shutdowns, as seen during 2014, may further drag down SPC’s bottom-line.
2. On the other hand, a faster-than-expected streamlining of operations at Al Waha and its
affiliates would strongly improve SPC’s earnings.
3. Petrochemical prices have been improving over the past few weeks. If the momentum
continues, SPC’s should show a strong earnings uptick.
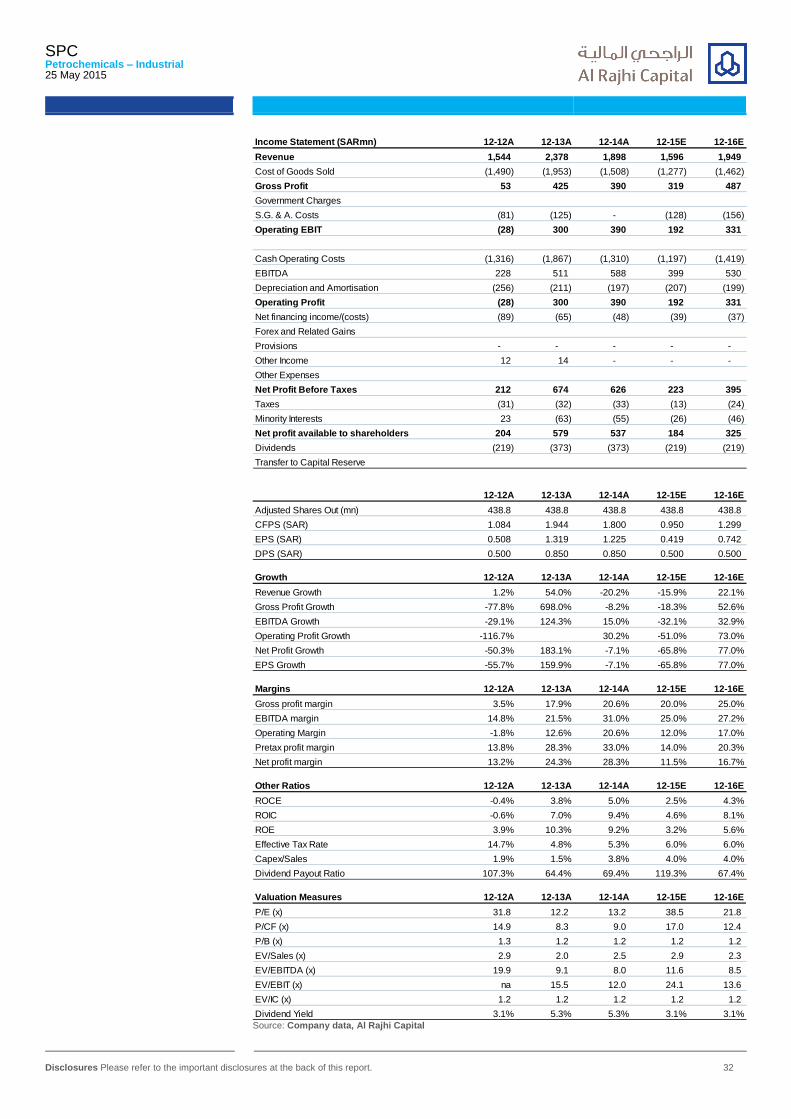
SPC Petrochemicals – Industrial 25 May 2015
Disclosures Please refer to the important disclosures at the back of this report. 32
Income Statement (SARmn) 12-12A 12-13A 12-14A 12-15E 12-16E
Revenue 1,544 2,378 1,898 1,596 1,949
Cost of Goods Sold (1,490) (1,953) (1,508) (1,277) (1,462)
Gross Profit 53 425 390 319 487
Government Charges
S.G. & A. Costs (81) (125) - (128) (156)
Operating EBIT (28) 300 390 192 331
Cash Operating Costs (1,316) (1,867) (1,310) (1,197) (1,419)
EBITDA 228 511 588 399 530
Depreciation and Amortisation (256) (211) (197) (207) (199)
Operating Profit (28) 300 390 192 331
Net financing income/(costs) (89) (65) (48) (39) (37)
Forex and Related Gains
Provisions - - - - -
Other Income 12 14 - - -
Other Expenses
Net Profit Before Taxes 212 674 626 223 395
Taxes (31) (32) (33) (13) (24)
Minority Interests 23 (63) (55) (26) (46)
Net profit available to shareholders 204 579 537 184 325
Dividends (219) (373) (373) (219) (219)
Transfer to Capital Reserve
12-12A 12-13A 12-14A 12-15E 12-16E
Adjusted Shares Out (mn) 438.8 438.8 438.8 438.8 438.8
CFPS (SAR) 1.084 1.944 1.800 0.950 1.299
EPS (SAR) 0.508 1.319 1.225 0.419 0.742
DPS (SAR) 0.500 0.850 0.850 0.500 0.500
Growth 12-12A 12-13A 12-14A 12-15E 12-16E
Revenue Growth 1.2% 54.0% -20.2% -15.9% 22.1%
Gross Profit Growth -77.8% 698.0% -8.2% -18.3% 52.6%
EBITDA Growth -29.1% 124.3% 15.0% -32.1% 32.9%
Operating Profit Growth -116.7% 30.2% -51.0% 73.0%
Net Profit Growth -50.3% 183.1% -7.1% -65.8% 77.0%
EPS Growth -55.7% 159.9% -7.1% -65.8% 77.0%
Margins 12-12A 12-13A 12-14A 12-15E 12-16E
Gross profit margin 3.5% 17.9% 20.6% 20.0% 25.0%
EBITDA margin 14.8% 21.5% 31.0% 25.0% 27.2%
Operating Margin -1.8% 12.6% 20.6% 12.0% 17.0%
Pretax profit margin 13.8% 28.3% 33.0% 14.0% 20.3%
Net profit margin 13.2% 24.3% 28.3% 11.5% 16.7%
Other Ratios 12-12A 12-13A 12-14A 12-15E 12-16E
ROCE -0.4% 3.8% 5.0% 2.5% 4.3%
ROIC -0.6% 7.0% 9.4% 4.6% 8.1%
ROE 3.9% 10.3% 9.2% 3.2% 5.6%
Effective Tax Rate 14.7% 4.8% 5.3% 6.0% 6.0%
Capex/Sales 1.9% 1.5% 3.8% 4.0% 4.0%
Dividend Payout Ratio 107.3% 64.4% 69.4% 119.3% 67.4%
Valuation Measures 12-12A 12-13A 12-14A 12-15E 12-16E
P/E (x) 31.8 12.2 13.2 38.5 21.8
P/CF (x) 14.9 8.3 9.0 17.0 12.4
P/B (x) 1.3 1.2 1.2 1.2 1.2
EV/Sales (x) 2.9 2.0 2.5 2.9 2.3
EV/EBITDA (x) 19.9 9.1 8.0 11.6 8.5
EV/EBIT (x) na 15.5 12.0 24.1 13.6
EV/IC (x) 1.2 1.2 1.2 1.2 1.2
Dividend Yield 3.1% 5.3% 5.3% 3.1% 3.1% Source: Company data, Al Rajhi Capital

SPC Petrochemicals – Industrial 25 May 2015
Disclosures Please refer to the important disclosures at the back of this report. 33
Balance Sheet (SARmn) 12-12A 12-13A 12-14A 12-15E 12-16E
Cash and Cash Equivalents 986 1,287 1,341 1,337 1,438
Current Receivables 469 496 403 319 390
Inventories 301 227 296 192 234
Other current assets - 67 155 155 155
Total Current Assets 1,756 2,077 2,196 2,003 2,216
Fixed Assets 3,732 3,536 3,459 3,316 3,195
Investments 2,926 2,987 2,808 2,808 2,808
Goodwill 91 83 45 45 45
Other Intangible Assets - - - - -
Total Other Assets - - - - -
Total Non-current Assets 6,749 6,607 6,312 6,169 6,048
Total Assets 8,505 8,683 8,508 8,172 8,264
Short Term Debt 257 221 247 247 247
Accounts Payable 341 153 320 239 292
Accrued Expenses - - - - -
Zakat Payable 42 40 34 34 34
Dividends Payable - - - (154) (154)
Other Current Liabilities
Total Current Liabilities 701 627 601 367 420
Long-Term Debt 1,889 1,713 1,487 1,420 1,353
Other LT Payables - - - - -
Provisions 94 72 70 70 70
Total Non-current Liabilities 1,983 1,785 1,557 1,490 1,423
Minority interests 403 473 527 527 527
Paid-up share capital 4,388 4,388 4,388 4,388 4,388
Total Reserves 1,030 1,410 1,436 1,400 1,506
Total Shareholders' Equity 5,418 5,798 5,824 5,788 5,894
Total Equity 5,821 6,271 6,351 6,315 6,421
Total Liabilities & Shareholders' Equity 8,505 8,683 8,508 8,172 8,264
Ratios 12-12A 12-13A 12-14A 12-15E 12-16E
Net Debt (SARmn) 1,160 647 392 329 162
Net Debt/EBITDA (x) 5.09 1.27 0.67 0.82 0.31
Net Debt to Equity 19.9% 10.3% 6.2% 5.2% 2.5%
EBITDA Interest Cover (x) 2.6 7.8 12.3 10.3 14.5
BVPS (SAR) 12.35 13.21 13.27 13.19 13.43
Cashflow Statement (SARmn) 12-12A 12-13A 12-14A 12-15E 12-16E
Net Income before Tax & Minority Interest 212 674 626 223 395
Depreciation & Amortisation 256 211 197 207 199
Decrease in Working Capital (18) (299) (295) 109 (60)
Other Operating Cashflow (320) (48) (293) (39) (69)
Cashflow from Operations 131 538 235 500 464
Capital Expenditure (30) (35) (72) (64) (78)
New Investments 88 251 471 - -
Others (56) (19) (30) - -
Cashflow from investing activities 2 197 369 (64) (78)
Net Operating Cashflow 132 735 604 436 386
Dividends paid to ordinary shareholders - (219) (373) (373) (219)
Proceeds from issue of shares - - - - -
Increase in Loans (144) (268) (176) (67) (67)
Effects of Exchange Rates on Cash
Other Financing Cashflow - 54 - - -
Cashflow from financing activities (144) (434) (549) (440) (286)
Total cash generated (12) 301 54 (4) 100
Cash at beginning of period 998 986 1,287 1,341 1,337
Implied cash at end of year 986 1,287 1,341 1,337 1,438
Ratios 12-12A 12-13A 12-14A 12-15E 12-16E
Capex/Sales 1.9% 1.5% 3.8% 4.0% 4.0% Source: Company data, Al Rajhi Capital
Saudi Petrochemicals
Sector Petrochemicals –Industrial
Disclosures Please refer to the important disclosures at the back of this report. 34
Disclaimer and additional disclosures for Equity Research
Disclaimer
This research document has been prepared by Al Rajhi Capital Company (“Al Rajhi Capital”) of Riyadh, Saudi Arabia. It has been prepared for the general use of Al Rajhi Capital’s clients and may not be redistributed, retransmitted or disclosed, in whole or in part, or in any form or manner, without the express written consent of Al Rajhi Capital. Receipt and review of this research document constitute your agreement not to redistribute, retransmit, or disclose to others the contents, opinions, conclusion, or information contained in this document prior to public disclosure of such information by Al Rajhi Capital. The information contained was obtained from various public sources believed to be reliable but we do not guarantee its accuracy. Al Rajhi Capital makes no representations or warranties (express or implied) regarding the data and information provided and Al Rajhi Capital does not represent that the information content of this document is complete, or free from any error, not misleading, or fit for any particular purpose. This research document provides general information only. Neither the information nor any opinion expressed constitutes an offer or an invitation to make an offer, to buy or sell any securities or other investment products related to such securities or investments. It is not intended to provide personal investment advice and it does not take into account the specific investment objectives, financial situation and the particular needs of any specific person who may receive this document.
Investors should seek financial, legal or tax advice regarding the appropriateness of investing in any securities, other investment or investment strategies discussed or recommended in this document and should understand that statements regarding future prospects may not be realized. Investors should note that income from such securities or other investments, if any, may fluctuate and that the price or value of such securities and investments may rise or fall. Fluctuations in exchange rates could have adverse effects on the value of or price of, or income derived from, certain investments. Accordingly, investors may receive back less than originally invested. Al Rajhi Capital or its officers or one or more of its affiliates (including research analysts) may have a financial interest in securities of the issuer(s) or related investments, including long or short positions in securities, warrants, futures, options, derivatives, or other financial instruments. Al Rajhi Capital or its affiliates may from time to time perform investment banking or other services for, solicit investment banking or other business from, any company mentioned in this research document. Al Rajhi Capital, together with its affiliates and employees, shall not be liable for any direct, indirect or consequential loss or damages that may arise, directly or indirectly, from any use of the information contained in this research document.
This research document and any recommendations contained are subject to change without prior notice. Al Rajhi Capital assumes no responsibility to update the information in this research document. Neither the whole nor any part of this research document may be altered, duplicated, transmitted or distributed in any form or by any means. This research document is not directed to, or intended for distribution to or use by, any person or entity who is a citizen or resident of or located in any locality, state, country or other jurisdiction where such distribution, publication, availability or use would be contrary to law or which would subject Al Rajhi Capital or any of its affiliates to any registration or licensing requirement within such jurisdiction.
Additional disclosures 1. Explanation of Al Rajhi Capital’s rating system Al Rajhi Capital uses a three-tier rating system based on absolute upside or downside potential for all stocks under its coverage except financial stocks and those few other companies not compliant with Islamic Shariah law:
"Overweight": Our target price is more than 10% above the current share price, and we expect the share price to reach the target on a 6-9 month time horizon.
"Neutral": We expect the share price to settle at a level between 10% below the current share price and 10% above the current share price on a 6-9 month time horizon.
"Underweight": Our target price is more than 10% below the current share price, and we expect the share price to reach the target on a 6-9 month time horizon.
2. Definitions "Time horizon": Our analysts make recommendations on a 6-9 month time horizon. In other words, they expect a given stock to reach their target price within that time.
"Fair value": We estimate fair value per share for every stock we cover. This is normally based on widely accepted methods appropriate to the stock or sector under consideration, e.g. DCF (discounted cash flow) or SoTP (sum of the parts) analysis.
"Target price": This may be identical to estimated fair value per share, but is not necessarily the same. There may be very good reasons why a share price is unlikely to reach fair value within our time horizon. In such a case we set a target price which differs from estimated fair value per share, and explain our reasons for doing so.
Please note that the achievement of any price target may be impeded by general market and economic trends and other external factors, or if a company’s profits or operating performance exceed or fall short of our expectations.
Contact us
Pritish Devassy, CFA Senior Research Analyst Tel : +966 11 211 9370 Email: [email protected] Al Rajhi Capital is licensed by the Saudi Arabian Capital Market Authority, License No. 07068/37.