Saudi Economic Perspectives - AlAhli · Saudi Economic Perspectives 2014 ... from the heydays of...
19
Saudi Economic Perspectives 2014 - 2015 Growth Moderation on the Horizon
Transcript of Saudi Economic Perspectives - AlAhli · Saudi Economic Perspectives 2014 ... from the heydays of...

1
Saudi Economic Perspectives
2014 - 2015
Growth Moderation on the Horizon
Contents
Executive Summary 1
2014 and 2015 Projections 2
1. Global Economic Developments 3
2. Saudi Economic Develpments and Outlook 8
2.1 Real sector 8
2.2 Fiscal and External Balances 11
2.3 Monetary Developments 13
2.4 Financial Sector 15
2.5 Risks 17
Said A. Al ShaikhGroup Chief Economist
Authors
Tamer El ZayatSenior Economist/Editor
Majed A. Al-GhalibSenior Economist
[email protected] Sources: SAMA and NCB
Growth Moderation on the Horizon
• The world economy will continue to experience a multi-stage growth, given thedivergenteconomicoutlooksfortheadvancedandemergingcountries,aninflectionfromtheheydaysofthecrisiswhentheemergingeconomieswerethelocomotiveforgrowth.Thedeviationon interest ratesbetweentheemergingeconomiesandtheirdevelopedcounterparts is expected towiden, in contrast to2008and2009wherebyaccommodativepolicieswereadoptedacrosstheboard.TheInternationalMonetaryFund(IMF)projectshigherglobalgrowthin2014and2015at3.6%and3.9%,respectively,yetbelowthe5.1%registeredin2010.
• Lastyearmarkedtheslowesteconomicgrowthratesince2009,andwedobelievethattheKingdomwillfaceamoderatebusinesscycleduring2014and2015,growingaround 4%. In 2013, growth in realGDP decelerated to 4%,mainly against thebackdropofthenegativecontributionfromtheoilsector,stemmingfroma lowerproduction level.WeprojectrealGDPgrowthof4.3%for2014drivenbynon-oilsectorgrowththatwillpost5.4%,withoilmaintainingitsnegativecontribution.
• Libya’sunstableproductionsince2011inadditiontotheEUsanctionsonIran’scrudeexportsthatcommencedinJuly2012enabledtheKingdomasaswingproducertoreacha30-yearhighdailyproduction,butthissituationisreversingonthebackofnon-OPECsupplyandanexpectedriseinproductionfromthetwoaforementionedcountries,albeitslowly.Thus,wedobelievethattheKingdomingivingwaytothesecountrieswillbeproducingbelowthe10MMBDmarkduringthenextthreeyears.Accordingtoourestimates,Arabianlightpriceswillremainrange-bound,protectedatafloorofUSD90/bblin2014,withSaudicrudeoilproductionexpectedtoslightlyfallbyanaverageof40thousandb/d,reaching9.6MMBD,whichwillresultinlowercurrentaccount and fiscal account surpluses and a marginal increase in net foreign assets.
• Themonetarysituationremainsinavirtuouscyclewithbroadereconomicactivities,supportedbySAMA’spoliciesthatenhancedtheoperatingenvironmentforbanks.ThefavorableeconomicbackdrophasobviouslyhelpedSAMAinrecentyears,withnorecoursetounconventionalmonetarytools.Asustainablelevelofcredit,elevatedexcess reservesanda range-bound inflationwill justifyawaitandseestrategybySAMAinthemedium-term.SAMAisexpectedtomaintaintherepoandreversereporatesat2%and0.25%,respectively,sincetheFedisn’texpectedtoraiseitstargetfundsrateuntil2016.
• Theglobal economy isno longeron theedgeof theabyss,with sovereign creditrisks recedingtremendously,asevident fromthe lowyieldsonperipheralEurope’sdebt,theabilityofGreeceandIrelandtoreturntothebondmarketsandabipartisanbudget deal that relatively ended three years of impasse and fiscal instability in theUnitedStates.Yetstructural imbalancesacrossperipheralEuropeandUSfiscalsustainabilitywillcontinuetohangasacloudofuncertaintyovertheworldeconomyin the medium to long-run. During 2014, downside risks pertaining to China’sgrowthstorywillbepivotal,especiallythatthesecond-largesteconomyviatradeandfinancial linkagesmightweighnegativelyontheglobaleconomy.Additionally,theCrimeanstandoffremainsakeyconcern.AlthoughapossiblefullscalewarbetweenRussiaandtheUkraineishighlyunlikely,theinflammatoryrhetoricwilldisruptenergymarketsoccasionally.Theunfoldingsituation in Iraq isalsoacauseofconcernonregional stability and might relatively increase the risk premium built into oil prices.
Y/Y Growth in Non-oil Sector, ContributionY/Y Growth in Oil Sector, ContributionReal GDP Growth
-4%
-2%
0%
2%
4%
6%
8%
10%
2008 2009 2010 2011 2012 2013P 2014F 2015F
Business Cycles in KSA
2007

2
Real Sector
WeightedAverageKSACrudeSpotPrice,ArabLight,USD/BBL 77.6 108.1 110.2 106.4 102.0 100.0 105.6 5M14
AverageDailyCrudeOilProduction,MMBD 8.2 9.3 9.8 9.6 9.6 9.7 9.7 5M14
GDPatCurrentMarketPrices,SARbillion 1,975.5 2,510.7 2,752.3 2,806.7 2,877.08 2,902.8 - -
GDPatCurrentMarketPrices,USDbillion 526.8 670.4 734.9 749.4 768.2 775.1 - -
RealGDPGrowthRate 7.4% 8.6% 5.8% 4.0% 4.3% 3.9% - -
OilSectorGDPGrowthRate 0.3% 11.0% 5.7% -1.0% -0.2% 1.7% - -
Non-oilSectorGDPGrowthRate 9.6% 8.0% 5.8% 5.4% 5.4% 4.5% - -
Population,million 27.6 28.4 29.2 30.0 30.7 31.4 - -
PopulationGrowthRate 3.4% 2.9% 2.9% 2.7% 2.5% 2.0% - -
GDP/Capita,USD 19,112.7 23,625.3 25,172.6 24,986.4 25,533.7 25,264.5 - -
CPIInflation,Y/Y%Change,Average 3.8% 3.7% 2.9% 3.5% 3.0% 3.2% 2.7% May-14
External Sector
MerchandiseTradeBalance,USDbillion 153.7 244.7 246.6 222.7 206.1 197.7 - -
OilExports,USDbillion 215.2 317.6 341.6 324.9 303.1 294.6 - -
Non-oilExports,USDbillion 35.9 47.1 51.0 54.1 57.7 60.3 - -
MerchandiseImports,USDbillion (96.7) (119.0) (140.7) (152.0) (154.7) (157.2) - -
InvisiblesTradeBalance,USDbillion (87.0) (86.2) (81.8) (90.1) (82.6) (83.6) - -
NetFactorIncome,USDbillion 7.0 9.7 11.0 10.8 11.4 13 - -
NetUnilateralTransfers,USDbillion (27.9) (29.4) (30.4) (35.9) (38.7) (40) - -
CurrentAccountBalance,USDbillion 66.8 158.5 164.8 132.6 123.5 114.1 - -
CurrentAccountBalance/GDP 12.7% 23.6% 22.4% 17.7% 15.7% 14.4% - -
NetForeignAssetswithSAMA,USDbillion 441.0 535.9 648.5 717.7 753.6 791.3 729.6 Apr-14
Fiscal Sector (Central Government)
BudgetedExpenditure,SARbillion 540.0 580.0 690.0 820.0 855.0 914.9 - -
ActualRevenues,SARbillion 741.6 1117.8 1247.4 1156.4 1089.7 1066.0 - -
ActualExpenditure,SARbillion 653.9 826.7 873.3 976.0 1005.3 1035.5 - -
ExpenditureOverrun,% 21.1% 42.5% 26.6% 19.0% 17.6% 13.2% - -
TotalRevenues/GDP 37.5% 44.5% 45.3% 41.2% 37.1% 35.9% - -
TotalExpenditure/GDP 33.1% 32.9% 31.7% 34.8% 34.2% 34.9% - -
OverallBudgetBalance,SARbillion 87.7 291.1 374.1 180.3 84.4 30.6 - -
BudgetBalance/GDP 4.4% 11.6% 13.6% 6.4% 2.9% 1.0% - -
Break-EvenOilPrice 64.1 75.3 73.9 82.6 87.1 90.1 - -
Financial Sector
USD/SARExchangeRate 3.75 3.75 3.75 3.75 3.75 3.75 3.75 Apr-14
GrowthinBroadMoney(M3) 5.0% 13.3% 13.9% 10.9% 11.7% 9.5% 13.3% Apr-14
GrowthinCredittothePrivateSector 4.8% 11.0% 16.4% 12.1% 11.4% 11.0% 12.0% Apr-14
Average3MSARDepositRate 0.7% 0.7% 0.9% 1.0% 0.9% 1.2% 1.0% 4M14
Average3MUSDDepositRate 0.3% 0.3% 0.4% 0.3% 0.3% 0.5% 0.3% 4M14
Spread,inBasisPoints,SAIBOR-LIBOR 39.8 40.9 55.2 68.7 60.0 70.0 69.4 4M14
2014 and 2015 Projections
Ourmacroeconomicprojectionsarebasedonanaveragecrudeoilprice(ArabianLight)ofUSD102/bblandanaveragedailycrudeoilproductionlevelof9.6MMBD(outofwhich77%isexported)in2014.Thedecreaseinoilrevenueswillweighnegativelyonthefiscalandcurrentaccountsurplusesthatwillfallinpercentagetermsto2.9%and15.7%outofGDP,respectively.RealGDPgrowthisexpectedtoriseby4.3%,duemainlytoanexpectedgrowthinnon-oilsectorby5.4%,drivenbytheprivatesectorthatwilloffsetthenegativecontributionofoil.Thekeybeneficiariesin2014willremaintobetheconstructionandmanufacturingsectors,growingat6%and5%,respectively.Ourprojectionsforthetwosectorsaresupportedbybuoyantactivityintheprojects’marketandstrongbusinessconfidence.Lookingahead,eventhoughtheKingdommighthavedecoupledfromtherestoftheworldduringthefinancialcrisiswhetheritbeonthemacroeconomicorthebankingfront,thenextfiveyearsmightprovetobeachallengingtimeforpolicymaking.Range-boundcrudeoilpricesandreducedproductionmightmaterialize,withtheincreasedpossibilityofoversupplyfromOPECandnon-OPEC,whichwillweighnegativelyonoilrevenuesandwill reversetheheftytwinsurplusesofrecentyears.Against thisbackdrop, thegovernmentmighthave toprudentlymanage its risingexpenditureand/ordeploy the substantial net foreign assets and the unutilized debt capacity that can act as countercyclical buffers that smoothoutthebusinesscycle if itsurprisedtothedownside,anunlikelyscenario,giventheresilienceoftheSaudibankingandcorporatesectors.Yet,wearemoreinclinedtofavortheformercourseofactionthatcontainsthegrowthinexpendituresinceitwillmitigateanymediumtolong-termconcernspertainingtofiscalsustainability.
Key Macroeconomic Indicators
Sources: Reuters, SAMA and NCB
2010 2011 2012 2013P 2014F 2015F Latest Date
NCB PERSPECTIVES | JUNE 2014
3
A. Global Economic Developments
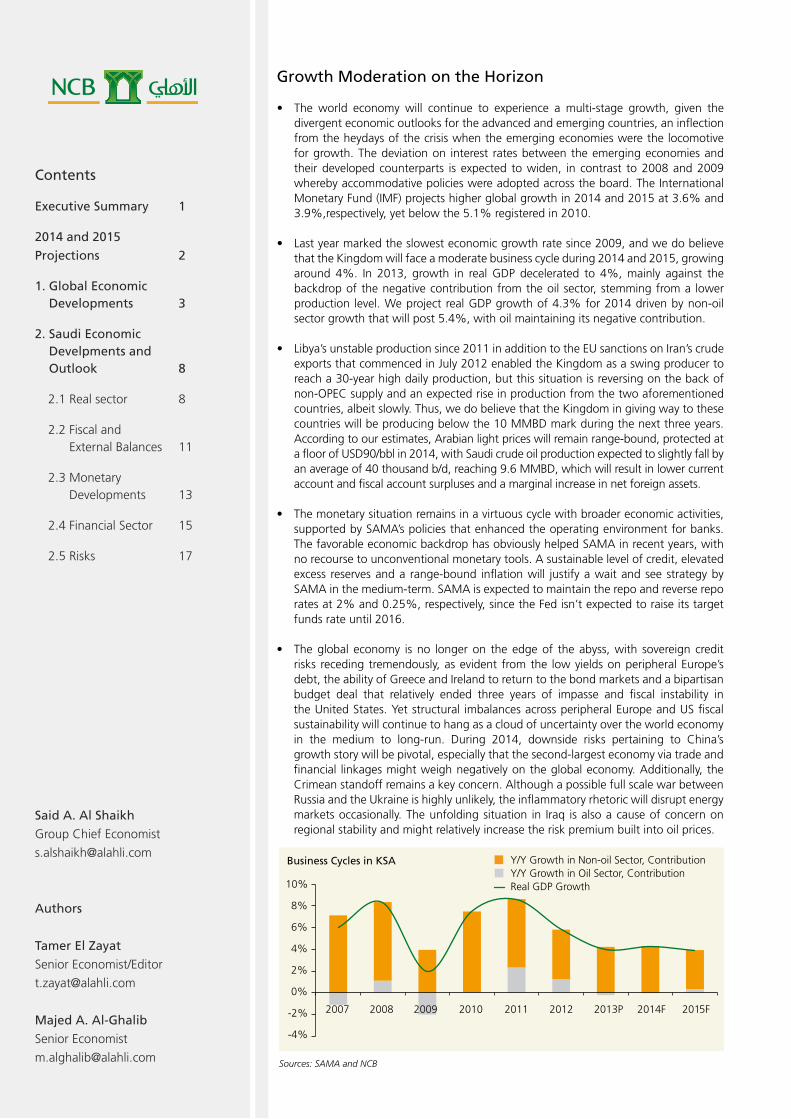
Global economic growth inched lower to 3% in 2013, with advanced and emerging economies failing to act as catalysts for recovery.However,theInternationalMonetaryFund(IMF)projectshigherglobalgrowthin2014at3.6%,supportedbyeconomicgrowthintheadvancedeconomies,notablytheUS,GermanyandtheUK.Incontrast,theemergingeconomieswillmaintainalackluster4.9%,whichisfarbelowthe7.4%recordedin2010,withtheinternationalorganizationcitingcapitaloutflowsandinflationarypressuresasdownsiderisksforthisyear.Inouropinion,therecentratehikesbytheCentralBankofTurkey,theReserveBankofIndiaandtheCentralBankofBrazilisatrendthatwillcontinuein2014andwellinto2015,thus,thedivergenceoninterestratesbetweentheemergingeconomiesandtheirdevelopedcounterpartsisexpectedtowiden,incontrastto2008 and 2009whereby accommodative policieswere adopted across the board. Themassive liquidity thathadbeeninjectedbythedevelopedworld’scentralbanksandoverheatedemergingmarketssince2008,intheprocessconcealingtheirailments,isnolongerinplacewiththetaperingexerciseinfullswing.Thus,Weexpectpressureson thoseemergingmarkets that suffer fromstructuraldeficiencies.Mostnotable, Indonesia, India,SouthAfrica,BrazilandTurkeyaregoingtofacecapitaloutflows,weakercurrenciesandhigherinterestratesontheirpublicdebt.Monetarypolicywillbeinabalancingactbetweenencouragingeconomicgrowth,supportingcurrencies and containing inflation, objectives at odds and necessitate different policymixes.Ostensibly, theworldeconomywillcontinuetoexperienceamulti-stagegrowth,giventhedivergenteconomicoutlooksfortheadvancedandemergingcountries,aninflectionfromtheheydaysofthecrisiswhenthedevelopingeconomieswerethelocomotiveforgrowth.
Commodity analysts are predicting that the “super cycle” of gains that saw prices more than double in the past decade has ended, with emerging market growth weakening and China’s economic growth moderating.In2013,Commoditieshadregisteredthethirdannualdropinarow,withtheS&PGoldmanSachsCommodityIndexof24commoditiesandReuters/JefferiesCRBIndexof19commoditieslosingaround2.2%and0.94%,respectively.Thedismalfortunesforthesemajorcommodityindiceswerefundamentallydrivennotonlybydemandconcerns,butalsobytheimprovedsupplyoutlookforsomecommoditiesaswellassupplyoverhangsforothers.Ontheagriculturefront,cornwasthebiggestloser,plungingbyaround40%,asUSsupplyedgedhigherbyastaggering30%toarecord355.3millionmetrictons,accordingtotheUSDepartmentofAgriculture.However,thereisarelativereboundinagriculturecommoditiesthisyear,withtheS&PGoldmanSachsAgricultureIndexgainingadouble-digit16.4%by theendof thefirstquarter. The fact thatChina is the largestglobalconsumerofbasemetalsweighedoncopperandaluminumin2013thatregistereddeclinesof7.2%and13.2%,respectively.And,itseemsthat2014doesnotlookanybetter,withcopperandaluminumfallingby9.4%and2.3%year-to-date.TheallureofpreciousmetalsfadedasdatabecameincreasinglypositivefromtheUSand
Sources: IMF Sources: Thomson Reuters
Advanced economies
Emerging and developing economies
World
1. Global GDP Growth(Annual % change)
-10%
-5%
0%
5%
10%
15%
1970
1975
1980
1985
1990
1995
2000
2005
2010
2015
2. Selected Commodity Price Indices(S&P Goldman Sachs Spot Indices; January 2004 = 100)
-50%
0%
50%
100%
150%
200%
250%
300%
350%
400%
Jan-
04
Jan-
05
Jan-
06
Jan-
07
Jan-
08
Jan-
09
Jan-
10
Jan-
11
Jan-
12
Jan-
13
Jan-
14
AgricultureIndustrialPrecious MetalsPetroleum
4
Europe,withinvestorsembracingequitiesandelevatingglobalstockpricesbythehighest infouryears.GoldendedlastyeararoundUSD1,200/Ozmark,a28%annualdecline,thefirstannualdropsince2000,asinvestorswithdrewUSD38.6billionfromgoldfunds.Ontheinvestmentfront,riskaversionwasapparentfromthereducedinflowstocommodity-relatedexchange-tradedproductsthatfellbyarecordUSD88billiontoUSD332billionin2013.Lookingforwardinto2014,commoditiesmightrecoverpartofthelossesincurredlastyearduetobaseeffects,butitishighlyunlikelythatwewillwitnessanysubstantialand/orsustainablegains.
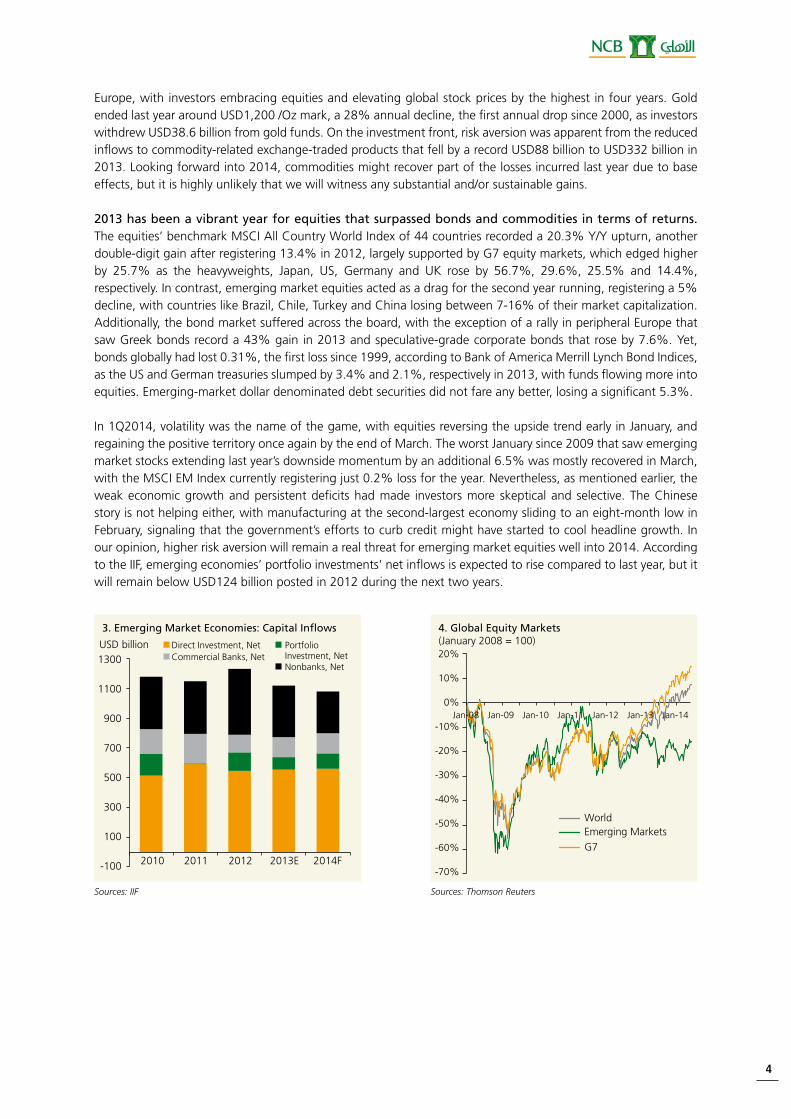
2013 has been a vibrant year for equities that surpassed bonds and commodities in terms of returns. Theequities’benchmarkMSCIAllCountryWorldIndexof44countriesrecordeda20.3%Y/Yupturn,anotherdouble-digitgainafterregistering13.4%in2012,largelysupportedbyG7equitymarkets,whichedgedhigherby 25.7% as the heavyweights, Japan, US, Germany and UK rose by 56.7%, 29.6%, 25.5% and 14.4%,respectively.Incontrast,emergingmarketequitiesactedasadragforthesecondyearrunning,registeringa5%decline,withcountrieslikeBrazil,Chile,TurkeyandChinalosingbetween7-16%oftheirmarketcapitalization.Additionally,thebondmarketsufferedacrosstheboard,withtheexceptionofarallyinperipheralEuropethatsawGreekbondsrecorda43%gainin2013andspeculative-gradecorporatebondsthatroseby7.6%.Yet,bondsgloballyhadlost0.31%,thefirstlosssince1999,accordingtoBankofAmericaMerrillLynchBondIndices,astheUSandGermantreasuriesslumpedby3.4%and2.1%,respectivelyin2013,withfundsflowingmoreintoequities.Emerging-marketdollardenominateddebtsecuritiesdidnotfareanybetter,losingasignificant5.3%.
In1Q2014,volatilitywasthenameofthegame,withequitiesreversingtheupsidetrendearlyinJanuary,andregainingthepositiveterritoryonceagainbytheendofMarch.TheworstJanuarysince2009thatsawemergingmarketstocksextendinglastyear’sdownsidemomentumbyanadditional6.5%wasmostlyrecoveredinMarch,withtheMSCIEMIndexcurrentlyregisteringjust0.2%lossfortheyear.Nevertheless,asmentionedearlier,theweakeconomicgrowthandpersistentdeficitshadmade investorsmore skepticaland selective.TheChinesestoryisnothelpingeither,withmanufacturingatthesecond-largesteconomyslidingtoaneight-monthlowinFebruary,signalingthatthegovernment’seffortstocurbcreditmighthavestartedtocoolheadlinegrowth.Inouropinion,higherriskaversionwillremainarealthreatforemergingmarketequitieswellinto2014.AccordingtotheIIF,emergingeconomies’portfolioinvestments’netinflowsisexpectedtorisecomparedtolastyear,butitwillremainbelowUSD124billionpostedin2012duringthenexttwoyears.
4. Global Equity Markets(January 2008 = 100)20%
10%
0%
-10%
-20%
-30%
-40%
-50%
-60%
-70%
Jan-08 Jan-09 Jan-10 Jan-11 Jan-12 Jan-13 Jan-14
WorldEmerging MarketsG7
3. Emerging Market Economies: Capital Inflows
2010 2011 2012 2013E 2014F
1300
1100
900
700
500
300
100
-100
USD billion Direct Investment, Net Portfolio Investment, NetCommercial Banks, NetNonbanks, Net
Sources: IIF Sources: Thomson Reuters
NCB PERSPECTIVES | JUNE 2014
5
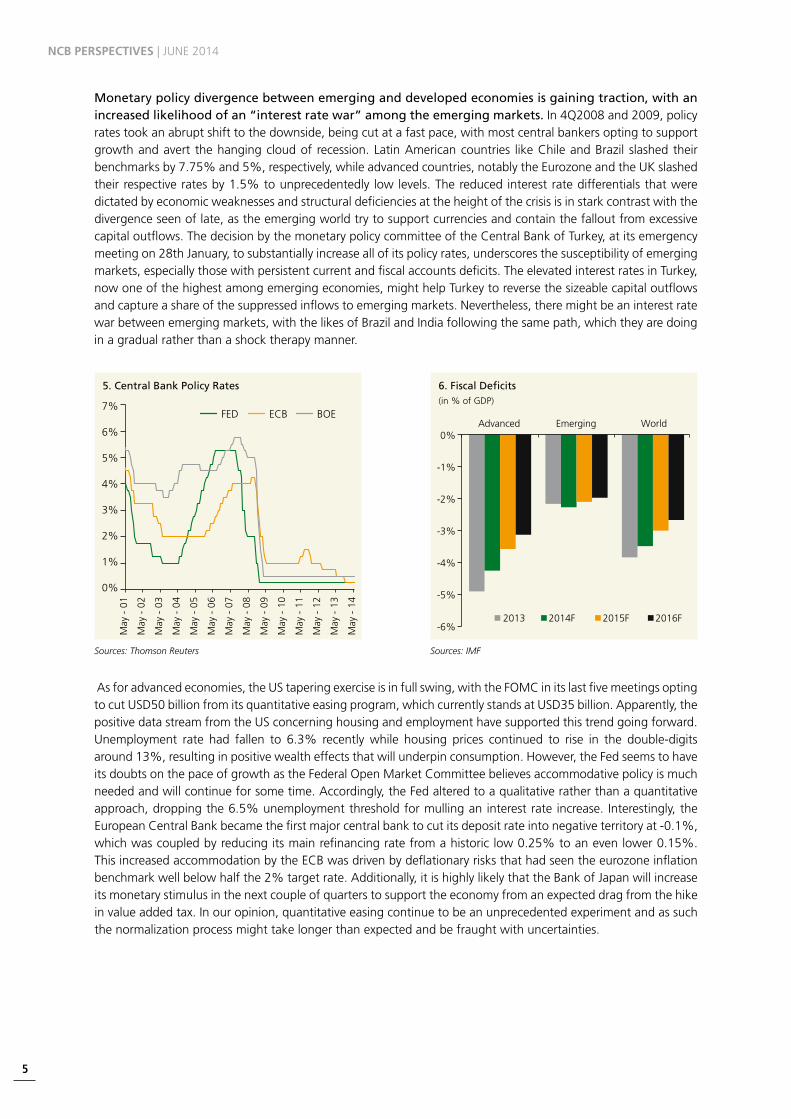
Monetary policy divergence between emerging and developed economies is gaining traction, with an increased likelihood of an “interest rate war” among the emerging markets.In4Q2008and2009,policyratestookanabruptshifttothedownside,beingcutatafastpace,withmostcentralbankersoptingtosupportgrowthandavert thehangingcloudof recession.LatinAmericancountries likeChileandBrazil slashedtheirbenchmarksby7.75%and5%,respectively,whileadvancedcountries,notablytheEurozoneandtheUKslashedtheirrespectiveratesby1.5%tounprecedentedly lowlevels.Thereducedinterestratedifferentialsthatweredictatedbyeconomicweaknessesandstructuraldeficienciesattheheightofthecrisisisinstarkcontrastwiththedivergenceseenoflate,astheemergingworldtrytosupportcurrenciesandcontainthefalloutfromexcessivecapitaloutflows.ThedecisionbythemonetarypolicycommitteeoftheCentralBankofTurkey,atitsemergencymeetingon28thJanuary,tosubstantiallyincreaseallofitspolicyrates,underscoresthesusceptibilityofemergingmarkets,especiallythosewithpersistentcurrentandfiscalaccountsdeficits.TheelevatedinterestratesinTurkey,nowoneofthehighestamongemergingeconomies,mighthelpTurkeytoreversethesizeablecapitaloutflowsandcaptureashareofthesuppressedinflowstoemergingmarkets.Nevertheless,theremightbeaninterestratewarbetweenemergingmarkets,withthelikesofBrazilandIndiafollowingthesamepath,whichtheyaredoingin a gradual rather than a shock therapy manner.
FED ECB BOE
5. Central Bank Policy Rates
7%
6%
5%
4%
3%
2%
1%
0%
May
- 0
1
May
- 0
2
May
- 0
3
May
- 0
4
May
- 0
5
May
- 0
6
May
- 0
7
May
- 0
8
May
- 0
9
May
- 1
0
May
- 1
1
May
- 1
2
May
- 1
3
May
- 1
4
6. Fiscal Deficits(in % of GDP)
0%
-1%
-2%
-3%
-4%
-5%
-6%2013 2014F 2015F 2016F
Advanced Emerging World
Sources: Thomson Reuters Sources: IMF
Asforadvancedeconomies,theUStaperingexerciseisinfullswing,withtheFOMCinitslastfivemeetingsoptingtocutUSD50billionfromitsquantitativeeasingprogram,whichcurrentlystandsatUSD35billion.Apparently,thepositivedatastreamfromtheUSconcerninghousingandemploymenthavesupportedthistrendgoingforward.Unemployment rate had fallen to 6.3% recentlywhile housing prices continued to rise in the double-digitsaround13%,resultinginpositivewealtheffectsthatwillunderpinconsumption.However,theFedseemstohaveitsdoubtsonthepaceofgrowthastheFederalOpenMarketCommitteebelievesaccommodativepolicyismuchneededandwillcontinueforsometime.Accordingly,theFedalteredtoaqualitativeratherthanaquantitativeapproach,droppingthe6.5%unemploymentthresholdformullinganinterestrateincrease. Interestingly,theEuropeanCentralBankbecamethefirstmajorcentralbanktocutitsdepositrateintonegativeterritoryat-0.1%,whichwascoupledbyreducingitsmainrefinancingratefromahistoriclow0.25%toanevenlower0.15%.ThisincreasedaccommodationbytheECBwasdrivenbydeflationaryrisksthathadseentheeurozoneinflationbenchmarkwellbelowhalfthe2%targetrate.Additionally,itishighlylikelythattheBankofJapanwillincreaseitsmonetarystimulusinthenextcoupleofquarterstosupporttheeconomyfromanexpecteddragfromthehikeinvalueaddedtax.Inouropinion,quantitativeeasingcontinuetobeanunprecedentedexperimentandassuchthenormalizationprocessmighttakelongerthanexpectedandbefraughtwithuncertainties.

6
Even though fiscal consolidation remains a priority for most countries, China and Japan might opt for fiscal stimuli in 2014. ThedisappointingeconomicindicatorsfromChinaareincreasinglypointingtowardsapossibledeviationfromthe7.5%growthtargetsetbytheStateCouncilinMarch.Asaresult,thegovernmenthasannouncedinAprilamini-stimulusthatincludesrailwayspending,expansionofcredittosmall-scaleenterprisesandextensionofcreditforpurchasingcheaphomes.Eventhough,suchmeasurescannotbecomparedtothe4trillionYuanpackageduringthefinancialcrisis,wedobelievethattheChineseauthoritieswillstepuptheireffortstosupporteconomicgrowthtoavertsocialunrest.Inouropinion,thecommunistpartydocument,whichhave been issued in November 12th and entailed plans to increase the role of consumption and market forces at theexpenseofexportsandstate-ledinvestment,isalong-termstrategythatwillnotchangethegovernment’sfixationwithshort-termgrowth.Additionally,ontheJapanesefront,theincreaseinvalueaddedtaxfrom5%to8%anditsexpecteddragontheeconomymightforcethegovernmenttocompileanotherfiscalstimuluspackagethisyear.Infact,theJapanesefinanceministryhasannouncedplanstospend40%oftheoutlaysforthefiscalyearstartingAprilin2Q2014tomitigatetheweaknessinhouseholdconsumption.However,incontrasttoChina,Japan’sfinancesareindireshapegiventhepersistenttradeandbudgetdeficits,whichwilllimitthescopeand magnitude of additional fiscal spending.
Box 1: Oil… Range-Bound Movement in 2014
Crudeoilpricesended lastyear intheredafter fourconsecutiveannual increases,withthetwobenchmarksBrentandtheArabianlightfallingby2.6%and3.5%,respectively.Thefirstannualdecline,sincethedouble-digitplungewitnessedin2009,waslargelydrivenbydemanddownsiderisksthatemanatedfromweakeningChineseeconomicdataandthepossibledragsonemergingmarkets,giventhetradelinkageswiththeworld’ssecond-largesteconomy.Nevertheless,thedownsidetrajectorywouldhavebeensignificantifnotforthesupplydisruptionsandconcerns,notably,theslumpinLibya’soilsuppliessinceJulyandinstabilityinSouthSudan.Ontheinventoryfront,themarketslookwellsuppliedwhencrudeoilstocksintheOECDisassessedespeciallywiththeforwarddemandcoveratacomfortable55.3daysattheendoflastyear,albeitlowerthanthefive-yearaverageof 58 days.
Onthesupplyfrontin2014,itseemsthegeopoliticaluncertaintyintheMiddleEast,theUkrainian/RussianstandoffoverCrimeaandsupplydisruptionsfromsomeOPECmemberswillcontinueforsometime,thus,sustainingthistightmarketbalanceandriskpremiumduringthenearterm.Thiswillrelativelybalancetherisingoutputfromnon-OPECproducersthataccountsfor60%ofglobalproduction,mainlyfromtheUS,CanadaandBrazil.Webelievethattheoversupplytheme,pertainingtoOPEC,thathavebeenpropagatedbytheendoflastyear,amidspeculationthatIranandLibyawillbeabletorestoresuppliesrestrainedrespectivelybysanctionsandpoliticalunrest,willnotmaterializethisyear,giventhatmajorLibyanexportportscontinuetobedisruptedbyinfightingbetweenmilitantgroups.Additionally,eventhoughIraniancrudeproductionhavebeenincreasingoflateafteraninterimaccordthateasedrestrictionscameintoeffectinJanuary,thetalkswithWesterncounterpartsinJulyregardingTehran’snuclearprogrammightbecomplicated,asalways.Againstthisbackdrop,OPEC’sproductionwillbecriticalinsupportingpricesinanenvironmentofrisingnon-OPECsupplyandiftheunlikelybecamelikely,asurgeinIranianandLibyancrudeexports.ThefactthatOPEC’soilproductionwasbelowthe30MMBDquota,agreedinDecember2011,forfiveoutofthelastsevenmonthssinceSeptember2013,reflectsadamancytomaintainasemblanceofnormalcyintheoilmarkets.Yet,theissueofaccommodatingthereturnofIran,LibyaandIraqwillcontinuetoposemedium-termchallengesonOPEC,especiallyforSaudiArabiathatbenefitedfromrampingupitsproduction,givenitsswingproducerstatus.
Theoildemandoutlookhasrelativelyimprovedonthebackofhigherdemandandastrongerglobaleconomy,withtheworld’sGDPexpectedtogrowby3.6%in2014,higherthanthe3%registeredlastyear.Non-OECDcountries, ledbyChina,willaccountforalmostalloftheexpectedconsumptiongrowthduringthenexttwoyears.Accordingly,theIEAhadincreaseditsworldwidecrudeconsumptionforecast,projectinganincrementalgrowthof1.4MMBDin2014,a1.5%annualgrowthrate.TheEIAandOPEC,aftersimilarupwardrevisions,are

NCB PERSPECTIVES | JUNE 2014
7
Sources: EIA Sources: EIA
Real GDP Growth, Contribution
0
20
40
60
80
100
120
80
82
84
86
88
90
92
94
96
1Q10 1Q11 1Q12 1Q13 1Q14 1Q15
USD/bblMMBD World Demand, LHSWTI, RHS
Projections
OECD Forward Demand Cover
40
45
50
55
60
65
May
-09
May
-10
May
-11
May
-12
May
-13
May
-14
Days
anticipatingincreasesbyaround1.2MMBDand1.1MMBD,respectively,in2014.Eventhoughglobaleconomicactivityhasimprovedlately,downsideriskspertainingtoChina’sgrowthstoryprevail.Ingenerating40-50%oftotalincrementaloildemandinrecentyears,Chinawillremainpivotalininfluencingoilmarketfundamentals,thus,alowerheadlinegrowthrateforthesecond-largestoilconsumerwillexertpressureonoilprices.However,theChineseStateCouncilandthePBOClookmore inclinedtowardstargetedstimulusandmonetaryeasing,whichmightreduceconcernsfortheremainderof2014.However,onamedium-termnote,thedrivetowardsrebalancingtheeconomy,reducingenvironmentaldegradationandencouragingmarketforces,willnegativelyimpactChineseincrementaloildemand,untiltheneededtransitionends.
Toconclude,Wedobelievethatoilmarketsareexpectedtoremain ina range-boundmovementduringtheyear,especiallythatoillacksstrongdirectionalmomentumforBrentpricestoremainabovetheUSD110/barrelmark,asincreasedsuppliesfromnon-OPECproducersareexpectedtooffsetdownsideriskspertainingtoChina’seconomicgrowth.Yet,asmentionedearlier,OPECwillbeinstrumentalinmitigatingsupplyconcernsbybalancingoutthemarket.Hence,weseeArabianlightpricesprotectedatafloorofUSD90/bblandonaveragetosettleatUSD102/bblin2014.
TheunfoldingsituationinIraqwouldposeanupsiderisktoourforecast,withthecentralgovernmentlosingitsgriponthesecond-largestcity,Mosul.Thisheightenedgeopoliticaluncertaintymightmeanarelativelyhigherriskpremiumtobebuilt intooilpricesgoingforward. It isourownopinion,however,thatthemarketshavebeen largely factoring in geopolitical risks in prices especially that the region has not experienced a semblance of normalcyinalongtime.Currently,theimpactonIraq'scrudeoilexportsislimitedespeciallythattheconflictiscontainedinthewesternandnorthernpartsofthecountryandfarfromthesouth,whichhousethree-quartersofIraq'scrudeoutput.Thethreebiggestoilfields,namelyRumaila,MajnoonandWestQurna-2,aswellastheexportterminalofBasralieinthesouth,andassuchasignificantdropinoutputandexportsishighlyunlikelyfortheshort-termatleast.

8
B. Saudi Economic Developments and Outlook
I. Real Sector
Last year marked the slowest economic growth rate since 2009, and we do believe that the Kingdom will face a moderate business cycle during 2014 and 2015, growing around 4%. In 2013, growth inaggregateoutput,realGDP,deceleratedto4%,mainlyagainstthebackdropofthenegativecontributionfromtheoilsector,stemmingfromalowerproductionlevel.Saudioiloutputfellbyaround1.6%in2013,averaging9.64MMBD,whichweighednegativelyontheoilsectorGDPthatdeclinedby1%,thelargestcontractionsince2009.Nevertheless,thecontractionintheoilsectorwasmorethanoffsetbynon-oilGDPgrowththatgrewbyaround5.4%.Importantly,thenon-oilprivatesectorincreasedby5.97%Y/Y,drivenbyconstruction,trade,andmanufacturing.Theeconomicgrowthoutlookfor2014willcontinuetobedrivenbynon-oilgrowth,withoilmaintainingitsnegativecontribution.WeprojectrealGDPgrowthof4.3%for2014duemainlytothenon-oilsectormaintaininglastyear’spaceof5.4%,drivenbytheprivatesector,mainlymanufacturingandconstruction.Ourassumptioncentersonatightmarketbalanceinoilmarketsthatlimitstheupsidepotentialforcrudepricesand results in a marginal decline in Saudi oil production during the forecast period.
Contribution of the oil sector to economic growth will remain negative. Libya’sunstableproductionsince2011inadditiontotheEUsanctionsonIran’scrudeexportsthatcommencedinJuly2012enabledtheKingdomasaswingproducertoreacha30-yearhighdailyproduction,butthissituationisreversingonthebackofnon-OPECsupplyandanexpectedriseinproductionfromthetwoaforementionedcountriesduringthenextcoupleofyears.Accordingly, complianceamongOPECmembershasbeen risingsince July2013,with theKingdomcuttingitsproductionlevelsfromaround10.05MMBDinAugustandSeptember2013toaslowas9.60MMBDinMarch.Thus,wedobelievethattheKingdomingivingwaytothesecountrieswillbeproducingbelowthe10MMBDmarkduringthenextthreeyears.Accordingtoourestimates,Saudicrudeoilproductionisexpectedtofallbyanaverageofonly40thousandb/d,reaching9.6MMBD,whichwillweighnegativelyonrealoilGDPthatwillcontractby0.2%in2014.Furthermore,innominalterms,withtheweightedaverageArablightpricesfallingfromUSD106.4/bbl in2013toestimatedUSD102/bbl in2014,oil revenuesareexpectedtoplungeby6.8%toaroundSAR965billion,belowtheSAR1trillionmarkthathasbeenregisteredoverthelastthreeyears.Ourbaselinescenarioforthemedium-termthatprojectsrange-boundmovementinoilpricesandslowergrowthinSaudicrudeproductionwillnecessitatefiscalprudencegoingforward.
7. Real GDP Growth, Contribution
-2%
0%
2%
4%
6%
8%
10%
2010 2011 2012 2013P 2014F 2015F
OilNon-oil PublicNon-oil Private
Real GDP
8. Saudi Crude Oil Production
7.00
7.50
8.00
8.50
9.00
9.50
10.00
2008 2009 2010 2011 2012 2013P 2014F 2015F
MMBD
Sources: SAMA and NCB Sources: OPEC and NCB

NCB PERSPECTIVES | JUNE 2014
9
The non-oil sector will be the driving force for economic growth in 2014, remaining above the 5% threshold for the third year in a row.Realnon-oilGDPin2013grewbyaround5.4%,largelydrivenbythestellarperformanceofthenon-oilprivatesector.TheprivatesectormaintaineditssignificantcontributiontorealGDPat58.9%,growingby5.97%,whichillustratesthevibrantrolethatprivateenterprisesareassumingintheSaudieconomy.Themaindriversofprivatesectorgrowthweretheconstruction,retail,andthemanufacturingsectors,whichposted8.8%,6.6%and5.3%annualgrowth, respectively.Thisvibrancyof theprivatesectoremanated from the enhanced business confidence and the improved financing environment. Evidently, thegrowth in commerce andmanufacturing benefited from the pickup in credit, receiving SAR28.7 billion andSAR13.6billion,respectively,inincrementalloansandadvancesfrombanksin2013,whichrepresentsanannualincreaseof14%and10.7%.Theboosttobusinessconfidenceunderpinnedthevalueofawardedconstructioncontracts that registeredanall-timehigh.Oneof thepromisinggrowthdrivers forcorporateSaudi isnon-oilexportsthatreachedahistoricalUSD54.1billionlastyearandthat,inourview,willgainmomentum,alongwithdomesticdemand,giventheverticalandhorizontaldiversificationplansthatwillenhancetheabsorptivecapacityoftheeconomy.Theaforementionedbusinesscyclewilllikelymoderateonthebackofrelativelylessfavorableoildynamics,a13%reductioninthebudgetallocationforcapitalexpenditureandthetighterimplementationof labor regulations.
Acloserlookattheslowerpaceofincreaseingovernmentexpenditureandbudgetoverrunduringthelastthreeyearswillresultinarelativelylowerdirectandindirectstimuli.SincetheRoyaldecreesannouncedin2011,theannualgrowthingovernmentexpenditurehadfallenfromastaggering26.4%to11.8%coupledbyasimilarreductioninthebudgetoverrunfrom42.5%to19%,in2011and2013,respectively.Therisingconcernsonfiscalpolicysustainability,especiallyonhigherproductionoutsideOPECandrange-boundoilpriceswilllikelymakethegovernmentmoreprudentandconservative,eventhoughsubstantialnetforeignassetsandlowerdebtlevelscansustainexpansionarypolicies.Weexpectnon-oilsectorgrowthtoremainelevated,albeitlowerthanthe10-yearaverage,recording5.4%in2014,withthenon-oilprivatesectorregistering6.2%asmostsectorscontinuetoreapthebenefitsofthemyriadofprojectsstillcomingon-streamfromthe2008-2013capitalexpenditureboom.
The key beneficiaries in 2014 will remain to be the construction and manufacturing sectors, growing at 6% and 5%, respectively.Our projections for the two sectors are supported by buoyant activity in theprojects’market and strong business confidence. During 2013, the value of awarded construction contractsremainedabovetheSAR200billionthresholdforthethirdyearinarow,registeringarecordSAR293.4billion.TheawardedcontractsintherealestateandmanufacturingsectorsrespectivelyreachedSAR40billionandSAR22.3billionin2013,thesecondandthirdlargestsharesacrossallsectors,surpassedonlybythetransportationandpowersectors.Ostensibly,theroleofthegovernmentiscritical,wherebyitsignedapproximately2,441capitalexpenditurerelatedcontractswiththeprivatesectorvaluedatanestimatedSAR161.5billion,12%Y/Yincrease,according to the Ministry of Finance.
Aswepointedout,themoderationthemeishighlylikelyduringthisyearandnext,whichhadbeenunderscoredbyNCB’sBusinessOptimismIndex(BOI)thatdippedfrom54pointsin4Q2013to50pointsin2Q2014duetoapullbackinexpectationsonallparametersthatincludevolumeofsales,newordersandsellingprices.Mostofthenon-hydrocarbonsectorsareexpectedtomoderate,withtheconstructionandmanufacturingsectorsregisteringindexvaluesbelowthecompositeindexforthenon-hydrocarbonsectorin2Q2014,standingat49pointsforeach.However,manufacturingfirmsdisplayedasteadyoutlook,with67%ofthefirmsexpectinganimprovementindemandfortheirproducts.AccordingtotheBOI,respondentshavecitedgovernmentlaborregulationsandtheavailabilityoflaboraschallengesimpactingbusinessoperations.Wedobelievethatthesechallengeswillremainshort-termbottlenecksforcompaniesseekinglow-skilledexpatriateworkers,especiallyaftertherecentdecisionsbytheInteriorMinistrytotoughenpunishmentonillegals,whichcomplimentsendeavorsbytheLaborMinistryto regulate the labor market.
FDI inflows are expected to moderate going forward. Structural reformscontinueunabatedly, improvingtheKingdom’sbusinessenvironmentanditsattractivenessforforeigncapitalinflows.TheWorldBank’sDoingBusiness2014reportrankedtheKingdom26thoutof189countriesforeaseofdoingbusiness.The2013/14GlobalCompetitivenessReportpreparedbytheWorldEconomicForumalsorankedSaudiArabiaat20outof148countries,aheadofChina,Turkey,BrazilandIndia.AccordingtotheWorldInvestmentReport2013,issuedbytheUnitedNationsConferenceonTradeandDevelopment(UNCTAD),theKingdomwasthesecond-largestFDIrecipientinWestAsia,withreceiptstotalingUSD12.2billionin2012,surpassedonlybyTurkeythatpostedUSD12.4billionandfollowedbyafellowGCCmember,theUAE,thatcameinthirdwithUSD9.6billion.However,theinflowsfellby25.3%comparedtoUSD16.3billionin2011,andWebelievethatFDIwillmoderateinthenext

10
coupleofyearsmimickinganexpectedrelativeslowdownintheSaudibusinesscycleandastheprojects’marketplateau.Accordingly,theshareofFDIingrossfixedcapitalformation(GFCF)willcontinuetohoveraround10%,belowfiguresregisteredforthepreviousthreeyears,yetsignificantlyhigherthanthe1.5%averageratepostedduringtheperiod1995-2004.
Net Exports
Change in Inventory
Gross Fixed Capital Formation
Private Final Consumption Expenditure
Government FinalConsumption Expenditure
Real GDP
10. Real GDP Growth by Expenditure, Contribution
-10%
0%
10%
20%
2008 2009 2010 2011 2012
Sources: SAMA and NCB Sources: SAMA and NCB
Inflation is likely to hover around 3% this year, with the recent sharp increase in commodity prices moderating by the 2H2014 and offset by lower imported inflation. In2013,pricesedgedhigher,averaging3.5% due to higher food prices. The liquid state of the economy was supportive of higher consumptionexpenditure,whichdroveuplocalfoodpricesthataveraged5.7%Y/Y,higherthan4.5%Y/Yregisteredin2012.Ontherentalcomponent,pricesmaintainedaslightlyhigherpacethan2012,albeitlowcomparedtothe2007-2011periodbyaveraging3.5%in2013.Acceleratingtheimplementationofthemortgagelawwillpositivelyimpactthelocalrealestatemarketbyprovidingfinancingtohomeseekers.Lookingahead,thecostofbuildingmaterialsisnotexertingupwardpressureonprices,withtheaveragepricesfortimber,cables,ironandcementfallingyear-to-dateby1.7%,1.2%,0.9%and0.6%,respectively,bytheendofFebruary2014.Itisimportanttonotethattherobustgrowthinprivatecreditingeneralandconsumerloansinparticularwillconstituteanupsiderisk toour forecast forheadline inflation.Withunemploymentat the lowest level since2009,11.5%by theendof4Q2013,anexpectedincreaseindisposableincomewillboostprivateconsumptionexpenditure,whichposteda7.2%increaselastquarter.However,thedollar-positiveeffectduetotaperingwillunderpintheheadlineinflationrate,whichwillremaininarange-boundmovementaround3%thisyear.
Manufacturing
Construction
Transport andCommunication
Other Sectors
Electricity and Water
Trade, Hotels, and Restaurants
Financial, Insurance, andReal Estate Services
9. Non-oil GDP Growth, Contribution
2009 2010 2011 2012 2013P 2014F0%
2%
4%
6%
8%
10%
11. Drivers of Inflation
Renovation, Rent and Fuel
Other
Foodstuff and Beverage
Overall CPI
-2%
0%
2%
4%
6%
8%
10%
12%
Apr-08 Apr-09 Apr-10 Apr-11 Apr-12 Apr-13 Apr-14
12. Imported InflationJanuary 2010 = 100
-10%
-5%
0%
5%
10%
15%
20%
25%
Jan-
10A
pr-1
0Ju
l-10
Oct
-10
Jan-
11A
pr-1
1Ju
l-11
Oct
-11
Jan-
12A
pr-1
2Ju
l-12
Oct
-12
Jan-
13A
pr-1
3Ju
l-13
Oct
-13
Jan-
14A
pr-1
4
SAR/GBPSAR/EUR
Trade Weighted Dollar
Sources: SAMA Sources: SAMA

NCB PERSPECTIVES | JUNE 2014
11
II. Fiscal and External Balances
The next five years might prove to be a challenging time for policy making, with range-bound crude oil prices and contained production weighing negatively on oil revenues and, thus, reversing the hefty fiscal and current account surpluses of recent years. Even though the government’s 2014 budget doesnot provide oil price and production level assumptions,we believe that both revenues and expenditures areunderstated.TheMinistryofFinanceestimatesrevenuesandexpendituresatSAR855billionforeach,projectingabreak-even.Basedonannouncedrevenues,thegovernmentseemstohaveassumedtheaverageoilpriceatUSD73/bblforthisyear.WithourforecastofUSD102/bblfortheaverageArabianlightspotpricesand9.6MMBDforaverageoilproduction,weprojectabudgetsurplusofSAR84billion,or2.9%ofestimatedGDPin2014.Thedeclineinthesurpluswillbelargelyduetoafallinactualrevenues,expectedatSAR1090billion,withoilrevenuesregisteringSAR965billion,whichis6.8%belowactuallevelin2013.Additionally,ontheexpenditureside,thegovernmentwillmostlikelyexceedbudgetedexpenditures,albeitatamere3%,tobreachtheSAR1trillionmark,ashasbeenhistoricallythecase,however,thisfigurewillbethelowestbudgetoverrunsince1998.Accordingtoourforecast,actualcapitalexpenditureswilllikelyendupabovethebudgetedfigureofSAR248billiontoreachSAR251billionin2014.Againstthisbackdropofprojectedhigherexpendituresandlowerrevenues,thebreak-evenoilpricerequiredtobalancethebudgetwillrisefromUSD83/bbllastyeartoUSD87/bblin2014.
The current account balance will fall to the lowest level since 2010 in absolute terms, registering USD124 billion. Basedonouroilpriceandproductionassumptions,Weexpectoilexportrevenuestodeclineby6.7%toUSD303billion.Nevertheless,non-oilexportsareexpectedtopartiallyoffsetthecontractioninoilrevenues,growingby6.8%toUSD58billionduetoanexpectedimprovementintheglobalandGCCeconomicoutlook.ThereisadownsiderisktoourprojectionthatcanarisefromfurtherdeteriorationinChina’seconomicgrowth,especiallythatthesecond-largesteconomyhadbeensufferingfromsloweconomicgrowthandcontractioninmanufacturingoflate,whichmightimpactits14%shareoftheKingdom’snon-oilexports.Onaggregate,totalexportsareforecastedtorecordUSD361billionin2014comparedwithUSD376billioninthepreviousyear.Asforimports,theyareexpectedtogrow1.8%toUSD155billion,whichisarecordvalue.Thismarginalincreasewilllargelybeduetomoderatingdomesticdemand,asevidentfromtheyeartodatedeclineinthevalueofthesettledandnewlyopenedLettersofCredit(LCs)thatplungedby8.3%Y/Yforeach,withfoodstuffandmotorvehiclesaidingthefall.Accordingly,weexpectthecurrentaccountsurplustofall toUSD124billionthisyear,15.7%relative toGDP, smaller than theUSD133billion in2013.Thestill robustexternalpositionwill reflectfavorablyonnetforeignassetsthisyear.In2013,theseassetsgrewby10.7%toreachUSD717.7billionbytheendofDecember,andWeexpecttheywillbuildup,albeitataslowerpace,toUSD754billionin2014,coveringmorethan58monthsofimports,withthelargestshareinUSDdenominatedliquidassets.
13. Government Revenue and Expenditure Balance
SAR billion 2012 2013 2014 Budget 2014 Forecast
Total Revenue 1,247 1,156 855 1,090
Oil 1,145 1,035 735 965
Non-Oil 103 121 120 125
TotalExpenditure 873 976 855 1,005
Current 612 664 607 754
Capital 262 312 248 251
Deficit/Surplus 374 180 0 84
Sources: SAMA and NCB
The government continues to allocate funds to specialized credit institutions to support balanced development. BasedontheMOFannouncement,aroundSAR85.3billionin2014willbedisbursedbyspecializedcreditinstitutionstofinanceindustrialprojectsandtosupportsocialdevelopment,thus,complementingprivatecreditgrowththat recorded12.4%Y/Y inMarch2014.Acase inpoint is theSAMAPCOproject forethylenedichlorideandcausticsoda,wherebyPublicInvestmentFund(PIF)isextendingaloanworthSAR0.7billion.TheSaudiIndustrialDevelopmentFund(SIDF)hasalsorecentlyapproved19loansvaluedatSAR2.8billionfor15newindustrialprojectsandtheexpansionof4projects.Onaggregate,theoutstandingloansofgovernmentspecialized

12
credit institutionshavereachedarecordSAR268.6billion,expandingby7.7%toaddaroundSAR19.3billionduringthefirstthreequartersoflastyear.OntheSMEfront,theSaudiCreditandSavingBankhasfinanced1,495ofsuchestablishments,grantingmorethanSAR376millionunderthe“Masarat”program.AdditionalmeasuresoffinanceforSMEscontinuetogainground,withtheLoanGuaranteeProgram“Kafala”facilitatingcreditwortharoundSAR2.3billionin2013to1173establishments,representing28.7%oftheaggregatebeneficiariessincetheinceptionoftheprograminJanuary2006.
Current Account Balance / GDP
Budget Balance / GDP
14. Twin Surpluses
0%
5%
10%
15%
20%
25%
2010 2011 2012 2013P 2014F 2015F
15. Government Expenditure
Capital Expenditure
Current Expenditure
SAR billion
(100)
100
300
500
700
900
1,100
2010 2011 2012 2013P 2014F 2015F
Sources: SAMA and NCB Sources: SAMA and NCB
The Kingdom’s stable macroeconomic backdrop and the move towards streamlining regulations continue to be widely and positively recognized by renowned institutions. Accordingly, Standard andPoor’shadaffirmedtheKingdom’ssovereignratingatAA-withapositiveoutlookin2013andFitchupgradedit inMarch2014toAAwithastableoutlook.Thedecisionsbytheratingagencieswerepromptedbystronggovernment finances, which have largely withstood oil price volatility and the global economic crisis. ThisenhancedabilitytocontainshocksandsmoothbusinesscycleswillcontinuetosupportSaudiArabia’spositiveeconomicoutlook,goingforward.PublicdomesticdebtwasreducedfurtherfromSAR98.85billiontoSAR75.1billionin2013,amountingto2.7%relativetoGDP.WebelievethatgovernmentdebtwillremainbelowSAR100billion threshold for this year and next.
16. Domestic Public Debt
Gross Domestic Public Debt/GDP
Net Domestic Public Debt/GDP -60%
-40%
-20%
0%
20%
2007 2008 2009 2010 2011 2012 2013
Sources: SAMA and NCB Sources: SAMA
17. Government Deposits at SAMA
Jan-10 Jan-11 Jan-12 Jan-13 Jan-14 -
200
400
600
800
1,000
1,200
1,400
1,600
1,800
SAR billion
2010+69 bn
2011+194 bn
2012+329 bn
2013+125 bn

NCB PERSPECTIVES | JUNE 2014
13
III. Monetary Developments
Saudi Arabia’s monetary system continues to be awash with liquidity as elevated oil prices and production resulted in higher revenues that underpinned broader economic activities.Ontheregulatoryfront,SAMA’sproactivestancecontainedliquidityrisks,ensuredcompliancewithBaselIIIrequirementsaheadofscheduleandassessedthesoundnessoflocalbanksviastressteststhatreflectedlowersystemicrisks.Additionally,SAMAwaskeentoensurepricestabilityforbusinessesandconsumerstobenefitfromthebuoyanteconomy.Openmarketoperationsthatmopupexcessliquidityhavebeenacceleratingandbytheendof2013SAMAhasissuedSAR179.1billionworthofT-bills.Theconservativepolicyapproachwasaccentuatedbythebuildupofnetforeignassets,whichwassupportedbytheinfluxofoilrevenues.SAMA’snetforeignassetsundermanagementincrementallyincreasedbySAR238.8billion,9.8%,duringlastyear,reachingSAR2.7trillionbytheendof1Q14.ItiswidelyexpectedthatthemajorityofforeignassetsareinvestedinUSD-denominatedfixed-incomesecurities,whichprovideastablereturnalbeitlowerthanotherriskieralternatives.Thelock-stepnatureofSaudimonetarypolicywiththeUSisanimportantfactorthatwillsupportourviewofnochangetothedomesticbenchmarks,withSAMAkeepingtherepoat2%andthereverserepoat0.25%.
19. Interbank Market Rates
0%
1%
2%
3%
4%
5%
6%
May
-08
May
-09
May
-10
May
-11
May
-12
May
-13
May
-14
3M SAIBOR
3M USD LIBOR
18. SAMA and US Federal Reserve Policy Rates
May
-09
May
-08
May
-10
May
-11
May
-12
May
-13
May
-14
Reverse Repo Rate
Repo Rate
Federal Funds rate
0%
1%
2%
3%
4%
5%
6%
Sources: Thomson ReutersSources: Thomson Reuters and SAMA
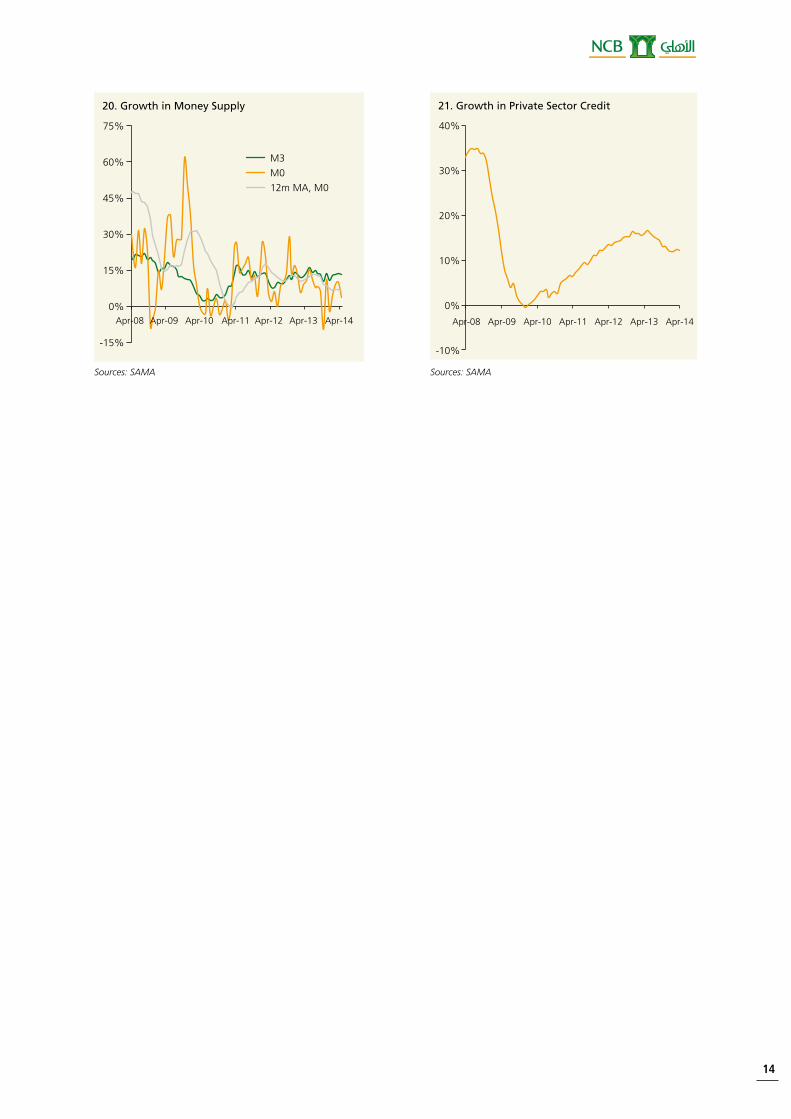
The sustainable pace of monetary aggregates reduces the risk of overheating the economy. During 2013,themonetarybase(M0)recordeditsfirstannualcontractionsince2008.ThenarrowestmonetarymeasuresettledatSAR343.5billionbytheendofDecember,slightlylowerthan2012’sSAR350.6billion.ThedeclineisnotrepresentativeofanegativesituationasthelargestcomponentofM0,depositswithSAMA,decreasedgivenlocalbanks’preferencetoutilizetheirexcessreservesforgrantingcredit.Accordingly,thecreditmarketwitnessedanotherhealthyyearbyexpandingat12.1%Y/Y.Additionally,moneysupply(M3)maintaineditsdouble-digitgrowth, recording 10.9%on an annual basis. The local financial system remains liquidwith excess reservessettlingat54.2%lastyear.SaudibanksheldSAR1.4trillionworthoftotaldepositsbytheendoflastyearthatrepresentmorethan70%oftheirtotal liabilitiesandcontinuetoprovideastablefundingbase.Thecapacityutilization,representedbytheloans-to-depositsratio,droppedto79.9%bytheendoflastyearafterpeakinginAugustat83.1%.Interestingly,localbankscontinuedtoaccumulatenetforeignassetsthatgrewby9.6%toreachSAR149.3billionin1Q2014afteramarginal2.1%increaseduring2013.Asfortheinterbankmarket,WeexpecttheSAIBORtoremainaroundthe100bpslevelintheshort-termduetothehealthycashlevelsofmostSaudi banks.
14
20. Growth in Money Supply
-15%
0%
15%
30%
45%
60%
75%
M3
M0
12m MA, M0
Apr-08 Apr-09 Apr-10 Apr-11 Apr-12 Apr-13 Apr-14
21. Growth in Private Sector Credit
-10%
0%
10%
20%
30%
40%
Apr-08 Apr-09 Apr-10 Apr-11 Apr-12 Apr-13 Apr-14
Sources: SAMA Sources: SAMA

NCB PERSPECTIVES | JUNE 2014
15
IV. Financial Sector
The Saudi banking system capitalized on reforms implemented during the financial crisis and posted record profits in 2013. The vibrancy of the private sector underpinned economic activities,which, in turn,providedopportunitiesforbankstoexpandtheirbalancesheets,ascenariothatislikelytomaterializethisyearaswell.Eventhoughlowinterestrateskeptnetinterestmarginscontained,the12locallyincorporatedbanksbytheendoflastyearrecordedastaggeringSAR37.6billion,anannualgrowthof7.1%,supportedbyvolume-growthincredit.Saudibanksincreasedtheiraveragecreditmaturitiesbyfocusingonlong-termloansthatrecordedagrowthof16.1%Y/Y,reachingatotalofSAR305.2billion.Additionally,non-performingloansandprovisionssignificantlydeclinedby21.7%and15.1%,respectively,asbanksimprovedtheirassetquality.TheSaudifinancialsystemhasalwayscompliedwithinternationalstandardsandSAMAhasalreadystartedguidingbankstowardsembracingBaselIIIstandards,proppingupcapitalbufferswithcapitaladequacylevelsstandingat17.8%wellaboverequirementsandasthebankingindustryincreaseditssharecapitalrecentlyby27.5%.Movingforward,thebankingsystemissecuredbyampleliquiditylevelsandcapitalbuffers,indicativeofamuchhealthierindustrygoingforward.
As 2013 was bullish for equities on a global scale, Tadawul managed to reach levels unseen since 2008 by climbing 25.5%.Followingastutteringstart inthefirstquarteroflastyear,thelocalequityindexgainedmomentumonthebackofattractivevaluationsascorporateprofitabilitysoared.ThemarketnetincomeexceededtheSAR100billionlevelbyrising6.6%Y/Y,whichattractedinvestorsintoriskierassets.Theglobalbullmarketalsosupportedpriceshigher,withrelativelylowersystemicrisksfacingtheworldeconomy.Thestrongerlocaldemandpushedtheprice-to-earningsratiobytheendoflastyearto15.52from12.75multiplein2012.Earlierthisyear,theDOWandNASDAQhave reached record highs and theirmomentumpositively spilled over on Tadawul,whichgained11.0%during1Q14.Theriseinbusinessactivitythattranslatedtorisingprofitsincreasedtheleveloftradingin1Q14toanaverageofSAR7.3billion,adouble-digitincreasecomparedtolastyear.However,themarketisstillstructurallyburdenedwithover90%individualtradersthatdoesn’tprovidethestabilityneededtowithstandshocks.Ontheprimarymarketfront,themarket’sdepthwasexpandedbyfiveinitialpublicofferings(IPOs)during2013,withatotalworthofaroundSAR2.0billionandanaverageoversubscriptionof7.5multiple,higherthanpreviousyear’s5.1multiple.Lookingahead,theprimarymarketisexpectedtoflourishthisyearandreacharecordhigh.However,itisnotexpectedthatTadawulwillovershootthe10,000thresholdbymuch,atleast for this year.
22. Saudi Equity Market Index(January 2009 = 100)
-20%
0%
20%
40%
60%
80%
100%
120%
Jan-
09
Oct-09
Jul-1
0Apr
-11
Jan-
12
Oct-12
Jul-1
3Apr
-14
23. Saudi IPO Issuance
0
2
4
6
8
10
12
14
5,000
10,000
15,000
20,000
25,000
30,000
35,000
40,000
2008 2009 2010 2011 2012 2013
SAR million
Capital Raised
Number of Issues, RHS
Sources: Tadawul Sources: Tadawul

16
Following a record setting year, the Sukuk market is becoming a viable alternative financing vehicle for local businesses.GlobalSukukissuancesdroppedduring2013toUSD118.2billion,falling15.1%mainlyduetoMalaysia’sweakerperformance.TheAsianmarketcontinuestoholdthetopspotforIslamicfinancingwithatotalnumberof637issueslastyearworthUSD80.9billion.SaudiArabiafirmlycameinsecondwitharecordsettingUSD15.2billionworthofSukuk,up36.4%Y/Y,through20issues.TheSukukissuancesofGACA’sGuaranteedSeniorSukukII(USD4billion)andAramco’sSadaraSukuk(USD2billion)werethelargestduring2013onaglobal-scale, cementing Saudi status in this rapidly growingmarket. Furthermore, SEC issued a two-tranche Islamicbondwithatenorof10yearsandafirstever30yearsSukuk,eachwithavalueofSAR3.75billion.Evidently,theextendedmaturitywillprovideapricingbenchmarkforlonger-tenorSukukandenergizeanalternativevenueforfinancinginfrastructureprojects.ThemajorityofissuancesweredenominatedinSaudiRiyalswithvaryingreturnratesfromaflat1.5%forIslamicDevelopmentBank’sissuancetoafluctuating6monthsSAIBORplus155bpsforSaudiHollandi’sTier2Sukuk.Inaddition,anumberofbanksoptedfortheShariahcompliantalternativetoboosttheirtier2capital,suchasSaudiBritishBank,NationalCommercialBank,andtheupcomingBanqueSaudiFransiissuance(SAR2billion).
24. Saudi Sukuk Issuance
Debt issued
Number of issues (RHS)
USD million
0
2
4
6
8
10
12
14
16
18
20
0
2
4
6
8
10
12
14
16
18
20
2007 2008 2009 2010 2011 2012 2013
25. Saudi Share of GCC Sukuk Issuance, 2013
58%
42%
KSA Rest of GCC
Sources: Zawya Sources: Zawya
NCB PERSPECTIVES | JUNE 2014
17
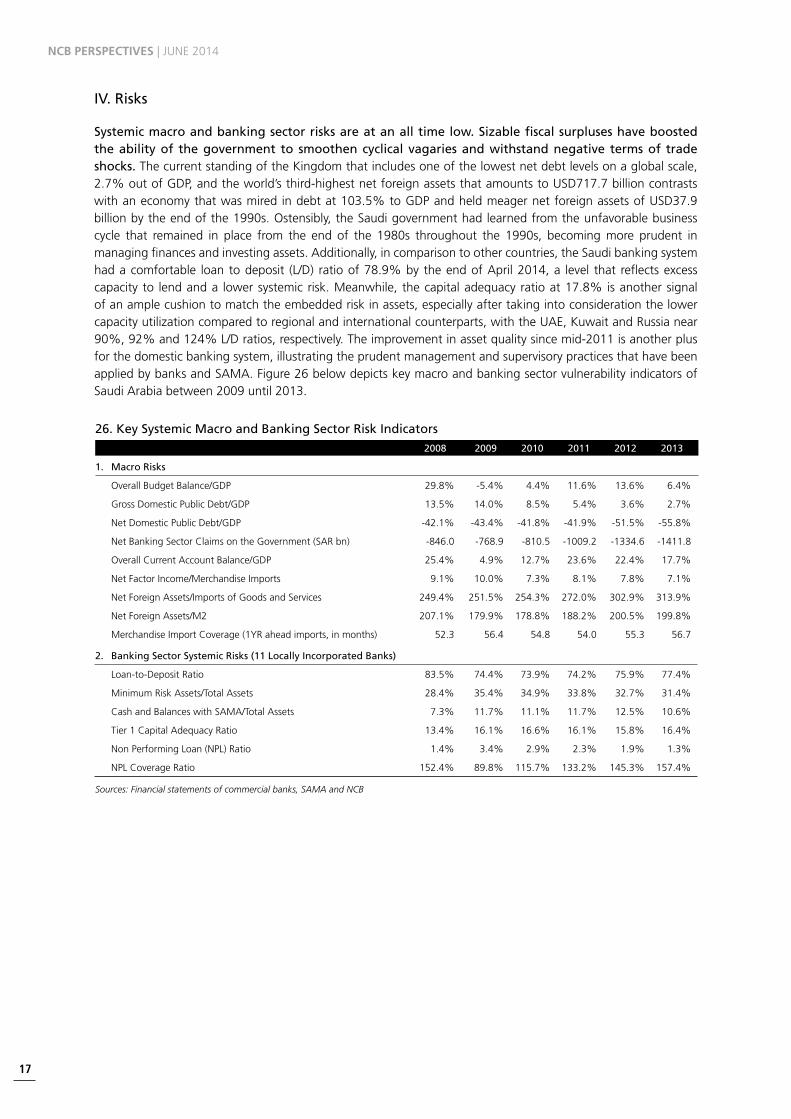
26. Key Systemic Macro and Banking Sector Risk Indicators 2008 2009 2010 2011 2012 2013
1. Macro Risks
OverallBudgetBalance/GDP 29.8% -5.4% 4.4% 11.6% 13.6% 6.4%
GrossDomesticPublicDebt/GDP 13.5% 14.0% 8.5% 5.4% 3.6% 2.7%
NetDomesticPublicDebt/GDP -42.1% -43.4% -41.8% -41.9% -51.5% -55.8%
NetBankingSectorClaimsontheGovernment(SARbn) -846.0 -768.9 -810.5 -1009.2 -1334.6 -1411.8
OverallCurrentAccountBalance/GDP 25.4% 4.9% 12.7% 23.6% 22.4% 17.7%
NetFactorIncome/MerchandiseImports 9.1% 10.0% 7.3% 8.1% 7.8% 7.1%
NetForeignAssets/ImportsofGoodsandServices 249.4% 251.5% 254.3% 272.0% 302.9% 313.9%
NetForeignAssets/M2 207.1% 179.9% 178.8% 188.2% 200.5% 199.8%
MerchandiseImportCoverage(1YRaheadimports,inmonths) 52.3 56.4 54.8 54.0 55.3 56.7
2. Banking Sector Systemic Risks (11 Locally Incorporated Banks)
Loan-to-DepositRatio 83.5% 74.4% 73.9% 74.2% 75.9% 77.4%
MinimumRiskAssets/TotalAssets 28.4% 35.4% 34.9% 33.8% 32.7% 31.4%
CashandBalanceswithSAMA/TotalAssets 7.3% 11.7% 11.1% 11.7% 12.5% 10.6%
Tier1CapitalAdequacyRatio 13.4% 16.1% 16.6% 16.1% 15.8% 16.4%
NonPerformingLoan(NPL)Ratio 1.4% 3.4% 2.9% 2.3% 1.9% 1.3%
NPLCoverageRatio 152.4% 89.8% 115.7% 133.2% 145.3% 157.4%
Sources: Financial statements of commercial banks, SAMA and NCB
IV. Risks
Systemic macro and banking sector risks are at an all time low. Sizable fiscal surpluses have boosted the ability of the government to smoothen cyclical vagaries and withstand negative terms of trade shocks. ThecurrentstandingoftheKingdomthatincludesoneofthelowestnetdebtlevelsonaglobalscale,2.7%outofGDP,andtheworld’sthird-highestnetforeignassetsthatamountstoUSD717.7billioncontrastswithaneconomythatwasmiredindebtat103.5%toGDPandheldmeagernetforeignassetsofUSD37.9billionbytheendofthe1990s.Ostensibly,theSaudigovernmenthadlearnedfromtheunfavorablebusinesscycle that remained in place from the end of the 1980s throughout the 1990s, becomingmore prudent inmanagingfinancesandinvestingassets.Additionally,incomparisontoothercountries,theSaudibankingsystemhadacomfortable loantodeposit (L/D) ratioof78.9%bytheendofApril2014,a level that reflectsexcesscapacity to lendanda lowersystemicrisk.Meanwhile, thecapitaladequacyratioat17.8%isanothersignalofanamplecushiontomatchtheembeddedriskinassets,especiallyaftertakingintoconsiderationthelowercapacityutilizationcomparedtoregionalandinternationalcounterparts,withtheUAE,KuwaitandRussianear90%,92%and124%L/Dratios,respectively.Theimprovementinassetqualitysincemid-2011isanotherplusforthedomesticbankingsystem,illustratingtheprudentmanagementandsupervisorypracticesthathavebeenappliedbybanksandSAMA.Figure26belowdepictskeymacroandbankingsectorvulnerabilityindicatorsofSaudiArabiabetween2009until2013.
18
The Economics Department Research TeamHead of Research
Said a. al ShaikhGroup Chief Economist
Macroeconomic Analysis
Tamer el ZayaT majed a. al-Ghalib yaSSer al-daWOOd Senior Economist/Editor Senior Economist Economist
[email protected] [email protected] [email protected]
Sector Analysis / Saudi Arabia
albara'a alWaZir ShahraZad a. faiSal Senior Economist Economist
[email protected] [email protected]
Management Information System
Sharihan al-manZalaWiEconomist
To be added to the nCb economics department distribution list
Please contact: Noel Rotap
Tel.:+966-2-646-3232
Fax:+966-2-644-9783
Email:[email protected]
disclaimer: TheinformationandopinionsinthisresearchreportwerepreparedbyNCB’sEconomicsDepartment.The
information herein is believed by NCB to be reliable and has been obtained from public sources believed to
bereliable.However,NCBmakesnorepresentationastotheaccuracyorcompletenessofsuchinformation.
Opinions,estimatesandprojectionsinthisreportconstitutethecurrentjudgmentoftheauthor/authors
asofthedateofthisreport.TheydonotnecessarilyreflecttheopinionsofNCBastothesubjectmatter
thereof.Thisreportisprovidedforgeneralinformationalpurposesonlyandisnottobeconstruedasadvice
to investors or an offer to buy or sell or a solicitation of an offer to buy or sell any financial instruments or
othersecuritiesortoparticipateinanyparticulartradingstrategyinanyjurisdictionorasanadvertisement
ofanyfinancialinstrumentsorothersecurities.Thisreportmaynotbereproduced,distributedorpublished
byanypersonforanypurposewithoutNCB’spriorwrittenconsent.