
Satellite Remote Sensing of Coastal and Inland Water...
67
Satellite Remote Sensing of Coastal and Inland Water Quality: Toward a Global Water Quality Monitoring and Forecasting Service 4th Annual CICS-MD Science Meeting 23-24 November 2015 College Park, MD USA Paul M. DiGiacomo Chief, Satellite Oceanography & Climatology Division NOAA-NESDIS Center for Satellite Applications & Research 1
Transcript of Satellite Remote Sensing of Coastal and Inland Water...

Satellite Remote Sensing of Coastal and Inland Water Quality: Toward a Global Water Quality
Monitoring and Forecasting Service
4th Annual CICS-MD Science Meeting 23-24 November 2015 College Park, MD USA
Paul M. DiGiacomo
Chief, Satellite Oceanography & Climatology Division NOAA-NESDIS Center for Satellite Applications & Research
1

STAR Satellite Oceanography & Climatology Division (SOCD)
SOCD Chief: Dr. Paul M. DiGiacomo
Ocean Sensors Branch
Chief: Dr. Alexander (Sasha) Ignatov
•Sea Surface Temp, Ocean Winds, Ocean Optics & Water Quality (e.g. Chesapeake Bay)
Marine Ecosystems & Climate Branch
Chief: Dr. Menghua Wang
• Ocean Color, Coral Reefs, Sea Ice, Synthetic Aperture Radar, Blended SST
Laboratory for Satellite Altimetry
Chief: Dr. Laury Miller
• Sea Level, Bathymetry, Waves, Sea Ice/Climate
SOCD Organization
Science Teams: R&O
Major Programs/Activities
• JPSS: Ocean Color & SST EDRs • GOES-R: SST (& Ocean Dynamics) • JASON Satellite Radar Altimeter Program • NOAA GCOM Program Scientist • National Ice Center Chief Scientist • Foreign Sensors: Winds, SAR, etc • Marine Optical BuoY (MOBY) • Coast/OceanWatch & Coral Reef Watch
I
• Sea Surface Height • Sea Surface Roughness • Sea Surface Salinity • Sea Surface Temperature • Ocean Color Radiometry • Ocean Surface Vector Winds • CoastWatch/OceanWatch • Coral Reef Watch • Sea Ice and Polar Dynamics

MERIS Image of Cyanobacteria Bloom in Lake Erie: Worst bloom in decades,
over 5000 sq km on this day 09 October 2011

MERIS Image of Cyanobacteria Bloom in Lake Erie: Worst bloom in decades,
over 5000 sq km on this day 09 October 2011
08/02/2014

Oil spill and marine pollution monitoring

"The remoteness of the Polar Regions limits the amount of direct observation of sea ice. Hence, more than 95% of the data used in sea ice analyses are derived from the remote sensors on polar-orbiting satellites. Sea ice analyses and forecasts are primarily prepared using satellite imagery and ice reconnaissance.” - U.S. National Ice Center
Map: The Arctic Institute
Polar Navigation Routes
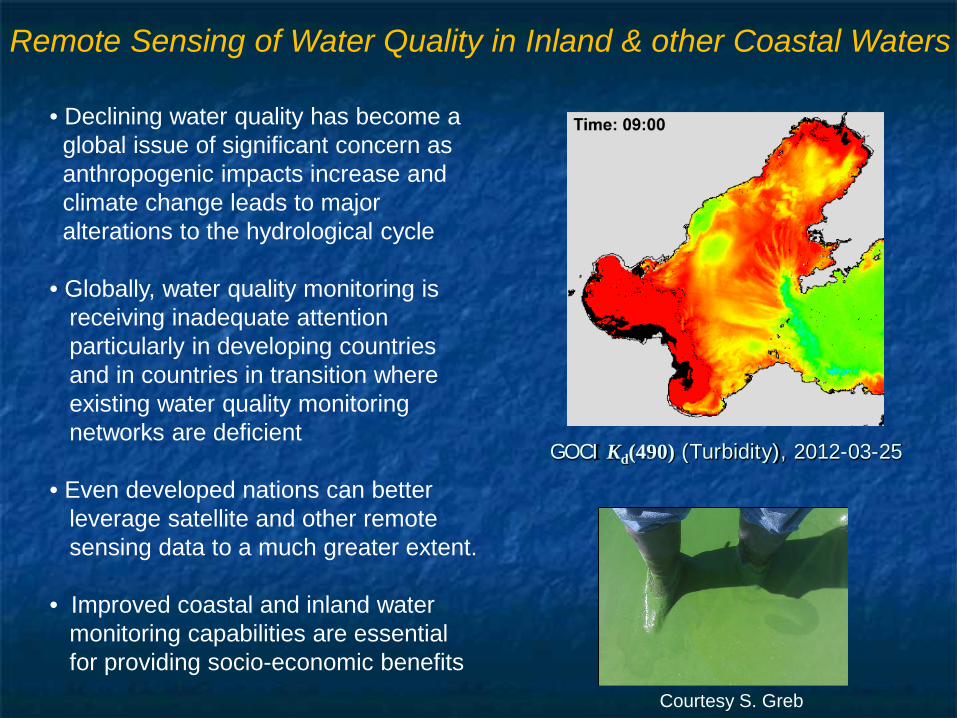
• Declining water quality has become a global issue of significant concern as anthropogenic impacts increase and climate change leads to major alterations to the hydrological cycle • Globally, water quality monitoring is receiving inadequate attention particularly in developing countries and in countries in transition where existing water quality monitoring networks are deficient • Even developed nations can better leverage satellite and other remote sensing data to a much greater extent. • Improved coastal and inland water monitoring capabilities are essential for providing socio-economic benefits
Remote Sensing of Water Quality in Inland & other Coastal Waters
Courtesy S. Greb
GOCI Kd(490) (Turbidity), 2012-03-25

North Sea Coast Chl.a (MarCoast Project)
• Since the 2007 Group on Earth Observations (GEO) Inland & Nearshore Coastal Water Quality Remote Sensing Workshop in Geneva, there have been significant advances in our ability to monitor and forecast water quality on a global basis, • This includes integrating observations (satellite & in situ), modeling and data assimilation, and development of fit for purpose user-driven products, indicators, applications and services • We are working to build a stronger linkage between water resources management end users and data providers to fully realize current and future Earth Observation products.
Earth Observations in Support of Global Water Quality Monitoring
MSL12-SWIR
China East Coast Chl.a (M. Wang)
MSL12-SWIR
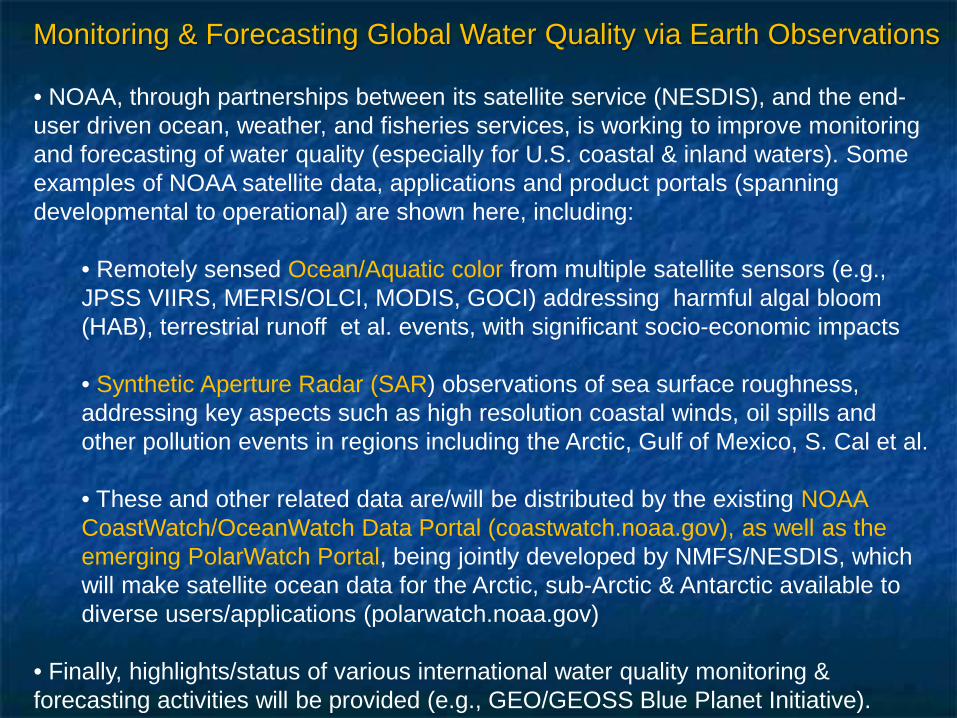
• NOAA, through partnerships between its satellite service (NESDIS), and the end-user driven ocean, weather, and fisheries services, is working to improve monitoring and forecasting of water quality (especially for U.S. coastal & inland waters). Some examples of NOAA satellite data, applications and product portals (spanning developmental to operational) are shown here, including:
• Remotely sensed Ocean/Aquatic color from multiple satellite sensors (e.g., JPSS VIIRS, MERIS/OLCI, MODIS, GOCI) addressing harmful algal bloom (HAB), terrestrial runoff et al. events, with significant socio-economic impacts
• Synthetic Aperture Radar (SAR) observations of sea surface roughness, addressing key aspects such as high resolution coastal winds, oil spills and other pollution events in regions including the Arctic, Gulf of Mexico, S. Cal et al.
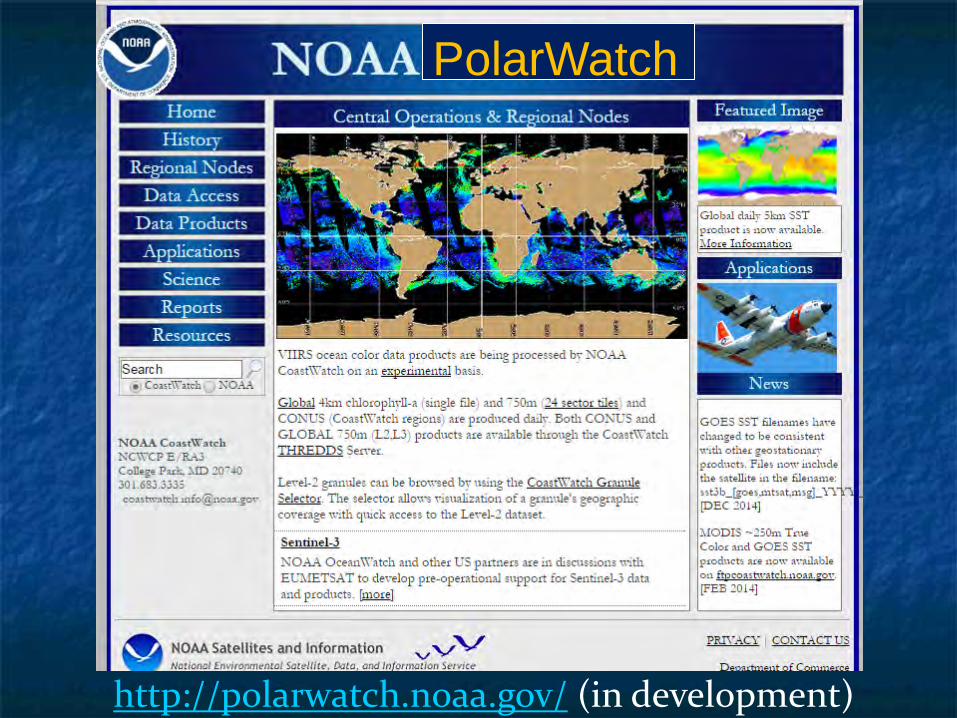
• These and other related data are/will be distributed by the existing NOAA CoastWatch/OceanWatch Data Portal (coastwatch.noaa.gov), as well as the emerging PolarWatch Portal, being jointly developed by NMFS/NESDIS, which will make satellite ocean data for the Arctic, sub-Arctic & Antarctic available to diverse users/applications (polarwatch.noaa.gov)
• Finally, highlights/status of various international water quality monitoring & forecasting activities will be provided (e.g., GEO/GEOSS Blue Planet Initiative).
Monitoring & Forecasting Global Water Quality via Earth Observations

Ocean (Aquatic) Color
10
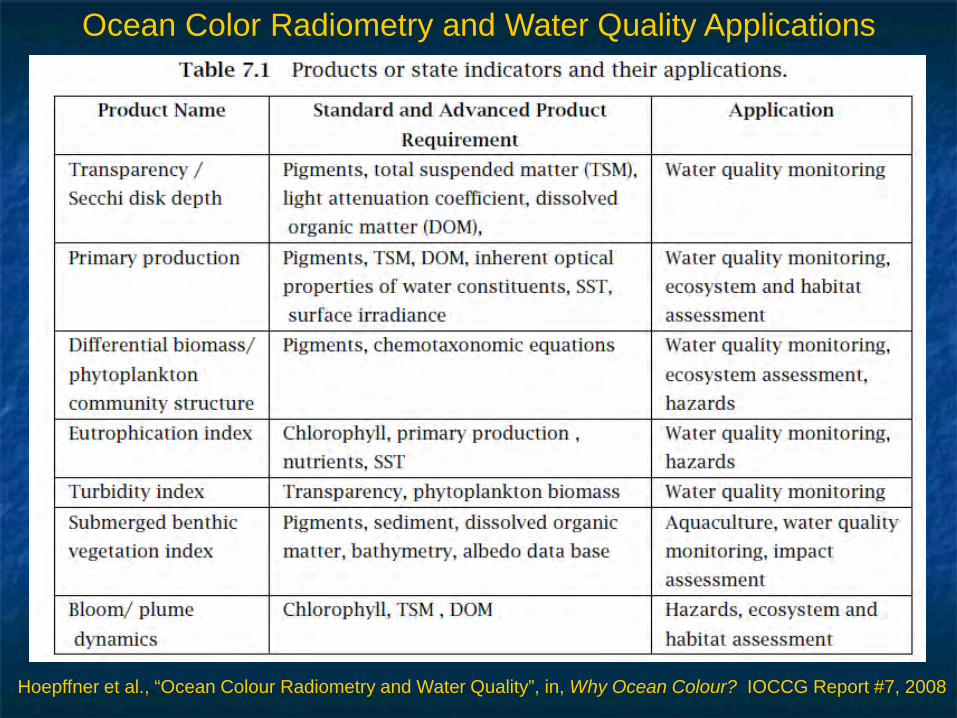
Ocean Color Radiometry and Water Quality Applications
Hoepffner et al., “Ocean Colour Radiometry and Water Quality”, in, Why Ocean Colour? IOCCG Report #7, 2008

12
Sample of Gulf of Mexico Operational HAB-OFS Bulletin using Aqua MODIS OC data
Gulf of Mexico Harmful Algal Bloom Bulletin Region: Southwest Florida Monday, 26 October 2015 NOAA National Ocean Service NOAA Satellite and Information Service NOAA National Weather Service Previous bulletin: Thursday, October 22, 2015
VIIRS image for same day
NOAA/NOS Operational Harmful Algal Bloom Bulletins

MERIS Image of Cyanobacteria Bloom in Lake Erie: Worst bloom in decades,
over 5000 sq km on this day 09 October 2011
Courtesy: NOAA/NOS

NOAA Lake Erie HAB Bulletin (MERIS 2009-2011, now MODIS, soon Sentinel-3/OLCI)
Bloom from MERIS
Forecast (with Great Lakes CFS)

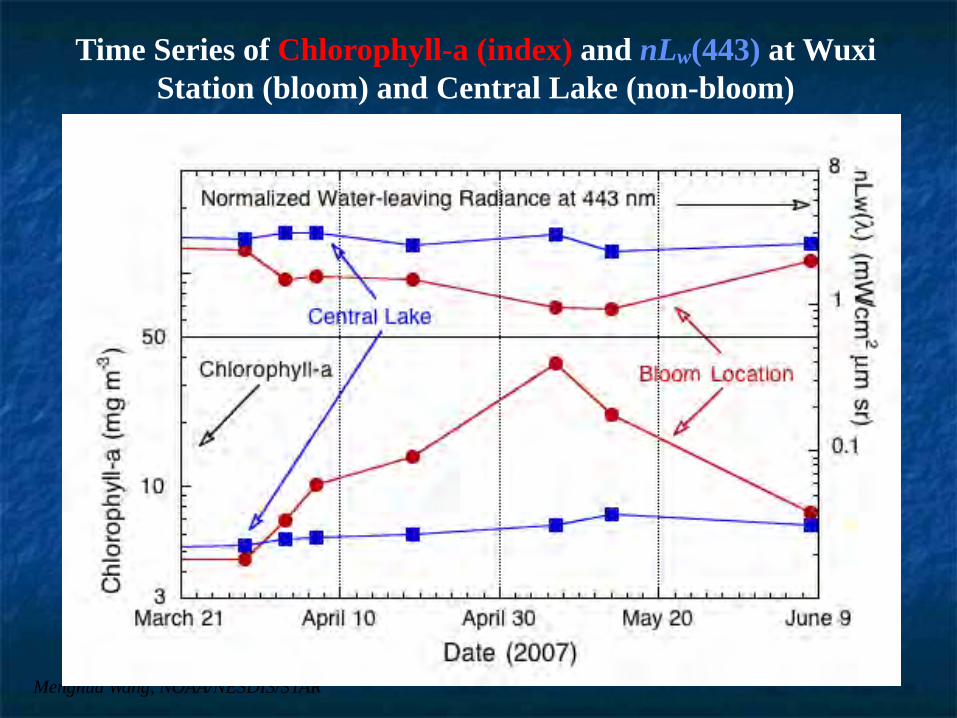
Blue-Green Algae (Microcystis) Bloom Crisis in Lake Taihu (Spring 2007), China

Menghua Wang, NOAA/NESDIS/STAR Wang, M., W. Shi, and J. Tang (2011), “Water property monitoring and assessment for China’s inland Lake Taihu
from MODIS-Aqua measurements,” Remote Sens. Environ., 115, 841–845.
Menghua Wang, NOAA/NESDIS/STAR
Time Series of Chlorophyll-a (index) and nLw(443) at Wuxi Station (bloom) and Central Lake (non-bloom)
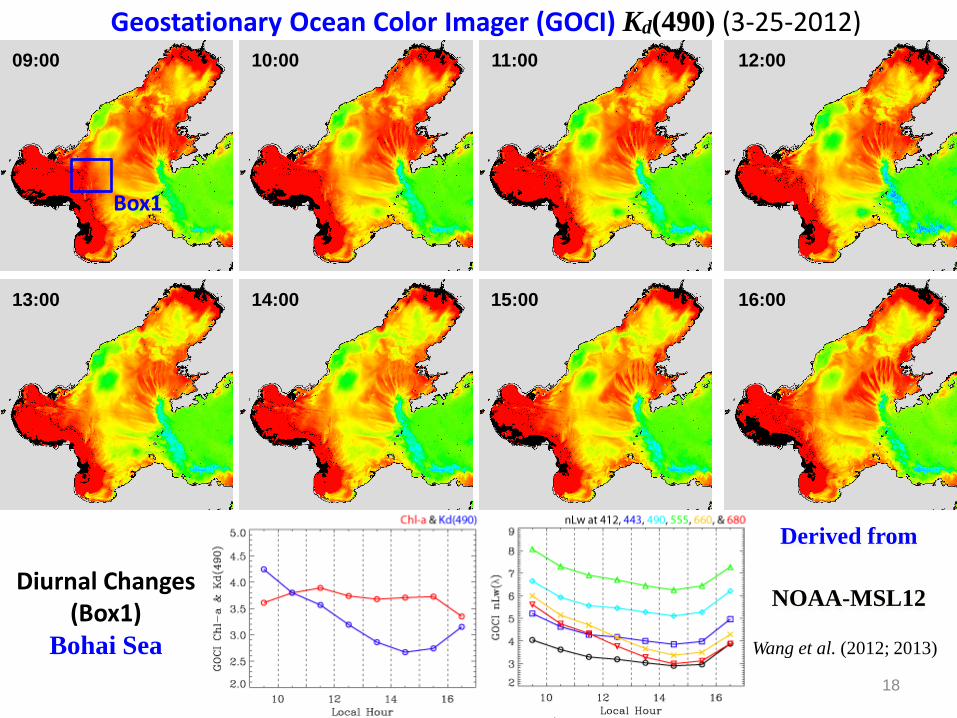
Geostationary Ocean Color Imager (GOCI) Kd(490) (3-25-2012) 09:00 10:00 12:00 11:00
13:00 14:00 16:00 15:00
Box1
Diurnal Changes (Box1)
Bohai Sea Wang et al. (2012; 2013)
Derived from
NOAA-MSL12 18

Menghua Wang, NOAA/NESDIS/STAR
MODIS-Aqua-measured seasonal climatology water turbidity (NTU) images in Great Lakes.
Highly turbid waters in winter and in Lake Erie, somewhat turbid in Lake Ontario, and part of Lakes Huron, Michigan, etc.
The NIR-SWIR Data Processing
(NOAA-MSL12)

Warrick et al., CSR, 2007
Satellite Observations of Urban Stormwater Runoff Plumes
Nezlin et al., ECSS, 2008
• Runoff plumes are dynamic, episodic features, and can move 20-40 km/day • Cloud cover limits their observation
Plume
Non-Plume

Pollutant and Pathogen-laden Urban Stormwater Runoff
Ahn et al., Environmental Science and Technology, 2005.

Satellite Monitoring of Post-Storm Coastal Sediment Plumes
Sediment plume in Chesapeake Bay following 2011’s Tropical Storm Lee
• Satellites can measure concentration of sediment in the surface water • Red indicates high sediment concentration as a result of storm runoff from land

Evolution of sediment plumes in the upper Chesapeake Bay
Susquehanna 0 km
100 km
200 km
23
Zheng, G., P. M. DiGiacomo, S. S. Kaushal, M. A. Yuen-Murphy, and S. Duan (2015a), Evolution of sediment plumes in the Chesapeake Bay and implications of climate variability, Environmental Science & Technology, 49(11), 6494–6503, doi: 10.1021/es506361p.

Types Injection Transport Temporary Turbidity Max
Persistent Turbidity Max
Spatial shape of [SPM]
Timing (days) 0–5 3–10 5–30 >13
Short-term evolution of sediment plumes after discharge events
Long-term regime shift of typology
24

25
• Hurricane Ivan (2004) triggered a discharge of sediments equivalent to the total amount discharged over the preceding 10 years
• The shift in typology occurred in an abrupt manner after Hurricane Ivan
• The regime shift is likely associated with Hurricane Ivan (2004)
25
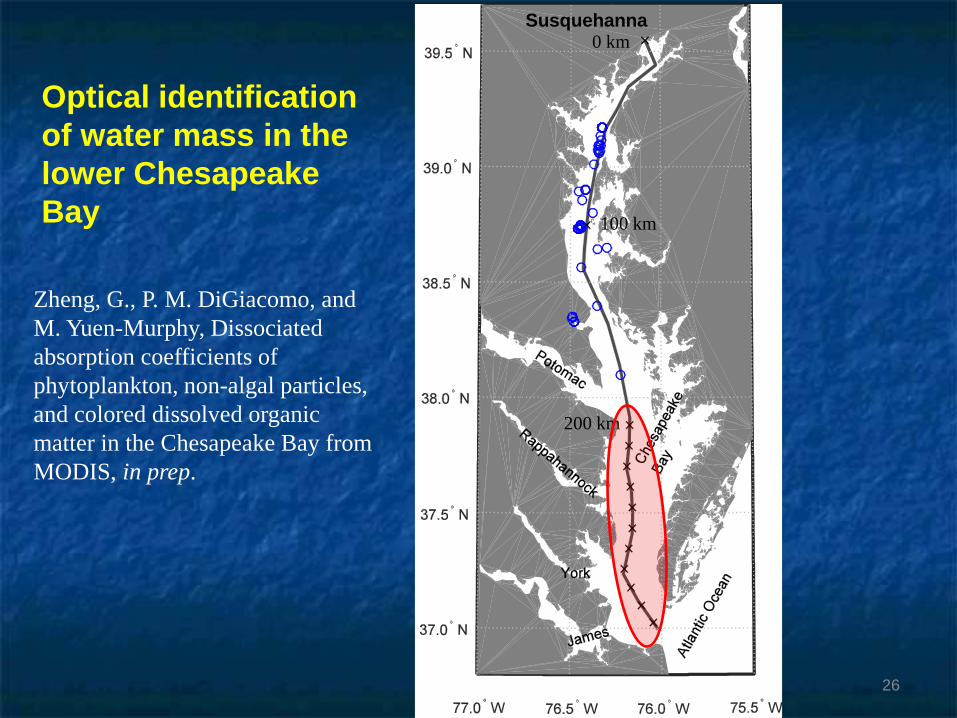
Optical identification of water mass in the lower Chesapeake Bay
Susquehanna 0 km
100 km
200 km
26
Zheng, G., P. M. DiGiacomo, and M. Yuen-Murphy, Dissociated absorption coefficients of phytoplankton, non-algal particles, and colored dissolved organic matter in the Chesapeake Bay from MODIS, in prep.

• Water mass A: o Potomac River plume o CDOM and NAP dominated o bbp(443):ad(443) = 1.8 ± 0.2 % o CDOM-NAP mixed plume
• Water mass B:
o Rappahannock River plume o CDOM dominated o bbp(443):ad(443) = 1.5 ± 0.2 % o “Tea-colored” plume
• Water mass C:
o York River plume o CDOM and NAP dominated o bbp(443):ad(443) = 2.2 ± 0.3 % o CDOM-NAP mixed plume
• Water mass D:
o James River plume o NAP dominated o bbp(443):ad(443) = 2.5 ± 0.2 % o “Turbid” plume
Fall 2002
Phytoplankton
CDOM
Sediments
27

Ecological Forecasting
28
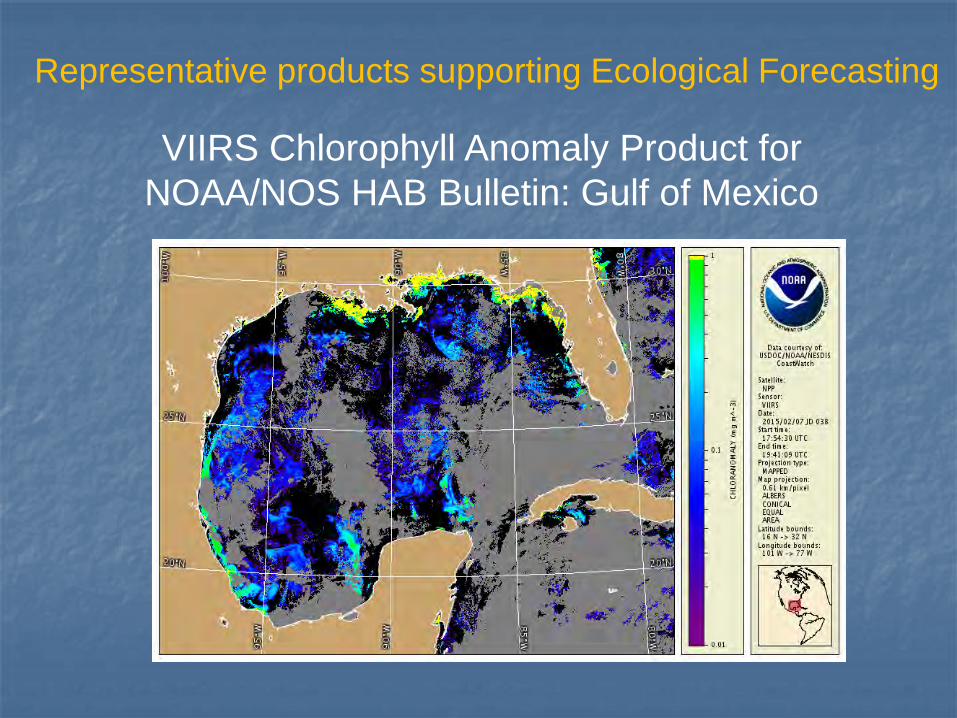
VIIRS Chlorophyll Anomaly Product for NOAA/NOS HAB Bulletin: Gulf of Mexico
Representative products supporting Ecological Forecasting

30
Physical environment Geology Chemistry Circulation & currents Temperature Salinity Water clarity (TSS) Climate variability
Nutrient Inputs Currency is Nitrogen Oxygen Silica 3 Detrital forms Bacteria-mediated recycling
Developing and Applying Tools For Ecosystem-Based Fisheries Management
NOAA Chesapeake Bay Office – Ecosystem Modeling Team
Biological environment Primary production Trophic interactions Recruitment relationships Age structure Size structure Life History Fisheries Multiple sectors Gears Seasons Spatially explicit
NMFS/NCBO The Chesapeake Atlantis Model (CAM)
A Holistic Ecosystem Model Incorporating:

Conversion of VIIRS data to Ecosystem Model Grid
S-NPP VIIRS chlorophyll CoastWatch 2-day avg (Dec 3-4, 2012) Raster data: UTM coordinates
Chesapeake Bay Program Georeferenced polygonal grid 8,282 polygons
NOAA/NMFS/NCBO Atlantis Ecosystem Model 97 polygons Aggregated from 8,282
VIIRS satellite chlorophyll Georeferenced grid
Ecosystem model grid

http://coralreefwatch.noaa.gov/satellite/research/oceancolor.php
OCEAN COLOR TOOLS FOR REEF MANAGERS
From Coral Reef Watch
A B C
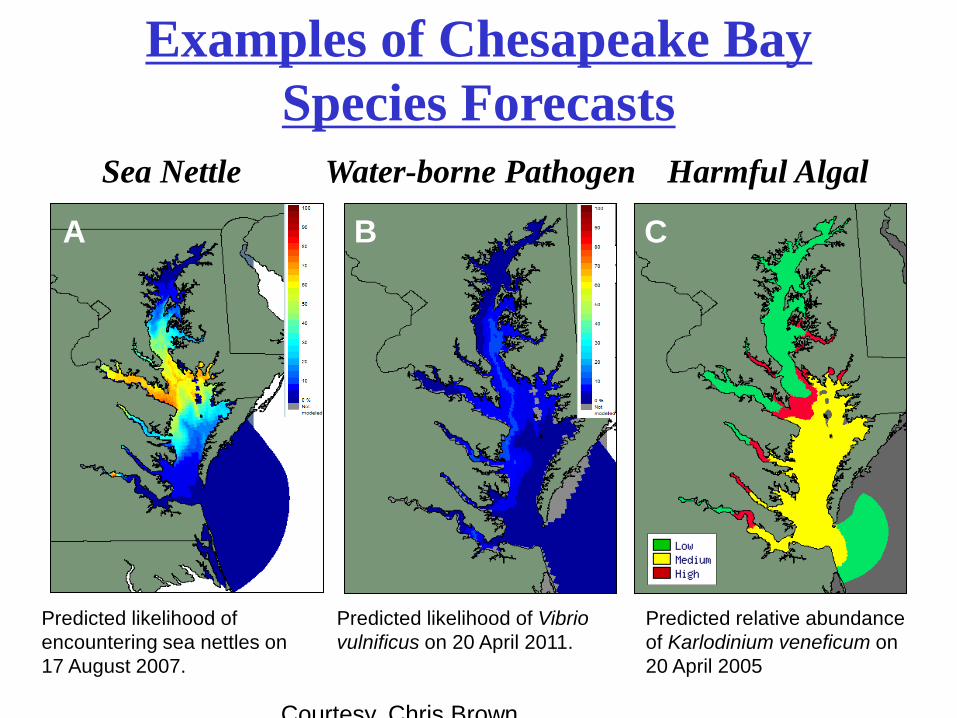
Examples of Chesapeake Bay Species Forecasts
Sea Nettle Water-borne Pathogen Harmful Algal
Predicted likelihood of encountering sea nettles on 17 August 2007.
Predicted likelihood of Vibrio vulnificus on 20 April 2011.
Predicted relative abundance of Karlodinium veneficum on 20 April 2005
Courtesy Chris Brown

Synthetic Aperture Radar (SAR)
34

Coastal SAR Water Quality Surface roughness on the scale of the radar wavelength (2-20 cm depending on the radar) cause high backscatter or bright SAR images. Surfactants reduces backscatter.
Radarsat-1 SAR image showing surface signature of municipal wastewater, 1997 Dec 271
1DiGiacomo et al, Marine Pollution Bull. 49 (2004)
Deepwater Horizon oil spill observed rom Radarsat-2 and MODIS
Prestige oil spill off the coast of Portugal from Envisat, 2002 Nov 11
35

Coastal SAR Water Quality
1DiGiacomo et al, Marine Pollution Bull. 49 (2004) 36
SAR imagery of stormwater plumes from Ballona Creek, Santa Monica Bay, Left: RADARSAT-1 SAR image; Right: ERS-1 SAR image.

Interactive and Automated Techniques for Oil Spill
Analysis Using (SAR) Imagery
Interactively derived Marine Pollution Surveillance Report issued by NESDIS/OSPO Satellite Analysis Branch for May 2, 2010, during the Deepwater Horizon incident.
Automated Texture Classifying Neural Network (TCNNA) oil spill map for the same day. This algorithm is being developed in a collaboration between NESDIS/STAR and Florida State Univ. for future use as an automated oil spill mapping tool.
Deepwater Horizon Fire 4/21/2010

Operational Radarsat-2 wind speed 2015-02-04 04:05 UT
Pre-operational Sentinel-1A wind speed 2015-01-08 02:46 UT
High-Resolution SAR-Derived Wind Speed Products

Operational Sea Surface Winds from SAR
Sea surface roughness correlated with wind speed
Sentinel-1A SAR vs ASCAT winds
39

Sentinel-1A wind images: 2014-12-31 20:19:38 UTC
PNG Image KMZ File

Sentinel-1A Wind Speed Retrieval Baltic Sea
July 6, 2015, 1652

Wind speed imagery makes other phenomena more visible. Example: Fast Freeze-up at Drilling Site from RADARSAT-2 SAR Surface Winds
October 30th 0430Z
NIC RADARSAT-2 Synthetic Aperture Radar (SAR) Surface Winds Products
October 31st 0401Z
October 31st 1736Z
Sea Ice No Ice
Winds > 30 knots
Grease Ice Lower Wind Speeds
Nilas and Pancake Ice
Very Low Wind Speeds
42

http://coastwatch.noaa.gov/

• CoastWatch/OceanWatch has been providing tailored satellite ocean color products to NOS/NCCOS to generate Harmful Algal Bloom Forecast Bulletins since 2004, spanning SeaWiFS, MODIS, MERIS and now VIIRS ocean color data, and soon using Sentinel-3 OLCI data from EUMETSAT.
• In this context, CoastWatch is also actively supporting NOAA Ecological Forecasting infrastructure activities, working with NCEP/OPC as well as NOS/NCCOS and other partners.
CoastWatch/OceanWatch Support for NOS Harmful Algal Bloom Bulletins

Generated using NOAA MSL12 for VIIRS ocean color data processing
NOAA VIIRS Climatology Chlorophyll-a Image (April 2012 to October 2014)
Log scale: 0.01 to 64 mg/m3
Wang, M., X. Liu, L. Tan, L. Jiang, S. Son, W. Shi, K. Rausch, and K. Voss, “Impacts of VIIRS SDR performance on ocean color products,” J. Geophys. Res. Atmos., 118, 10,347–10,360, 2013. http://dx.doi.org/10.1002/jgrd.50793
| Page 45

Generated using NOAA-MSL12 for VIIRS ocean color data processing
NOAA VIIRS Climatology Kd(490) Image (March 2012 to February 2015)
46
Log scale: 0.01 to 2 m−1

Menghua Wang, NOAA/NESDIS/STAR
NOAA VIIRS Climatology Chlorophyll-a Image
47
Log scale: 0.01 to 64 mg/m3
• NOAA Ocean Color Team has been developing/building the capability for the End-to-End satellite ocean color data processing including (http://www.star.nesdis.noaa.gov/sod/mecb/color/):
– Level-0 to Level-1B (or Raw Data Records (RDR) to Sensor Data Records (SDR)). – Level-1B (SDR) to ocean color Level-2 (Environmental Data Records (EDR)). – Level-2 to global Level-3 (routine daily, 8-day, monthly, and climatology data/images).
• Capability for on-orbit instrument calibration (MODIS, VIIRS, etc.). • Support of in situ data collections for VIIRS Cal/Val activities, e.g., MOBY, AERONET-OC sites, NOAA dedicated cruise, etc.
NOAA Ocean Color Team

VIIRS Ocean Color EDR & Cal/Val Teams Members
48
EDR Name Organization Funding Agency
Task
Lead Menghua Wang (OC EDR & Cal/Val Lead), L. Jiang, X. Liu, W. Shi, S. Son, L. Tan, X. Wang, P. Naik, J. Sun, K. Mikelsons, V. Lance, M. Ondrusek, E. Stengel
NOAA/NESDIS/ STAR
JPSS/NJO Leads – Ocean Color EDR Team & Cal/Val Team OC products, algorithms, SDR, EDR, Cal/Val, vicarious cal., refinements, data processing, algorithm improvements, software updates, data validations and analyses
Ocean Color
Robert Arnone Sherwin Ladner, Ryan Vandermeulen Adam Lawson, Paul Martinolich, Jen Bowers
U. Southern MS NRL QinetiQ Corp. SDSU
JPSS/NJO Look Up Tables – SDR-EDR impacts, vicarious calibration Satellite matchup tool (SAVANT) – Golden Regions Cruise participation and support WAVE_CIS (AERONET-OC site) operation
Carol Johnson NIST JPSS/NJO Traceability, AERONET Uncertainty
Curt Davis, Nicholas Tufillaro OSU JPSS/NJO Ocean color validation, Cruise data matchup West Coast
Burt Jones, Matthew Ragan USC JPSS/NJO Eureka (AERONET Site)
Sam Ahmed, Alex Gilerson CUNY JPSS/NJO LISCO (AERONET site) Cruise data and matchup
Chuanmin Hu USF JPSS/NJO NOAA data continuity
Ken Voss & MOBY team RSMAS –Miami JPSS/NJO Marine Optical Buoy (MOBY)
Zhongping Lee, Jianwei Wei UMB JPSS/NJO Ocean color IOP data validation and evaluation Ocean color optics matchup
Working with: NOAA CoastWatch, VIIRS SDR team (C. Cao, F. DeLuccia, X. Xiong), DPA/DPE (R. Williamson, Neal Baker), Raytheon, NOAA -OC Working Group, NOAA various line-office reps, NASA OBPG (K. Turpie, et al.), NOAA OCPOP, etc. Collaborators: D. Antoine (BOUSSOLE), B. Holben (NASA-GSFC), G. Zibordi (JRC-Italy), R. Frouin (for PAR), and many others.

Menghua Wang, NOAA/NESDIS/STAR
Summary of VIIRS Ocean Color EDR Products • Inputs:
– VIIRS M1-M7 and the SWIR M8, M10, and M11 bands SDR data – Terrain-corrected geo-location file – Ancillary meteorology and ozone data
• Operational (Standard) Products (8): – Normalized water-leaving radiance (nLw’s) at VIIRS visible bands M1-M5 – Chlorophyll-a (Chl-a) concentration – Diffuse attenuation coefficient for the downwelling spectral irradiance at the wavelength
of 490 nm, Kd(490) (New) – Diffuse attenuation coefficient of the downwelling photosynthetically available radiation
(PAR), Kd(PAR) (New) – Level-2 quality flags
• Experimental Products: – Inherent Optical Properties (IOP-a, IOP-aph, IOP-adg, IOP-bb, IOP-bbp) at VIIRS M2 or
other visible bands (M1-M5) from the Quasi-Analytical Algorithm (QAA) (Lee et al., 2002)
– Photosynthetically Available Radiation (PAR) (R. Frouin) – Chlorophyll-a from ocean color index (OCI) method (Hu et al., 2012) – Others from users requests
Data quality of ocean color EDR are extremely sensitive to the SDR quality. It requires ~0.1% data accuracy (degradation, band-to-band accuracy…)!

Menghua Wang, NOAA/NESDIS/STAR
Multi-Sensor Level-1 to Level-2 (MSL12) Ocean Color Data Processing
Multi-Sensor Level-1 to Level-2 (MSL12) MSL12 was developed during NASA SMIBIOS project (1997-2003) for a consistent
multi-sensor ocean color data processing (Wang, 1999; Wang and Franz, 2000), i.e., it is measurement-based ocean color data processing system.
It has been used for producing ocean color products from various satellite ocean color sensors, e.g., SeaWiFS, MOS, OCTS, POLDER, MODIS, GOCI, etc.
NOAA-MSL12 Ocean Color Data Processing NOAA-MSL12 is based on SeaDAS version 4.6. Some significant improvements: (1) the SWIR-based data processing, (2) Rayleigh and
aerosol LUTs, (3) algorithms for detecting absorbing aerosols and turbid waters, (4) ice detection algorithm, (5) improved straylight/cloud shadow algorithm, & others.
In 2014, some new algorithms (BMW–new NIR reflectance correction, Destriping, Kd(PAR), etc.)
NOAA-MSL12 for VIIRS (and others) Ocean Color Data Processing Routine ocean color data processing (daily, 8-day, monthly) since VIIRS launch. Coastal turbid and inland waters from other approaches, e.g., the SWIR approach,
results in the US east coastal, China’s east coastal, Lake Taihu, Lake Okeechobee, Aral Sea, etc.
Capability for multi-sensor ocean color data processing, e.g., MODIS-Aqua, VIIRS, GOCI, and will also add J1, OLCI/Stentinel-3, and SGLI/GCOM-C data processing capability.

Destriping of VIIRS Ocean Color Products (Examples)
nLw(412)
Kd(490)
Mikelsons, K., M. Wang, L. Jiang, and M. Bouali, “Destriping algorithm for improved satellite-derived ocean color product imagery,” Opt. Express, 22, 28058-28070, 2014. http://dx.doi.org/10.1364/OE.22.028058
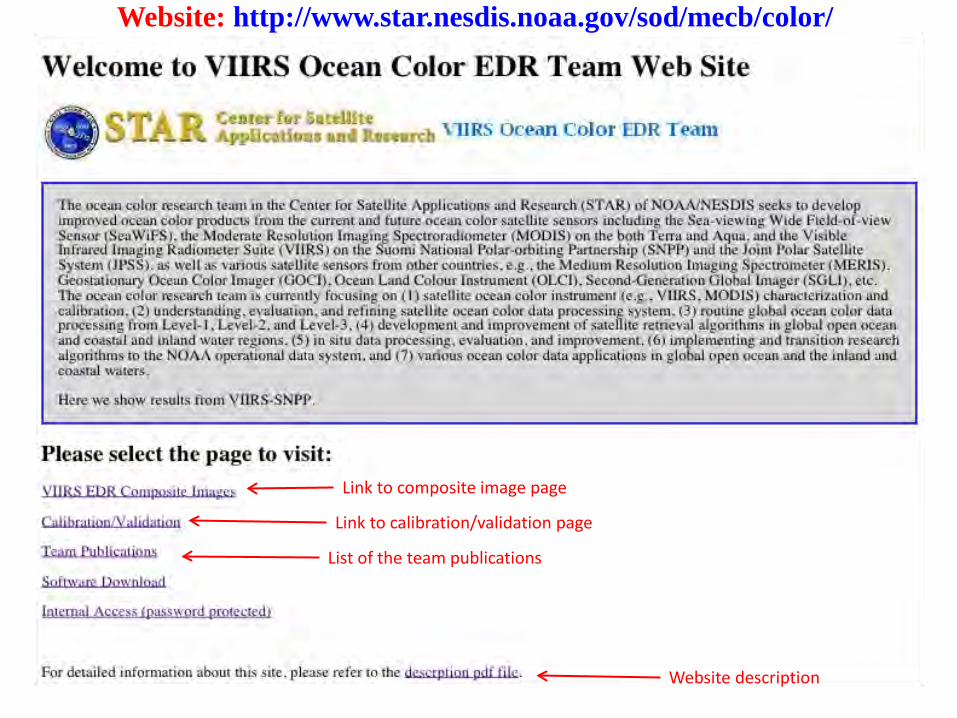
Link to composite image page
Link to calibration/validation page
List of the team publications
Website description
Website: http://www.star.nesdis.noaa.gov/sod/mecb/color/

Evolving CoastWatch/OceanWatch VIIRS Ocean Color Data Flow
http://coastwatch.noaa.gov/

VIIRS OC Processing and User Engagements • NOAA CoastWatch/OceanWatch is now generating and distributing global
MSL12 VIIRS ocean color products • chlorophyll-a, Kd490, nLws for M1-5 bands • L2 granule files, 24 mapped global sector L3 files with 750m resolution (daily and weekly
composite), and mapped global L3 files with 4km resolution (daily and weekly composites) • NetCDF format data products served via STAR/CoastWatch THREDDS Data Server (TDS) • Global 4km Chlorophyll-a and Kd490 netcdf data been used by EMC for their climate
modeling development efforts.
54 Figure 1. March 30, 2015 global Chlorophyll-a concentration image from SNPP VIIRS
http://coastwatch.noaa.gov/

CoastWatch VIIRS Ocean Color Portal • CoastWatch/OceanWatch Global Map-based granule selector for VIIRS Ocean
Color Data rolled out in March 2015 • allows a user to quickly visualize and access a specific dataset based on time & geographic coverage • When finished, the portal will provide direct access to NRT, Science Quality, and Mission Reprocessed
Level 2 data
55 Global Map-based granule display of VIIRS true color images (granule selector)
http://coastwatch.noaa.gov/cwn/cw_granule_selector.html

Kd(490): Log scale: 0.01 to 2 m−1
Chl-a: Log scale: 0.01 to 64 mg m−3
VIIRS Chl-a and Kd(490) Images in Mediterranean Sea (October 2014 to January 2015)
NOAA CoastWatch has been providing VIIRS OC data to EUMETSAT
56

NOAA Utilization of European Ocean Color Data: Way forward for Sentinel-3/OLCI
• MERIS data declared operational by NESDIS
in Jan 2009; however, Envisat failed in 2012. • Chlorophyll-a/anomalies were generated
from MERIS amongst other ocean color products, supporting NOS et al. users
• Coastwatch/NOAA was a “Champion User”
for the ESA Coast Colour Project, supporting coastal users internationally.
• STAR and others in NESDIS are now actively working to facilitate acquisition of the follow-on Sentinel-3 (OLCI et al.) data to support NOAA and other U.S. user needs.
• Sentinel-3/OLCI, like Envisat/MERIS, has improved spatial resolution (300 m), useful for coastal/inland waters, and also has additional spectral bands – and as such is a vital complementary capability to VIIRS (especially as provides mid-morning orbit).
• STAR is supporting ESA/EUMETSAT as part of the Sentinel-3 Validation Team (3 projects)
STAR’s efforts have resulted in the generation and flow of NOAA experimental and operational ocean color products to the Coastwatch user community.
http://coastwatch.noaa.gov

North Sea Coast Chl.a (MarCoast Project)
• The measurement of water quality variables via radiometric measurements of the water’s optical properties has rapidly grown over recent years. • This IOCCG working group seeks to build a stronger linkage between the water resources management end users and data providers to fully realize current & future Earth Observation products. • IOCCG Working Group Chairs: S. Greb, A. Dekker, P. DiGiacomo • Report Anticipated in 2016 timeframe
International Ocean Colour Coordinating Group Working Group: Earth Observations in Support of Global Water Quality Monitoring
MSL12-SWIR
China East Coast Chl.a (M. Wang)
NOAA MSL12-SWIR

Under the auspices of GEO, we are now working to develop and implement a global water quality monitoring and forecasting service for coastal and inland waters

GEO Water Quality Service
What: Global Water Quality Service for Inland & Coastal Waters Mission Statement: Deliver, on a routine and sustained basis, timely, consistent, accurate and fit-for-purpose water quality data products & information to support water resource management and decision making in coastal and inland waters. How: Develop, implement and maintain a global inland and coastal water quality monitoring and forecasting service, via a system of systems approach. Who: This task will be facilitated by a newly implemented GEO Water Quality (GEO-WaQ) Community of Practice. Details: Implementation plan forthcoming

GEO Blue Planet: Oceans & Society Initiative
• NOAA and CSIRO (Australia) are jointly hosting the Group for Earth Observation’s (GEO) newly established Blue Planet Secretariat, including NESDIS/STAR hosting the Science Officer/Coordinator position: Dr. Emily Smail

http://ceos.org/ourwork/virtual-constellations/ocr/
CEOS Ocean Colour Radiometry Virtual Constellation (OCR-VC)


Thanks for listening!

Measurement-based approach in support of users: Ensuring continuity & coverage Observing System Highways: Utilize satellite data from NOAA & non-NOAA missions Leverages existing science, technical, programmatic et al. infrastructure in NESDIS
SAR & High Res Imagery
OSVW Ocean Color Precip
Scie
ntifi
c en
terp
rise
appr
oach
alo
ng o
bser
ving
syst
em “h
ighw
ays”
: Ca
l/Val
; Alg
orith
m &
Pro
duct
Dev
elop
men
t; Da
ta D
istrib
utio
n,
Appl
icat
ion
Deve
lopm
ent;
Use
r Eng
agem
ent
Observations only available from
Non-NOAA missions
2014 2015 2016 2017 2018 2019
.
. 202X
Non-NOAA missions augment NOAA missions: Gap Filler
(Time, Space, Spectral et al.)
Regional Gaps
Atm soundings, Aerosols, SST, Fire, Imagery, et al.
Non-NOAA missions complement NOAA missions: Redundancy; Risk Reduction
Heritage Polar Product Continuity
Observations from NOAA
missions
POES GOES
Non-NOAA Data


