Satellite measurements of chlorophyll distribution during ...
5
Satellite measurements of chlorophyll distribution during spring 2005 in the California Current Andrew C. Thomas 1 and Peter Brickley 1 Received 13 April 2006; revised 7 July 2006; accepted 19 July 2006; published 2 September 2006. [1] Eight years of satellite data quantify spring 2005 surface chlorophyll-a (chl-a) anomalies in coastal areas of the California Current. Negative anomalies <1.0 mg m 3 begin in March north of 47°N, spread south to 43°N in April and 40°N in May and June 2005, maximum (<2.0 mg m 3 ) north of 45°N. Positive chlorophyll anomalies dominate from 40°N to 27°N during this period. Strongest negative wind stress and positive coastal surface temperature anomalies are located south of maximum chl- a anomalies, in the region of maximum climatological summer wind stress. Despite the magnitude of these wind anomalies, they remain upwelling-favorable and negative chl-a anomalies are in higher latitude regions of weaker wind anomalies, sufficient however, to prolong winter downwelling, delaying the onset of spring upwelling. In June, winds across the entire region become strongly upwelling favorable and by July, chl-a anomalies switch to positive. Citation: Thomas, A. C., and P. Brickley (2006), Satellite measurements of chlorophyll distribution during spring 2005 in the California Current, Geophys. Res. Lett., 33, L22S05, doi:10.1029/2006GL026588. 1. Introduction [2] Elevated summer chlorophyll concentrations within the California Current System are induced by upwelling of cold, nutrient-rich subsurface water driven by equatorward coastal winds and ensuing offshore Ekman transport. Sea- sonality of this wind forcing varies with latitude, from persistently upwelling with a weak late-winter seasonal maximum at the lowest latitudes (<30°N), to seasonal reversals between winter downwelling and summer upwell- ing north of 35°N with a strong summer (June–July) maximum in alongshore stress at 38°N. From 35–50°N, the summer upwelling season becomes progressively weaker and shorter with increasing latitude [ Hickey, 1998]. Climatologically, the phasing of seasonal wind forcing and local chlorophyll maxima is closely coupled over the entire region [Thomas et al., 2001], however, direct correlations of monthly non-seasonal chlorophyll and wind forcing variability are relatively weak [Strub et al., 1990, Thomas and Strub, 2001], strongest at lags of 10–20 days [Thomas and Strub, 2001]. Strong interannual variability in chlorophyll concentrations within the California Current is well documented, both in response to El Nin ˜o events [e.g., Fiedler, 1983; Kahru and Mitchell, 2000; Thomas and Strub, 2001] as well as forcing from higher latitudes through advection of subarctic water into the system [Freeland et al., 2003; Thomas et al., 2003]. [3] In the first half of 2005, reports of unseasonably warm sea surface temperatures (SSTs), fish species dis- placed from their normal range [Brodeur et al., 2006], dead sea-birds and failed nesting (W. J. Sydeman et al., Planktivorous auklet Ptychoramphus aleuticus responses to the anomaly of 2005 in the California Current, submitted to Geophysical Research Letters, 2006) (hereinafter referred to as Sydeman et al., submitted manuscript, 2006) suggested that anomalous oceanic conditions were present in the California Current system. Here, we use time series of satellite ocean color data to map broad-scale chlorophyll-a (chl-a) concentrations from 23°N to 50°N in 2005. Our goal is to quantify the magnitude and time/space patterns of anomalies at the base of the food chain that may be linked to the observed changes at higher trophic levels. Chl-a patterns in 2005 are contrasted with the time/space patterns of chlorophyll anomalies of other years and then compared to patterns in local wind forcing and SST anomalies. 2. Methods [4] Daily 4 km resolution Sea-viewing Wide-Field of view Sensor (SeaWiFS) chl-a data (Ocean Color 4 version 5.1) [O’Reilly et al., 1998] over the eight-year period September 1997 – December 2005 are regridded to a con- sistent projection retaining 4 km resolution over the Cal- ifornia Current from 23–50°N and used to calculate a time series of monthly composites. All calculations are carried out in units of chlorophyll concentration (mg m 3 ). The eight-year time series is used to form a 12-month seasonal climatology from which monthly anomalies in 2005 are derived. Interannual differences in missing data due to clouds potentially biases these anomalies. An examination of valid retrievals in 2005 compared to the 8-year mean data availability in each month, however, shows similar cover- age, suggesting that biases resulting from differences in cloud cover, although present, are minimal on the space scales emphasized here. Coastal chl-a concentrations at each latitude are characterized as the mean over the 100 km closest to shore, a region that encompasses the shelf at most latitudes and is most directly influenced by upwelling. Local wind forcing is characterized as offshore Ekman transport calculated from daily NCEP/NCAR Reanalysis 2.5 degree resolution winds. The alongshore component of stress is calculated at the two ocean grid-points closest to the coast at each latitude and averaged. These are then formed into monthly means and an 8-year climatology over the SeaWiFS mission period from which 2005 anomalies are calculated. Hourly SST data from 7 buoys between 33° and 47°N along the U.S. west coast and their associated 19-year GEOPHYSICAL RESEARCH LETTERS, VOL. 33, L22S05, doi:10.1029/2006GL026588, 2006 Click Here for Full Articl e 1 School of Marine Sciences, University of Maine, Orono, Maine, USA. Copyright 2006 by the American Geophysical Union. 0094-8276/06/2006GL026588$05.00 L22S05 1 of 5
Transcript of Satellite measurements of chlorophyll distribution during ...

Satellite measurements of chlorophyll distribution during spring 2005
in the California Current
Andrew C. Thomas1 and Peter Brickley1
Received 13 April 2006; revised 7 July 2006; accepted 19 July 2006; published 2 September 2006.
[1] Eight years of satellite data quantify spring 2005surface chlorophyll-a (chl-a) anomalies in coastal areas ofthe California Current. Negative anomalies <�1.0 mg m�3
begin in March north of �47�N, spread south to 43�N inApril and 40�N in May and June 2005, maximum (<�2.0mg m�3) north of 45�N. Positive chlorophyll anomaliesdominate from �40�N to 27�N during this period. Strongestnegative wind stress and positive coastal surfacetemperature anomalies are located south of maximum chl-a anomalies, in the region of maximum climatologicalsummer wind stress. Despite the magnitude of these windanomalies, they remain upwelling-favorable and negativechl-a anomalies are in higher latitude regions of weakerwind anomalies, sufficient however, to prolong winterdownwelling, delaying the onset of spring upwelling. InJune, winds across the entire region become stronglyupwelling favorable and by July, chl-a anomalies switch topositive. Citation: Thomas, A. C., and P. Brickley (2006),
Satellite measurements of chlorophyll distribution during spring
2005 in the California Current, Geophys. Res. Lett., 33, L22S05,
doi:10.1029/2006GL026588.
1. Introduction
[2] Elevated summer chlorophyll concentrations withinthe California Current System are induced by upwelling ofcold, nutrient-rich subsurface water driven by equatorwardcoastal winds and ensuing offshore Ekman transport. Sea-sonality of this wind forcing varies with latitude, frompersistently upwelling with a weak late-winter seasonalmaximum at the lowest latitudes (<30�N), to seasonalreversals between winter downwelling and summer upwell-ing north of �35�N with a strong summer (June–July)maximum in alongshore stress at �38�N. From 35–50�N,the summer upwelling season becomes progressivelyweaker and shorter with increasing latitude [Hickey,1998]. Climatologically, the phasing of seasonal windforcing and local chlorophyll maxima is closely coupledover the entire region [Thomas et al., 2001], however, directcorrelations of monthly non-seasonal chlorophyll and windforcing variability are relatively weak [Strub et al., 1990,Thomas and Strub, 2001], strongest at lags of 10–20 days[Thomas and Strub, 2001]. Strong interannual variability inchlorophyll concentrations within the California Current iswell documented, both in response to El Nino events [e.g.,Fiedler, 1983; Kahru and Mitchell, 2000; Thomas andStrub, 2001] as well as forcing from higher latitudes
through advection of subarctic water into the system[Freeland et al., 2003; Thomas et al., 2003].[3] In the first half of 2005, reports of unseasonably
warm sea surface temperatures (SSTs), fish species dis-placed from their normal range [Brodeur et al., 2006],dead sea-birds and failed nesting (W. J. Sydeman et al.,Planktivorous auklet Ptychoramphus aleuticus responses tothe anomaly of 2005 in the California Current, submitted toGeophysical Research Letters, 2006) (hereinafter referred toas Sydeman et al., submitted manuscript, 2006) suggestedthat anomalous oceanic conditions were present in theCalifornia Current system. Here, we use time series ofsatellite ocean color data to map broad-scale chlorophyll-a(chl-a) concentrations from 23�N to 50�N in 2005. Our goalis to quantify the magnitude and time/space patterns ofanomalies at the base of the food chain that may be linked tothe observed changes at higher trophic levels. Chl-a patternsin 2005 are contrasted with the time/space patterns ofchlorophyll anomalies of other years and then comparedto patterns in local wind forcing and SST anomalies.
2. Methods
[4] Daily 4 km resolution Sea-viewing Wide-Field ofview Sensor (SeaWiFS) chl-a data (Ocean Color 4 version5.1) [O’Reilly et al., 1998] over the eight-year periodSeptember 1997–December 2005 are regridded to a con-sistent projection retaining 4 km resolution over the Cal-ifornia Current from 23–50�N and used to calculate a timeseries of monthly composites. All calculations are carriedout in units of chlorophyll concentration (mg m�3). Theeight-year time series is used to form a 12-month seasonalclimatology from which monthly anomalies in 2005 arederived. Interannual differences in missing data due toclouds potentially biases these anomalies. An examinationof valid retrievals in 2005 compared to the 8-year mean dataavailability in each month, however, shows similar cover-age, suggesting that biases resulting from differences incloud cover, although present, are minimal on the spacescales emphasized here. Coastal chl-a concentrations at eachlatitude are characterized as the mean over the 100 kmclosest to shore, a region that encompasses the shelf at mostlatitudes and is most directly influenced by upwelling. Localwind forcing is characterized as offshore Ekman transportcalculated from daily NCEP/NCAR Reanalysis 2.5 degreeresolution winds. The alongshore component of stress iscalculated at the two ocean grid-points closest to the coastat each latitude and averaged. These are then formedinto monthly means and an 8-year climatology over theSeaWiFS mission period from which 2005 anomalies arecalculated. Hourly SST data from 7 buoys between 33� and47�N along the U.S. west coast and their associated 19-year
GEOPHYSICAL RESEARCH LETTERS, VOL. 33, L22S05, doi:10.1029/2006GL026588, 2006ClickHere
for
FullArticle
1School of Marine Sciences, University of Maine, Orono, Maine, USA.
Copyright 2006 by the American Geophysical Union.0094-8276/06/2006GL026588$05.00
L22S05 1 of 5
monthly statistics, available from the NOAA National DataBuoy Center, illustrate SST in 2005 at specific locations anddeviations from climatological conditions. Monthly chloro-phyll values at buoy locations are extracted from the imagetime series as the mean of a 5 � 5 pixel box.
3. Results
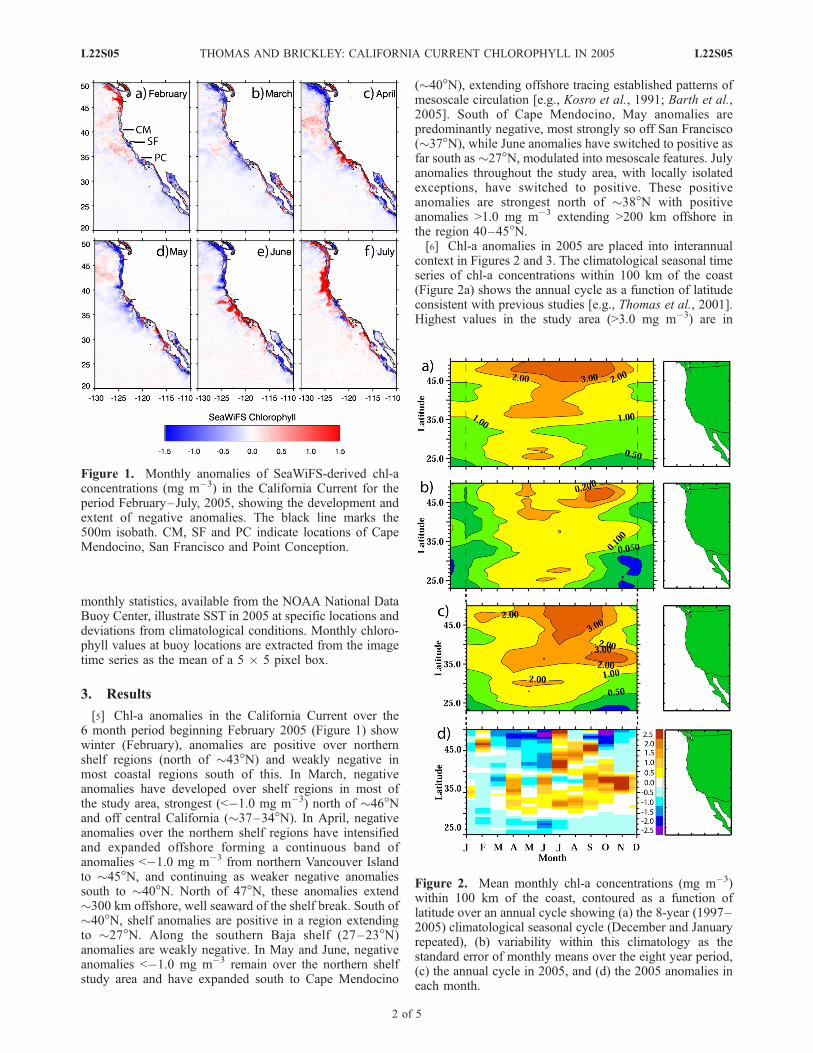
[5] Chl-a anomalies in the California Current over the6 month period beginning February 2005 (Figure 1) showwinter (February), anomalies are positive over northernshelf regions (north of �43�N) and weakly negative inmost coastal regions south of this. In March, negativeanomalies have developed over shelf regions in most ofthe study area, strongest (<�1.0 mg m�3) north of �46�Nand off central California (�37–34�N). In April, negativeanomalies over the northern shelf regions have intensifiedand expanded offshore forming a continuous band ofanomalies <�1.0 mg m�3 from northern Vancouver Islandto �45�N, and continuing as weaker negative anomaliessouth to �40�N. North of 47�N, these anomalies extend�300 km offshore, well seaward of the shelf break. South of�40�N, shelf anomalies are positive in a region extendingto �27�N. Along the southern Baja shelf (27–23�N)anomalies are weakly negative. In May and June, negativeanomalies <�1.0 mg m�3 remain over the northern shelfstudy area and have expanded south to Cape Mendocino
(�40�N), extending offshore tracing established patterns ofmesoscale circulation [e.g., Kosro et al., 1991; Barth et al.,2005]. South of Cape Mendocino, May anomalies arepredominantly negative, most strongly so off San Francisco(�37�N), while June anomalies have switched to positive asfar south as �27�N, modulated into mesoscale features. Julyanomalies throughout the study area, with locally isolatedexceptions, have switched to positive. These positiveanomalies are strongest north of �38�N with positiveanomalies >1.0 mg m�3 extending >200 km offshore inthe region 40–45�N.[6] Chl-a anomalies in 2005 are placed into interannual
context in Figures 2 and 3. The climatological seasonal timeseries of chl-a concentrations within 100 km of the coast(Figure 2a) shows the annual cycle as a function of latitudeconsistent with previous studies [e.g., Thomas et al., 2001].Highest values in the study area (>3.0 mg m�3) are in
Figure 1. Monthly anomalies of SeaWiFS-derived chl-aconcentrations (mg m�3) in the California Current for theperiod February–July, 2005, showing the development andextent of negative anomalies. The black line marks the500m isobath. CM, SF and PC indicate locations of CapeMendocino, San Francisco and Point Conception.
Figure 2. Mean monthly chl-a concentrations (mg m�3)within 100 km of the coast, contoured as a function oflatitude over an annual cycle showing (a) the 8-year (1997–2005) climatological seasonal cycle (December and Januaryrepeated), (b) variability within this climatology as thestandard error of monthly means over the eight year period,(c) the annual cycle in 2005, and (d) the 2005 anomalies ineach month.
L22S05 THOMAS AND BRICKLEY: CALIFORNIA CURRENT CHLOROPHYLL IN 2005 L22S05
2 of 5
summer north of 45�N. Seasonal maxima become progres-sively later in the summer north of �35�N, with a May–June maximum south of 30�N and a July–Septembermaximum north of �45�N. Variability about these meansover the 8-year SeaWiFS record (Figure 2b) is strongest(>0.2 mg m�3) at the beginning and end of the summermaximum north of �40�N, and in mid summer (June–July)south of �30�N, suggesting that interannual variability intiming/duration of the summer maxima is stronger thanvariability in the actual mid-summer magnitude. The sea-sonal cycle in 2005 (Figure 2c) shows strongest differencesfrom the climatology are delayed seasonal maxima in chl-aconcentrations over latitudes north of �40�N and elevatedconcentrations late in the season between 35� and 40�N andin May–July at 30�N. At lowest latitudes (<30�N), the 2005summer maximum is relatively weak but in phase with theclimatology. Chl-a anomalies in each month of 2005(Figure 2d) highlight differences from the climatology asa function of latitude, showing strongest negative values(<�1 mg m�3) north of �45�N beginning in March,expanding south to 40�N by June with maximum valuesin May–June centered at 48�N. Negative anomalies endabruptly in July, but reappear in September north of 45�N.Weak negative anomalies are also present over the firstseven months south of 30�N. Negative anomalies at bothhigher and lower latitudes contrast with positive anomaliesbetween 30–40�N in the period April–June.[7] Comparisons of the latitudinal distribution of coastal
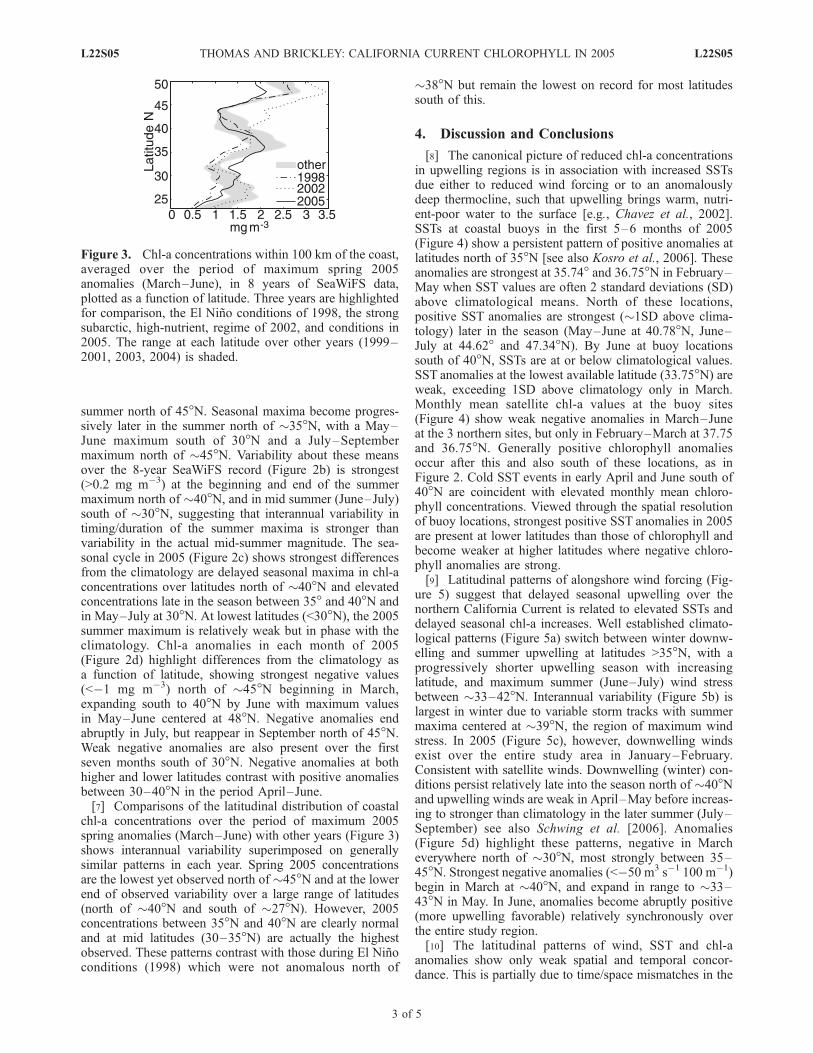
chl-a concentrations over the period of maximum 2005spring anomalies (March–June) with other years (Figure 3)shows interannual variability superimposed on generallysimilar patterns in each year. Spring 2005 concentrationsare the lowest yet observed north of �45�N and at the lowerend of observed variability over a large range of latitudes(north of �40�N and south of �27�N). However, 2005concentrations between 35�N and 40�N are clearly normaland at mid latitudes (30–35�N) are actually the highestobserved. These patterns contrast with those during El Ninoconditions (1998) which were not anomalous north of
�38�N but remain the lowest on record for most latitudessouth of this.
4. Discussion and Conclusions
[8] The canonical picture of reduced chl-a concentrationsin upwelling regions is in association with increased SSTsdue either to reduced wind forcing or to an anomalouslydeep thermocline, such that upwelling brings warm, nutri-ent-poor water to the surface [e.g., Chavez et al., 2002].SSTs at coastal buoys in the first 5–6 months of 2005(Figure 4) show a persistent pattern of positive anomalies atlatitudes north of 35�N [see also Kosro et al., 2006]. Theseanomalies are strongest at 35.74� and 36.75�N in February–May when SST values are often 2 standard deviations (SD)above climatological means. North of these locations,positive SST anomalies are strongest (�1SD above clima-tology) later in the season (May–June at 40.78�N, June–July at 44.62� and 47.34�N). By June at buoy locationssouth of 40�N, SSTs are at or below climatological values.SST anomalies at the lowest available latitude (33.75�N) areweak, exceeding 1SD above climatology only in March.Monthly mean satellite chl-a values at the buoy sites(Figure 4) show weak negative anomalies in March–Juneat the 3 northern sites, but only in February–March at 37.75and 36.75�N. Generally positive chlorophyll anomaliesoccur after this and also south of these locations, as inFigure 2. Cold SST events in early April and June south of40�N are coincident with elevated monthly mean chloro-phyll concentrations. Viewed through the spatial resolutionof buoy locations, strongest positive SST anomalies in 2005are present at lower latitudes than those of chlorophyll andbecome weaker at higher latitudes where negative chloro-phyll anomalies are strong.[9] Latitudinal patterns of alongshore wind forcing (Fig-
ure 5) suggest that delayed seasonal upwelling over thenorthern California Current is related to elevated SSTs anddelayed seasonal chl-a increases. Well established climato-logical patterns (Figure 5a) switch between winter downw-elling and summer upwelling at latitudes >35�N, with aprogressively shorter upwelling season with increasinglatitude, and maximum summer (June–July) wind stressbetween �33–42�N. Interannual variability (Figure 5b) islargest in winter due to variable storm tracks with summermaxima centered at �39�N, the region of maximum windstress. In 2005 (Figure 5c), however, downwelling windsexist over the entire study area in January–February.Consistent with satellite winds. Downwelling (winter) con-ditions persist relatively late into the season north of �40�Nand upwelling winds are weak in April–May before increas-ing to stronger than climatology in the later summer (July–September) see also Schwing et al. [2006]. Anomalies(Figure 5d) highlight these patterns, negative in Marcheverywhere north of �30�N, most strongly between 35–45�N. Strongest negative anomalies (<�50 m3 s�1 100 m�1)begin in March at �40�N, and expand in range to �33–43�N in May. In June, anomalies become abruptly positive(more upwelling favorable) relatively synchronously overthe entire study region.[10] The latitudinal patterns of wind, SST and chl-a
anomalies show only weak spatial and temporal concor-dance. This is partially due to time/space mismatches in the
Figure 3. Chl-a concentrations within 100 km of the coast,averaged over the period of maximum spring 2005anomalies (March–June), in 8 years of SeaWiFS data,plotted as a function of latitude. Three years are highlightedfor comparison, the El Nino conditions of 1998, the strongsubarctic, high-nutrient, regime of 2002, and conditions in2005. The range at each latitude over other years (1999–2001, 2003, 2004) is shaded.
L22S05 THOMAS AND BRICKLEY: CALIFORNIA CURRENT CHLOROPHYLL IN 2005 L22S05
3 of 5

sampling schemes of each measurement, e.g. Ekman trans-port from relatively smooth, course resolution wind fields,point-source buoy measurements at varying distances off-shore and chl-a data averaged over monthly time periodsand relatively large space regions. Beyond these mis-matches, however, these data suggest that a delayed onsetof upwelling-favorable winds in the spring of 2005 (F. B.Schwing et al., Delayed coastal upwelling along the U.S.west coast in 2005: A historical perspective, submitted toGeophysical Research Letters, 2006) resulted in warmcoastal SSTs [Kosro et al., 2006] and reduced coastal chl-a concentrations in March–June north of �40�N, strongest46–50�N, where both chlorophyll and primary productionwas weak (R. M. Kudela et al., Impacts on phytoplanktonbiomass and productivity in the Pacific northwest during thewarm ocean conditions of 2005, submitted to GeophysicalResearch Letters, 2006). Following the June transition topositive wind anomalies, chl-a anomalies at these higherlatitudes turn positive by July. The largest chl-a anomaliesare located north of, and spatially dissociated from, the
Figure 4. Hourly SSTs (solid line, 7-day smoothing) forthe first 9 months of 2005 at 7 NDBC coastal buoylocations and their respective climatological monthly means(boxes) and standard deviations (note missing data at44.6�N). Monthly mean 2005 chl-a at the buoy locations(dashed line), their climatological means (diamond) andstandard deviations contrast biological conditions.
Figure 5. Latitudinal patterns of monthly mean alongshorewind forcing, characterized as offshore Ekman transport(+ offshore, m3 sec�1 100m�1 of coastline), over an annualcycle showing (a) the 8-year climatology, (b) standard errorsof these means, (c) values for 2005 and (d) anomalies for2005.
L22S05 THOMAS AND BRICKLEY: CALIFORNIA CURRENT CHLOROPHYLL IN 2005 L22S05
4 of 5

strongest wind and SST anomalies that occur at latitudes ofthe climatological wind-forcing maxima. Despite thestrength of these wind anomalies, however, actual springwinds at latitudes 30–40�N remain upwelling favorable,beginning sometime in March. Associated negative chl-aanomalies are weak and patchy in time/space. Our resultsshow that development of the strongest surface chl-aanomalies in 2005 occurs at latitudes where wind anomaliesare sufficient to change the actual sign of cross-shelf Ekmantransport rather than at latitudes of maximum wind anomalymagnitude. Anomalous conditions at higher trophic levels[e.g., Brodeur et al., 2006; Sydeman et al., submittedmanuscript, 2006] also extended south of the maximumchl-a anomalies calculated here, spatially consistent with thewind and SST anomalies (Figure 5). The implication is thatecosystem response across multiple trophic levels to windanomalies at critical periods (here, spring) result fromcomplex biological-physical interactions beyond simpledelayed local upwelling and reduced surface chl-a concen-trations. For example, wind and SST anomalies likelyimpose changes in wind mixing and curl (vertical fluxes),current structure and mesoscale pattern not addressed here,each potentially impacting aspects of ecosystem function athigher trophic levels.
[11] Acknowledgments. We acknowledge the continuing effort bythe NASA GSFC ocean color team in making SeaWiFS data available tothe community, NOAA for making the buoy data accessible and ourGLOBEC colleagues for many fruitful discussions. NSF funded this workthrough grants OCE-0000899, OCE-0531289 and OCE-0535386 to ACT.Contribution 311 from the U.S. GLOBEC program.
ReferencesBarth, J. A., S. D. Pierce, and T. J. Cowles (2005), Mesoscale structure andits seasonal evolution in the northern California Current System, DeepSea Res., Part II, 52, 5–28.
Brodeur, R. D., S. Ralston, R. L. Emmett, M. Trudel, T. D. Auth, and A. J.Phillips (2006), Anomalous pelagic nekton abundance, distribution andapparent recruitment in the northern California Current in 2004 and 2005,Geophys. Res. Lett., doi:10.1029/2006GL026614, in press.
Chavez, F. P., J. T. Pennington, C. G. Castro, J. P. Ryan, R. P. Machisaki,B. Schlining, P. Walz, K. R. Buck, A. McFadyen, and C. A. Collins(2002), Biological and chemical consequences of the 1997–1998 El Ninoin central California waters, Prog. Oceanogr., 54, 205–232.
Fiedler, P. C. (1983), Satellite observations of the 1982–83 El Nino alongthe U.S. Pacific coast, Science, 224, 1251–1254.
Freeland, H. J., G. Gatien, A. Huyer, and R. L. Smith (2003), Cold halo-cline in the northern California Current: An invasion of subarctic water,Geophys. Res. Lett., 30(3), 1141, doi:10.1029/2002GL016663.
Hickey, B. M. (1998), Coastal oceanography of western North Americafrom the tip of Baja California to Vancouver Island, in The Sea, editedby A. R. Robinson and K. H. Brink, pp. 345–394, John Wiley, Hoboken,N. J.
Kahru, M., and B. G. Mitchell (2000), Influence of the 1997–98 El Ninoon the surface chlorophyll in the California Current, Geophys. Res. Lett.,27, 2937–2940.
Kosro, P. M., et al. (1991), The structure of the transition zone betweencoastal waters and the open ocean off northern California, winter andspring 1987, J. Geophys. Res., 96, 14,707–14,730.
Kosro, P. M., W. T. Peterson, B. M. Hickey, R. K. Shearman, and S. D.Pierce (2006), The physical versus the biological spring transition: 2005,Geophys. Res. Lett., doi:10.1029/2006GL027072, in press.
O’Reilly, J., S. Maritorena, B. G. Mitchell, D. A. Seigel, K. L. Carder,M. Kahru, S. A. Garver, and C. R. McClain (1998), Ocean coloralgorithms for SeaWiFS, J. Geophys. Res., 103, 24,937–24,953.
Schwing, F. B., N. A. Bond, S. J. Bograd, T. Mitchell, M. A. Alexander,and N. Mantua (2006), Delayed coastal upwelling along the U.S. WestCoast in 2005: A historical perspective, Geophys. Res. Lett., doi:10.1029/2006GL026911, in press.
Strub, P. T., C. James, A. C. Thomas, and M. R. Abbott (1990), Seasonaland nonseasonal variability of satellite-derived surface pigment concen-tration in the California Current, J. Geophys. Res., 95(C7), 11,501–11,530.
Thomas, A. C., and P. T. Strub (2001), Cross-shelf phytoplankton pig-ment variability in the California Current, Cont. Shelf Res., 21, 1157–1190.
Thomas, A. C., M. E. Carr, and P. T. Strub (2001), Chlorophyll varia-bility in eastern boundary currents, Geophys. Res. Lett., 28, 3421–3424.
Thomas, A. C., P. T. Strub, and P. Brickley (2003), Anomalous chlorophyllconcentrations in the California Current in 2001–2002, Geophys. Res.Lett., 30(15), 8022, doi:10.1029/2003GL017409.
�����������������������P. Brickley and A. C. Thomas, School of Marine Sciences, University of
Maine, 5706 Aubert Hall, Orono, ME 04469-5706, USA. ([email protected])
L22S05 THOMAS AND BRICKLEY: CALIFORNIA CURRENT CHLOROPHYLL IN 2005 L22S05
5 of 5