Satellite Imagery Overview for Pilots Inside · 2 Infrared Imagery Infrared (IR) satellite imagery...
18
October 2008 NOAA’s National Weather Service Volume 8, Number 2 Mission Statement To enhance aviation safety by increasing the pilot’s knowledge of weather systems and processes and National Weather Service products and services. Managing Editor: Michael Graf [email protected] Editor/Layout: Melody Magnus [email protected] Editor: Darcey Dodd Inside Reaching Local Pilots with Real Weather Patterns Page Page 5 Aviation Challenges Regarding Smoke Obscuration and Weather Page 13 When’s the Next Front? Would you like an email alert when a new edition of The Front is published? Write [email protected]. Satellite Imagery Overview for Pilots By Matt Fugazzi, NWS Spokane, WA [email protected] During my interaction with the aviation community, I have noticed an increasing interest in satellite imagery. Pilots now have access to near real time satellite image products, easily accessible from NWS Websites as well as an increasing number of private Websites and other sources. A variety of frequently updated high resolution satellite images are available, each offering insight and clues about weather conditions along a pilot’s intended route of travel. The imagers aboard the weather satellites now can detect radiation that clouds reflect and emit in a variety of spectrum widths. This allows images to be produced highlighting various levels and cloud types in the atmosphere over a given location. When pilots study satellite images for their route or location by toggling through the different channels, they gain a better understanding of current and short-term expected flight conditions inferred during the pre-flight briefing routine. Resolution When you go to a Website offering satellite imagery, you may be offered a variety of resolution choices for an image. The resolution of a satellite image is a measure of how much detail you can discern. The resolution number, expressed in kilometers, expresses the size of the smallest object that can be visually resolved on an image. Smaller resolution numbers, most commonly 1 km or 2 km, are able to show minute objects such as individual cumulus cells. These smaller scale images typically cover specific areas, generally the size of a medium sized state. Larger resolution numbers generally cover broader areas. A 16 km or 28 km resolution satellite image will often display a region thousands of miles wide, such as an ocean basin or the entire continental United States. Such images are used mainly to observe and analyze large scale weather systems. Small scale weather systems, such as thunderstorms, are usually difficult to resolve on large scale images. Common Types of Satellite Imagery The two Geostationary Operational Environmental Satellites (GOES) in geosynchronous orbit over the Atlantic and Pacific basins routinely provide multiple images from different spectral channels simultaneously. Each type of image offers certain advantages and disadvantages in analyzing the cloud field over the region of interest. An overview of the advantages and weaknesses of the most commonly available satellite image types follows.
Transcript of Satellite Imagery Overview for Pilots Inside · 2 Infrared Imagery Infrared (IR) satellite imagery...
October 2008 NOAA’s National Weather Service Volume 8, Number 2
Mission StatementTo enhance aviation safety
by increasing the pilot’s knowledge of weather systems and processes and National Weather Service products and services.
Managing Editor: Michael Graf [email protected]
Editor/Layout: Melody Magnus [email protected]
Editor: Darcey Dodd
Inside
Reaching Local Pilots
with Real Weather Patterns Page
Page 5
Aviation Challenges Regarding Smoke Obscuration and
Weather Page 13
When’s the Next Front?Would you like an email
alert when a new edition of The Front is published? Write [email protected].
Satellite Imagery Overview for PilotsBy Matt Fugazzi, NWS Spokane, WA [email protected]
During my interaction with the aviation community, I have noticed an increasing interest in satellite imagery. Pilots now have access to near real time satellite image products, easily accessible from NWS Websites as well as an increasing number of private Websites and other sources. A variety of frequently updated high resolution satellite images are available, each offering insight and clues about weather conditions along a pilot’s intended route of travel.
The imagers aboard the weather satellites now can detect radiation that clouds reflect and emit in a variety of spectrum widths. This allows images to be produced highlighting various levels and cloud types in the atmosphere over a given location. When pilots study satellite images for their route or location by toggling through the different channels, they gain a better understanding of current and short-term expected flight conditions inferred during the pre-flight briefing routine.
Resolution
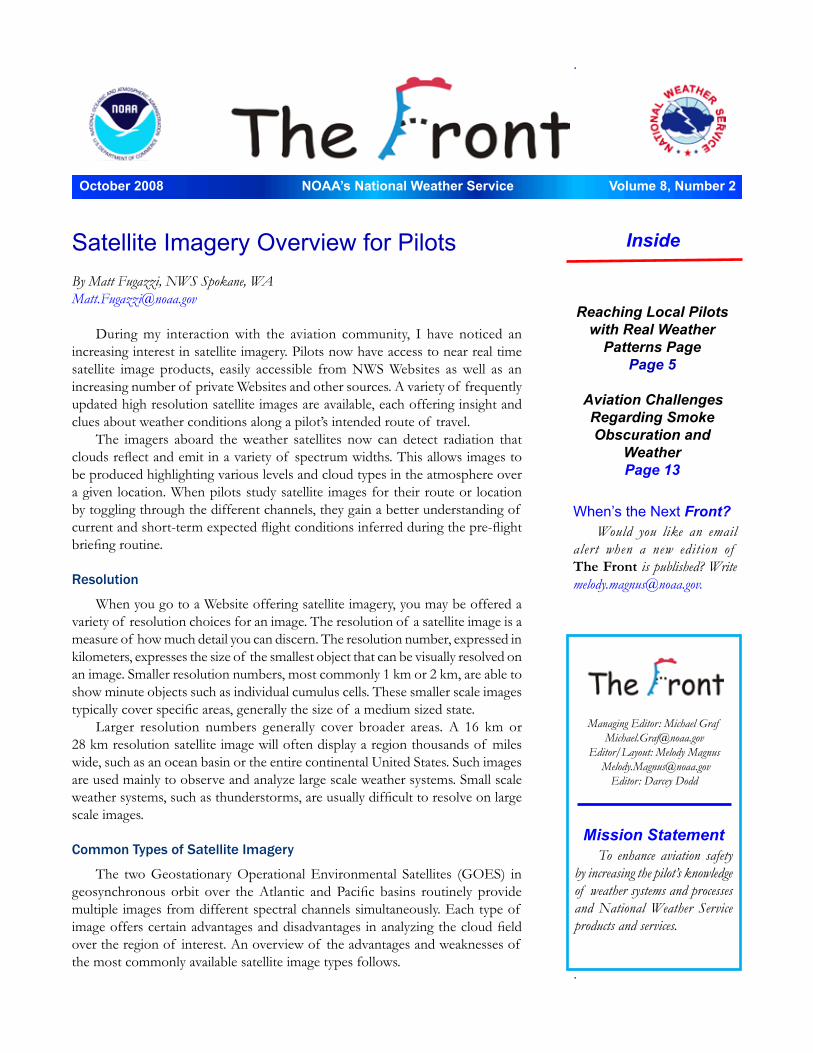
When you go to a Website offering satellite imagery, you may be offered a variety of resolution choices for an image. The resolution of a satellite image is a measure of how much detail you can discern. The resolution number, expressed in kilometers, expresses the size of the smallest object that can be visually resolved on an image. Smaller resolution numbers, most commonly 1 km or 2 km, are able to show minute objects such as individual cumulus cells. These smaller scale images typically cover specific areas, generally the size of a medium sized state.
Larger resolution numbers generally cover broader areas. A 16 km or 28 km resolution satellite image will often display a region thousands of miles wide, such as an ocean basin or the entire continental United States. Such images are used mainly to observe and analyze large scale weather systems. Small scale weather systems, such as thunderstorms, are usually difficult to resolve on large scale images.
Common Types of Satellite Imagery
The two Geostationary Operational Environmental Satellites (GOES) in geosynchronous orbit over the Atlantic and Pacific basins routinely provide multiple images from different spectral channels simultaneously. Each type of image offers certain advantages and disadvantages in analyzing the cloud field over the region of interest. An overview of the advantages and weaknesses of the most commonly available satellite image types follows.
2
Infrared Imagery
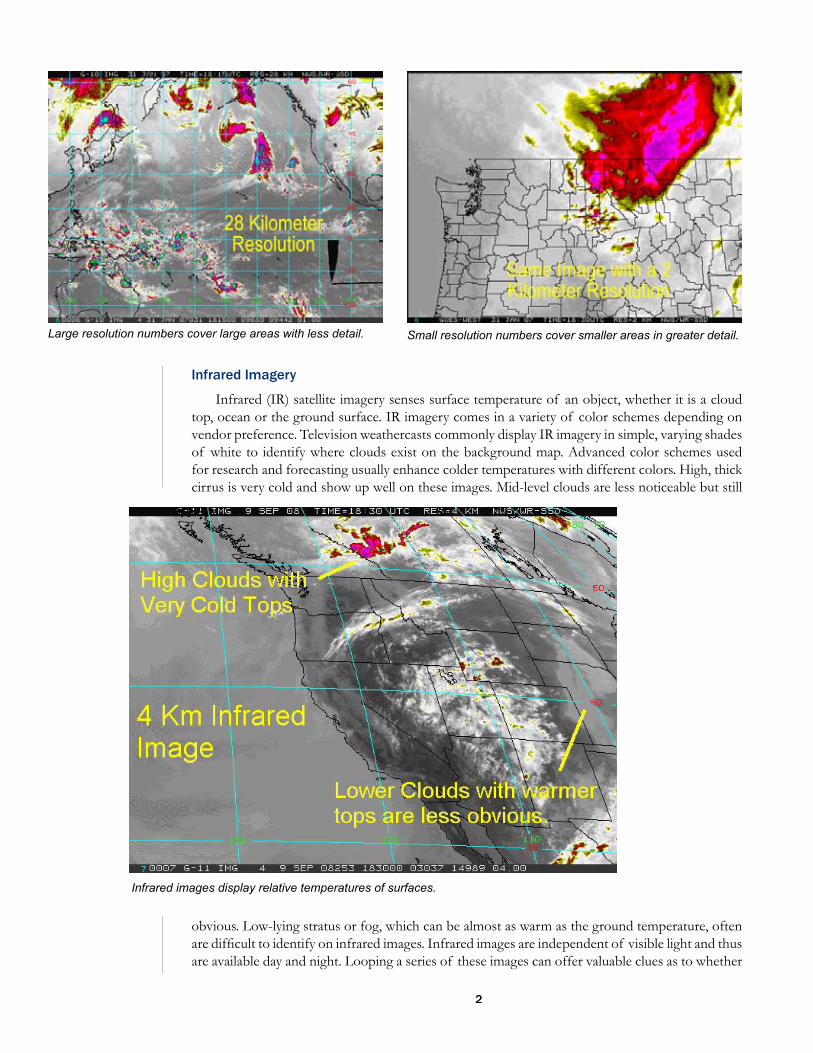
Infrared (IR) satellite imagery senses surface temperature of an object, whether it is a cloud top, ocean or the ground surface. IR imagery comes in a variety of color schemes depending on vendor preference. Television weathercasts commonly display IR imagery in simple, varying shades of white to identify where clouds exist on the background map. Advanced color schemes used for research and forecasting usually enhance colder temperatures with different colors. High, thick cirrus is very cold and show up well on these images. Mid-level clouds are less noticeable but still
obvious. Low-lying stratus or fog, which can be almost as warm as the ground temperature, often are difficult to identify on infrared images. Infrared images are independent of visible light and thus are available day and night. Looping a series of these images can offer valuable clues as to whether
Small resolution numbers cover smaller areas in greater detail.
Infrared images display relative temperatures of surfaces.
Large resolution numbers cover large areas with less detail.
3
a system is strengthening or weakening based on whether the cloud tops are cooling or warming within the observed weather system.
Visible Imagery
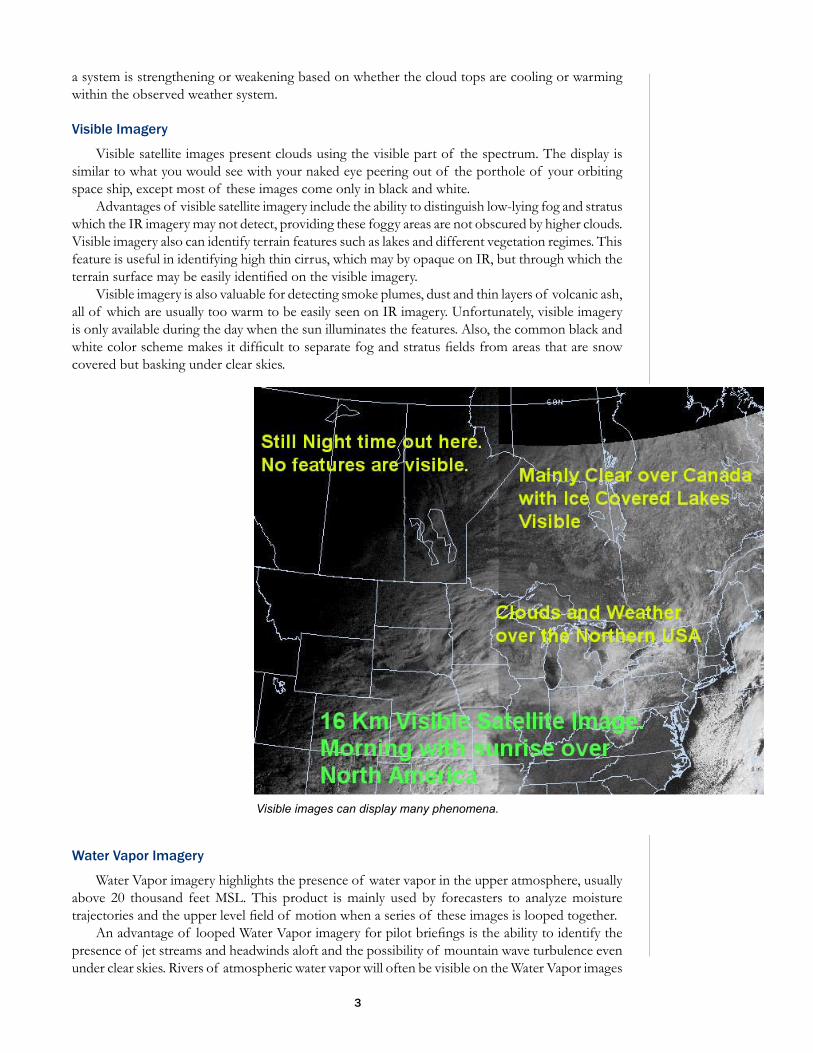
Visible satellite images present clouds using the visible part of the spectrum. The display is similar to what you would see with your naked eye peering out of the porthole of your orbiting space ship, except most of these images come only in black and white.
Advantages of visible satellite imagery include the ability to distinguish low-lying fog and stratus which the IR imagery may not detect, providing these foggy areas are not obscured by higher clouds. Visible imagery also can identify terrain features such as lakes and different vegetation regimes. This feature is useful in identifying high thin cirrus, which may by opaque on IR, but through which the terrain surface may be easily identified on the visible imagery.
Visible imagery is also valuable for detecting smoke plumes, dust and thin layers of volcanic ash, all of which are usually too warm to be easily seen on IR imagery. Unfortunately, visible imagery is only available during the day when the sun illuminates the features. Also, the common black and white color scheme makes it difficult to separate fog and stratus fields from areas that are snow covered but basking under clear skies.
Water Vapor Imagery
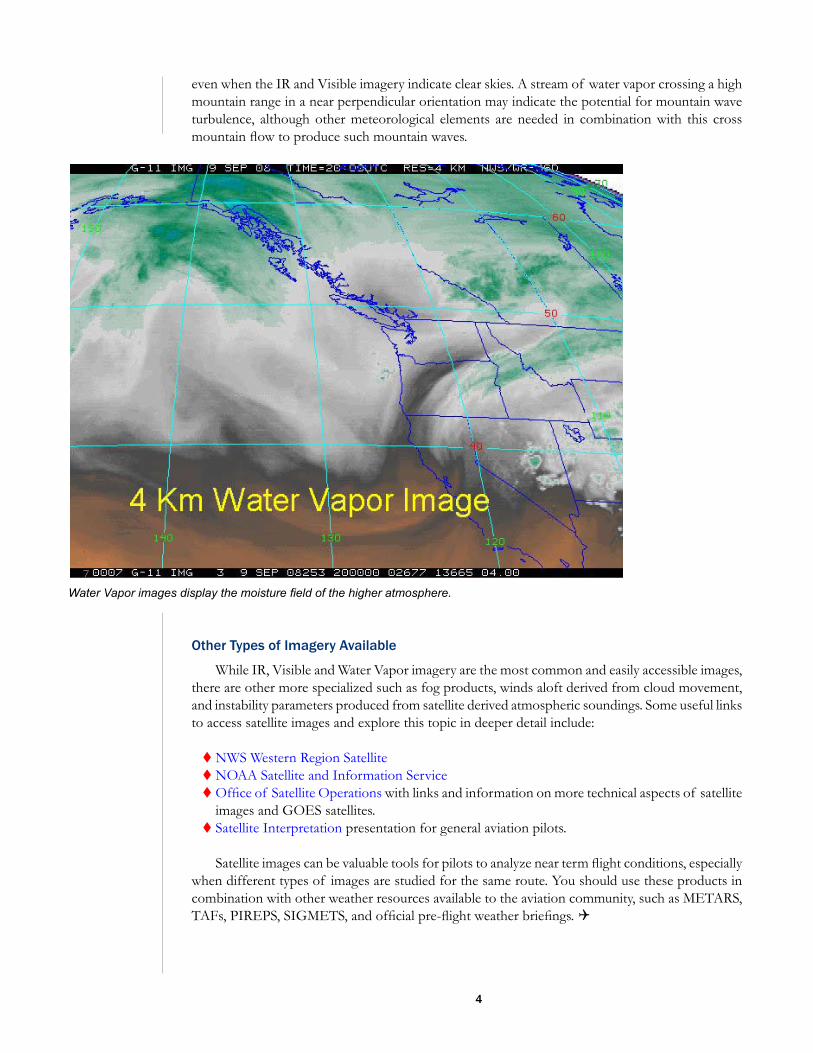
Water Vapor imagery highlights the presence of water vapor in the upper atmosphere, usually above 20 thousand feet MSL. This product is mainly used by forecasters to analyze moisture trajectories and the upper level field of motion when a series of these images is looped together.
An advantage of looped Water Vapor imagery for pilot briefings is the ability to identify the presence of jet streams and headwinds aloft and the possibility of mountain wave turbulence even under clear skies. Rivers of atmospheric water vapor will often be visible on the Water Vapor images
Visible images can display many phenomena.
4
even when the IR and Visible imagery indicate clear skies. A stream of water vapor crossing a high mountain range in a near perpendicular orientation may indicate the potential for mountain wave turbulence, although other meteorological elements are needed in combination with this cross mountain flow to produce such mountain waves.
Other Types of Imagery Available
While IR, Visible and Water Vapor imagery are the most common and easily accessible images, there are other more specialized such as fog products, winds aloft derived from cloud movement, and instability parameters produced from satellite derived atmospheric soundings. Some useful links to access satellite images and explore this topic in deeper detail include:
NWS Western Region Satellite �NOAA Satellite and Information Service �Office of Satellite Operation � s with links and information on more technical aspects of satellite images and GOES satellites. Satellite Interpretatio � n presentation for general aviation pilots.
Satellite images can be valuable tools for pilots to analyze near term flight conditions, especially when different types of images are studied for the same route. You should use these products in combination with other weather resources available to the aviation community, such as METARS, TAFs, PIREPS, SIGMETS, and official pre-flight weather briefings. Q
Water Vapor images display the moisture field of the higher atmosphere.
5
How Real Weather Patterns Affect FlightBy Clinton Rockey, NWS Portland, OR [email protected]
Every year, hundreds of pilots and aviation enthusiasts visit the Pacific Northwest Aviation Exposition in Puyallup, WA. It is a time for sharing stories, viewing the latest aviation advances in technology and techniques, and refreshing their knowledge of weather. For many years, NWS has provided weather seminars geared to refreshing pilots’ ground school weather knowledge and presenting in-depth information on local weather phenomena of the Pacific Northwest.
One of the more popular seminars of recent years has been one I wrote entitled the Satellite Interpretation and Weather Patterns in the Pacific Northwest. As a pilot, I know first- hand that the current ground school training pilots receive is often be expanded on. Granted, weather books used in ground school weather training, such as NOAA’s Aviation Weather and Pilot Briefer’s Guide to Weather, cover many of the generalized patterns, but they lack specifics geared to the local area. Many pilots would benefit from a basic review of key satellite images and elementary interpretation, as well as a local flavor of weather phenomena that affects their flight operations.
The Internet has become a beacon for quick access to data for weather enthusiasts and pilots are no exception. It is estimated that more than 80% of pilots receive basic pre-flight weather planning information from NWS Websites. NOAA’s satellite images have become all the rage on NWS forecast office Web pages (see http://www.wrh.noaa.gov/satellite/). Unfortunately, solid interpretation of that satellite information is often lacking.
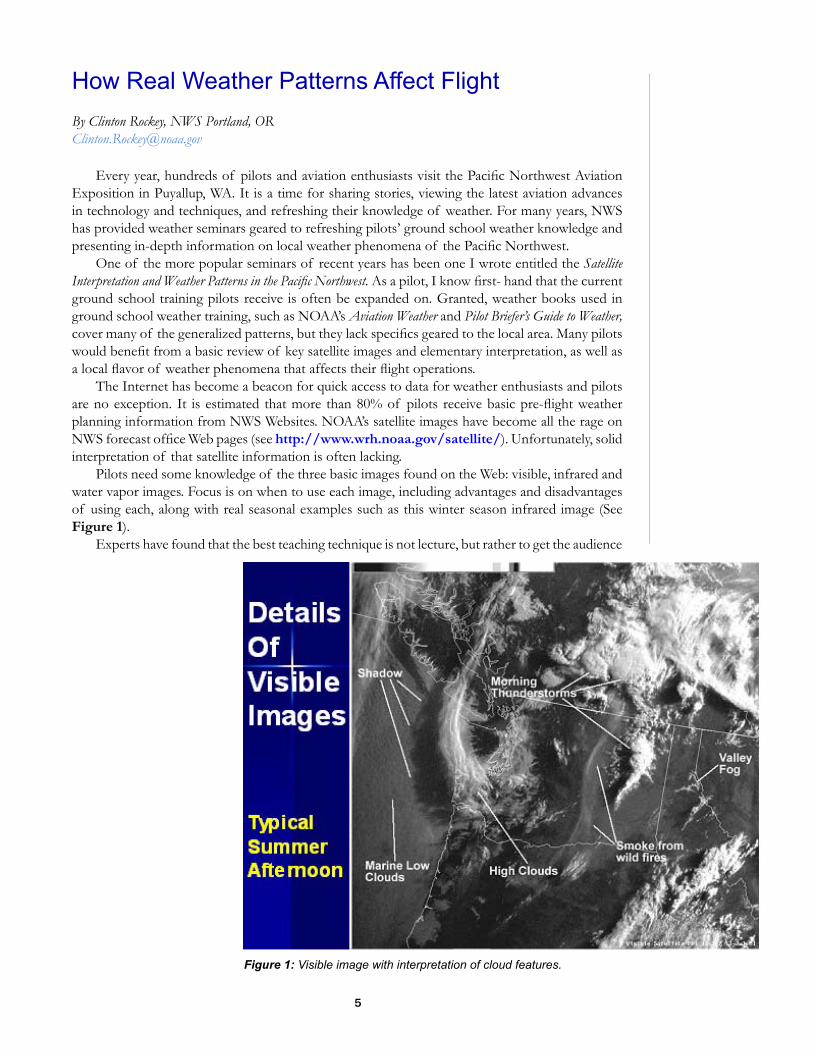
Pilots need some knowledge of the three basic images found on the Web: visible, infrared and water vapor images. Focus is on when to use each image, including advantages and disadvantages of using each, along with real seasonal examples such as this winter season infrared image (See Figure 1).
Experts have found that the best teaching technique is not lecture, but rather to get the audience
Figure 1: Visible image with interpretation of cloud features.

6
as involved. So after discussing some basic interpretation, it is now the audience’s turn to identify features (Figure 2). After they provide their best guesses, I reveal some of the features they should be aware of or able to identify (Table 1). Time-lapse animations of images spaced about 3 hours apart are quite beneficial for these identification exercises.
After a basic review of satellite interpretation, a closer look at weather phenomena of the autumn
Figure 2: Example of an image where pilots must identify some basic features: developing low pressure, cold air cumulus field off the Pacific Northwest coast, and marine stratus along the south California coastline.
Image What Pilots Should Be Able to Identify Why to Use Caution with Image
VisibleFog/stratus extent. Determine difference between stratus/fog and snow-covered peaks. Be able to infer low level wind flow.
Difficult to tell snow from clouds
Infrared Determine areas of cold/warm air advection as well as precipitation trends or areas.
Cold air mistaken for stationary clouds or precipitation.
Water VaporSee upper features that may affect inversions.Watching for dry air advection, which is good precursor for nighttime fog.
Hard to determine which area are precipitation as may just be thick clouds.
Table 1: Expectations for pilots when interpreting satellite imagery as well as words of caution.
7
and winter months is more readily received. For the Pacific Northwest, there is an abundance of winter weather, each event accompanied with its own challenging conditions for pilots. Like all good weather junkies, I can go on discussing weather forever; however, during such an outreach stage, time is confined, forcing such a discussion to only four key local phenomena:
Cold air convection �Radiation fog �Marine stratus and surges �Puget Sound Convergence Zone (PSCZ). �
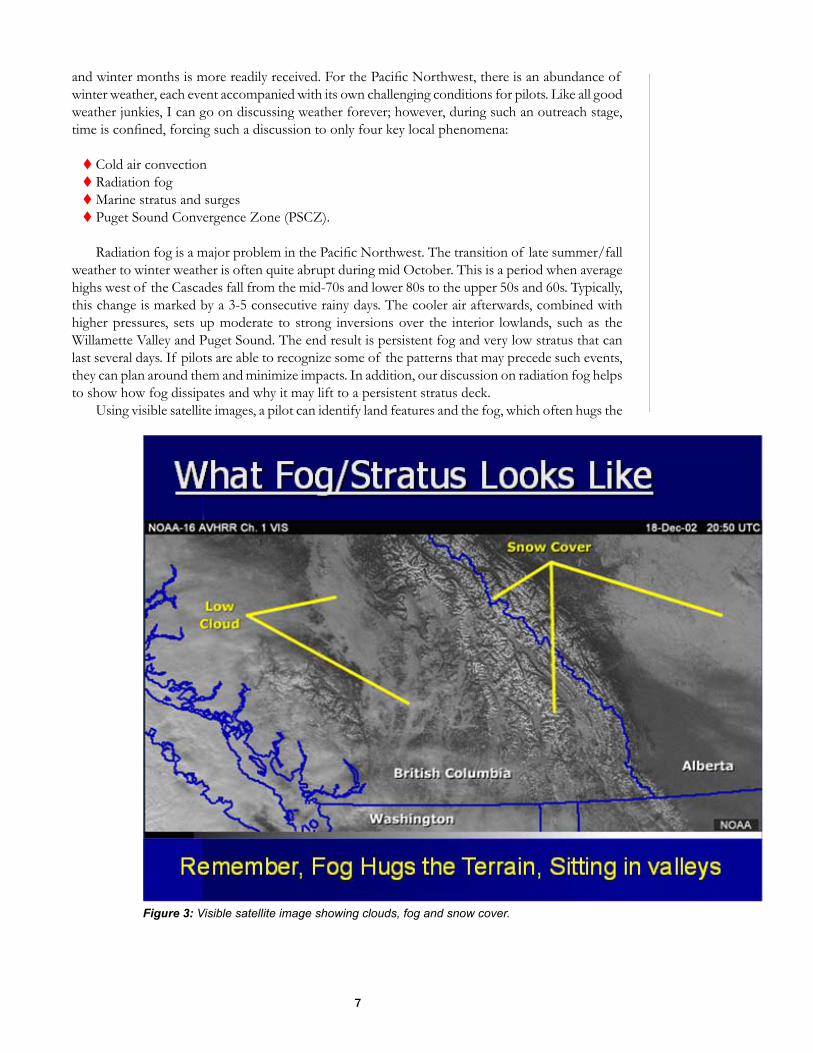
Radiation fog is a major problem in the Pacific Northwest. The transition of late summer/fall weather to winter weather is often quite abrupt during mid October. This is a period when average highs west of the Cascades fall from the mid-70s and lower 80s to the upper 50s and 60s. Typically, this change is marked by a 3-5 consecutive rainy days. The cooler air afterwards, combined with higher pressures, sets up moderate to strong inversions over the interior lowlands, such as the Willamette Valley and Puget Sound. The end result is persistent fog and very low stratus that can last several days. If pilots are able to recognize some of the patterns that may precede such events, they can plan around them and minimize impacts. In addition, our discussion on radiation fog helps to show how fog dissipates and why it may lift to a persistent stratus deck.
Using visible satellite images, a pilot can identify land features and the fog, which often hugs the
Figure 3: Visible satellite image showing clouds, fog and snow cover.
8
terrain as it sits in lowlands and valleys (Figure 3). Many pilots mistake fog with snow on images, but snow does not move over time, and often allows rivers and other geographic features to appear. Snow-capped mountains beneath clear skies are easily recognizable.
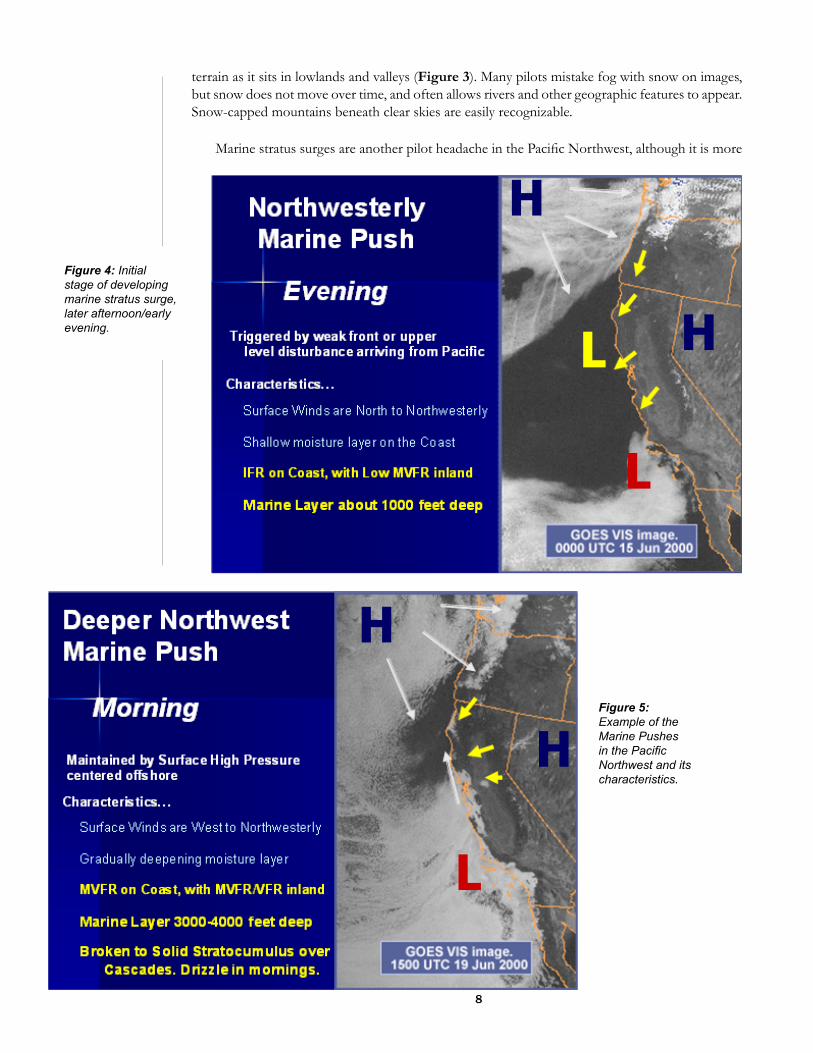
Marine stratus surges are another pilot headache in the Pacific Northwest, although it is more
Figure 4: Initial stage of developing marine stratus surge, later afternoon/early evening.
Figure 5: Example of the Marine Pushes in the Pacific Northwest and its characteristics.

9
problematic in the warm season. The course shows time loop satellite images and pressure patterns depicting the progress from clear skies with a thermal low pressure trough on the coast line to the end result, a deep marine layer of stratus covering much of the region west of the Cascades (Figures 4 and 5). Many pilots especially appreciate this topic as much of the weather is governed by the marine layer. One of the aspects most valued is the description of flight conditions through each of the phases of the marine stratus surge.
The Puget Sound Convergence Zone (PSCZ) is also a key topic. Though it is relatively understood and recognized by pilots in the Puget Sound area, it is not well known further away. The zone hinges on low level air flow around the Olympic Mountains, which act as a giant rock in the air flow. Behind a strong cold front, air flow off the Pacific increases into the Pacific Northwest. In a pure equal flow scenario, the flow around the north side of the Olympics will move up the Strait of Juan de Fuca into the north Puget Sound, then split to the north and south. Likewise, the flow around the south side of the Olympics move into the south Puget Sound, then turn north and south. The Puget Sound Convergence Zone occurs where the northern branch meets the southern branch (marked by a white ellipse in Figure 6).
Wind direction, northwesterly or southwesterly, determines where in the Puget Sound the PSCZ forms. If the winds are more southwesterly, then the flow into the south Puget Sound will be stronger, pushing the PSCZ north. Similarly, if north to northwest winds are stronger, the PSCZ moves further south in Puget Sound, affecting air traffic in and out of Seattle’s SEA-TAC airport.
Conditions in and near the PSCZ significantly change as you traverse the zone. Marginal conditions (MVFR) often are forecast in the Puget Sound, with areas of open sky (visual flight conditions, or VFR); however, in a narrow band, conditions deteriorate to instrument flight conditions (IFR) in the PSCZ. This PSCZ will be dominated by moderate to heavy precipitation. It is not uncommon during the colder outbreaks to see heavy snow in the PSCZ. Despite the weather, this is not a safe area to fly in.
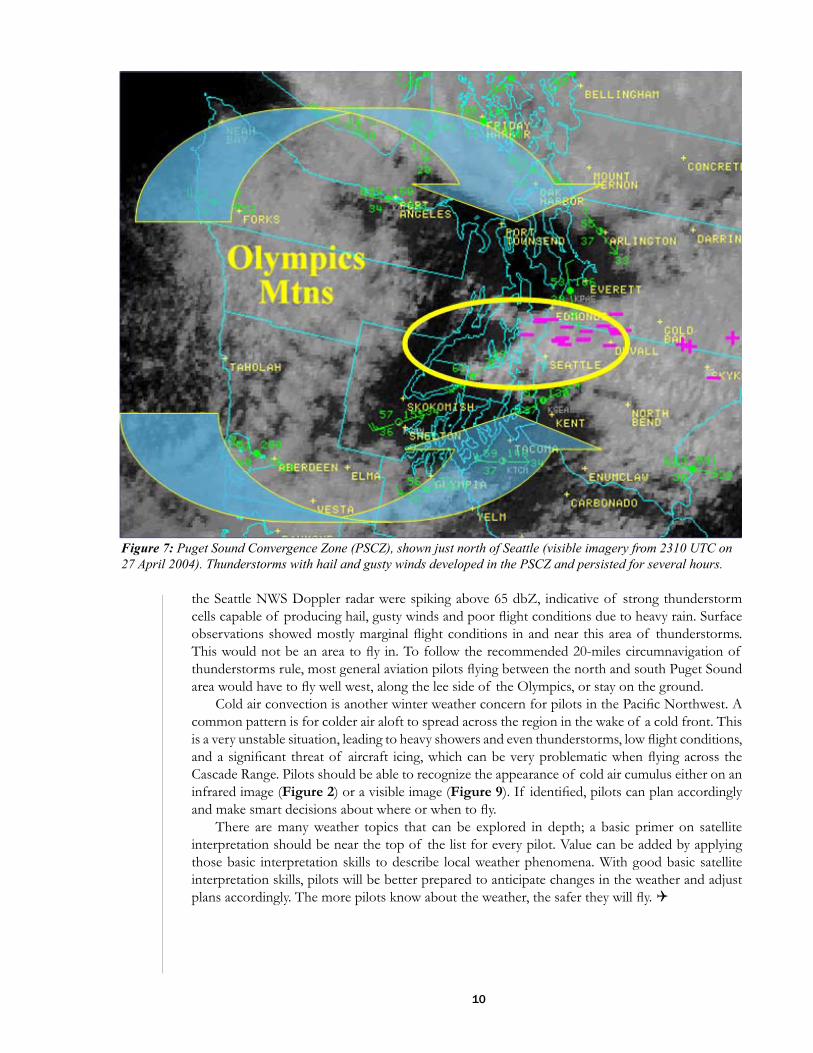
Figures 7 and 8 show a moderately strong PSCZ that occurred on April 27, 2004. A strong cold front moved across the region 12 hours earlier. By the afternoon of April 27, moderate low level winds (below 7000 feet MSL) developed. Flow moved around the Olympics (shown by arrows in Figure 7), and converged in the mid-Puget Sound area. The end result was the PSCZ (shown in Figure 7 by a yellow ellipse). Due to the unstable air mass, this was the focus for thunderstorms with gusty winds and small hail that persisted into the evening.
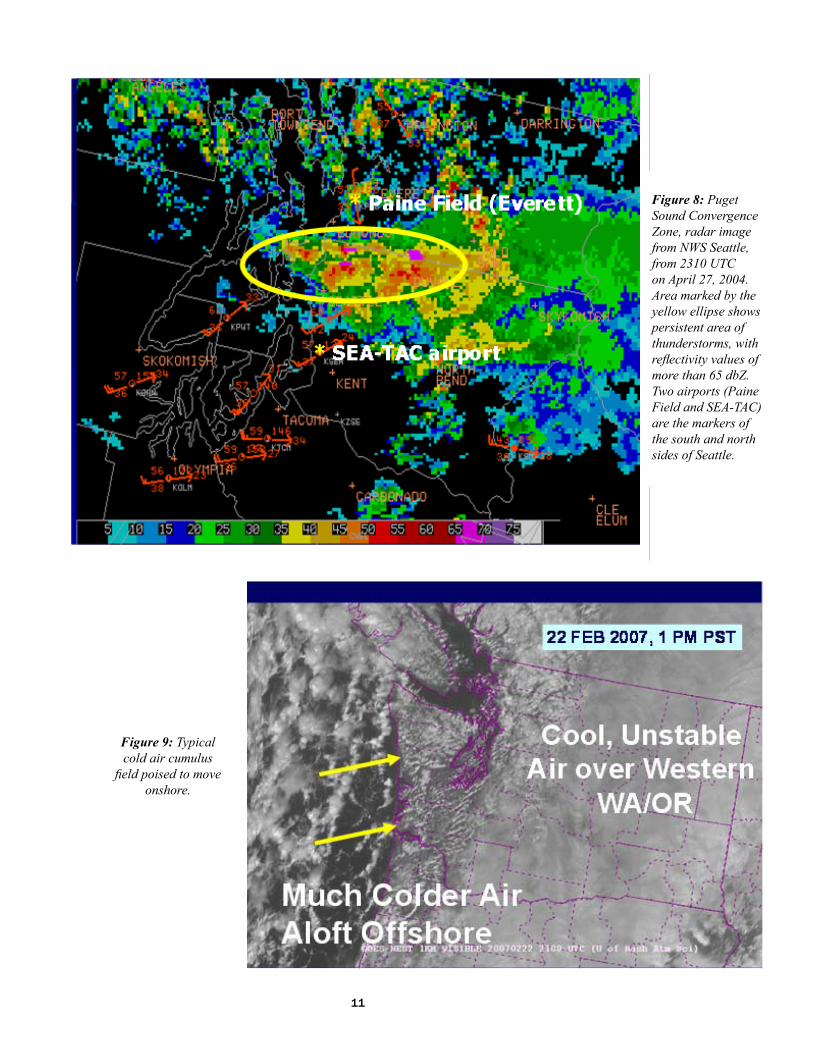
Figure 8 shows the radar imagery in the same time frame. This persistent area of thunderstorms continued to regenerate in the same area, with cells propagating eastward. Reflectivity values from
Figure 6: Puget Sound Convergence Zone, circled by a white ellipse, and wind flow around the Olympic Mountains into the Puget Sound.
10
the Seattle NWS Doppler radar were spiking above 65 dbZ, indicative of strong thunderstorm cells capable of producing hail, gusty winds and poor flight conditions due to heavy rain. Surface observations showed mostly marginal flight conditions in and near this area of thunderstorms. This would not be an area to fly in. To follow the recommended 20-miles circumnavigation of thunderstorms rule, most general aviation pilots flying between the north and south Puget Sound area would have to fly well west, along the lee side of the Olympics, or stay on the ground.
Cold air convection is another winter weather concern for pilots in the Pacific Northwest. A common pattern is for colder air aloft to spread across the region in the wake of a cold front. This is a very unstable situation, leading to heavy showers and even thunderstorms, low flight conditions, and a significant threat of aircraft icing, which can be very problematic when flying across the Cascade Range. Pilots should be able to recognize the appearance of cold air cumulus either on an infrared image (Figure 2) or a visible image (Figure 9). If identified, pilots can plan accordingly and make smart decisions about where or when to fly.
There are many weather topics that can be explored in depth; a basic primer on satellite interpretation should be near the top of the list for every pilot. Value can be added by applying those basic interpretation skills to describe local weather phenomena. With good basic satellite interpretation skills, pilots will be better prepared to anticipate changes in the weather and adjust plans accordingly. The more pilots know about the weather, the safer they will fly. Q
Figure 7: Puget Sound Convergence Zone (PSCZ), shown just north of Seattle (visible imagery from 2310 UTC on 27 April 2004). Thunderstorms with hail and gusty winds developed in the PSCZ and persisted for several hours.
11
Figure 8: Puget Sound Convergence Zone, radar image from NWS Seattle, from 2310 UTC on April 27, 2004. Area marked by the yellow ellipse shows persistent area of thunderstorms, with reflectivity values of more than 65 dbZ. Two airports (Paine Field and SEA-TAC) are the markers of the south and north sides of Seattle.
Figure 9: Typical cold air cumulus
field poised to move onshore.

12
Figure 10: What features do you see, or can infer from this satellite image? Answers: (A) thunderstorm, (B) cumulus clouds, (C) high cirrus clouds, (D) a ship’s smoke trail, seen through thin marine stratus, and (E) stratus being blown away from the coast on northeasterly winds.
13
Aviation Challenges Regarding Smoke Obscuration and WeatherBy Gina McGuire, Meteorologist, NWS Reno, NV [email protected]
Observing weather in the western United States bring an array of challenges. The effects of terrain on weather are diverse and localized. Weather can change rapidly and significantly, heavily impacting aviation. One common observing challenge is the effect of smoke from forest fires.
From late June through July 2008, northern and central California and portions of Nevada had to compensate for smoke from the thousands of wildfires ignited in northern and central California. The fires were caused by a storm system producing dry lightning, a phenomena that occurs when thunderstorms produce a significant amount of lightning, but little rainfall, due to a dry atmosphere. Dry lightning also can occur when storms are moving fast enough that any significant amount of rain falls in locations other than where cloud-to-ground lightning occurred. Thus, dry lightning can spark wildfires if the fuels are dry and critical enough.
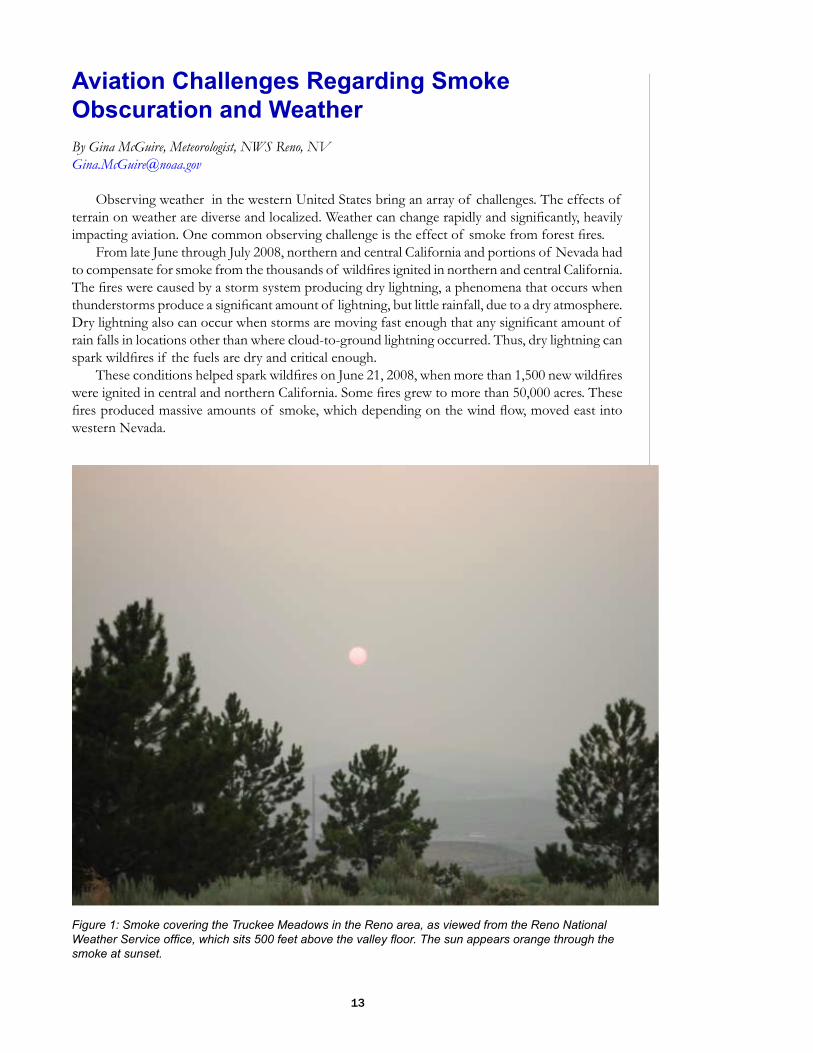
These conditions helped spark wildfires on June 21, 2008, when more than 1,500 new wildfires were ignited in central and northern California. Some fires grew to more than 50,000 acres. These fires produced massive amounts of smoke, which depending on the wind flow, moved east into western Nevada.
Figure 1: Smoke covering the Truckee Meadows in the Reno area, as viewed from the Reno National Weather Service office, which sits 500 feet above the valley floor. The sun appears orange through the smoke at sunset.
14
NWS Reno issues four daily Terminal Aerodrome Forecasts (TAF): Reno-Tahoe International Airport (KRNO) �Truckee-Tahoe Airport (KTRK) �South Lake Tahoe Airport (KTVL) �Lovelock-Derby Field (KLOL) �
All of these airports were impacted by smoke at some point during a 6-week period beginning the last week in June. As is frequently the case on the east slopes of the Sierra Nevada Mountain Range and in western Nevada, the terrain and thermally driven winds combine to produce a predominantly westerly afternoon wind flow.
This pattern was enough to push smoke from California over the Sierra Nevada Mountain Range for many days, which, at times, settled into higher valleys in the Sierra and the Truckee Meadows in western Nevada, including Reno-Tahoe International Airport. Of the four airports covered by NWS Reno, only Reno-Tahoe has full-time weather observers who can augment observations 24 hours a day.
The smoke caused many aviation problems during those 6 weeks, such as ceiling and visibility restrictions. It also spotlighted conflicting opinions between the Reno Airport contract weather observers and the FAA Tower on weather conditions. The tower, which sits just over 70 feet high, is situated on the opposite side of the runway from the weather observers.
Another major challenge was the observers lack of inexperience with obscurations such as smoke. To help resolve the problem, Reno Airport weather observers contacted NWS Reno staff for questions on properly observing smoke obscurations, which seemed to help the less experienced observers.
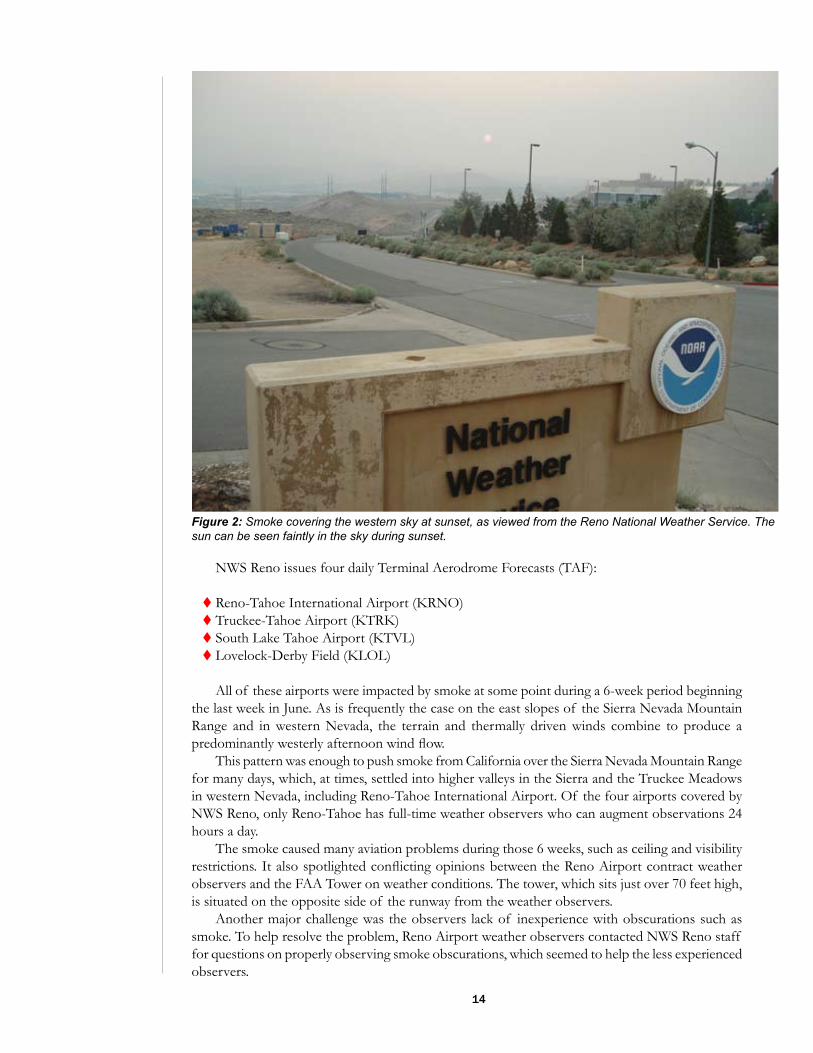
Figure 2: Smoke covering the western sky at sunset, as viewed from the Reno National Weather Service. The sun can be seen faintly in the sky during sunset.
15
Smoke is defined as small particles produced by combustion suspended in the air. This phenomenon may be present either near the Earth’s surface or in the free atmosphere. When viewed through smoke, the disk of the sun at sunrise and sunset appears reddish. The disk may have an orange tinge when the sun is above the horizon. (See Figure 1-2.) Evenly distributed smoke from distant sources generally has a light grayish or bluish appearance. A transition to haze may occur when smoke particles have traveled great distances; for example, 25 to 100 miles or more, and when the larger particles have settled out and the remaining particles have become widely scattered through the atmosphere (FAA, Surface Weather Observing 7900.5B CHG 1, 12-1-05.).
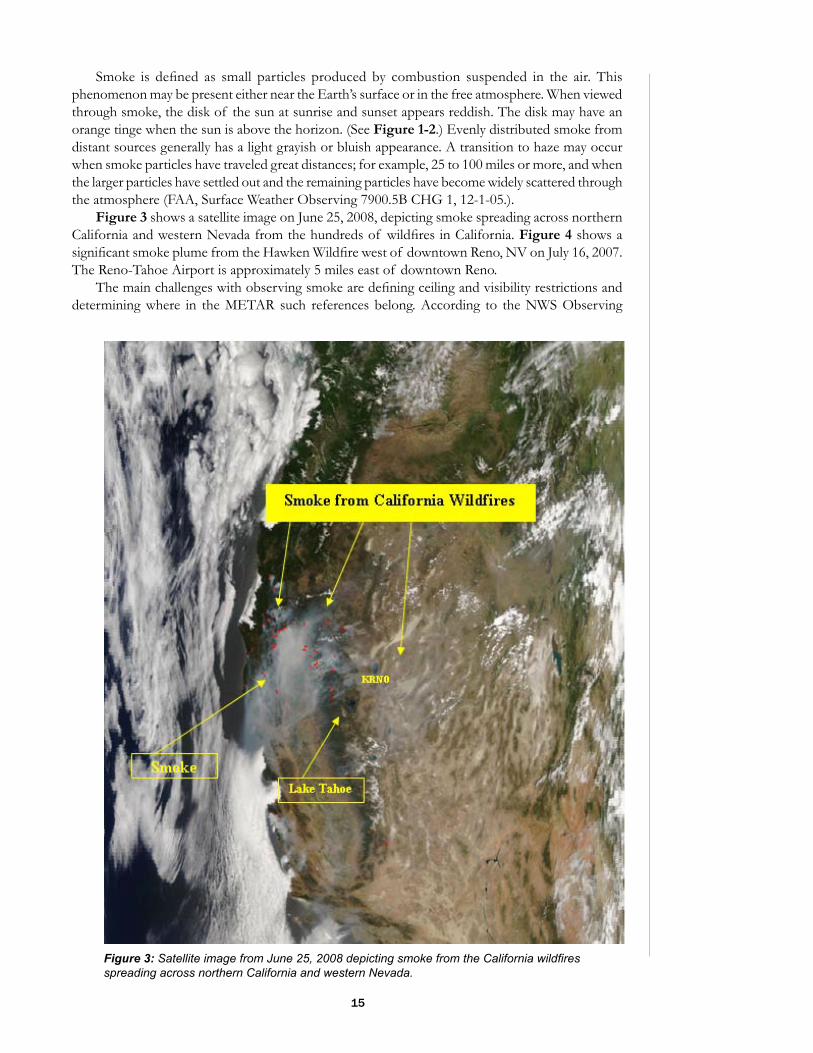
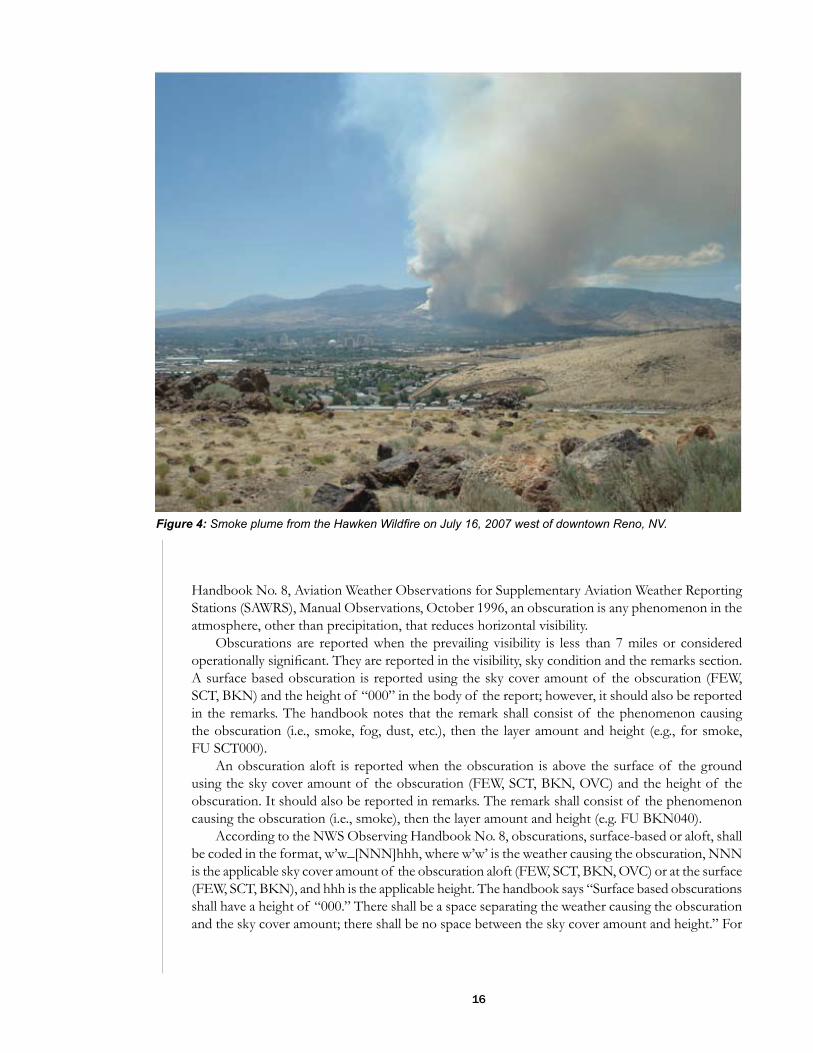
Figure 3 shows a satellite image on June 25, 2008, depicting smoke spreading across northern California and western Nevada from the hundreds of wildfires in California. Figure 4 shows a significant smoke plume from the Hawken Wildfire west of downtown Reno, NV on July 16, 2007. The Reno-Tahoe Airport is approximately 5 miles east of downtown Reno.
The main challenges with observing smoke are defining ceiling and visibility restrictions and determining where in the METAR such references belong. According to the NWS Observing
Figure 3: Satellite image from June 25, 2008 depicting smoke from the California wildfires spreading across northern California and western Nevada.
16
Figure 4: Smoke plume from the Hawken Wildfire on July 16, 2007 west of downtown Reno, NV.
Handbook No. 8, Aviation Weather Observations for Supplementary Aviation Weather Reporting Stations (SAWRS), Manual Observations, October 1996, an obscuration is any phenomenon in the atmosphere, other than precipitation, that reduces horizontal visibility.
Obscurations are reported when the prevailing visibility is less than 7 miles or considered operationally significant. They are reported in the visibility, sky condition and the remarks section. A surface based obscuration is reported using the sky cover amount of the obscuration (FEW, SCT, BKN) and the height of “000” in the body of the report; however, it should also be reported in the remarks. The handbook notes that the remark shall consist of the phenomenon causing the obscuration (i.e., smoke, fog, dust, etc.), then the layer amount and height (e.g., for smoke, FU SCT000).
An obscuration aloft is reported when the obscuration is above the surface of the ground using the sky cover amount of the obscuration (FEW, SCT, BKN, OVC) and the height of the obscuration. It should also be reported in remarks. The remark shall consist of the phenomenon causing the obscuration (i.e., smoke), then the layer amount and height (e.g. FU BKN040).
According to the NWS Observing Handbook No. 8, obscurations, surface-based or aloft, shall be coded in the format, w’w_[NNN]hhh, where w’w’ is the weather causing the obscuration, NNN is the applicable sky cover amount of the obscuration aloft (FEW, SCT, BKN, OVC) or at the surface (FEW, SCT, BKN), and hhh is the applicable height. The handbook says “Surface based obscurations shall have a height of “000.” There shall be a space separating the weather causing the obscuration and the sky cover amount; there shall be no space between the sky cover amount and height.” For
17
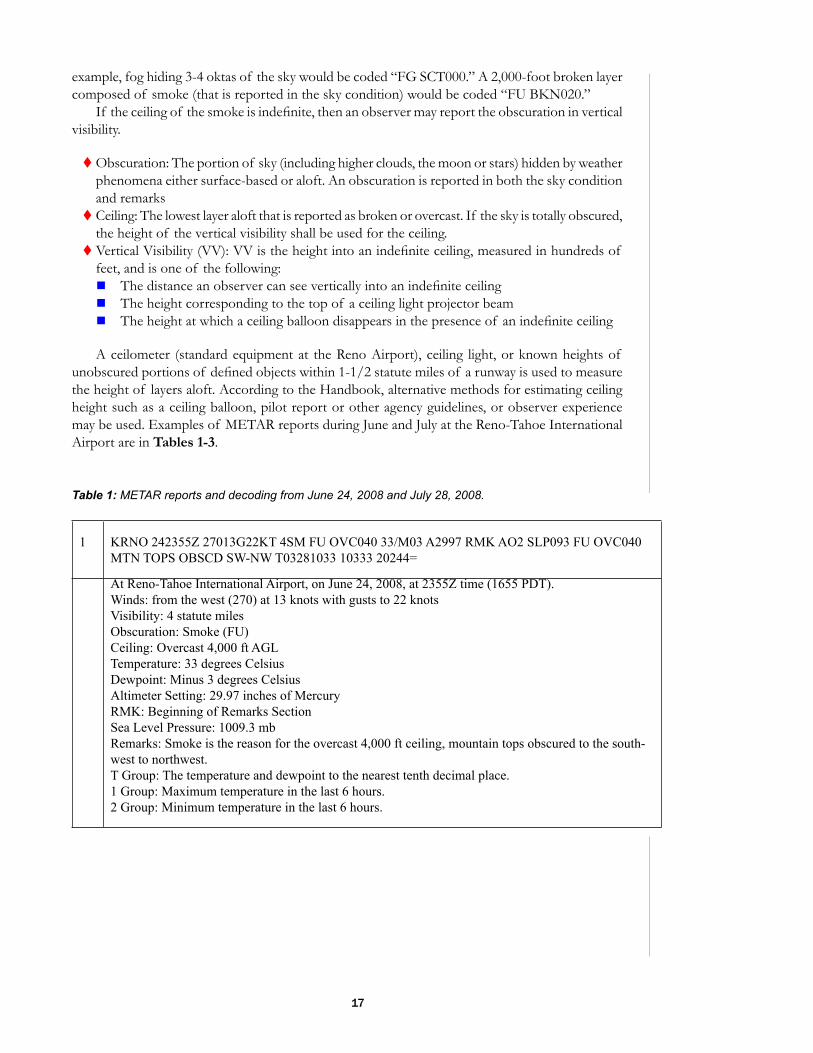
Table 1: METAR reports and decoding from June 24, 2008 and July 28, 2008.
1 KRNO 242355Z 27013G22KT 4SM FU OVC040 33/M03 A2997 RMK AO2 SLP093 FU OVC040 MTN TOPS OBSCD SW-NW T03281033 10333 20244=
At Reno-Tahoe International Airport, on June 24, 2008, at 2355Z time (1655 PDT). Winds: from the west (270) at 13 knots with gusts to 22 knotsVisibility: 4 statute milesObscuration: Smoke (FU)Ceiling: Overcast 4,000 ft AGLTemperature: 33 degrees CelsiusDewpoint: Minus 3 degrees CelsiusAltimeter Setting: 29.97 inches of MercuryRMK: Beginning of Remarks SectionSea Level Pressure: 1009.3 mbRemarks: Smoke is the reason for the overcast 4,000 ft ceiling, mountain tops obscured to the south-west to northwest.T Group: The temperature and dewpoint to the nearest tenth decimal place.1 Group: Maximum temperature in the last 6 hours.2 Group: Minimum temperature in the last 6 hours.
example, fog hiding 3-4 oktas of the sky would be coded “FG SCT000.” A 2,000-foot broken layer composed of smoke (that is reported in the sky condition) would be coded “FU BKN020.”
If the ceiling of the smoke is indefinite, then an observer may report the obscuration in vertical visibility.
Obscuration: The portion of sky (including higher clouds, the moon or stars) hidden by weather �phenomena either surface-based or aloft. An obscuration is reported in both the sky condition and remarksCeiling: The lowest layer aloft that is reported as broken or overcast. If the sky is totally obscured, �the height of the vertical visibility shall be used for the ceiling.Vertical Visibility (VV): VV is the height into an indefinite ceiling, measured in hundreds of �feet, and is one of the following:
The distance an observer can see vertically into an indefinite ceiling �The height corresponding to the top of a ceiling light projector beam �The height at which a ceiling balloon disappears in the presence of an indefinite ceiling �
A ceilometer (standard equipment at the Reno Airport), ceiling light, or known heights of unobscured portions of defined objects within 1-1/2 statute miles of a runway is used to measure the height of layers aloft. According to the Handbook, alternative methods for estimating ceiling height such as a ceiling balloon, pilot report or other agency guidelines, or observer experience may be used. Examples of METAR reports during June and July at the Reno-Tahoe International Airport are in Tables 1-3.
18
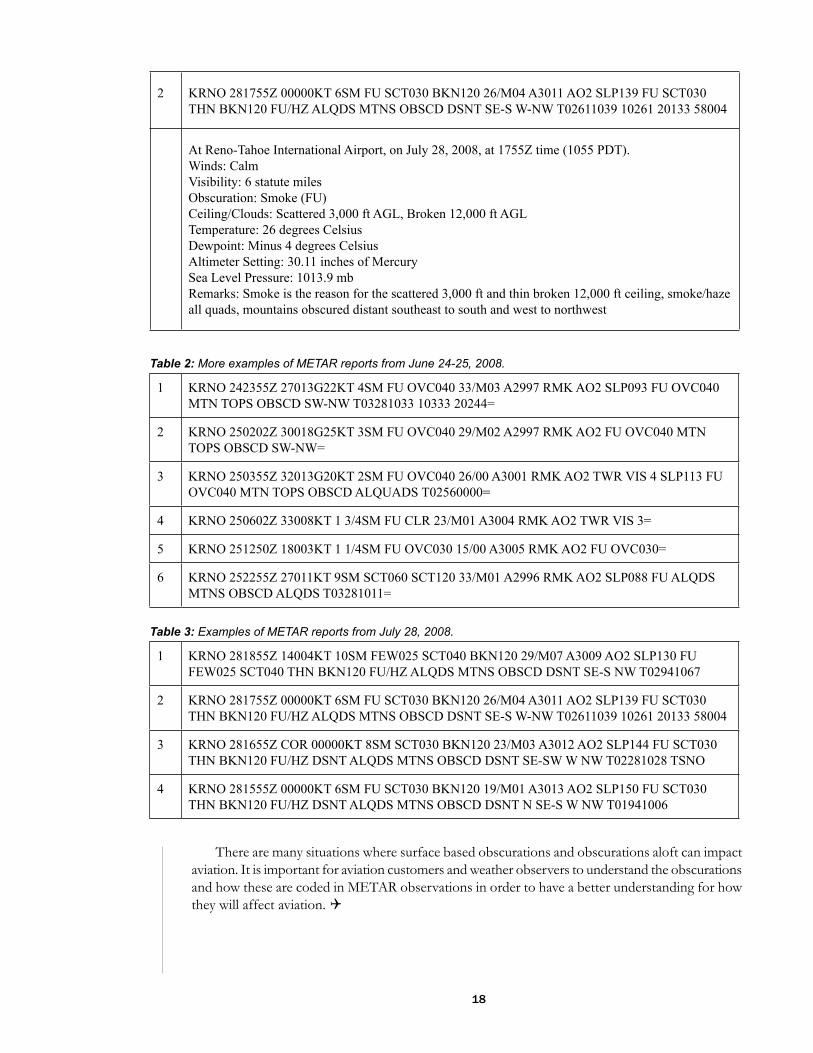
Table 2: More examples of METAR reports from June 24-25, 2008.
1 KRNO 242355Z 27013G22KT 4SM FU OVC040 33/M03 A2997 RMK AO2 SLP093 FU OVC040 MTN TOPS OBSCD SW-NW T03281033 10333 20244=
2 KRNO 250202Z 30018G25KT 3SM FU OVC040 29/M02 A2997 RMK AO2 FU OVC040 MTN TOPS OBSCD SW-NW=
3 KRNO 250355Z 32013G20KT 2SM FU OVC040 26/00 A3001 RMK AO2 TWR VIS 4 SLP113 FU OVC040 MTN TOPS OBSCD ALQUADS T02560000=
4 KRNO 250602Z 33008KT 1 3/4SM FU CLR 23/M01 A3004 RMK AO2 TWR VIS 3=
5 KRNO 251250Z 18003KT 1 1/4SM FU OVC030 15/00 A3005 RMK AO2 FU OVC030=
6 KRNO 252255Z 27011KT 9SM SCT060 SCT120 33/M01 A2996 RMK AO2 SLP088 FU ALQDS MTNS OBSCD ALQDS T03281011=
Table 3: Examples of METAR reports from July 28, 2008.
1 KRNO 281855Z 14004KT 10SM FEW025 SCT040 BKN120 29/M07 A3009 AO2 SLP130 FU FEW025 SCT040 THN BKN120 FU/HZ ALQDS MTNS OBSCD DSNT SE-S NW T02941067
2 KRNO 281755Z 00000KT 6SM FU SCT030 BKN120 26/M04 A3011 AO2 SLP139 FU SCT030 THN BKN120 FU/HZ ALQDS MTNS OBSCD DSNT SE-S W-NW T02611039 10261 20133 58004
3 KRNO 281655Z COR 00000KT 8SM SCT030 BKN120 23/M03 A3012 AO2 SLP144 FU SCT030 THN BKN120 FU/HZ DSNT ALQDS MTNS OBSCD DSNT SE-SW W NW T02281028 TSNO
4 KRNO 281555Z 00000KT 6SM FU SCT030 BKN120 19/M01 A3013 AO2 SLP150 FU SCT030 THN BKN120 FU/HZ DSNT ALQDS MTNS OBSCD DSNT N SE-S W NW T01941006
There are many situations where surface based obscurations and obscurations aloft can impact aviation. It is important for aviation customers and weather observers to understand the obscurations and how these are coded in METAR observations in order to have a better understanding for how they will affect aviation. Q
2 KRNO 281755Z 00000KT 6SM FU SCT030 BKN120 26/M04 A3011 AO2 SLP139 FU SCT030 THN BKN120 FU/HZ ALQDS MTNS OBSCD DSNT SE-S W-NW T02611039 10261 20133 58004
At Reno-Tahoe International Airport, on July 28, 2008, at 1755Z time (1055 PDT). Winds: CalmVisibility: 6 statute milesObscuration: Smoke (FU)Ceiling/Clouds: Scattered 3,000 ft AGL, Broken 12,000 ft AGLTemperature: 26 degrees CelsiusDewpoint: Minus 4 degrees CelsiusAltimeter Setting: 30.11 inches of MercurySea Level Pressure: 1013.9 mbRemarks: Smoke is the reason for the scattered 3,000 ft and thin broken 12,000 ft ceiling, smoke/haze all quads, mountains obscured distant southeast to south and west to northwest