Sasol Site Visit · Grace Davison . Sabine Pass LNG . Cameron LNG . 16 . Copyright ©, 2015, Sasol...
53
Sasol Site Visit February 2, 2015 Lake Charles, La.
Transcript of Sasol Site Visit · Grace Davison . Sabine Pass LNG . Cameron LNG . 16 . Copyright ©, 2015, Sasol...

Sasol Site Visit
February 2, 2015 Lake Charles, La.

Welcome and overview
Steve Cornell Executive Vice President International Operations

3
Copyright ©, 2015, Sasol
Safety moment – Evacuation routes

4
Copyright ©, 2015, Sasol
Sasol may, in this presentation, make certain statements that are not historical facts and relate to analyses and other information which are based on forecasts of future results and estimates of amounts not yet determinable. These statements may also relate to our future prospects, developments and business strategies. Examples of such forward-looking statements include, but are not limited to, statements regarding exchange rate fluctuations, volume growth, increases in market share, total shareholder return and cost reductions. Words such as “believe”, “anticipate”, “expect”, “intend”, “seek”, “will”, “plan”, “could”, “may”, “endeavour” and “project” and similar expressions are intended to identify such forward-looking statements, but are not the exclusive means of identifying such statements. By their very nature, forward-looking statements involve inherent risks and uncertainties, both general and specific, and there are risks that the predictions, forecasts, projections and other forward-looking statements will not be achieved. If one or more of these risks materialise, or should underlying assumptions prove incorrect, our actual results may differ materially from those anticipated. You should understand that a number of important factors could cause actual results to differ materially from the plans, objectives, expectations, estimates and intentions expressed in such forward-looking statements. These factors are discussed more fully in our most recent annual report under the Securities Exchange Act of 1934 on Form 20-F filed on 29 September 2014 and in other filings with the United States Securities and Exchange Commission. The list of factors discussed therein is not exhaustive; when relying on forward-looking statements to make investment decisions, you should carefully consider both these factors and other uncertainties and events. Forward-looking statements apply only as of the date on which they are made, and we do not undertake any obligation to update or revise any of them, whether as a result of new information, future events or otherwise
Forward-looking Statements

5
Copyright ©, 2015, Sasol
What we will cover today
Topic Presenter
Welcome and overview Steve Cornell Executive Vice President International Operations
Existing Lake Charles operations Mike Thomas Senior Vice President US Operations
Ethane cracker and derivatives complex Steve Cornell Executive Vice President International Operations
Sasol Chemicals strategy, products and markets
Fleetwood Grobler Executive Vice President Chemicals Business
Financing Paul Victor Chief Financial Officer (Acting) Financing
Q&A All

6
Copyright ©, 2015, Sasol
Definition of victory
Operations Excellence
Capital Excellence
Business Excellence
Values-driven Organisation
This is the near-to medium-term strategy which continues to serve us well
Our strategic agenda continues to guide our near-to medium-term strategy
Foundation
Gro
up im
pera
tives
Sustainable growth
Develop and empower high-performing, values-driven people
Continuously improve and grow existing asset base
Deliver on the South African transformation agenda
Maintain technological lead
Accelerate GTL growth
Grow related upstream business
Grow all value chains based on feedstock, market and/or technology advantage
Develop and grow low-carbon power generation
Grow shareholder value sustainably
Nurture and grow Expand and deliver

7
Copyright ©, 2015, Sasol
Our investment criteria underpin a sound business case
Technology
Feedstock
Market
Capability
Financing
Do we have a technology, scale of plant or operating know-how that provides a competitive advantage?
Do we have a leading low-cost feedstock?
Do we have a product or market position that provides us with a compelling business case?
Do we have the required project execution capability to execute the project within schedule and on budget?
Do we have access to adequate funding while maintaining our targeted gearing and progressive dividend policy?
Robust project economics

8
Copyright ©, 2015, Sasol
• Integrated multi-asset site: fixed cost spread, infrastructure for the future • New world-scale ethane cracker
• Six derivative units
• Development of Lake Charles extended area
• Differentiation: capacity expansion and new capabilities to exploit growing demand • Derivative products enhance and expand Sasol’s existing global chemical business
• Alcohols and ethoxylates provide premium uplift over ethane
• Additive: building on successful, established US business • Full integration of ethoxylates business enabled by ethylene oxide production
• Limited exposure to merchant ethylene market with focus on converting ethylene to Base and Performance Chemicals
Our balanced portfolio provides scale and diversification
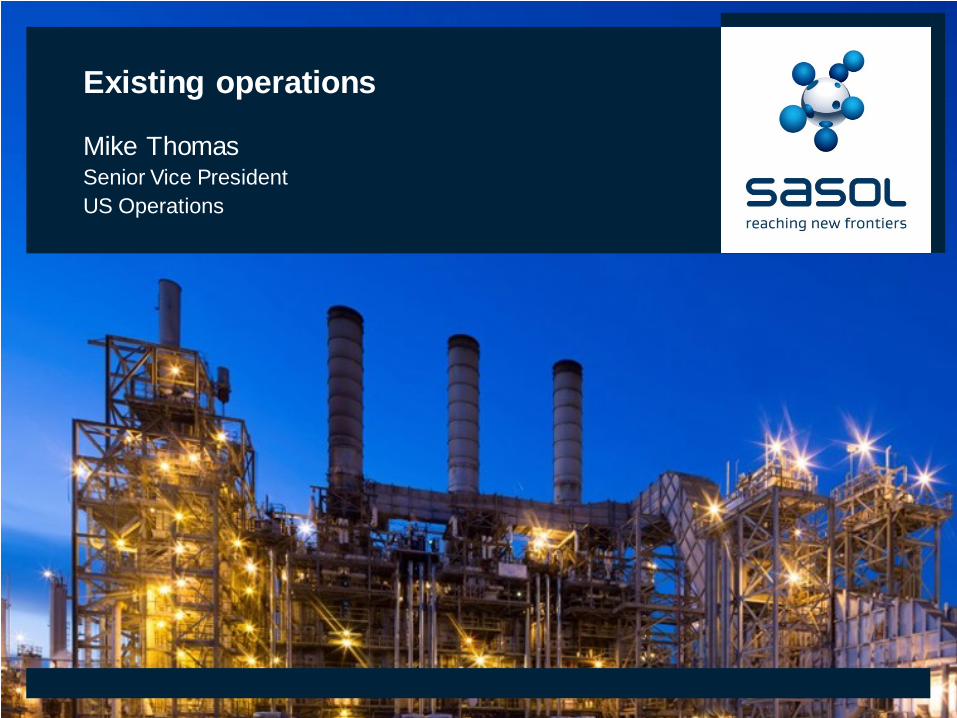
Existing operations
Mike Thomas Senior Vice President US Operations

10
Copyright ©, 2015, Sasol
Existing operations
• Excellent operational track record
• Access to robust infrastructure
• Positive stakeholder relations

11
Copyright ©, 2015, Sasol
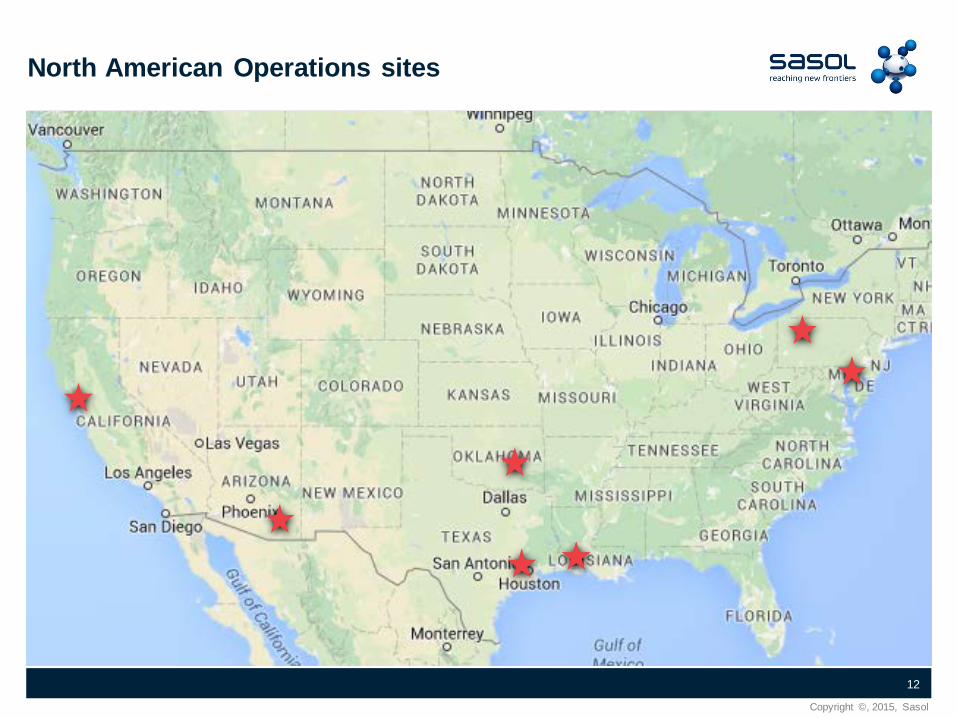
• Lake Charles site originated in 1961 as the Petrochemical Division of Conoco, later renamed Conoco Chemicals
• Acquired by Du Pont in 1982
• MBO formed Vista in 1984 (2 000 employees)
• Acquired by RWE-DEA in 1991 (1 900 employees)
• PVC business sold to Georgia Gulf in 1999
• Acquired by Sasol in 2001 (850 employees)
• Re-organised to Regional Operations Model in 2013 (1 000 employees)
North American Operations overview and history
12
Copyright ©, 2015, Sasol
North American Operations sites

13
Copyright ©, 2015, Sasol
North American Operations priorities
Safety and environmental
excellence
Reliability and plant operations
Cost/profitability improvement focus

14
Copyright ©, 2015, Sasol
North American recordable injury rate
0.11
0,0
0,1
0,2
0,3
0,4
0,5
0,6
0,7
0,8
Jul
Aug
Sep
Oct
Nov
Dec Jan
Feb
Mar
Apr
May Jun
Jul
Aug
Sep
Oct
Nov
Dec Jan
Feb
Mar
Apr
May Jun
Jul
Aug
Sep
Oct
Nov
Dec
2012 2013 2014
NA Operations recordable case rate
1st quartile Chemical mfgr median Chem mfgr 1st quartile

15
Copyright ©, 2015, Sasol
City of Westlake
City of Lake Charles City of Sulphur
Thriving Downstream and Petrochemicals hub
NISCO Entergy
Georgia Gulf MG Industries
Phillips 66 Refinery
Biolab
PPG
Air Products
EXCEL Paralubes
Arch
Certainteed
Basell
Louisiana Pigment
Citgo Refinery
Southern Ionics
Calcasieu Refining
Alcoa
Trunkline LNG
Firestone
Air Liquide
Westlake Petrochem
Targa
Grace Davison
Sabine Pass LNG
Cameron LNG

16
Copyright ©, 2015, Sasol
Site has access to major highway, rail, pipeline and port infrastructure
Robust transportation infrastructure
Lake Charles
Barge and marine Railroad
Road Pipeline
Port of Lake Charles • 13th-busiest in the U.S.
Port of Houston • Approximately 100 miles
Access to three rail lines: • KCS • Union Pacific • BNSF
Major East-West, coast-to-coast interstate
Well-supplied with pipeline infrastructure

17
Copyright ©, 2015, Sasol
Lake Charles operations
Alumina

18
Copyright ©, 2015, Sasol
More than 50 years of production history Steadily higher volumes and revenues without a major debottlenecking
Lake Charles site production history
0
200
400
600
800
1 000
1 200
1994 1995 1996 1997 1998 1999 2000 2001 2002 2003 2004 2005 2006 2007 2008 2009 2010 2011 2012 2013 2014
Prod
uctio
n vo
lum
e (k
tpa)
Hurricane Rita
Global economic downturn

19
Copyright ©, 2015, Sasol
Our footprint in Lake Charles

Q&A

Ethane cracker & derivatives complex
Steve Cornell Executive Vice President International Operations
22
Copyright ©, 2015, Sasol
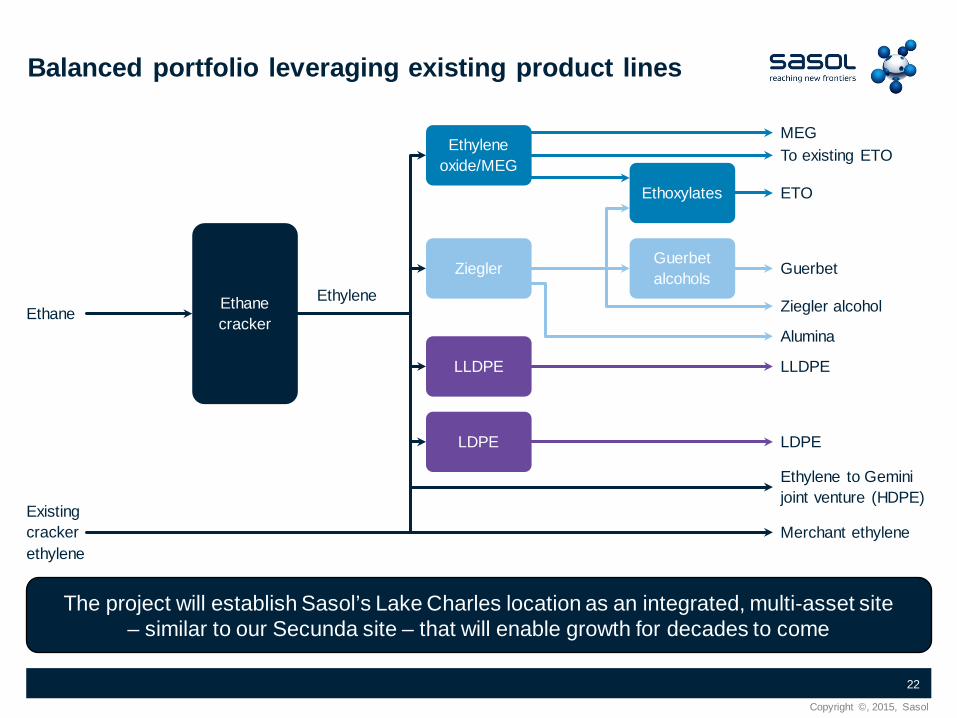
The project will establish Sasol’s Lake Charles location as an integrated, multi-asset site – similar to our Secunda site – that will enable growth for decades to come
Balanced portfolio leveraging existing product lines
Ethane cracker
Ethylene oxide/MEG
Ziegler
LLDPE
LDPE
Ethoxylates
Guerbet alcohols
Ethane Ethylene
MEG To existing ETO
ETO
Guerbet
Ziegler alcohol
Alumina
LLDPE
LDPE
Ethylene to Gemini joint venture (HDPE)
Merchant ethylene Existing cracker ethylene

23
Copyright ©, 2015, Sasol
Significantly increasing our Lake Charles production capacity
0
400
800
1 200
1 600
2 000
2 400
Ethylene Polyethylene Alcohols and ethoxylates* Alkylates
Prod
uctio
n vo
lum
e (k
tpa)
Existing LCCP
* Includes MEG and Alumina

24
Copyright ©, 2015, Sasol
Mixture of proprietary and other proven technologies and deep operating know-how
Access to proven technologies and deep operating know-how
Production unit Technology licensor Operating know-how
Ethylene cracker 45 years in USA, RSA
Low density polyethylene 45 years in RSA, Petlin Malaysia
Linear low density polyethylene 30 years in RSA
Ethylene-oxide/ethylene glycol 20 years Germany
Ethoxylates Over 40 years experience in Europe, China and USA
Ziegler alcohol Over 50 years experience in Germany and USA
Guerbet alcohol Over 30 years experience in Germany

25
Copyright ©, 2015, Sasol
Low-cost feedstock secured
• 70% of ethane supply secured from reliable industry leaders
• Competitive, reliable ethane transportation capacity secured
• Ethane storage capacity in Sulphur and Mt Belvieu to mitigate exposure to Aegis pipeline and manage demand fluctuations of Sasol’s two crackers
• Extensive ethylene logistics to ensure high plant-wide stream factors
Ethane feedstock supply
3 - 5 years OPIS linked
Un-contracted/Spot
3 years Linked to natural gas
(floor and cap)

26
Copyright ©, 2015, Sasol
• Shale revolution yields tremendous natural gas liquids growth
• Ethane price essentially driven by natural gas price
• Ethane price relative to energy value determined by supply/demand, with a ceiling price determined by the next best ethane cracking feedstock (expected to be propane)
• Abundant ethane derived from shale gas in the US provides feedstock for significant expansion of ethylene cracking capacity in the US
• Most production in Europe and Asia (including new construction) is based on naphtha, which price is tied directly to crude oil pricing
• With long-term advantage of US natural gas vs crude oil, ethane crackers in US will have a significant production cost advantage vs. those producers cracking naphtha
• This leads to a similar cost advantage for ethylene derivatives, thus allowing US producers to profitably export ethylene derivatives around the globe
Ethane pricing

27
Copyright ©, 2015, Sasol
0
25
50
75
100
125
150
175
2010 2015 2020 2025 2030
Long-run Brent crude oil projections (2014$/bbl)
Fortuitous timing – a robust long-term outlook, advantaged by near-term developments
Construction phase | 2015-2017
sources: Wood Mackenzie, PIRA, IHS, KBC and EIA (Jan 2015)
Operation phase | 2018 onwards
LCCP start-up | 2018
+ Lower USGC cost escalation + US ethane enhances its advantage versus naphtha
+ Project delays/cancellations improve competitive landscape
External average and range of oil prices
+ Margin uplift. Global GDP and LCCP product demand growth coupled with competitors’ project delays improve LCCP product markets and prices
+ Feedstock supply & prices. Stronger oil prices spur drilling and ethane production and, due to delays in competitors’ projects, ethane feedstock availability and prices to remain close to floor

28
Schedule and Manpower
2014 2015 2016 2017 2018
Engineering
Procurement
Construction
Operations
FEED Detail eng.
Long leads Equipment & Bulks
Site Prep / Civil / Module / Direct Field
Unit Start-ups
Site
0
1 000
2 000
3 000
4 000
5 000
6 000
Jun-14 Dec-14 Jun-15 Dec-15 Jun-16 Dec-16 Jun-17 Dec-17 Jun-18
Wor
kers
at s
ite

29
Copyright ©, 2015, Sasol
Contracting strategy
• Mix of reimbursable and lump-sum contracts
• World-class roster of contractors
• Strong track records in similar large-scale petrochemical projects
• Deep expertise along US Gulf Coast
Partner Role IPMT
EPCM, ethane cracker, Ziegler alcohol unit, utilities
LLPDE, EO/EG EPFCs
EPC for high pressure portion of LDPE unit
Main automation consultant
Contractor Role Civil
Mechanical, structural steel, piping
Civil
Electrical and Instrumentation
Electrical and Instrumentation

30
Copyright ©, 2015, Sasol
Experienced owner team in place to oversee Execution phase
• Owner team boosted by personnel experienced in: • Mega Projects in the USA • Mega Projects within Sasol • Managing and working with large Engineering contractors, globally
• Effective, flexible partnership with WorleyParsons continues • Owner’s Project Management Team organised into four divisions with overall direction
by seasoned Project Director (recently off multi-billion $ refinery brownfield project) • Excellent Project Controls team in place to:
• Monitor cost and schedule • Give accurate predictability
• First site work proceeding safely and efficiently
Capability
Cracked Gas Compressor equipment from Mitsubishi Early backfill & leveling work at Cracker site

Q&A

Break

Chemicals strategy, products and markets Fleetwood Grobler Executive Vice President Chemicals Business

34
Copyright ©, 2015, Sasol
Sasol chemicals strategy
Robust portfolio Performance drive
Profitable growth
Sustainably grow
shareholder value (TSR)

35
Copyright ©, 2015, Sasol
Sasol’s chemical business: A robust portfolio of base and performance chemicals
Commodity business Differentiated business
Strategic directions
• Focus on rather few products integrated into upstream value chains
• Ground business primarily on cost leadership and feedstock advantage
• Grow integrated products with upstream business
• Further drive product differentiation, e.g., by maintaining technology leadership
• Maintain strong customer focus including integration into applications
• Grow businesses with high margins and returns
Products and dependencies
Commodity chemicals
Further value add
ethylene
Propylene
hydrogen
nitrogen
FT intermediaries
polymers N fertilisers
Intermediaries
Solvents LAB
detergent alcohols
phenolics performance waxes
surfactants
inorganics O&G recovery chemicals
Packaged explosives
Base Chemicals A producer and marketer of
commodity chemicals based on the FT, C2, propylene and ammonia value chains
Performance Chemicals A producer and marketer of
commoditised and differentiated performance chemicals built on the base chemical foundation
Product push vs market pull
Production push driven
Market pull driven
Base Chemicals Perf. Chemicals

36
Copyright ©, 2015, Sasol
Product diversification improves stability of cash flows in times of commodity price volatility
1994 1997 2000 2003 2006 2009 2012
Norm
alis
ed u
plift
- o
ver e
than
e
Performance Chemicals Base Chemicals

37
Copyright ©, 2015, Sasol
Sasol US PE
plants start-up
Base Chemicals overview
• Polyethylene pellets sold to converters who produce film and other plastic forms used in a wide range of applications
• Global PE demand to grow from 81 mtpa in 2013 to 102 mtpa in 2018
• Demand growth will require additional PE capacity by 2020
Source: Platts
-30
-20
-10
0
10
20
2013 2015 2017 2019 2021 2023 2025
Cap
acity
sur
plus
[m
tpa]
Global PE shortfall by 2020

38
Copyright ©, 2015, Sasol
• Sasol has an established brand name in global polymers marketing and sales • 50 years of experience in PE market
• Will use existing sales channels and develop new ones • Sasol marketed through distributors in most parts of the world; own sales force
in Sub-Saharan Africa and Asia
• Intent is representation by regional sales forces in Americas, Europe, Sub-Saharan Africa and Asia, assisted by regional distribution partners
• Conservative penetration plan in targeted markets
Base Chemicals overview
39
Copyright ©, 2015, Sasol
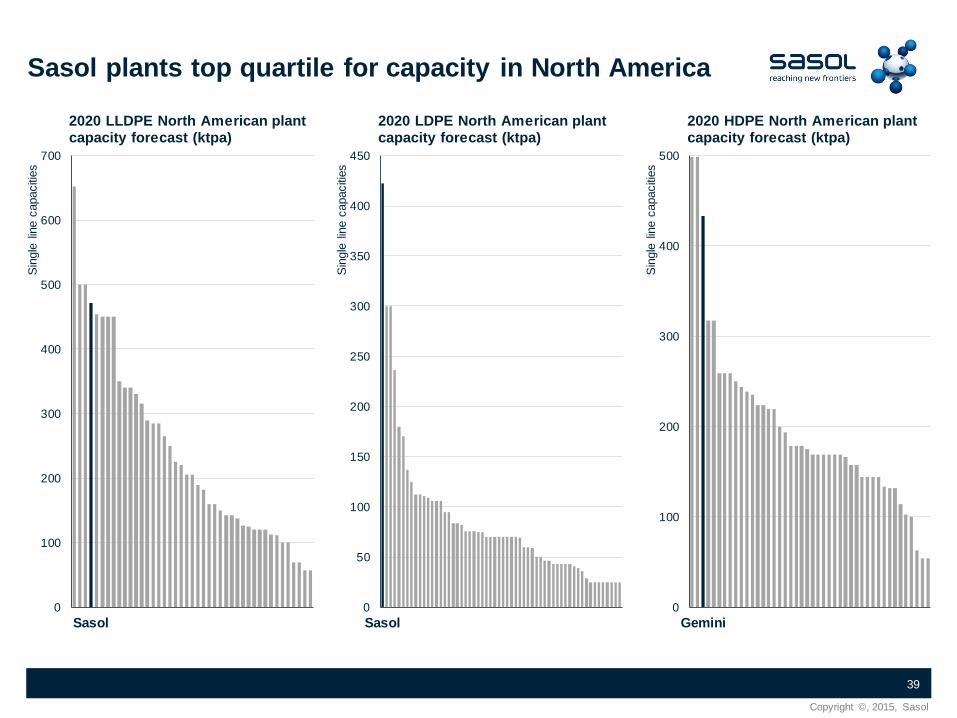
Sasol plants top quartile for capacity in North America
0
100
200
300
400
500
600
700
Sasol
Sin
gle
line
capa
citie
s
2020 LLDPE North American plant capacity forecast (ktpa)
0
50
100
150
200
250
300
350
400
450
Sasol
Sin
gle
line
capa
citie
s
2020 LDPE North American plant capacity forecast (ktpa)
0
100
200
300
400
500
Gemini
Sin
gle
line
capa
citie
s
2020 HDPE North American plant capacity forecast (ktpa)

40
Copyright ©, 2015, Sasol
• Sold into 50+ diversified markets including detergents, cosmetics and personal care products, pharmaceuticals, lubricants and other industrial solvents, products to enhance oil recovery, inks and paints, polyester fibers and resins, antifreeze
• The majority marketed in North America; some exported
• US market expected to be able to absorb the new capacity over time
• 30+ years in this business with long-term customer relationships
• Majority marketed directly to customers via in-house sales personnel
• Exploit and further optimise global network
Performance Chemicals overview

41
Copyright ©, 2015, Sasol
Material type Ethy
lene
Alc
ohol
s
Alk
yl P
heno
l
Ethy
lene
O
xide
(EO
)
Etho
xyla
tes
Sulfa
tes
AS
& A
ES
N-P
araf
fins
Alk
ylat
es/
LAB
Sulfo
nate
s/
LAS/
SAS
Manufacturers Feedstock Intermediates Surfactants Feedstock Intermediate
Sasol O/P
BASF O/P
Clariant
Ecogreen O
Kao Chemicals O
Procter & Gamble Chemicals O
Shell P
Exxon/Mobil
Huntsman
ISU
CEPSA
Stepan
Sasol Performance Chemicals the only integrated producer of alcohols, alkylates, and surfactants
Own manufacture O = derived from Oleochemical feedstock P = derived from Petrochemical feedstock
Supply by long term contract/strategic alliance Mix of both

42
Copyright ©, 2015, Sasol
Diversified in product slate and geographic sales and marketing channels
US
Europe
Latin America
Asia
ROW
Base Chemicals project sales, steady state
US
Europe Latin
America
Asia
Performance Chemicals project sales, steady state

Q&A

Financing
Paul Victor Chief Financial Officer (Acting)

45
Copyright ©, 2015, Sasol
• Approximately 80% funds in place through a combination of project finance and equity
• US$4 billion project finance facility completed • 7 year final maturity, partially amortising
• Secured by the project company assets
• Supported by a Sasol Limited completion guarantee
• Product Offtake agreement designed to eliminate volume risk, with a Sasol Limited guarantee for the obligations of the offtaker under the Product Offtake agreement
• Equity funded from cash flow from existing US operations, surplus offshore cash and facilities such as the revolving credit facility
• Supplemented by further fundraising at either project or corporate level
Financing

46
Copyright ©, 2015, Sasol
• Structural elements of funding plan • Sasol Limited completion guarantee
• Product Offtake agreement designed to eliminate volume risk • Sasol Limited guarantee for the obligations of the offtaker under the Product Offtake agreement
Financing
LCCP funding plan
Uses of funds US$ billion Capital cost – LCCP 8,9 Working capital changes (including interest) 2,5 Total uses of funds 11,4
Sources of funds US$ billion Debt 7,0
Bank term loan US$4 billion Incremental funding US$3 billion
Equity draw 4,4 Total sources of funds 11,4
47
Copyright ©, 2015, Sasol
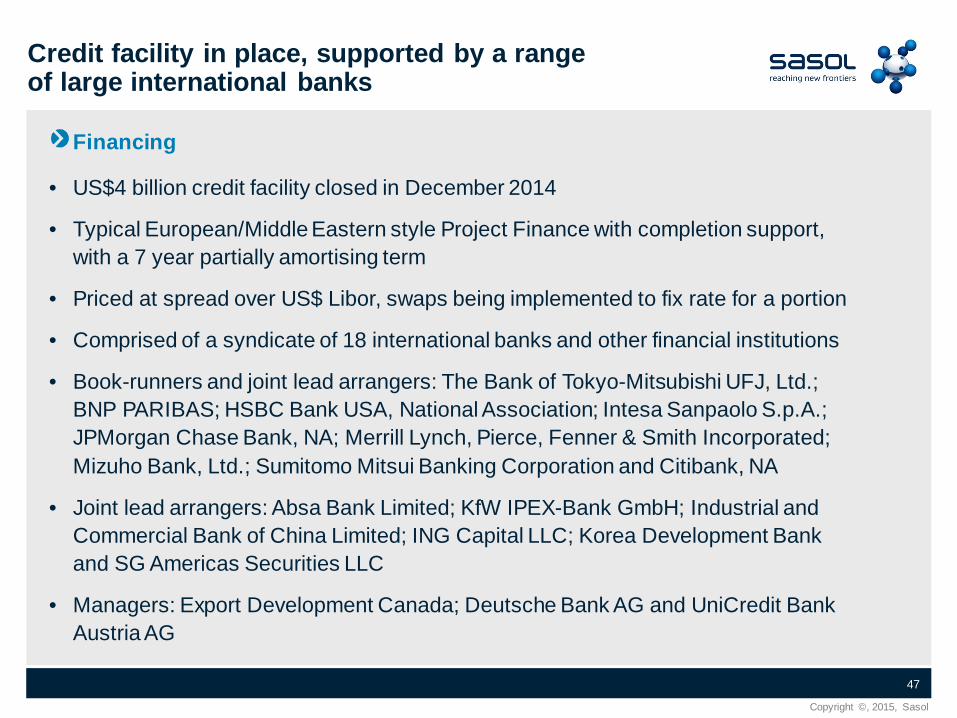
• US$4 billion credit facility closed in December 2014
• Typical European/Middle Eastern style Project Finance with completion support, with a 7 year partially amortising term
• Priced at spread over US$ Libor, swaps being implemented to fix rate for a portion
• Comprised of a syndicate of 18 international banks and other financial institutions
• Book-runners and joint lead arrangers: The Bank of Tokyo-Mitsubishi UFJ, Ltd.; BNP PARIBAS; HSBC Bank USA, National Association; Intesa Sanpaolo S.p.A.; JPMorgan Chase Bank, NA; Merrill Lynch, Pierce, Fenner & Smith Incorporated; Mizuho Bank, Ltd.; Sumitomo Mitsui Banking Corporation and Citibank, NA
• Joint lead arrangers: Absa Bank Limited; KfW IPEX-Bank GmbH; Industrial and Commercial Bank of China Limited; ING Capital LLC; Korea Development Bank and SG Americas Securities LLC
• Managers: Export Development Canada; Deutsche Bank AG and UniCredit Bank Austria AG
Financing
Credit facility in place, supported by a range of large international banks

48
Copyright ©, 2015, Sasol
0%
20%
40%
60%
80%
100%
FY14 FY15 FY16 Beneficial operation FY18
Financing
Project capex cash flow profile

49
Copyright ©, 2015, Sasol
Financing
Project economics robust, even under extreme scenarios
-10%
Ethane at floor
6 month delay + % capex increase
+15%
Ethane at ceiling
US$80/bbl (real) long-term
Start-up delay
Capital (EOJ)
Ethane pricing
Sasol price set
Sasol US$ WACC: 8%
Project IRR > Sasol US hurdle rate

Q&A

Conclusion
Steve Cornell Executive Vice President International Operations

52
Copyright ©, 2015, Sasol
Meeting all Sasol’s criteria for successful investments
Robust project
economics
Technology Do we have a technology, scale of plant or operating know-how that provides a competitive advantage?
Market Do we have a product or market position that provides us with a compelling business case?
Feedstock Do we have a leading low-cost feedstock?
Financing Do we have access to adequate funding while maintaining our targeted gearing and progressive dividend policy?
Capability Do we have the required project execution capability to execute the project within schedule and on budget?

Sasol Site Visit
February 2, 2015
Lake Charles, La.