SAS Q1 2016/2017 q1 2016/2017 08.03.2017 2 ... •new destinations: bos/lax/mia ... streamline...
29
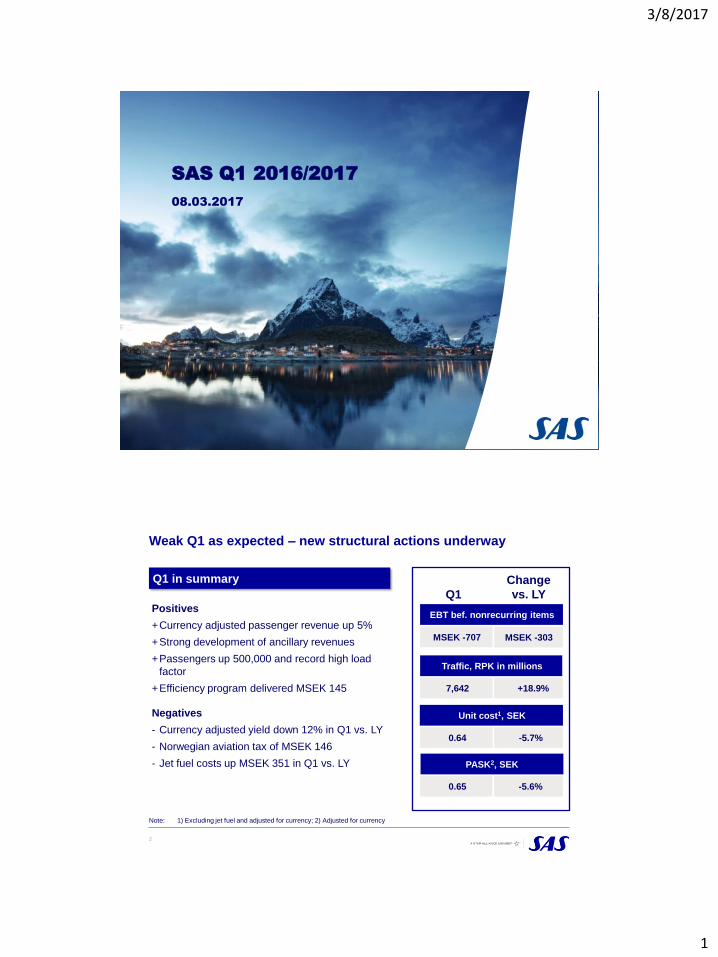
3/8/2017 1 SAS Q1 2016/2017 08.03.2017 2 Weak Q1 as expected – new structural actions underway MSEK -707 EBT bef. nonrecurring items 7,642 Traffic, RPK in millions 0.64 Unit cost 1 , SEK MSEK -303 +18.9% -5.7% -5.6% PASK 2 , SEK 0.65 Q1 Change vs. LY Q1 in summary Positives + Currency adjusted passenger revenue up 5% + Strong development of ancillary revenues + Passengers up 500,000 and record high load factor + Efficiency program delivered MSEK 145 Negatives - Currency adjusted yield down 12% in Q1 vs. LY - Norwegian aviation tax of MSEK 146 - Jet fuel costs up MSEK 351 in Q1 vs. LY Note: 1) Excluding jet fuel and adjusted for currency; 2) Adjusted for currency
Transcript of SAS Q1 2016/2017 q1 2016/2017 08.03.2017 2 ... •new destinations: bos/lax/mia ... streamline...
3/8/2017
1
SAS Q1 2016/2017
08.03.2017
2
Weak Q1 as expected – new structural actions underway
MSEK -707
EBT bef. nonrecurring items
7,642
Traffic, RPK in millions
0.64
Unit cost1, SEK
MSEK -303
+18.9%
-5.7%
-5.6%
PASK2, SEK
0.65
Q1
Change
vs. LY
Q1 in summary
Positives
+Currency adjusted passenger revenue up 5%
+Strong development of ancillary revenues
+Passengers up 500,000 and record high load
factor
+Efficiency program delivered MSEK 145
Negatives
- Currency adjusted yield down 12% in Q1 vs. LY
- Norwegian aviation tax of MSEK 146
- Jet fuel costs up MSEK 351 in Q1 vs. LY
Note: 1) Excluding jet fuel and adjusted for currency; 2) Adjusted for currency
3/8/2017
2
3
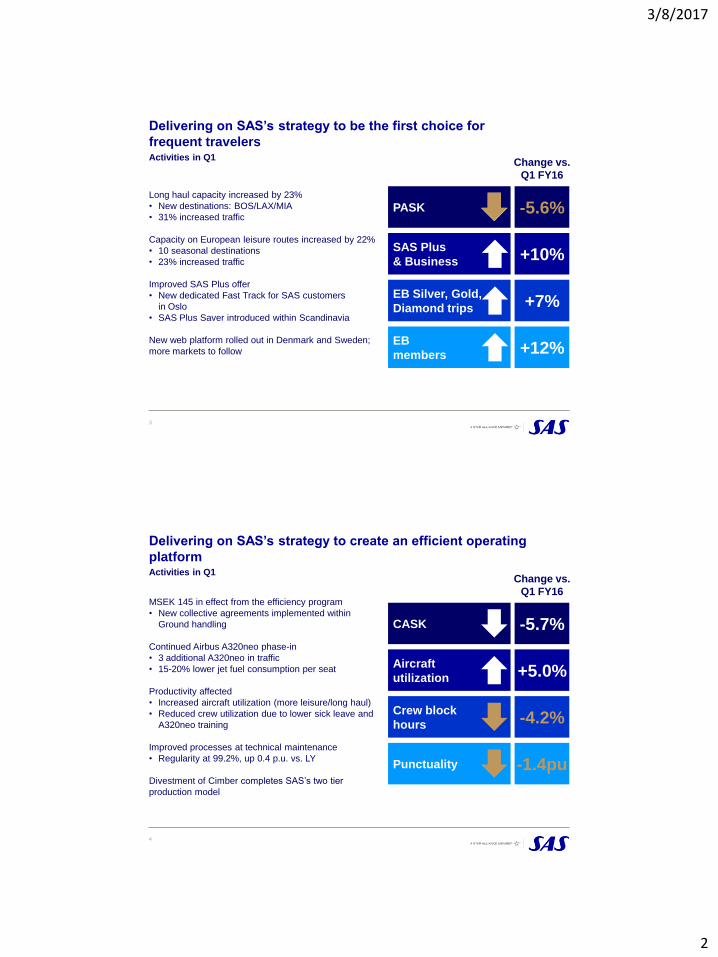
Delivering on SAS’s strategy to be the first choice for
frequent travelers
Long haul capacity increased by 23%
• New destinations: BOS/LAX/MIA
• 31% increased traffic
Capacity on European leisure routes increased by 22%
• 10 seasonal destinations
• 23% increased traffic
Improved SAS Plus offer
• New dedicated Fast Track for SAS customers
in Oslo
• SAS Plus Saver introduced within Scandinavia
New web platform rolled out in Denmark and Sweden;
more markets to follow
PASK -5.6%
EB Silver, Gold,
Diamond trips +7%
EB
members +12%
SAS Plus
& Business +10%
Change vs.
Q1 FY16
Activities in Q1
4
MSEK 145 in effect from the efficiency program
• New collective agreements implemented within
Ground handling
Continued Airbus A320neo phase-in
• 3 additional A320neo in traffic
• 15-20% lower jet fuel consumption per seat
Productivity affected
• Increased aircraft utilization (more leisure/long haul)
• Reduced crew utilization due to lower sick leave and
A320neo training
Improved processes at technical maintenance
• Regularity at 99.2%, up 0.4 p.u. vs. LY
Divestment of Cimber completes SAS’s two tier
production model
Delivering on SAS’s strategy to create an efficient operating
platform
CASK -5.7%
Crew block
hours -4.2%
Punctuality -1.4pu
Aircraft
utilization +5.0%
Change vs.
Q1 FY16
Activities in Q1
3/8/2017
3
5
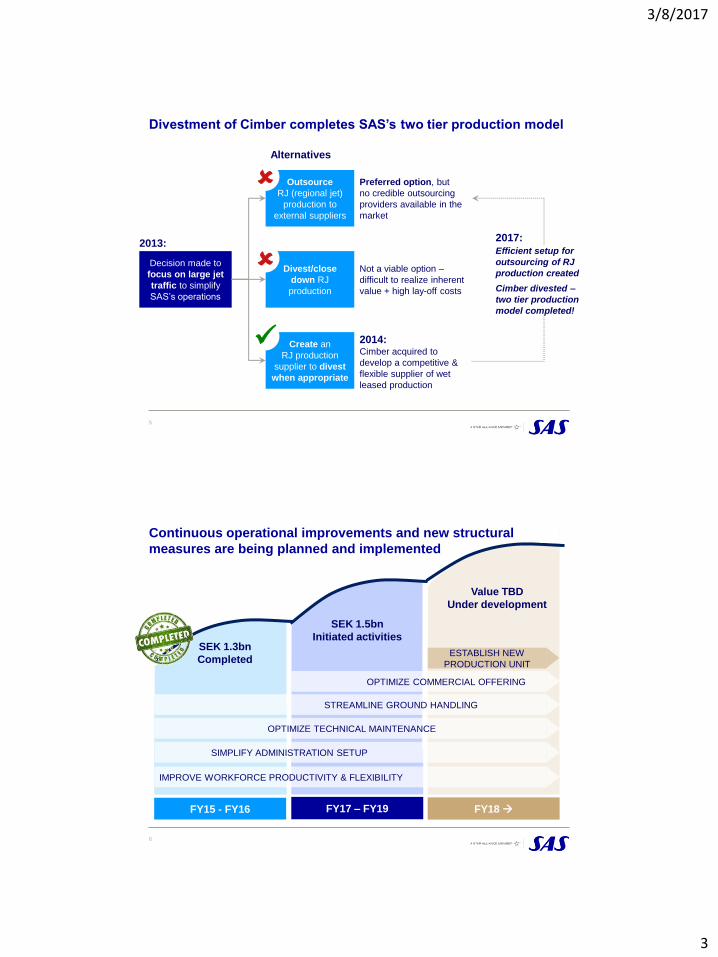
Divestment of Cimber completes SAS’s two tier production model
Decision made to
focus on large jet
traffic to simplify
SAS’s operations
Outsource
RJ (regional jet)
production to
external suppliers
Divest/close
down RJ
production
Create an
RJ production
supplier to divest
when appropriate
2014: Cimber acquired to
develop a competitive &
flexible supplier of wet
leased production
Not a viable option –
difficult to realize inherent
value + high lay-off costs
Preferred option, but
no credible outsourcing
providers available in the
market
Efficient setup for
outsourcing of RJ
production created
Cimber divested –
two tier production
model completed!
2013:
Alternatives
2017:
6
Continuous operational improvements and new structural
measures are being planned and implemented
FY15 - FY16 FY17 – FY19 FY18
Value TBD
Under development
SEK 1.5bn
Initiated activities SEK 1.3bn
Completed
IMPROVE WORKFORCE PRODUCTIVITY & FLEXIBILITY
SIMPLIFY ADMINISTRATION SETUP
OPTIMIZE TECHNICAL MAINTENANCE
STREAMLINE GROUND HANDLING
ESTABLISH NEW
PRODUCTION UNIT
OPTIMIZE COMMERCIAL OFFERING
3/8/2017
4
7
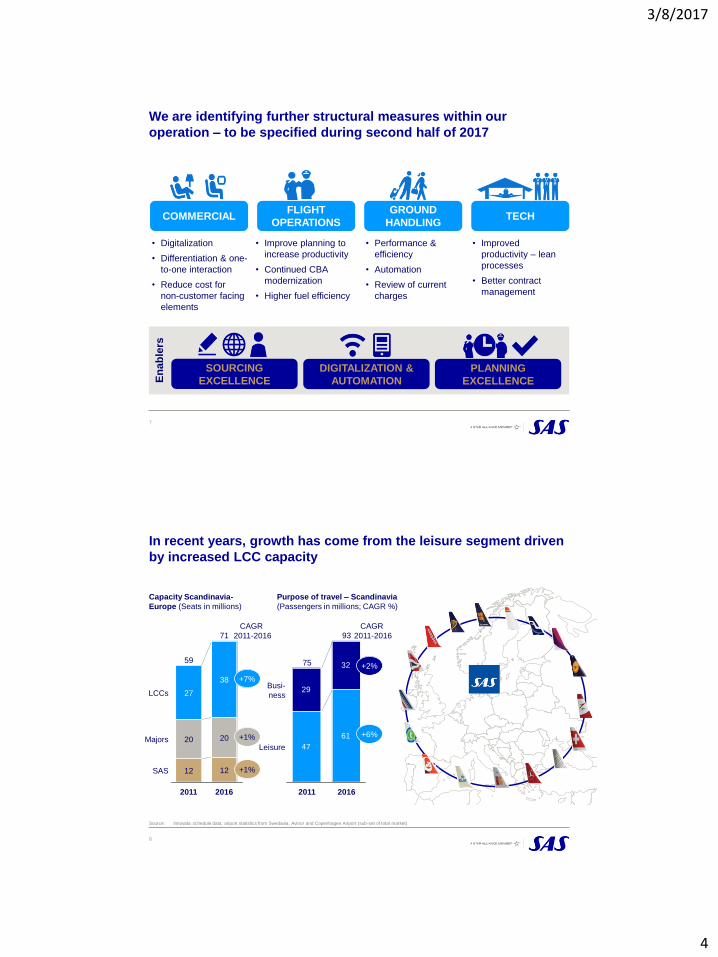
We are identifying further structural measures within our
operation – to be specified during second half of 2017
FLIGHT
OPERATIONS
GROUND
HANDLING TECH
DIGITALIZATION &
AUTOMATION
PLANNING
EXCELLENCE
SOURCING
EXCELLENCE
COMMERCIAL
En
ab
lers
• Improve planning to
increase productivity
• Continued CBA
modernization
• Higher fuel efficiency
• Performance &
efficiency
• Automation
• Review of current
charges
• Improved
productivity – lean
processes
• Better contract
management
• Digitalization
• Differentiation & one-
to-one interaction
• Reduce cost for
non-customer facing
elements
8
In recent years, growth has come from the leisure segment driven
by increased LCC capacity
27
59
12
20
2016
71
20
38
12
2011
Majors
SAS
LCCs
Capacity Scandinavia-
Europe (Seats in millions)
Purpose of travel – Scandinavia
(Passengers in millions; CAGR %)
47
61
29
32
Busi-
ness
2011
93
Leisure
75
2016
Source: Innovata schedule data; airport statistics from Swedavia, Avinor and Copenhagen Airport (sub-set of total market)
+7%
+1%
+1%
CAGR
2011-2016
+2%
+6%
CAGR
2011-2016
3/8/2017
5
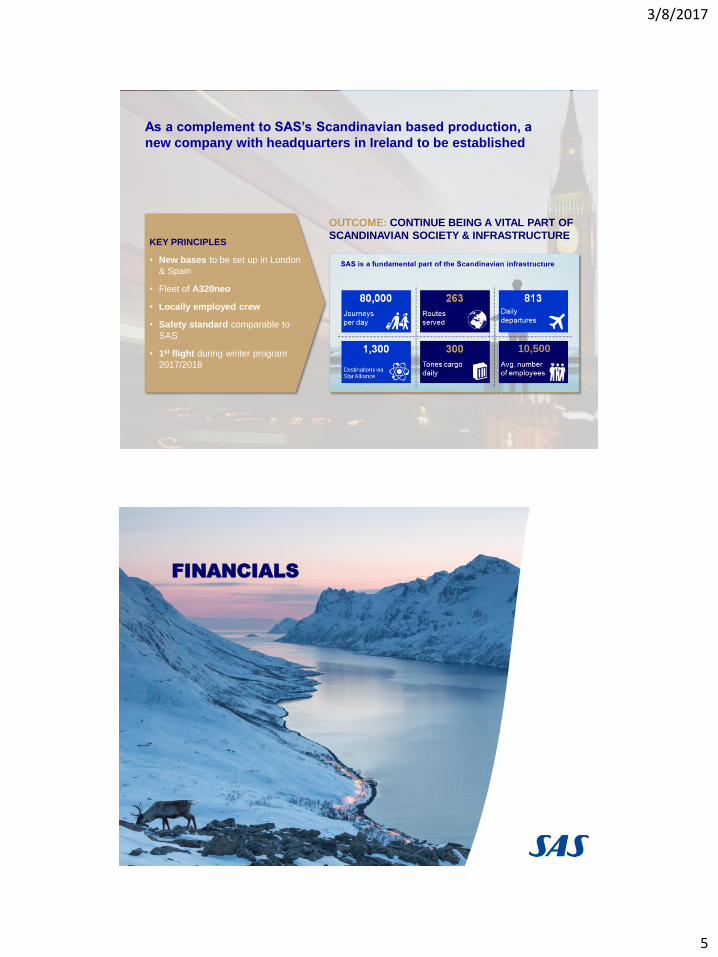
As a complement to SAS’s Scandinavian based production, a
new company with headquarters in Ireland to be established
OUTCOME: CONTINUE BEING A VITAL PART OF
SCANDINAVIAN SOCIETY & INFRASTRUCTURE KEY PRINCIPLES
• New bases to be set up in London
& Spain
• Fleet of A320neo
• Locally employed crew
• Safety standard comparable to
SAS
• 1st flight during winter program
2017/2018
10,500
10
FINANCIALS
3/8/2017
6
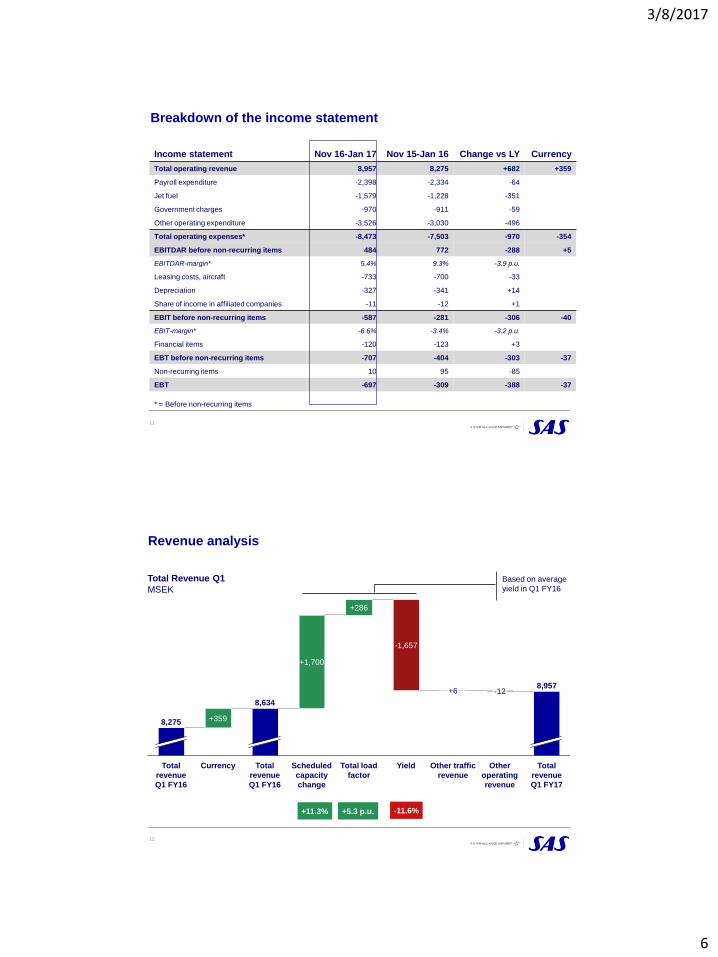
Breakdown of the income statement
* = Before non-recurring items
Income statement Nov 16-Jan 17 Nov 15-Jan 16 Change vs LY Currency
Total operating revenue 8,957 8,275 +682 +359
Payroll expenditure -2,398 -2,334 -64
Jet fuel -1,579 -1,228 -351
Government charges -970 -911 -59
Other operating expenditure -3,526 -3,030 -496
Total operating expenses* -8,473 -7,503 -970 -354
EBITDAR before non-recurring items 484 772 -288 +5
EBITDAR-margin* 5.4% 9.3% -3.9 p.u.
Leasing costs, aircraft -733 -700 -33
Depreciation -327 -341 +14
Share of income in affiliated companies -11 -12 +1
EBIT before non-recurring items -587 -281 -306 -40
EBIT-margin* -6.6% -3.4% -3.2 p.u.
Financial items -120 -123 +3
EBT before non-recurring items -707 -404 -303 -37
Non-recurring items 10 95 -85
EBT -697 -309 -388 -37
11
Total Revenue Q1
MSEK
Revenue analysis
Scheduled
capacity
change
-1,657
+1,700
Total
revenue
Q1 FY16
Currency
8,634
Total
revenue
Q1 FY16
8,275 +359
Other
operating
revenue
-12 8,957
Total
revenue
Q1 FY17
Yield
+286
Total load
factor
Other traffic
revenue
+6
+5.3 p.u. -11.6% +11.3%
12
Based on average
yield in Q1 FY16
3/8/2017
7
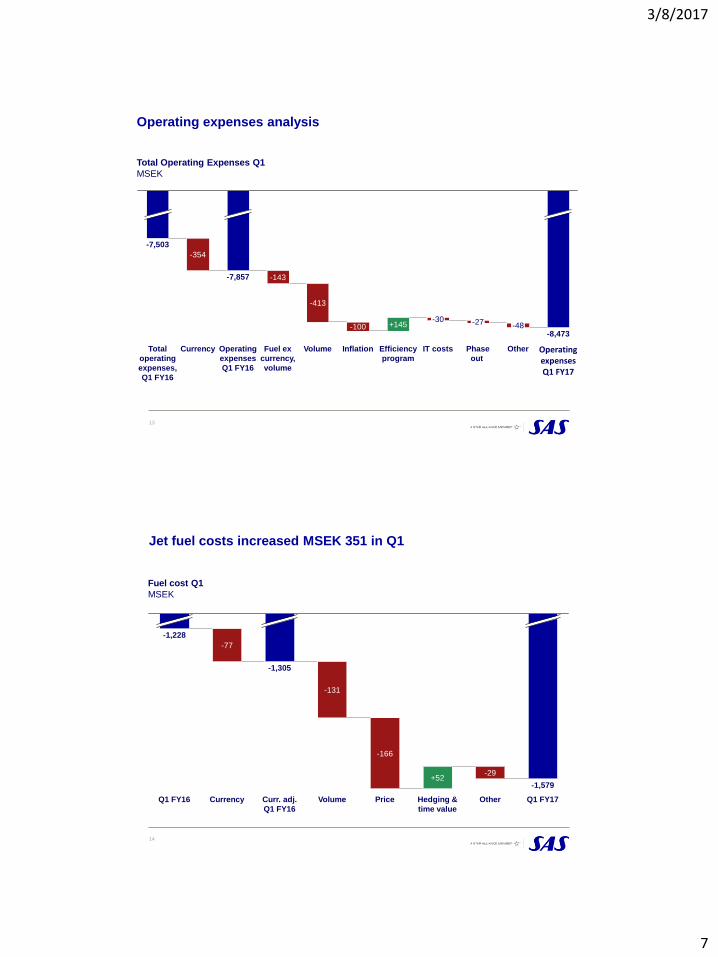
Total Operating Expenses Q1
MSEK
Operating expenses analysis
IT costs
-354
-100
-7,857
-7,503
Operating
expenses
Q1 FY16
-30
Fuel ex
currency,
volume
Total
operating
expenses,
Q1 FY16
-413
Currency
-143
Volume Inflation
+145
Efficiency
program
-8,473
Other
Operating expenses Q1 FY17
-48
Phase
out
-27
13
Curr. adj.
Q1 FY16
+52
Q1 FY17 Other
-166
Volume
-29
Hedging &
time value
-1,579
Price
-131
-1,305
Currency Q1 FY16
-1,228
-77
Jet fuel costs increased MSEK 351 in Q1
Fuel cost Q1
MSEK
14
3/8/2017
8
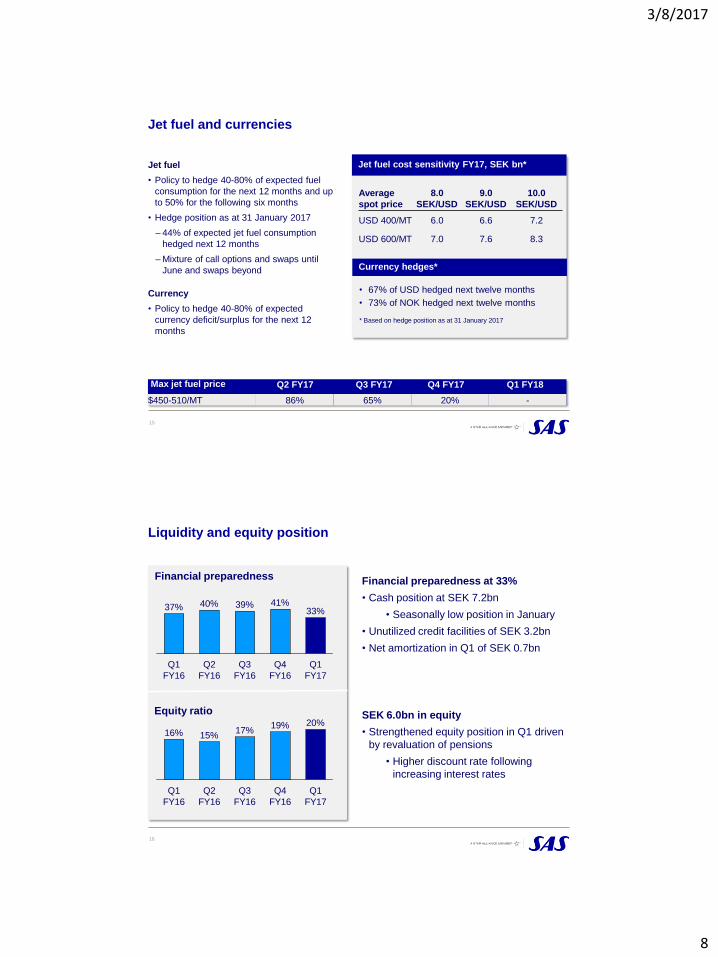
Jet fuel and currencies
Jet fuel cost sensitivity FY17, SEK bn*
Average
spot price
8.0
SEK/USD
9.0
SEK/USD
10.0
SEK/USD
USD 400/MT 6.0 6.6 7.2
USD 600/MT 7.0 7.6 8.3
* Based on hedge position as at 31 January 2017
Currency hedges*
• 67% of USD hedged next twelve months
• 73% of NOK hedged next twelve months
Jet fuel
• Policy to hedge 40-80% of expected fuel
consumption for the next 12 months and up
to 50% for the following six months
• Hedge position as at 31 January 2017
– 44% of expected jet fuel consumption
hedged next 12 months
– Mixture of call options and swaps until
June and swaps beyond
Currency
• Policy to hedge 40-80% of expected
currency deficit/surplus for the next 12
months
15
Max jet fuel price Q4 FY17 Q2 FY17 Q3 FY17 Q1 FY18
$450-510/MT 86% 65% 20% -
Financial preparedness at 33%
• Cash position at SEK 7.2bn
• Seasonally low position in January
• Unutilized credit facilities of SEK 3.2bn
• Net amortization in Q1 of SEK 0.7bn
SEK 6.0bn in equity
• Strengthened equity position in Q1 driven
by revaluation of pensions
• Higher discount rate following
increasing interest rates
Financial preparedness
Liquidity and equity position
16
Equity ratio
19%
Q4
FY16
16%
Q2
FY16
17%
Q3
FY16
15%
Q1
FY16
20%
Q1
FY17
Q1
FY17
Q3
FY16
Q2
FY16
40%
Q1
FY16
33% 37% 39%
Q4
FY16
41%
3/8/2017
9
17
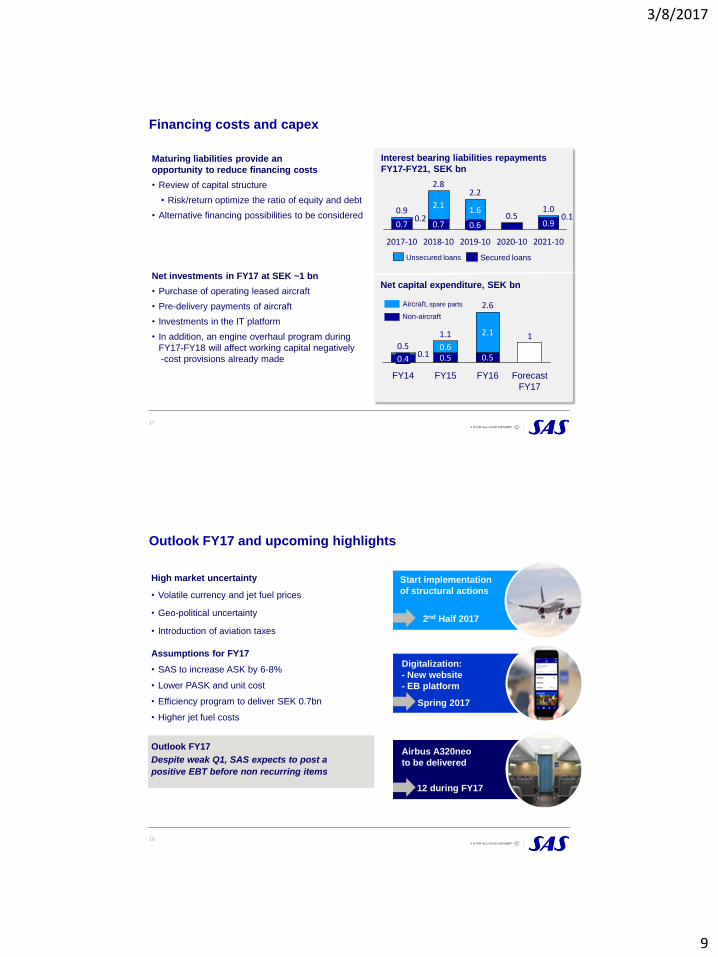
Financing costs and capex
Maturing liabilities provide an
opportunity to reduce financing costs
• Review of capital structure
• Risk/return optimize the ratio of equity and debt
• Alternative financing possibilities to be considered
Net investments in FY17 at SEK ~1 bn
• Purchase of operating leased aircraft
• Pre-delivery payments of aircraft
• Investments in the IT platform
• In addition, an engine overhaul program during
FY17-FY18 will affect working capital negatively
-cost provisions already made
Interest bearing liabilities repayments
FY17-FY21, SEK bn
Net capital expenditure, SEK bn
FY16
0.5 0.1
1.1 2.1
0.5
FY14 Forecast
FY17
FY15
0.6 1
2.6
0.5
0.4
Aircraft, spare parts
Non-aircraft
2019-10
0.9
1.6
2018-10
0.1
2020-10
0.7
2021-10 2017-10
0.7
2.8
0.2 1.0
0.6
2.1
2.2
0.9 0.5
Secured loans Unsecured loans
Outlook FY17 and upcoming highlights
18
High market uncertainty
• Volatile currency and jet fuel prices
• Geo-political uncertainty
• Introduction of aviation taxes
Assumptions for FY17
• SAS to increase ASK by 6-8%
• Lower PASK and unit cost
• Efficiency program to deliver SEK 0.7bn
• Higher jet fuel costs
Outlook FY17
Despite weak Q1, SAS expects to post a
positive EBT before non recurring items
Airbus A320neo
to be delivered
12 during FY17
Digitalization:
- New website
- EB platform
Spring 2017
Start implementation
of structural actions
2nd Half 2017
3/8/2017
10
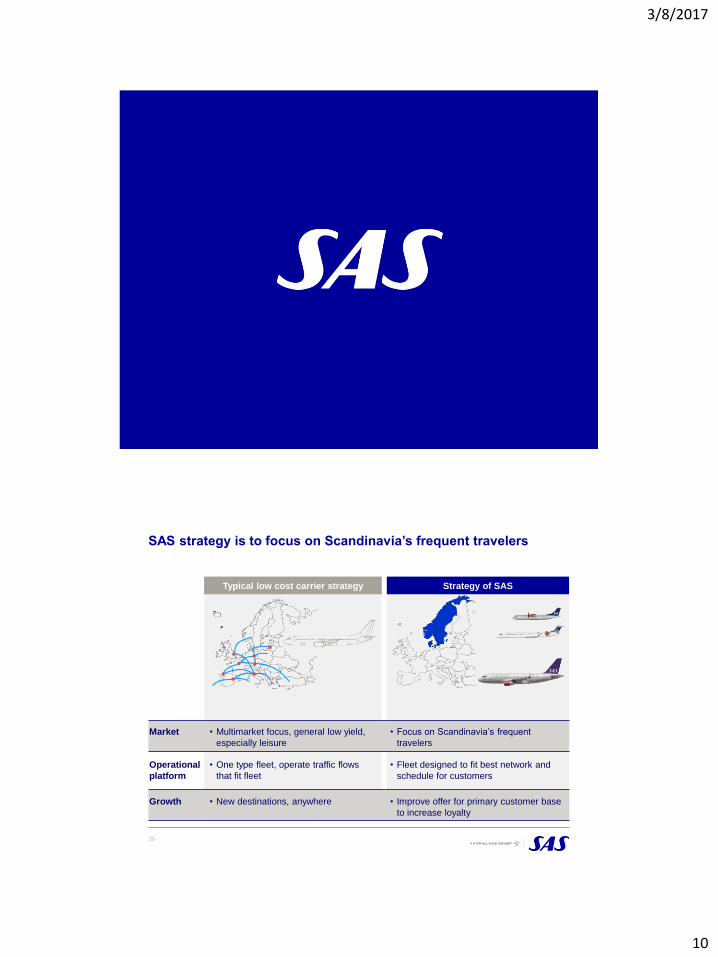
Typical low cost carrier strategy
20
SAS strategy is to focus on Scandinavia’s frequent travelers
Strategy of SAS
• Multimarket focus, general low yield,
especially leisure
Market • Focus on Scandinavia’s frequent
travelers
• One type fleet, operate traffic flows
that fit fleet
• Fleet designed to fit best network and
schedule for customers
Growth • New destinations, anywhere • Improve offer for primary customer base
to increase loyalty
Operational
platform

3/8/2017
11
21
• Improve planning and productivity
• Completion of two tier production model
• Improved inflight logistics
• Digitalization and automation
• Increased productivity from collective agreements
• Centralization of Passenger Control Centre
• Lean process implementation at CPH/ARN
• Improved planning from new IT system
• Close down and consolidation of legacy IT systems
• Transition to cloud solutions
• Distribution channels shift
MSEK 600
MSEK 100
MSEK 300
MSEK 500
Earnings impact
FY17 – FY19
Operations,
charges, fuel
Ground
Handling
Technical
maintenance
Admin &
Commercial
Initiated activities of SEK 1.5bn in FY17- FY19
SAS beyond 2020
Expanded
Intercont with more aircraft
Strong
Short-haul
with new point-to-
point destinations
Broader
Business
scope – EuroBonus,
Digital and Lifestyle
Flexible and
cost-efficient
Operations through
internal/external
resources
Transparent
and efficient
Governance
structure
Sharp
Commercial
offering with focus on
prioritized areas
Shareholder
value
creation

3/8/2017
12
Appendices
Fleet & productivity
Unit revenue (yield & PASK) & Unit cost
Traffic & capacity outlook
Financial update
Currency & Fuel
23
Aircraft in traffic under SK
traffic license Age Owned Leased Total Firm order
Lease
order
Airbus A330/A340/A350 11.6 9 7 16 8
Airbus A321/A320/A319 10.3 8 21 29 26
Boeing 737 NG 13.9 20 60 80
Total 12.8 37 88 125 34
Aircraft in service under a
license other than SAS’s (SK) Age Owned Wet lease Total
Wet lease
order
Boeing 737-700 BBJ 11.4 1 1
Bombardier CRJ900 4.8 11 8 19 4
ATR-72 2.2 12 12
Total 4.0 11 21 32 4
Leased/phased out aircraft Owned Leased Total In service Parked
Bombardier Q400 9.1 1 1 1
9.1 1 1 1
SAS fleet – January 2017
24
3/8/2017
13
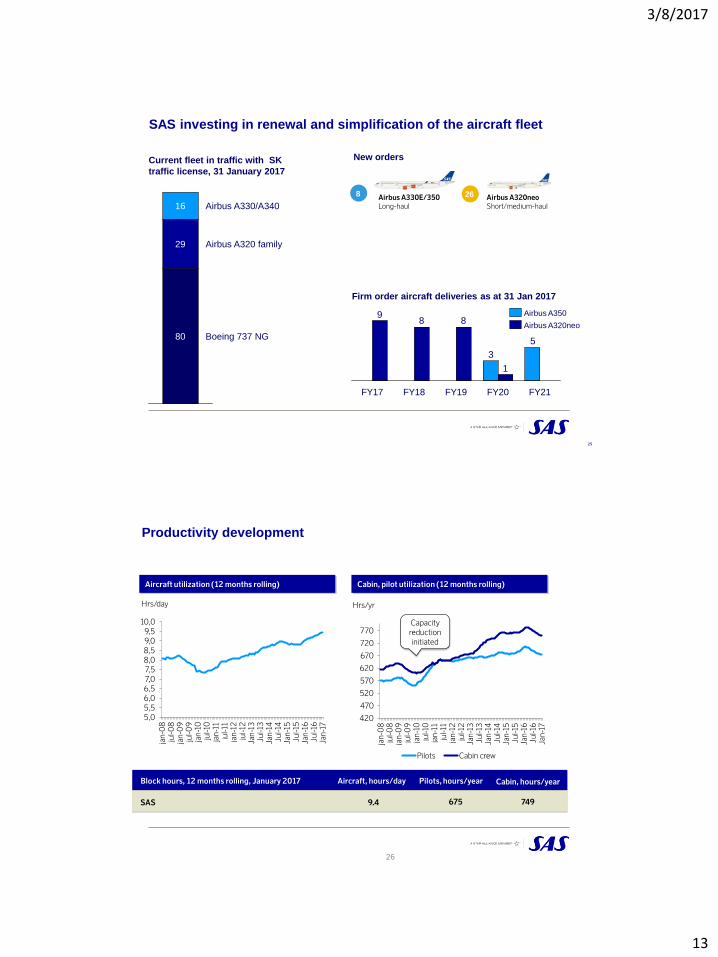
SAS investing in renewal and simplification of the aircraft fleet
Current fleet in traffic with SK
traffic license, 31 January 2017
Airbus A320neo
Short/medium-haul
26
New orders
Airbus A330E/350
Long-haul
8
Firm order aircraft deliveries as at 31 Jan 2017
25
5
3
1
889
FY20 FY19 FY21 FY18 FY17
Airbus A350
Airbus A320neo
Airbus A330/A340
Airbus A320 family 29
Boeing 737 NG 80
16
Productivity development
Block hours, 12 months rolling, January 2017
SAS 9.4
Aircraft, hours/day
675
Pilots, hours/year
749
Cabin, hours/year
Aircraft utilization (12 months rolling) Cabin, pilot utilization (12 months rolling)
5,0
5,5
6,0
6,5
7,0
7,5
8,0
8,5
9,0
9,5
10,0
jan
-08
ju
l-0
8
jan
-09
ju
l-0
9
jan
-10
ju
l-10
ja
n-1
1
jul-1
1
jan
-12
ju
l-12
Ja
n-1
3
Jul-1
3
Jan
-14
Ju
l-14
Ja
n-1
5
Jul-1
5
Jan
-16
Ju
l-16
Ja
n-1
7 420
470
520
570
620
670
720
770
jan
-08
ju
l-0
8
jan
-09
ju
l-0
9
jan
-10
ju
l-10
ja
n-1
1
jul-1
1
jan
-12
ju
l-12
Ja
n-1
3
Jul-1
3
Jan
-14
Ju
l-14
Ja
n-1
5
Jul-1
5
Jan
-16
Ju
l-16
Ja
n-1
7
Pilots Cabin crew
Hrs/day Hrs/yr
Capacity
reduction
initiated
26
3/8/2017
14
Fleet & productivity
Unit revenue (yield & PASK) & unit cost
Traffic & capacity outlook
Financial update
Currency & Fuel
27
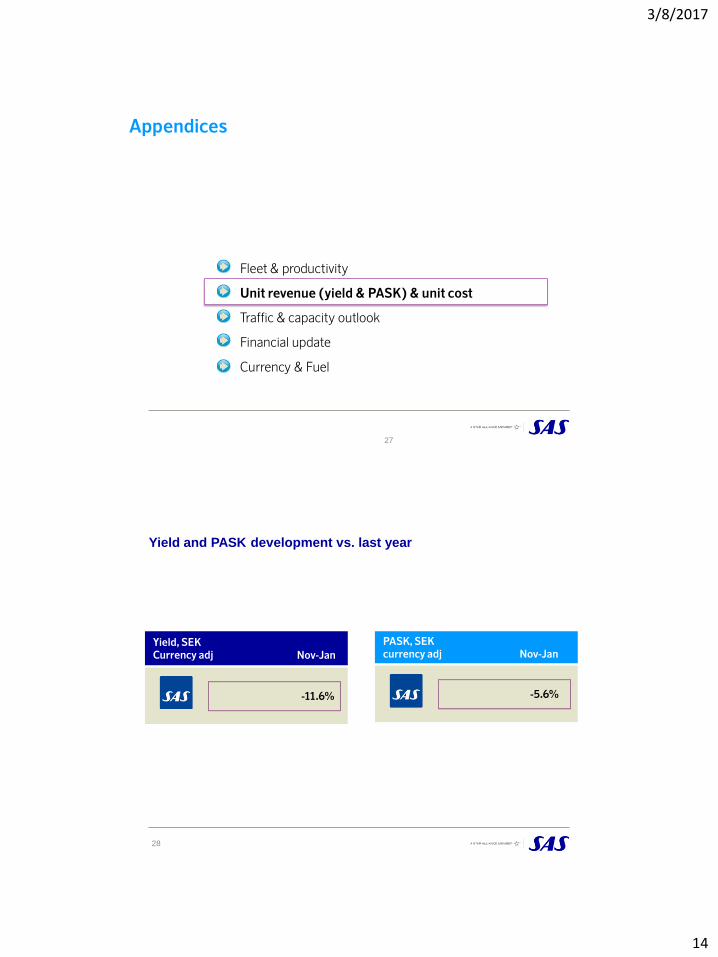
Appendices
Yield and PASK development vs. last year
28
Yield, SEK
Currency adj
PASK, SEK
currency adj
-11.6% -5.6%
Nov-Jan Nov-Jan
3/8/2017
15
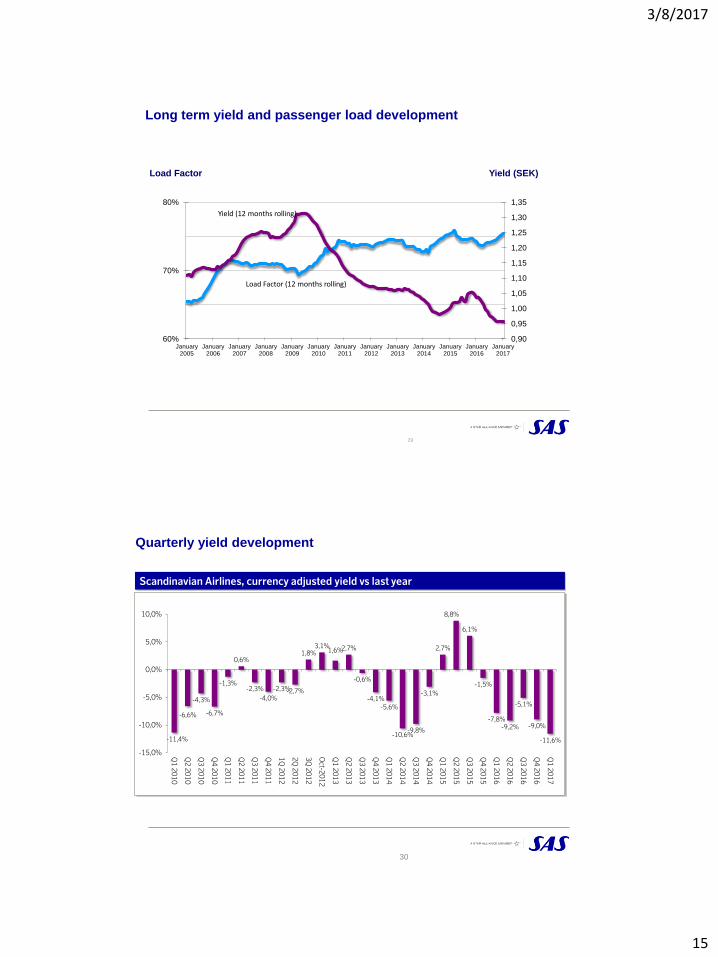
Long term yield and passenger load development
0,90
0,95
1,00
1,05
1,10
1,15
1,20
1,25
1,30
1,35
60%
70%
80%
January 2005
January 2006
January 2007
January 2008
January 2009
January 2010
January 2011
January 2012
January 2013
January 2014
January 2015
January 2016
January 2017
29
Yield (SEK) Load Factor
Load Factor (12 months rolling)
Yield (12 months rolling)
Quarterly yield development
-11,4%
-6,6%
-4,3%
-6,7%
-1,3%
0,6%
-2,3%
-4,0%
-2,3% -2,7%
1,8% 3,1%
1,6% 2,7%
-0,6%
-4,1%
-5,6%
-10,6% -9,8%
-3,1%
2,7%
8,8%
6,1%
-1,5%
-7,8% -9,2%
-5,1%
-9,0%
-11,6%
-15,0%
-10,0%
-5,0%
0,0%
5,0%
10,0%
Q1
20
10
Q2
20
10
Q3
20
10
Q4
20
10
Q1
20
11
Q2
20
11
Q3
20
11
Q4
20
11
1Q
20
12
2Q
20
12
3Q
20
12
Oct-2
01
2
Q1
20
13
Q2
20
13
Q3
20
13
Q4
20
13
Q1
20
14
Q2
20
14
Q3
20
14
Q4
20
14
Q1
20
15
Q2
20
15
Q3
20
15
Q4
20
15
Q1
20
16
Q2
20
16
Q3
20
16
Q4
20
16
Q1
20
17
Scandinavian Airlines, currency adjusted yield vs last year
30
3/8/2017
16
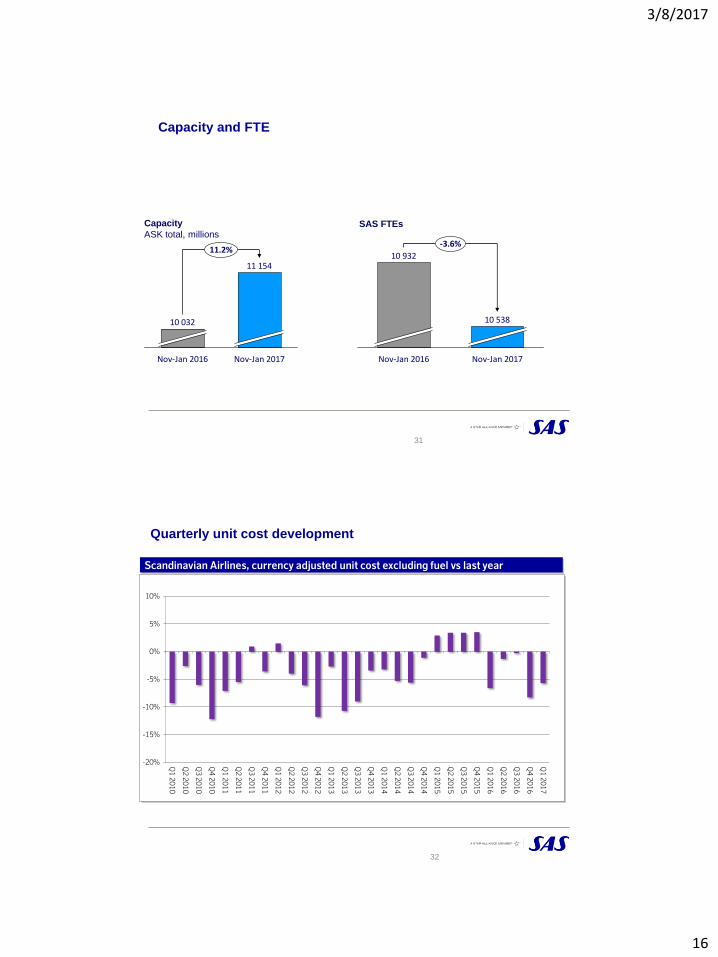
Capacity and FTE
31
Capacity
ASK total, millions SAS FTEs
10 032
11.2%
Nov-Jan 2016
11 154
Nov-Jan 2017
10 932
-3.6%
10 538
Nov-Jan 2016 Nov-Jan 2017
Scandinavian Airlines, currency adjusted unit cost excluding fuel vs last year
Quarterly unit cost development
-20%
-15%
-10%
-5%
0%
5%
10%
Q1
20
10
Q2
20
10
Q3
20
10
Q4
20
10
Q1
20
11
Q2
20
11
Q3
20
11
Q4
20
11
Q1
20
12
Q2
20
12
Q3
20
12
Q4
20
12
Q1
20
13
Q2
20
13
Q3
20
13
Q4
20
13
Q1
20
14
Q2
20
14
Q3
20
14
Q4
20
14
Q1
20
15
Q2
20
15
Q3
20
15
Q4
20
15
Q1
20
16
Q2
20
16
Q3
20
16
Q4
20
16
Q1
20
17
32
3/8/2017
17
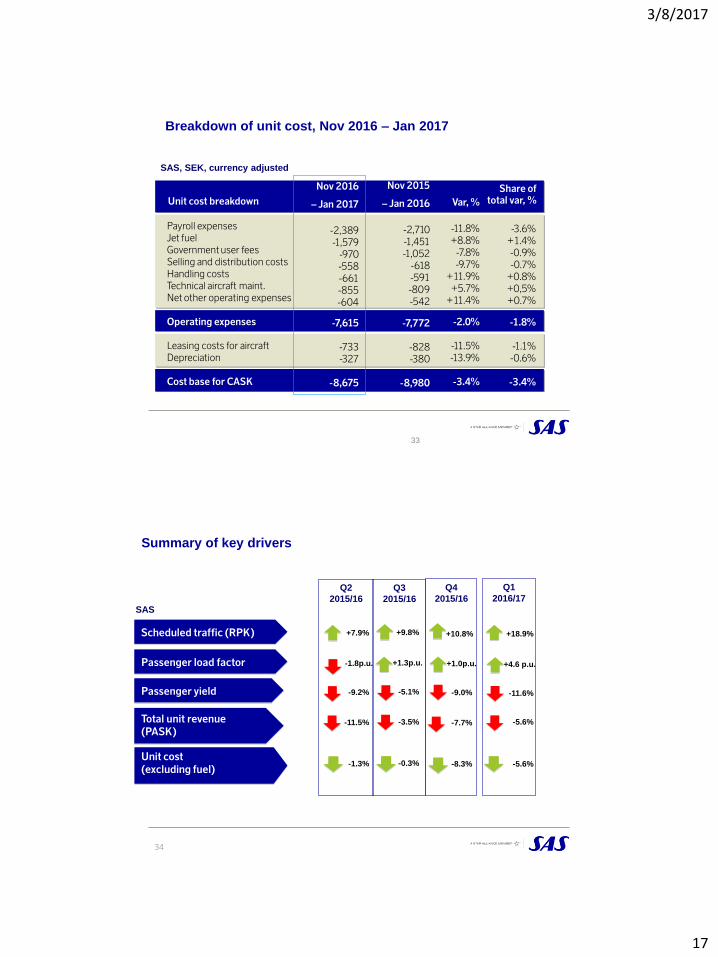
Breakdown of unit cost, Nov 2016 – Jan 2017
Unit cost breakdown
Payroll expenses
Jet fuel
Government user fees
Selling and distribution costs
Handling costs
Technical aircraft maint.
Net other operating expenses
Operating expenses
Leasing costs for aircraft
Depreciation
Cost base for CASK
Nov 2015
– Jan 2016
-2,710
-1,451
-1,052
-618
-591
-809
-542
-7,772
-828
-380
-8,980
Nov 2016
– Jan 2017
-2,389
-1,579
-970
-558
-661
-855
-604
-7,615
-733
-327
-8,675
Var, %
-11.8%
+8.8%
-7.8%
-9.7%
+11.9%
+5.7%
+11.4%
-2.0%
-11.5%
-13.9%
-3.4%
-3.6%
+1.4%
-0.9%
-0.7%
+0.8%
+0,5%
+0.7%
-1.8%
-1.1%
-0.6%
-3.4%
Share of
total var, %
SAS, SEK, currency adjusted
33
Summary of key drivers
SAS
Scheduled traffic (RPK)
Passenger load factor
Passenger yield
Total unit revenue
(PASK)
Unit cost
(excluding fuel)
34
Q3
2015/16
-5.1%
-3.5%
+9.8%
-0.3%
+1.3p.u.
Q4
2015/16
+10.8%
+1.0p.u.
-9.0%
-7.7%
-8.3%
Q1
2016/17
+18.9%
+4.6 p.u.
-11.6%
-5.6%
-5.6%
Q2
2015/16
+7.9%
-1.8p.u.
-9.2%
-11.5%
-1.3%
3/8/2017
18
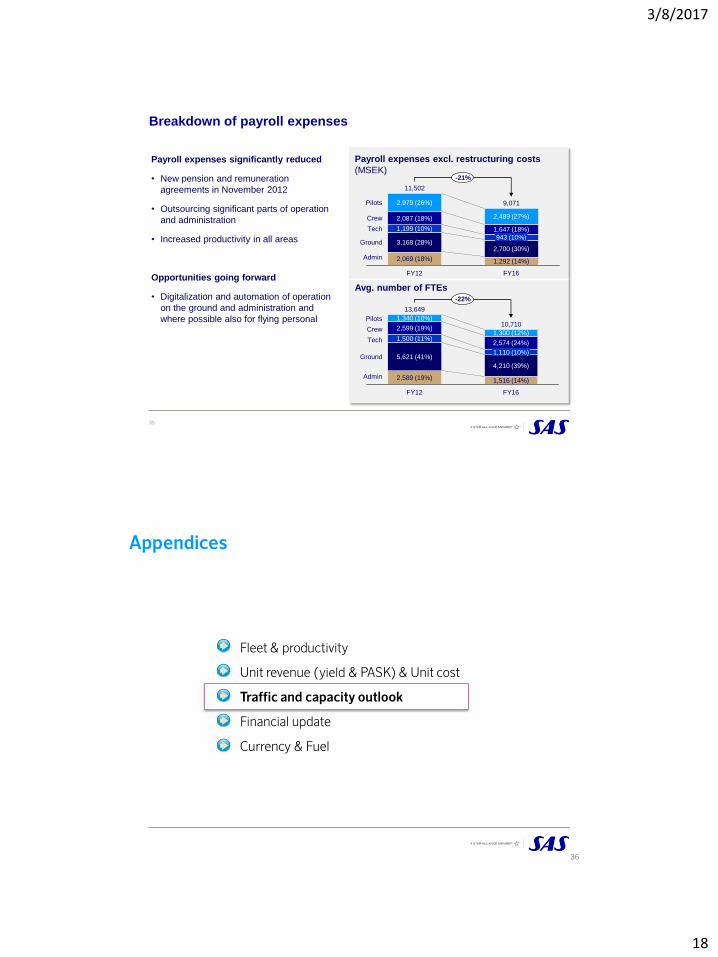
Breakdown of payroll expenses
Payroll expenses excl. restructuring costs
(MSEK) Payroll expenses significantly reduced
• New pension and remuneration
agreements in November 2012
• Outsourcing significant parts of operation
and administration
• Increased productivity in all areas
Opportunities going forward
• Digitalization and automation of operation
on the ground and administration and
where possible also for flying personal
35
2,087 (18%)
2,979 (26%)
Ground
Admin
Tech
Pilots
Crew
-21%
2,489 (27%)
11,502
3,168 (28%)
2,069 (18%)
FY12
1,199 (10%) 1,647 (18%)
2,700 (30%)
1,292 (14%)
FY16
9,071
943 (10%)
Avg. number of FTEs
Admin
Ground
Tech
-22%
2,589 (19%)
1,110 (10%)
2,574 (24%)
FY12
1,300 (12%)
13,649
Crew
FY16
10,710
1,516 (14%)
4,210 (39%)
Pilots 1,340 (10%)
5,621 (41%)
1,500 (11%)
2,599 (19%)
Fleet & productivity
Unit revenue (yield & PASK) & Unit cost
Traffic and capacity outlook
Financial update
Currency & Fuel
36
Appendices
3/8/2017
19
37
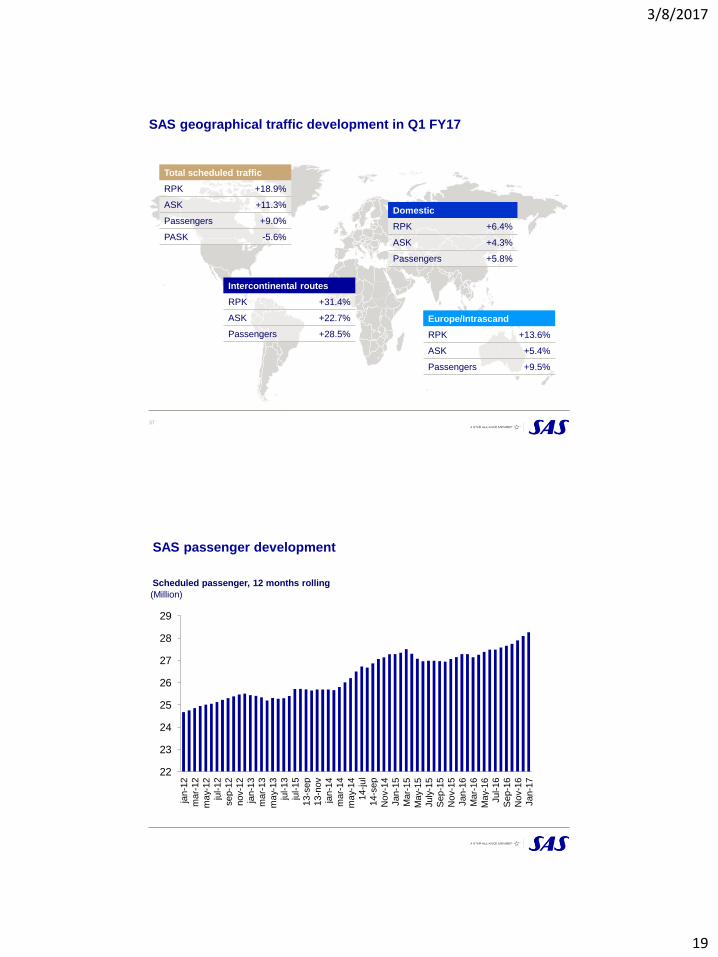
SAS geographical traffic development in Q1 FY17
Total scheduled traffic
RPK +18.9%
ASK +11.3%
Passengers +9.0%
PASK -5.6%
Intercontinental routes
RPK +31.4%
ASK +22.7%
Passengers +28.5%
Europe/Intrascand
RPK +13.6%
ASK +5.4%
Passengers +9.5%
Domestic
RPK +6.4%
ASK +4.3%
Passengers +5.8%
Scheduled passenger, 12 months rolling
(Million)
22
23
24
25
26
27
28
29
jan-1
2
mar-
12
may-
12
jul-12
sep-1
2
nov-1
2
jan-1
3
mar-
13
may-
13
jul-13
jul-15
13-s
ep
13-n
ov
jan-1
4
mar-
14
may-
14
14-jul
14-s
ep
Nov-1
4
Jan-1
5
Mar-
15
May-
15
July
-15
Sep-1
5
Nov-1
5
Jan-1
6
Mar-
16
May-
16
Jul-16
Sep-1
6
Nov-1
6
Jan-1
7
SAS passenger development
3/8/2017
20
ORD
IAD
NRT
PEK
PVG
CPH
OSL
HKG
ARN
SFO LAX
MIA
39
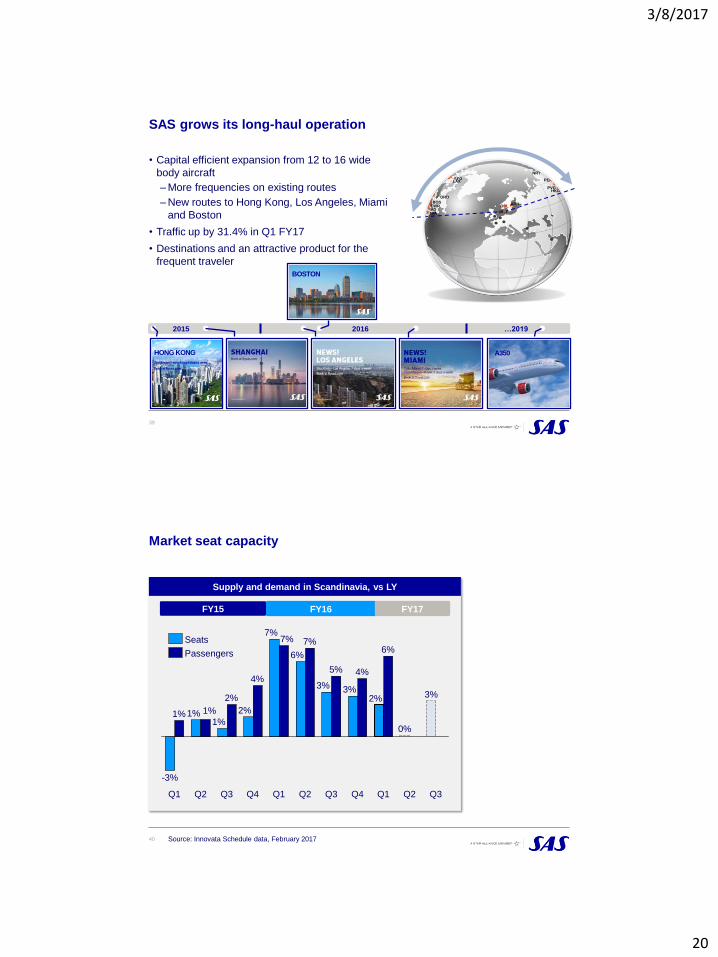
• Capital efficient expansion from 12 to 16 wide
body aircraft
– More frequencies on existing routes
– New routes to Hong Kong, Los Angeles, Miami
and Boston
• Traffic up by 31.4% in Q1 FY17
• Destinations and an attractive product for the
frequent traveler
SAS grows its long-haul operation
2015 2016 …2019
EWR BOS
HONG KONG
Stockholm–Hong Kong 5 days a week
Book at flysas.com
A350
BOSTON
Market seat capacity
40
Supply and demand in Scandinavia, vs LY
FY16 FY15
6%
7%
Q1
7%
Q4
3%
0%
Q4 Q1
4%
2%
Q2
7%
Q2 Q3
5%
3%
Q3
6%
3%
-3%
2%
Q2
2% 1%
Q1
1%
4%
Q3
1% 1%
Passengers
Seats
Source: Innovata Schedule data, February 2017
FY17
3/8/2017
21
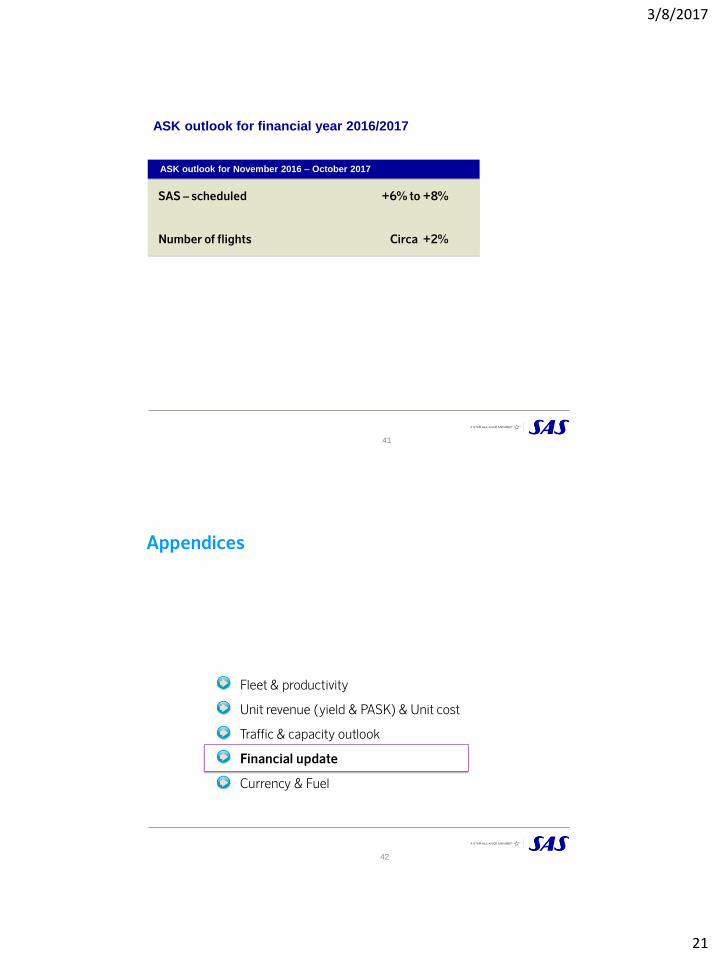
ASK outlook for financial year 2016/2017
41
SAS – scheduled
Number of flights
+6% to +8%
Circa +2%
ASK outlook for November 2016 – October 2017
Appendices
Fleet & productivity
Unit revenue (yield & PASK) & Unit cost
Traffic & capacity outlook
Financial update
Currency & Fuel
42
3/8/2017
22
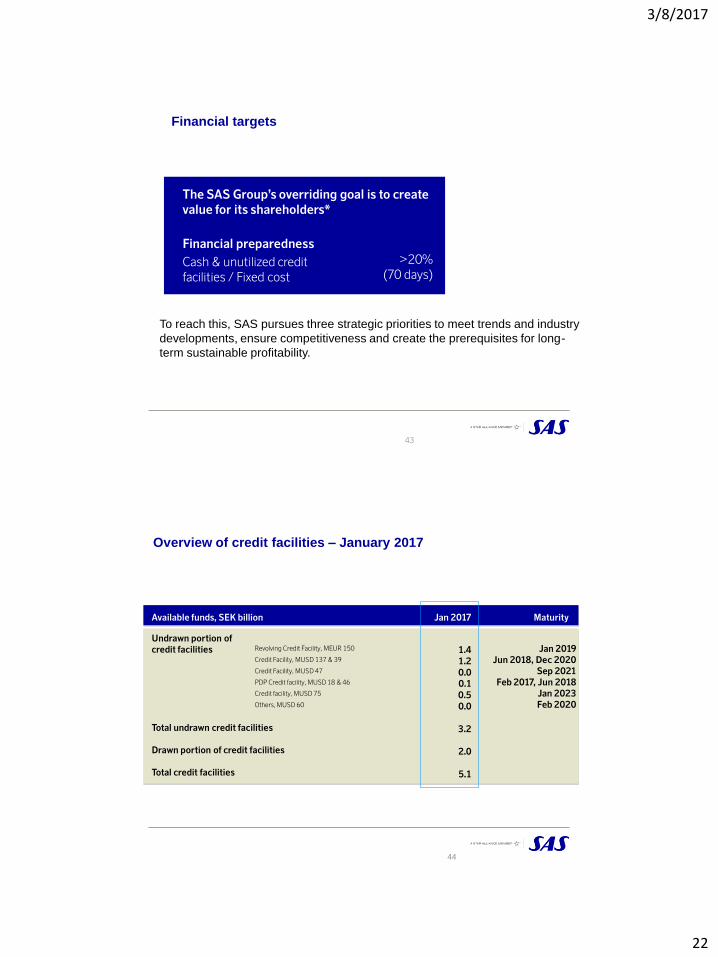
Financial targets
43
Financial preparedness
Cash & unutilized credit
facilities / Fixed cost
>20%
(70 days)
To reach this, SAS pursues three strategic priorities to meet trends and industry
developments, ensure competitiveness and create the prerequisites for long-
term sustainable profitability.
The SAS Group’s overriding goal is to create
value for its shareholders*
Overview of credit facilities – January 2017
Available funds, SEK billion
1.4
1.2
0.0
0.1
0.5
0.0
3.2
2.0
5.1
Jan 2019
Jun 2018, Dec 2020
Sep 2021
Feb 2017, Jun 2018
Jan 2023
Feb 2020
Jan 2017 Maturity
Undrawn portion of
credit facilities
Total undrawn credit facilities
Drawn portion of credit facilities
Total credit facilities
Revolving Credit Facility, MEUR 150
Credit Facility, MUSD 137 & 39
Credit Facility, MUSD 47
PDP Credit facility, MUSD 18 & 46
Credit facility, MUSD 75
Others, MUSD 60
44
3/8/2017
23
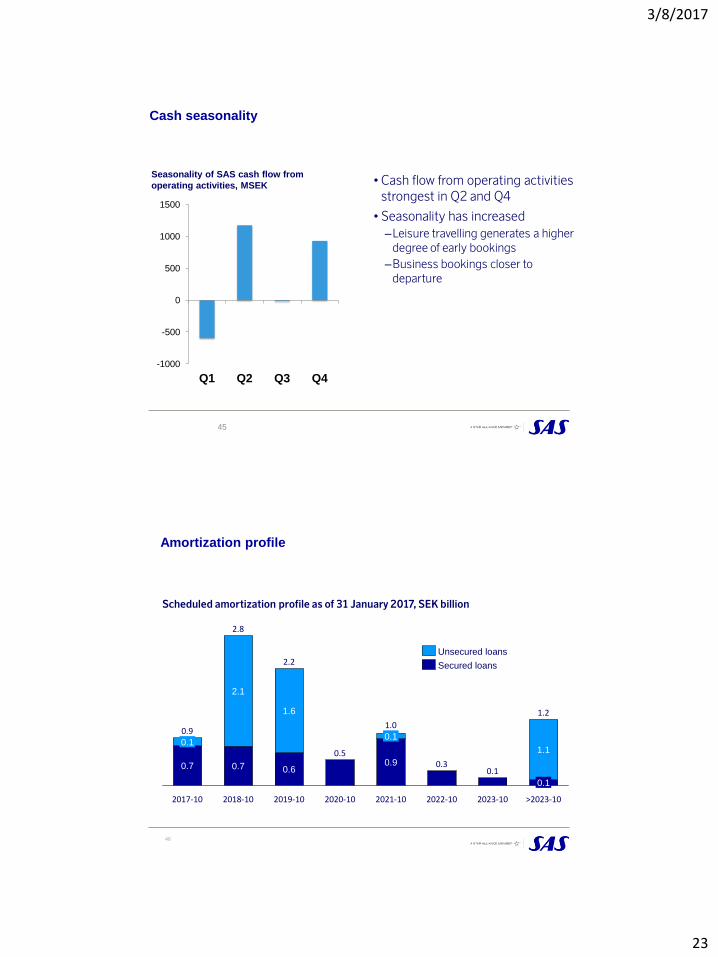
Cash seasonality
Seasonality of SAS cash flow from
operating activities, MSEK
-1000
-500
0
500
1000
1500
Q1 Q2 Q3 Q4
45
• Cash flow from operating activities
strongest in Q2 and Q4
• Seasonality has increased
–Leisure travelling generates a higher
degree of early bookings
–Business bookings closer to
departure
Amortization profile
Scheduled amortization profile as of 31 January 2017, SEK billion
2020-10 2019-10 2021-10 >2023-10 2023-10 2018-10
2.2
2017-10 2022-10
0.9
1.2
1.0
2.8
0.6
0.5
2.1
0.9
1.6
0.7
0.1
0.7
0.1
0.3 0.1
0.1
1.1
Unsecured loans
Secured loans
46
3/8/2017
24
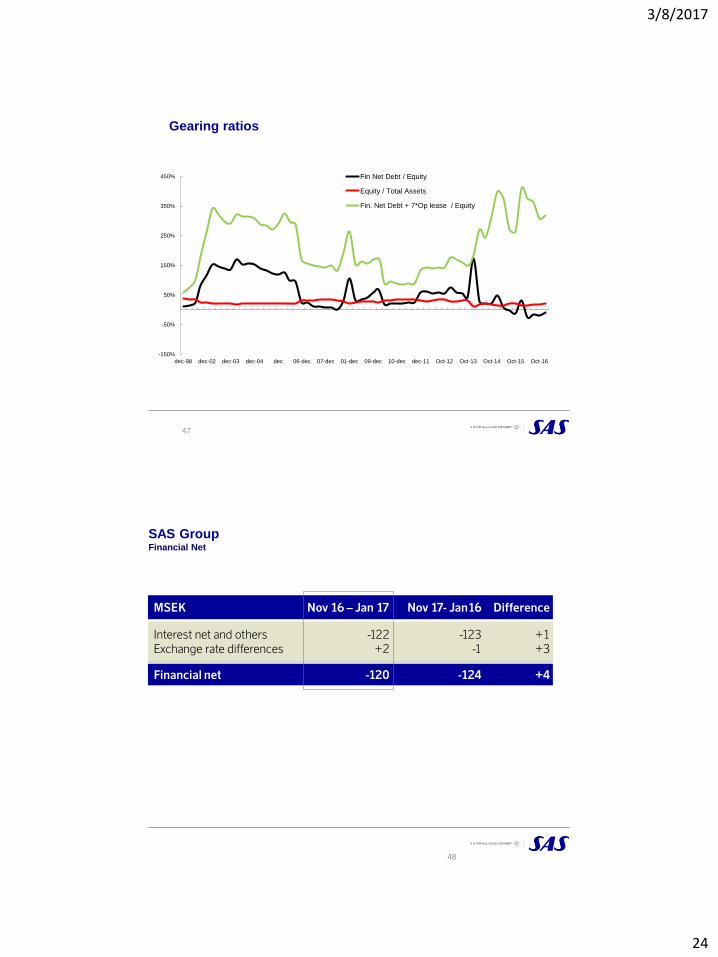
Gearing ratios
-150%
-50%
50%
150%
250%
350%
450%
dec-98 dec-02 dec-03 dec-04 dec 06-dec 07-dec 01-dec 09-dec 10-dec dec-11 Oct-12 Oct-13 Oct-14 Oct-15 Oct-16
Fin Net Debt / Equity
Equity / Total Assets
Fin. Net Debt + 7*Op lease / Equity
47
SAS Group Financial Net
MSEK
-122
+2
Interest net and others
Exchange rate differences
Financial net +4
-123
-1
+1
+3
-124 -120
Nov 16 – Jan 17 Nov 17- Jan16 Difference
48
3/8/2017
25
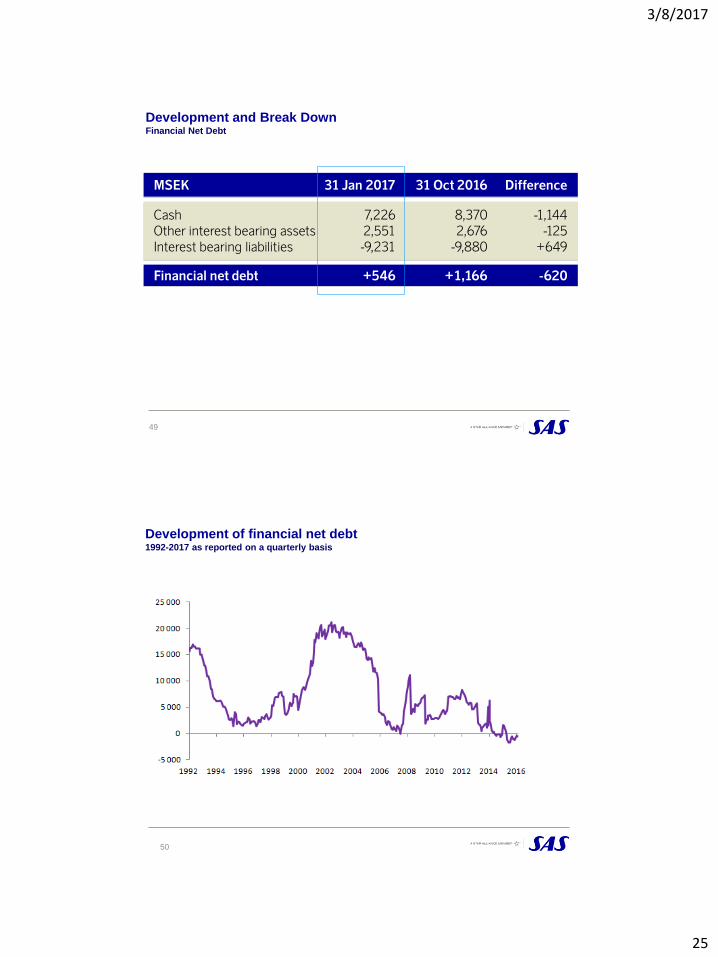
Development and Break Down Financial Net Debt
MSEK
7,226
2,551
-9,231
Cash
Other interest bearing assets
Interest bearing liabilities
Financial net debt -620
8,370
2,676
-9,880
-1,144
-125
+649
+1,166 +546
31 Jan 2017 31 Oct 2016 Difference
49
Development of financial net debt 1992-2017 as reported on a quarterly basis
50
3/8/2017
26
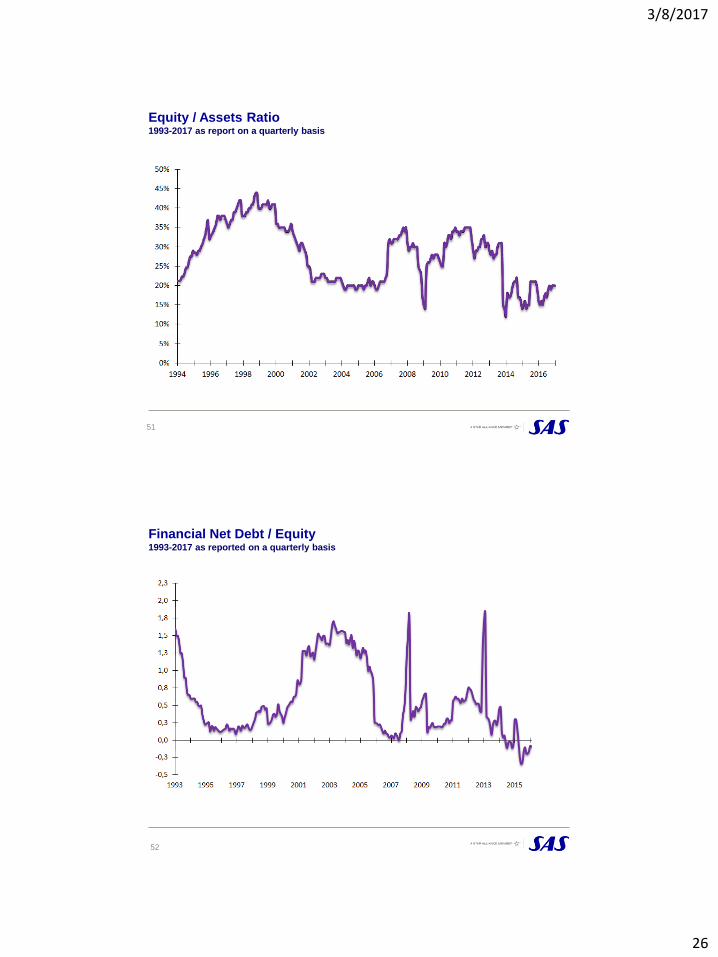
Equity / Assets Ratio 1993-2017 as report on a quarterly basis
51
Financial Net Debt / Equity 1993-2017 as reported on a quarterly basis
52
3/8/2017
27
Appendices
Fleet & productivity
Unit revenue (yield & PASK) & Unit cost
Traffic & capacity outlook
Financial update
Currency & Fuel
53
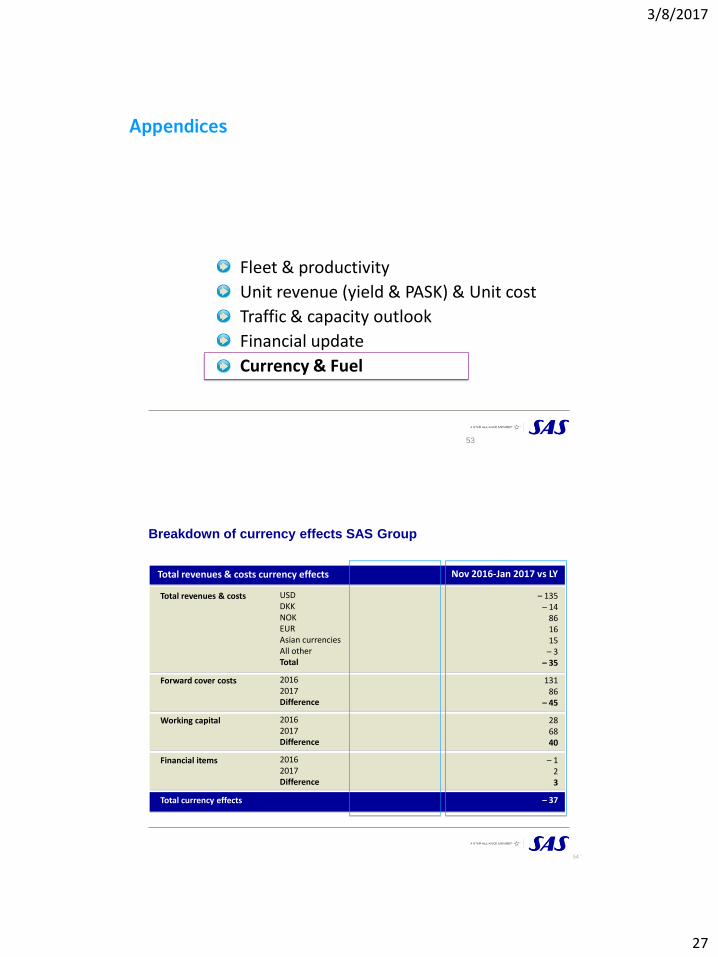
Breakdown of currency effects SAS Group
Total revenues & costs currency effects
USD DKK NOK EUR Asian currencies All other Total
2016 2017 Difference
2016 2017 Difference
2016 2017 Difference
Total revenues & costs
Forward cover costs
Working capital
Financial items
Total currency effects
Nov 2016-Jan 2017 vs LY
– 135 – 14
86 16 15 – 3
– 35
131 86
– 45
28 68 40
– 1 2 3
– 37
54
3/8/2017
28
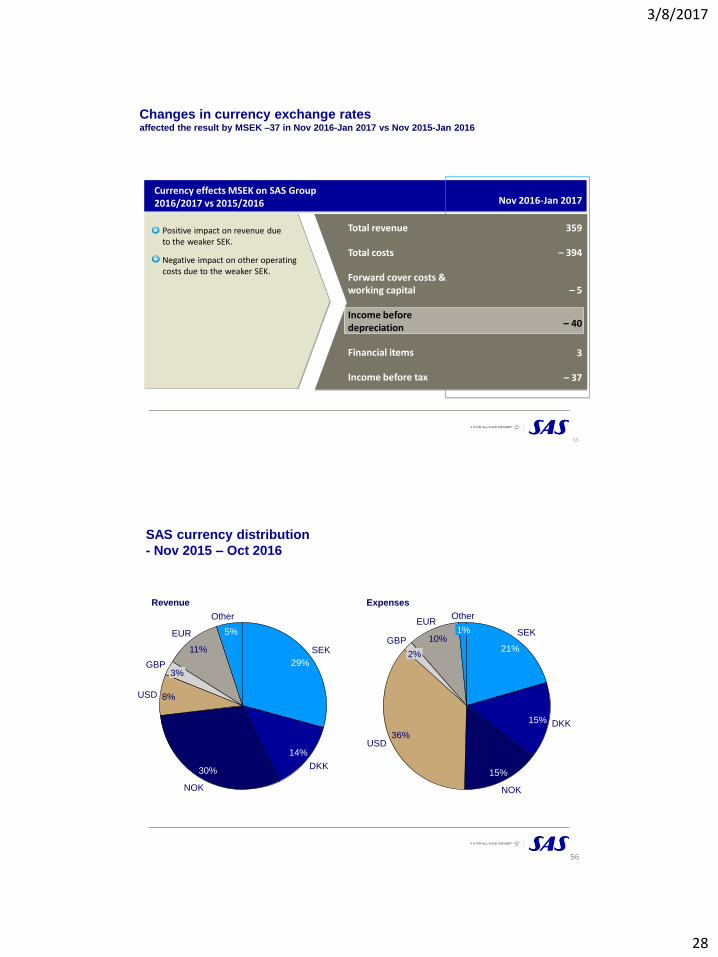
Currency effects MSEK on SAS Group 2016/2017 vs 2015/2016
Changes in currency exchange rates affected the result by MSEK –37 in Nov 2016-Jan 2017 vs Nov 2015-Jan 2016
55
Positive impact on revenue due to the weaker SEK.
Negative impact on other operating costs due to the weaker SEK.
Nov 2016-Jan 2017
359
– 394
– 5
– 40
3
– 37
Total revenue
Total costs
Forward cover costs & working capital
Income before depreciation
Financial items
Income before tax
SAS currency distribution
- Nov 2015 – Oct 2016
Revenue Expenses
56
8%
3%
USD
GBP 29%
30%
NOK
14%
SEK
DKK
11%
EUR 5%
Other
36%
2%
USD
GBP 21%
15%
NOK
15%
SEK
DKK
10%
EUR 1%
Other

3/8/2017
29
SAS hedging position
SAS’ jet fuel costs in 2016/17
(annual average values)
Market price
300 USD/MT
400 USD/MT
600 USD/MT
800 USD/MT
SEK 5.0 bn
SEK 5.5 bn
SEK 6.3 bn
SEK 6.9 bn
8.0 SEK/USD
SEK 5.5 bn
SEK 6.0 bn
SEK 7.0 bn
SEK 7.7 bn
9.0 SEK/USD
SEK 6.0 bn
SEK 6.6 bn
SEK 7.6 bn
SEK 8.5 bn
10.0
SEK/USD
7.0 SEK/USD
SEK 6.4 bn
SEK 7.2 bn
SEK 8.3 bn
SEK 9.2 bn
57
Max jet fuel price Q4 FY17 Q2 FY17 Q3 FY17 Q1 FY18
$400-500 86% 65% 20% -