Saratoga Investment Corp. - NASDAQfiles.shareholder.com/.../Saratoga_Investment_Corp.pdf ·...
46
Saratoga Investment Corp. (NYSE: SAR) January 2018 1
Transcript of Saratoga Investment Corp. - NASDAQfiles.shareholder.com/.../Saratoga_Investment_Corp.pdf ·...

Saratoga Investment Corp.(NYSE: SAR)
January 2018
1

Saratoga Investment Corp (“SIC” of the “Fund”)
Exchange: NYSE
Ticker: SAR
As of January 9, 2018
Market Cap: $134.5 million
Stock Price: $22.22
52-Week Trading Range: $19.90 - $23.78
Common Stock Outstanding: 6.2 million
Management Ownership 25%
Total Dividend Payout TTM: $1.90
Latest Quarterly Dividend $0.49
Fiscal Year February 28
Analyst Coverage Ladenburg Thalman & Co.
Compass Point
Janney
National Securities
Maxim Group
This presentation contains “forward looking statements” that are subject to risks and uncertainties.
Actual outcomes and results could differ materially from those suggested by this presentation due to
the impact of many factors beyond the control of Saratoga Investment Corp., including those listed
in the "Risk Factors" section of our filings with the Securities and Exchange Commission (“SEC”).
Any statement other than a statement of historical fact may constitute a forward looking statement.
Any such forward-looking statements are made pursuant to the safe harbor provisions available
under applicable securities laws and Saratoga Investment Corp. assumes no obligation to update or
revise any such forward-looking statements.
Certain information discussed in this presentation (including information relating to portfolio
companies) was derived from third party sources and has not been independently verified and,
accordingly, Saratoga Investment Corp. makes no representation or warranty in respect of this
information.
The following slides contain summaries of certain financial and statistical information about
Saratoga Investment Corp. The information contained in this presentation is summary information
that is intended to be considered in the context of our SEC filings and other public announcements
that we may make, by press release or otherwise, from time to time. We undertake no duty or
obligation to publicly update or revise the information contained in this presentation. In addition,
information related to past performance, while helpful as an evaluative tool, is not necessarily
indicative of future results, the achievement of which cannot be assured. You should not view the
past performance of Saratoga Investment Corp., or information about the market, as indicative of
Saratoga Investment Corp.’s future results. This presentation does not constitute an offer to sell or
the solicitation of an offer to buy any securities of Saratoga Investment Corp.
Forward Looking Statement / Overview
2

3
Basic Premise of the Saratoga Opportunity

Investment Highlights
4
Successfully
retained and
attracted
investment
management and
business
development
talent
Best positioned
company in sector for
future growth with
ample, low cost-of
capital capacity
Outperforming
BDC sector in ROE
and Total Returns
Strong track record of
NAV and high-quality
asset growth since
management’s acquisition
in 2010
Combined 120 Years at Saratoga and team has
tripled in size to 18, with 3 full-time BD members
• ROE of 10.2% LTM
• TTM Total Return – SAR 31% vs. 14% for BDC index
• Total Return since Saratoga took over management –
SAR +322% v +101% BDC Index
• NAV up 61% since FY 2011
• AUM up 16% since year-end, up 324% since FY12
• 97% of loan investments carry highest credit rating
• Thirteen sequential quarterly increases
• Grown dividend by 9% LTM
• Ability to grow assets by 20% without new
external financing
• Existing capital structure fixed rate, long
term
Significant management ownership of 25%
Slides 15-30
Slides 5-9
Slides 31-33
Slides 10-14

5
Outperforming BDC sector in ROE and Total Returns

Outperforming BDC sector in ROE and Total Returns
Since 2010
6.6%
0.9%
7.5%
8.4%
6.6%
9.3% 9.4%9.0%
10.2%9.8%
0.0%
2.0%
4.0%
6.0%
8.0%
10.0%
12.0%
FY 2015 FY 2016 FY 2017 LTM Nov2017
Average 5Years
Return on Equity
BDC Industry Saratoga
LTM Total Return (%)( Dec 2016 to Dec 2017)
SAR +31% v BDC Index +14%
SAR ranked highest in
total return amongst peers
for 2016, followed up by
fourth place in 2017*
6
Source: Raymond James 12/15/17, Index derived from Wells Fargo Index

SAR – Top of BDC Industry in Total Return
BDC Total Return (%)
Past 7 years
since Saratoga
took over: 322%
Last 3 years:
105%
Last 12 months:
31%
7
(100.0%)
0.0%
100.0%
200.0%
300.0%
400.0%
500.0%
MAIN SAR GAIN HTGC CSWC ARCC GBDC NEWT TICC SLRC GLAD KCAP PNNT TCRD PSEC TCAP GSBD BKCC AINV MVC OCSL GECC MFIN OHAI
(100.0%)
(80.0%)
(60.0%)
(40.0%)
(20.0%)
0.0%
20.0%
40.0%
60.0%
80.0%
100.0%
120.0%
SAR GAIN NEWT MAIN SUNS SLRC GLAD CSWC FDUS GSBD GBDC ARCC NMFC PFLT TCPC MVC TICC HTGC PSEC HRZN AINV TCRD BKCC PNNT GSVC GECC OCSL MCC KCAP TCAP SVVC MFIN OHAI
(80.0%)
(60.0%)
(40.0%)
(20.0%)
0.0%
20.0%
40.0%
60.0%

SAR Outperforming the BDC market
8
Source: SNL Financial / Company Filings / Raymond James report as of 12/15/17 / Wells Fargo BDC Scorecard 9/12/17
11.1%
10.9%10.8%
10.0%
10.2%
10.4%
10.6%
10.8%
11.0%
11.2%
SAR BDCMean
BDCMedian
Interest % on Portfolio
110.2%
98.4%
100.0%
92%
94%
96%
98%
100%
102%
104%
106%
108%
110%
112%
SAR BDCMean
BDCMedian
Dividend Coverage (NII/Dividend)
9.6%
9.0% 9.1%
4%
5%
6%
7%
8%
9%
10%
SAR BDCMean
BDCMedian
LTM NII Yield
8.9%
-5.2%
0.0%
-6%
-4%
-2%
0%
2%
4%
6%
8%
10%
SAR BDCMean
BDCMedian
Year-over-Year Dividend Growth
10.2%
8.4%8.7%
0%
2%
4%
6%
8%
10%
12%
SAR BDCMean
BDCMedian
LTM ROE
1.7%
-0.7%
-0.3%
-1%
-1%
0%
1%
1%
2%
2%
SAR BDCMean
BDCMedian
NAV Per Share Growth
4.1%
3.2% 3.1%
0%
1%
2%
3%
4%
5%
SAR BDCMean
BDCMedian
Expense Ratio
20.1%
16.3%
14.0%
0%
5%
10%
15%
20%
25%
SAR BDCMean
BDCMedian
Investment Capacity %

9
SAR Net Interest Margin Continues to Grow
SAR has more than doubled its Net Interest Margin since taking over
management
This increase despite the contribution of the CLO shrinking
148% increase
in 7 years
*Please note that FY18 is a simple annualization of the nine months ended November 30, 2017. Actual FY18 results may differ.

10
Best Positioned Company in Sector for Future
Growth with Ample, Low Cost-of Capital
Capacity

Significant Dry Powder Available
Ability to grow AUM by 20%* without any external financing
11
(As of Aug 31, 2017)
Total
Borrowing Capacity Outstanding Available Liquidity
Maturity
Period
Fixed /
Floating Rate
Secured Revolving
Credit Facility$45.0 million $1.0 million $44.0 million 8 Years Floating
SBA Debentures $150.0 million $134.7 million $15.3 million 6-10 years Fixed
Publicly-Traded Notes
(at fair value)$78.3 million $78.3 million $0.0 million 7 Years Fixed
Cash and Cash Equivalents $8.7 million $0.0 million $8.7 million - -
Total Available Liquidity (at quarter-end): $ 68.0 million

0.18
0.22
0.27
0.33
0.36
0.400.41
0.430.44 0.45
0.46 0.470.48 0.49
0.54
Q22015
Q32015
Q42015
Q12016
Q22016
Q32016
Q42016
Q12017
Q22017
Q32017
Q42017
Q12018
Q22018
Q32018
Dividends Per Share* Adjusted
Average
NII/share
for LTM
ended Q3
FY18
• Established dividend policy to pay regular quarterly cash dividends to stockholders pursuant to dividend reinvestment plan (“DRIP”)
• Increased dividend by 172% since program launch
• Declared Q3 2018 dividend of $0.49, an increase of $0.01 (2%)
• Overearning our dividend currently (10.2% on average LTM NII per share for Q3 FY18)
Dividends Continue to Increase
12
*Excludes special dividend of $0.20 per share paid on September 5, 2016

118.2
%
8.8
%
2.8
%
2.4
%
2.3
%
0.0
%
0.0
%
0.0
%
0.0
%
0.0
%
0.0
%
0.0
%
0.0
%
0.0
%
0.0
%
0.0
%
0.0
%
0.0
%
0.0
%
0.0
%
0.0
%
0.0
%
0.0
%
0.0
%
0.0
%
0.0
%
0.0
%
0.0
%
0.0
%
0.0
%
-13.0
%
-14.3
%
-15.6
%
-17.0
%
-18.7
%
-20.0
%
-20.0
%
-20.6
%
-28.9
%
-30.6
%
-30.6
%
-31.0
%
-35.7
%
-46.7
%
-66.7
%
-100.0%
-50.0%
0.0%
50.0%
100.0%
150.0%
Year-Over-Year Quarterly Dividend Growth at Top of Industry
Industry Mean – -5.2%
Industry Median – 0.0%
Saratoga Growing Dividends Consistently the Past Thirteen Quarters
13
Source: Raymond James report as of 12/15/17

SAR Benefits from Increased Interest Rates
14
Interest
income for
the quarter
ended
11/30/17
+100 bps+$0.6 M$8.9 M
Interest Income Grows with
Higher Interest Rates• 84% of SAR lending at floating rates
• Hypothetical 1% change in interest
rates would result in ~$0.6 million
increase in interest income over the
quarter ($2.4 million per year)
▫ Assumes investments as of 11/30/17
outstanding for full quarter and no
change to existing rate terms

15
Strong Track Record of NAV and High-Quality Asset
Growth since Management’s Acquisition in 2010

$85.8
$96.7
$107.4$113.4
$122.6 $125.2 $127.3
$138.8
$0.0
$20.0
$40.0
$60.0
$80.0
$100.0
$120.0
$140.0
$160.0
FY2011 FY2012 FY2013 FY2014 FY2015 FY2016 FY 2017 Q3 FY 2018
Saratoga’s Book Value (FY2011 – FY2017)
* Source: SNL Financial
BDC Average CAGR: 4.1%
Millions
Strong Track Record of NAV Generated by High-Quality Asset Growth
16
NAV has grown from $86M in 2011 to
$139M or $22.58 per share at Q3 2018

Continued Asset Growth and Solid Credit Quality
17
21.6%
64.3%
82.4%
90.5%
98.3%
98.3%94.1%
96.3%97.3%
97.2%
0%
20%
40%
60%
80%
100%
FY11 FY12 FY13 FY14 FY15 FY16 FY17 Q1FY18
Q2FY18
Q32018
Performing Underperforming Expected loss of Principal
Overall Credit Quality Continues Strong
$80$95
$155
$206
$241
$284 $293
$339
$0
$50
$100
$150
$200
$250
$300
$350
$400
FY11 FY12 FY13 FY14 FY15 FY16 FY17 Q3FY18
Investments at Fair Value ($ million)
Asset Base Expansion Trend
Over 97% of our SAR loan investments hold our
highest internal rating; one on non-accrual at quarter-
end*
Fair value of AUM increased 16% since year-end and 324% since FY12
* Excludes our investment in our CLO, and our equity and written-off legacy
investments.

Demonstrated Exceptional Track Record
12.8%
11.4%12.4%
0%
5%
10%
15%
20%
25%
SBIC Investments BDC Investments* Combined WeightedSBIC and BDCInvestments*
Unrealized Investments 1
(Gross Unlevered IRR%)
17.7%
13.3%
16.3%
0%
2%
4%
6%
8%
10%
12%
14%
16%
18%
20%
SBIC Investments* BDC Investments* Combined WeightedSBIC and BDCInvestments*
Realized Investments(Gross Unlevered IRR%)
1 IRRs for unrealized investments include fair value through 11/30/17 and accrued interest through 11/30/17
* SBIC investments represent all investments in the first license. BDC investments exclude investments existing when Saratoga
management took over, and corporate financing investments.
Track Records as of 11/30/17
$162.7 m
$71.9 m
$234.6m
$262.3m
$81.2m $343.5m
18

Syndicated2.7%
First Lien54.8%
Second Lien
29.3%
Structured Finance
Securities4.8%
Common Equity8.4%
Portfolio Composition – $338.8 m(Based on Fair Values
as of November 30, 2017)
Portfolio Composition and Yield
Portfolio Yield – 11.3%(Weighted Average
Current Yield of Existing Portfolio)
19
Syndicated5.6%
First Lien10.8%
Second Lien
11.9%
Structured Finance
Securities19.4%
Common Equity3.6%

Yield of BDC Remains Strong and Consistent
20
All yields are annualized and calculated
on fair value
Weighted Average Current Yields
13.4% 14.0% 11.8%Annual
Totals11.8% 11.1% 10.8% 11.3%
$0
$50
$100
$150
$200
$250
$300
$350
$400
FY12 FY13 FY14 FY15 FY16 FY17 Q3 FY18
BDC CLO Syndicated
$ M
illi
on
s
11.9%
11.3%
10.6%
20.2%
27.1%18.6%
6.2% 11.1%
25.2%
6.2% 11.0%
16.4%7.6%
11.0%
14.0%5.3% 11.1%
19.4%5.6%

Exercising Disciplined Investment Judgment While Growing Origination Pace
21
Multiples for SAR deals at low end of industry average
Market averages significantly over 5.0%
Market Average Multiples
(Total Debt/EBITDA)
SAR Debt Multiples/Deals Closed (2014-2017)
Total Portfolio Leverage is 4.2x
16 18
*Calendar quarters, not fiscal
Source: S&P Global market Intelligence US:Q4 2017, issuers with EBITDA less than or equal to $50m. The data has limitations due to a small sample size but that it does reflect trend toward increasing leverage
1614
5
1
4 4 4
33
6
32
8
3
8
33
4
4.2x
SAR Deals Closed Weighted Average SAR leverage across portfolio
SA
R
deb
t/E
BIT
DA
Nu
mb
er
of
execu
ted
in
vest
men
ts
4.0x-4.9x 8.3%
<4.0x 8.3%
6.0x-6.9x 33.4%
>7.0x 0.0%
83%
4.0x-4.9x 10.0%
<4.0x 0.0%
6.0x-6.9x 60.0%
>7.0x 0.0%
90%
June 30, 2017*September 30, 2017*
5.0x-5.9x 50.0% 5.0x-5.9x 30.0%

SBIC Portfolio Primarily Senior Debt
22
• SBIC portfolio consists of 22 investments
across a range of industries. Compared to
the broader loan market tracked by S&P and
Thomson Reuters, SAR’s leverage levels are
lower.
• The weighted average leverage for all SBIC
debt investments is 4.28x1.
▫ 55.4% of the SBIC portfolio consists of
senior debt investments, down from 55.6% in
August 2017
▫ 40.6% of the SBIC portfolio consists of first
lien, last out or second lien/subordinated debt
investments, almost unchanged from 40.3% in
August 2017
1Excludes two loans underwritten using recurring revenue metrics2Based on market value as of November 30, 2017
55.4%40.6%
4.1%
Composition of SBIC Portfolio 2
Senior Debt
First Lien Last Out/Second Lien/Subordinated Debt
Equity/Warrants

SBIC Assets Continue to Grow
23
SBIC first license provided $171m, $143m, $105m,
$51m, $42m and $22m of available capacity in FY13,
FY14, FY15, FY16, FY17 and Q3 FY18, respectively
(debt and equity at 2:1 leverage).
SBIC represented 34%, 42%, 56%,
71%, 76% and 63% of total assets in
FY13, FY14, FY15, FY16, FY17 and
Q3 FY18, respectively.
* At Fair Value as of November 30, 2017
$0.0 $52.6
$86.5
$135.8
$200.6$221.5 $212.7
$171.0
$143.0
$104.9
$50.9
$41.8
$22.4
$0
$50
$100
$150
$200
$250
$300
FY12 FY13 FY14 FY15 FY16 FY17 Q3FY18
$ M
illi
on
s
34% 42% 56% 76%71% 63%

Diversified Across Geography
24
Southeast
Midwest
Northeast
Southwest
West
Other
Northwest
Investments diversified geographically

Investments Across 9 Distinct Industries
25
Business Services
Consumer Services
Healthcare Services
Media
Structured Finance
Securities
Building Products
Metals
Consumer Products
Food and Beverage
Education
Building Products Business Services
Consumer Products
Consumer Services
Education
Food and Beverage
Healthcare Services
Media Metal
Structured Finance Securities

Target
Gross
Yield
Investment Size
(in $ million)
15%
10%
5%
10 20 30 40 50 100
Private
SBICs
Traditional Banks
SAR occupies a very advantageous niche in the market
Non-Bank Finance Companies
Lower Middle Market Stretch
Senior Lenders
CLO’s
Large BDCs, Mezz Funds and Insurance Companies
SAR and
other
small
BDCs
w/ SBIC
Saratoga Has Very Favorable Competitive Positioning
26

Saratoga Business
Development
Increase Relationships
& Brand Awareness
Manage an Efficient Deal Sourcing &
Review Process
Provide an Exceptional Customer
Experience
Business Development Philosophy
The main goal of business
development is to increase the
number and quality of actionable
investment opportunities
Saratoga’s business development
strategy relies on constant focus and
improvement
Partnership reputation builds
growing base of referral
sources
Efficiency creates a leveraged
business model that improves
opportunities to close deals
27

Business Development Activities
Saratoga closely monitors its business development activities and over the last 12 months we have
completed almost 1,500 activities including:• Over 400 in person meetings
• Over 550 deal referrals to sponsors and other lenders
• Manage communications with over 2,100 firms and over 6,000 contacts
We remain active participants on the conference and networking scene:• Attended about 70 conferences and events in FY 2017
• Hosted 12 formal events including golf, dinners, and speaking panels
Active members of several industry groups• SBIA (Steenkamp and Burkhart active board members across various committees)
• ACG (Burkhart active member of NY chapter)
• Other groups – Opus Connect, Axial, GLG
28

Calendar 2014 ∆ 2015 ∆ 2016 ∆ 2017
Deals Sourced 480 28% 613 5% 645 12% 722
• 50% of deal flow from private equity sponsors
• 50% of deals from private companies without
institutional ownership
Term Sheets 48 40% 67 (28%) 48 2% 49
• Saratoga issues an average of 13 term sheets per quarter
• ~ 80% of term sheets are issued for transactions
involving a private equity sponsor
• Decrease from 2015 reflects inconsistent current quality
Deals Executed
(new and follow-
on)
14 14% 16 - 16 13% 18
• Saratoga closes an average of 4 new deals or follow-ons per
quarter, ~2% of deals reviewed
• Approximately 40% were follow-ons the past year
• One new portfolio company in the past quarter and seven
in the LTM period
Robust Pipeline During Tough Market
29
Despite a difficult market to close deals, the number of new business opportunities is increasing for us, yet we remain as disciplined as ever.
*Calendar quarters, not fiscal quarters

Tier 1 Sponsor Relationships Increased from 8 to 100 in Four Years –Helps Drive Strong Originations and Pipeline
• Investments in business
development expanding our
relationship base
• Second full-time business
development professional added
in 2015 and third in 2017
• Growing reputation in
marketplace
8.0
24.0
38.0
85.0
100.0
0
20
40
60
80
100
120
2012 2013 2014 2015 2016
Tier 1 Sponsor Relationships
30

31
Successfully Retained and Attracted Investment
Management and Business Development Talent
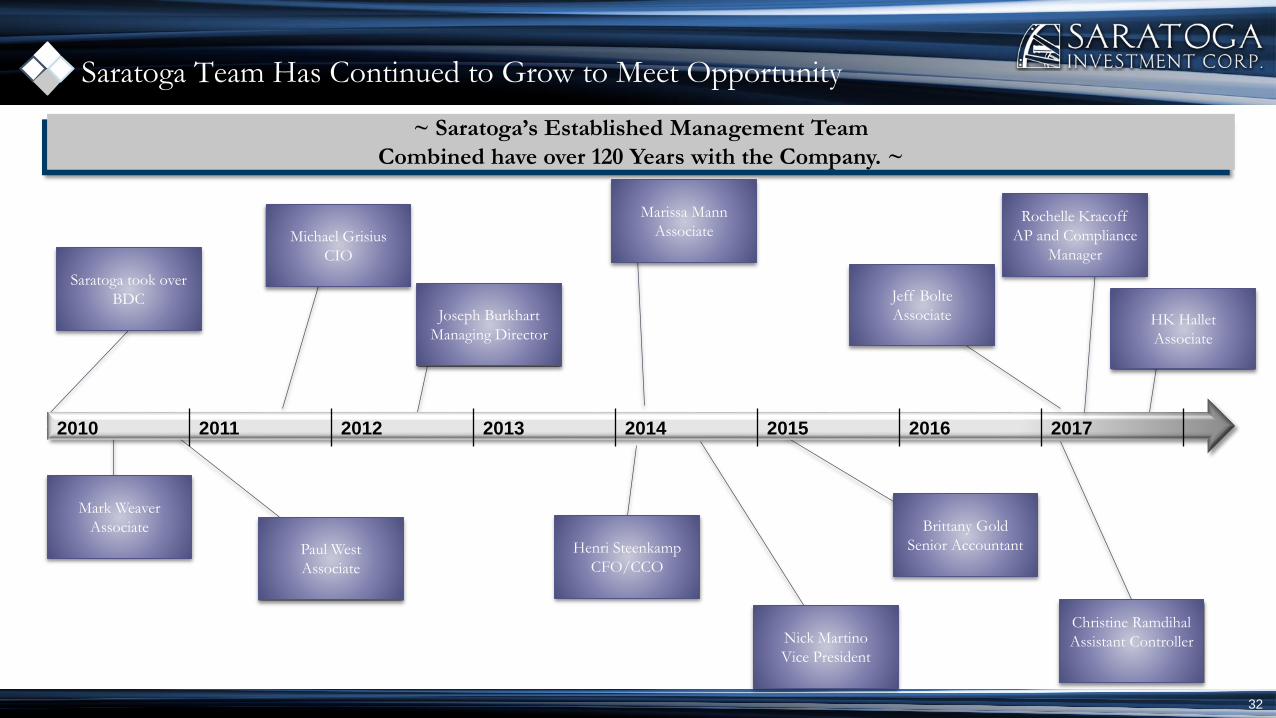
Saratoga Team Has Continued to Grow to Meet Opportunity
32
~ Saratoga’s Established Management Team
Combined have over 120 Years with the Company. ~
Brittany Gold
Senior Accountant
Jeff Bolte
Associate
Marissa Mann
Associate
Joseph Burkhart
Managing Director
Michael Grisius
CIO
Mark Weaver
Associate
Saratoga took over
BDC
Christine Ramdihal
Assistant Controller
Paul West
Associate
Henri Steenkamp
CFO/CCO
Nick Martino
Vice President
2010 2011 2012 2013 2014 2015 2016 2017
Rochelle Kracoff
AP and Compliance
Manager
HK Hallet
Associate

Professional Team Tenure at Saratoga Background
Christian Oberbeck, CEO 22 years BS/BA - Brown University, MBA -
Columbia University, Dillon Read, Castle Harlan
Michael Grisius, President and CIO 7 years at firm BS - Georgetown University, MBA - Cornell
16 years at prior firm University, Allied Capital, Chemical Bank, KPMG
Henri Steenkamp, CFO, CCO, Treasurer and 4 years, 15 years prior capital markets and Honors in Finance, Cum Laude – University of Johannesburg, CA(SA), PwC
Secretary controls experience
Charles Phillips, MD 19 years AB - Harvard College, MBA - Harvard Business School, Dillon Read, McCown De
Leeuw
Joe Burkhart, MD Business Development 6 years BBA – Notre Dame, MBA – Virginia, Allied, ACAS
Thomas Inglesby, MD 7 years (9 years including BS - University of Maryland, JD/MBA - Virginia
GSC),15 years at prior firm GSC Group, Harbour Group
John MacMurray, MD 11 years AB - Princeton University, MBA – Columbia, EuroConsult
Nick Martino, Vice President 3 years BA – Bucknell University, Prospect, Credit Suisse
Mark Weaver, CFA, Vice President 7 years BSBA - University of North Carolina, Chapel Hill
MS - University of Cambridge, GSC
Paul West, Vice President 7 years BSBA - University of North Carolina, Chapel Hill
Marissa Mann, Senior Associate 4 years BS – Washington and Lee University, JP Morgan
Jeff Bolte, Associate 9 months BS – Fordham, CIT
HK Hallet, Associate 6 months BSBA – University of North Carolina, Chapel Hill, Piper Jaffrey
Christine Ramdihal, Assistant Controller 1 year BA Accounting and Economics – Queens College, Cbiz, BDO, Marsh, Augentius, CPA
Jeannette Hill, Controller 9 months BBA – Pace, CPA, Pepsico, Xylem, Shake Shack
Brittany Gold, Senior Accountant 3 years BS - Florida State, MS – University South FL
Rochelle Kracoff, Compliance and AP Manager 1 year BS –Brooklyn College, Abrams, Cohen and Associates, Visium
Petal Valme 16 years
Introductions: Best in Class Team
33

34
Conclusion

Growth Objectives
Expand our asset base without sacrificing credit quality while benefitting from scale
Increase our capacity to source, analyze, close and manage our investments by adding to our
management team and processes
Utilize benefits of fully deploying available financing to build scale and increase our AUM and net
investment income/yield, enabling us to achieve growth in:
Net Asset Value
Return on Equity
Earnings per Share
Stock Values
35

Conclusion: Defined Growth Strategy and Unique Niche Focus
Saratoga is outperforming the BDC industry and there
is a valuation gap opportunity for investors.
Best-in-Class Team
Outperforming BDC
sector in Total ReturnTotal Return of 31% LTM vs. 14% for BDC industry
Management Ownership
25%
Exceptional Track Record of NAV and
High-Quality Asset Growth
Since Management’s Acquisition in 2010
Fair value of assets under management tripled since
FY 2011
Significant Available
LiquidityExisting available
liquidity allow SAR to increase current AUM by
20%
Capital structure ~Fixed rate and long-term
Remaining
Room for GrowthOverearning dividend by
10.2%
Available capacity to grow will be accretive to NII
36

Appendix:Saratoga: Basics from Inception
Investment ProcessLong-term Market Dynamics
Case Studies
37

Saratoga Investment Advisors, LLC (“SIA” or the “Fund Manager”)
Fund Manager since July 2010 after Saratoga Partners recapitalized the Fund
Grown Fund from $80M assets under management (“AUM”) in 2010 to $339M at Q3 2018 (November 30th quarter end) (excluding CLO assets)
Successfully retained and attracted investment management talent – more than tripled from 6 to 18 with four new hires this year
Top performing SBIC on first license in 2012
• Realized unlevered IRR of 17.7%; Total unrealized unleveraged IRR of 12.8%
Successfully manages CLO with approx. $300M AUM
Grown Net Asset Value (“NAV”) from $71M in 2010 to $139M today
Total Stockholder Return (including dividends) consistently outperforms the BDC Industry average
• One Year: SAR +31% v +14% BDC Index
• Three Year: SAR +105% v +30% BDC Index
• Six Year (Since Saratoga took over management): SAR +322% v +101% BDC Index
Note: Standard Management Agreements –
• Base Management Fee of 1.75%, plus 20% incentive fee on Net Investment Income (“NII”) exceeding 7.5% and 20% on “incentive fee capital gains”
• Administrative agreement pays a capped $1.75M/year
• Source: SNL Financial at Fiscal 2017 Year End unless otherwise noted
Saratoga: The Basics From Inception to Today
38

Key Annual Performance Metrics
39
For the year ended
and as of($ in millions except per share)
Feb 28, 2015 Feb 29, 2016 Feb 28, 2017
Net investment income $9,674 $10,678 $9,661
Adjusted net investment income* $9,978 $10,633 $11,518
Net investment income per share $1.80 $1.91 $1.68
Adjusted net investment income per share* $1.85 $1.90 $2.01
Net investment income yield 8.2% 8.6% 7.6%
Adjusted net investment income yield* 8.5% 8.6% 9.1%
Return on Equity – Last Twelve Months 9.3% 9.4% 9.0%
Fair value of investment portfolio $240.5 $284.0 $292.7
Total net assets $122.6 $125.1 $127.3
Investments in new/existing portfolio companies $104.9 $109.2 $126.9
Loan Investments held in “strong” credit ratings 94.2% 98.3% 94.1%
*Adjusted for accrued capital gains incentive fee expense, and interest during call period and loss on extinguishment of existing baby bonds debt,
reconciliation to GAAP net investment income included in our fiscal fourth quarter 2017 earnings release.

Focused on middle market companies in the United States
Investment Approach: How We’ve Focused
$5 Million to $20 Million Investments in:
Leveraged & Management Buyouts
Acquisition Financings
Recapitalizations Growth Financings
Transitional Financings
Qualitative Parameters Financial Parameters
• Leading market position
• Exceptional management with meaningful stake
• Growth prospects in healthy end markets
• Ability to withstand industry cycles
• Revenues of $10 - $150 million
• EBITDA of $2M or above
• Strong margins and free cash flow
• Recurring revenues and stable historical performance
• Modest capital expenditures
Diverse Investment Strategy: No potential write-downs as a result of exposure to energy inv.
Link: Detailed consolidated schedule of investments updated each quarter
40

Investment Process
Debt: investment size $5-20MM
Equity co-investment: size $0.5-3MM
Typical coupon: 9%-14%
Average maturity of 5 years
Conservative capital structure
Unitranche target IRR: 9%-14%
Mezzanine target IRR: 11%-15%
Equity target IRR: >25%
Use of proceeds - acquisitions, MBOs, LBOs, recaps and growth strategies (no turnaround situations)
Later stage, small and middle market companies ($10-150MM in revenue, $2+MM in EBITDA)
Strong margins and free cash flow
Exceptional management team with a meaningful stake in the business
Leading market position or niche with sustainable
competitive advantages
Recurring or repeatable revenue with loyal customers and
attractive margins
Modest capital expenditures and working capital
requirements
Established, well defined industries with solid growth characteristics in healthy end markets
Business services, light manufacturing, franchise businesses, consumer and healthcare services industries
High barriers to entry
No high R&D, early stage technology, or pure commodity industries
Ability to withstand business cycles
Types of Deals
Company
Characteristics
Industry Profile
41

Investment Selection and Portfolio Management Process
Summary Analysis
and Deal Write-up
Read CIM
Evaluate
preliminary data
Sometimes meet
management
Propose Terms
and Structure
Identify and
Communicate
Key Diligence
Items
Conduct Due
Diligence
Meet management
and visit company
Comprehensive
analysis of key
aspects of business
Prepare internal
models
Third part quality
of earnings report
Third party
consultants
Industry experts
Customer calls
Final Due
Diligence and
Documentation
Finalize legal
documents and
deal structure
Negotiate
covenants
Third party
background
checks
Complete all
outstanding
diligence
Ongoing
Monitoring
Frequent
interaction with
ownership and
management
Board
observation
rights
Monthly and
Quarterly
reporting
Quarterly
valuation
Annual third
party valuation
Initial
Investment
Summary
Due
Diligence
Investment
Committee
Final Due
Diligence
Final Committee
Approval
Partners’
Meeting
Funding
42

Consistent Decline in Small Business Bank Lending
Due to Consolidation and Regulation
• Banks historically the main source of loans for small businesses
• Consistent decline in number of banks due to consolidation; larger
banks focus on larger companies
• Increased regulation has made it more onerous for remaining banks
to make small business loans
Number of Companies in the U.S.
by Revenue2
Large Market of Small Businesses Underserved by
Traditional Asset Managers
• Over 175,000 companies in small business target market –businesses
with between $10mm and $150mm in revenues
• Small businesses represent nearly 90% of all businesses
• Large asset managers not focused on small businesses
• Less than 8% of private capital is focused on small businesses
176,850
20,605
Revenues $10mm to $100mm Revenues >$100mm
Number of Commercial Banks in
the U.S.1
(1) Federal Financial Institutions Examination Council (US) -Commercial Banks in the U.S.
(2) U.S. Census, Dunn & Bradstreet. Businesses with between $10 million and $100 million of annual revenue represents a large segment of Star Mountain target marketplace.
Powerful Secular Trends Banks continue to shift toward large borrowers
Regulatory environment is a headwind for banks in the middle-market
Long-Term Market Dynamics Are Positive
43

Proposed Regulation Key Dates Detail Effects on BanksEffect on
BDCs
Basel III Phase-in 2015-2019New capital requirements require banks to reserve more equity capital against leveraged loans, with
higher risk weightings against non-investment grade securities x
FDIC Guidance on
Leveraged LoansGuidance effective May 2013
Establishes minimum lending standards, changes in “criticized loans” (loans levered >6x)make
underwriting higher leverage transactions (i.e. LBOs) more difficult for the largest banks, “no exceptions
policy” on new issuancex
SIFI1 OngoingAn objective of Dodd-Frank, SIFI regulation requires the enhanced monitoring of systemic risk and
supervision of systemically important financial institutions (SIFIs) x
Volcker RuleFinalized Dec. 2013 Implement
July 2017Limits ability of banks to own or sponsor hedge funds or private equity funds x
Risk Retention Rules passed October 2014 CLO sponsors required to retain a 5% interest in the CLO on their own balance sheet
S. 2136 Rule passed December 2015Recently passed law that would allow SBICs to access $350 million of SBA debentures, up from $225
million
H.R. 1800 OngoingProposed law that would raise allowable BDC leverage to 2:1 debt / equity and allow preferred equity to
count as equity
Market Dynamics – Regulatory Changes Benefit BDCs
Proposed Regulatory Changes
• BDCs poised to fill void left by banks
Source: Wall Street equity research (May 2013).
(1) SIFI regulation can be viewed as having a negative impact on insurance companies. AIG and Prudential Financial have been designated SIFIs by the Financial Stability Oversight Council (FSOC) and MetLife is in “Stage 3,”
the final stage of review before being designated a SIFI
44

Investment Case Study
Investment Thesis
• Strong Value Proposition
Customers avoid a large upfront equipment purchase, receive repair and regular maintenance at no extra charge, tad emergency ice delivery n the event of machine downtime.
• Subscription-based Recurring Revenue Model
Cash flow supported by over 8,000 monthly subscriptions (installed machines) spanning locations in over 35 states.
• Highly Diversified Customer Base
Largest customer represented less than 0.5% of revenues; over 95% of Easy Ice’s customers reflected single-unit subscribers.
• Strong Operating Leverage
Monthly recurring revenue business model has few fixed costs beyond the core operating management and sales/call center.
Investment
• In March 2013, Dec 2014, February 2015, and February 2017 Saratoga provided financing to support the recapitalization of the business and to support installed ice machine growth.
• Initial $7.5M of senior debt has grown to over $20m in debt and equity over the course of investment to support growth via additional fleet purchases.
• In February 2017, Saratoga led a recapitalization in conjunction with management that resulted in Saratoga owning approximately 40% of the company.
• Easy Ice continues to grow its footprint of installed machines.
Investment Summary
• Revenue and EBITDA more than tripled over our investment period.
• As installed base of machines has grown, revenue visibility and operating leverage has improved.
• Attractive subscription model continues to improve, experiencing lower churn rates as customers are more “seasoned.”
Provider of ice machine service contracts to small businesses.
45
Point of care media company in over 12,000 medical offices
and healthcare facilities
Investment Thesis
• Value Proposition
HMN provides advertisers access to an engaged, captive audience of highly targeted customers at the point of care.
HMN offers a strong, measurable ROI for its customers.
• Blue Chip Customer Base
HMN’s customers include many of the world’s largest and most sophisticated pharmaceutical companies, including Pfizer and Bayer, and advertising agencies, including Carat, FCB Health and Target Health, which have endorsed HMN's platform by using it to advertise key drugs in their portfolios.
• Attractive Unit Economics and Margins
HMN’s assets offer very quick payback (less than one year)
Highly leverageable business model with strong incremental revenue flow through to EBITDA.
Modest maintenance capex leads to high FCF.

Contacts
46
Board of Directors Senior Management Research Coverage
Independent:
Steven M. Looney
Charles S. Whitman III
G. Cabell Williams
Christian L. Oberbeck
Director (Chairman), Chief Executive
Officer
Michael J. Grisius
President
Henri J. Steenkamp
Chief Financial Officer, Chief
Compliance Officer, Treasurer, Secretary
Compass Point
Casey Alexander
Maxim Group
Michael Diana
Ladenburg Thalmann
Mickey Schleien
Janney
Mitchel Penn
Interested:
Christian Oberbeck (Chairman)
Michael Grisius
National Securities Corporation
Chris Testa
Security Listing Investor Relations
Common Stock:
NYSE: SAR
Adam Prior, Senior Vice President
The Equity Group Inc.
(212) 836-9606
[email protected] Year End
February 28th
Transfer Agent Independent Audit Firm
Broadridge, 51 Mercedes Way,
Edgewood, NY 11717
Ernst & Young LLP
Corporate Headquarters
535 Madison Ave, 4th floor
New York, NY 10022