SAP Lumira Data Visualization Handbook · default, SAP Lumira sets this type to sum. For example,...
39
Data Visualization Handbook www.saplumira.com SAP Lumira
Transcript of SAP Lumira Data Visualization Handbook · default, SAP Lumira sets this type to sum. For example,...

1
Data Visualization Handbookwww.saplumira.com
SAP Lumira

2
Table of Content
IntroductionKnow Your PurposeKnow Your DataCrafting Your MessageVisual PerceptionSelecting the Right Visualization TypeChange over TimeComparison
RankingPart-to-WholeDistributionCorrelationData OverviewGeographical InformationOther Chart TypesGet Started Today
3459
10121417
2023252931333739

3
You are the mastermind behind your data, and you possess the power to tell meaningful stories through compelling data visualizations (data viz’s). The first step is identifying the message you want to deliver. What do you want your audience to take away?
IntroductionIn order to produce a strong narrative, you must ask the right questions of your data. Highlight trends using the best representation of formatted charts and stories in SAP Lumira to uncover the answers you need and communicate a clear message to your audience.
This document shows you how to discover the story hidden within your data by guiding you through best practices in data visualization. Learn how to efficiently approach your data, utilize elements within data storytelling and decide which visualization best represents your takeaway message.

4
Now that you’ve laid a solid foundation for your story and identified its purpose, it is important to model your data appropriately in order to be able to answer your business questions correctly. Data types can be used to model certain characteristics of your data. Before you can begin to create stunning visualizations, you will need to make sense of your data by finding the story that speaks to your audience.
You want to help your audience understand your story, the message you are trying to convey, and the data supporting your message. To explore this area further, you may want to look into trends, correlations, and outliers that can be brought to light for your audience. At the same time, it is important to know the context of your audience and what their expectations are.
This is integral in building the foundation of your message and connecting with your audience.
Know Your Purpose
Finding the story that speaks to your audience“ “

5
Crafting your message is crucial to clearly convey the purpose of your story. Before exploring your data, it is important to model your data appropriately in order to be able to answer your business questions correctly. Data types can be used to model certain characteristics of your data.
SAP Lumira supports measures (numerical data), and several types of dimensions (categorical data).
Know Your Data

6
Measures constitute numerical data that are calculated upon or aggregated – such as sum of Revenue, average Cost, or Profit-per-capita – or non-numeric data that are counted.
In general, measures are objects that represent calculations and aggregate functions that are usually applied to numeric data. Aggregating the object must make sense for the column to be a measure.
For example, summing up Sales Revenue makes sense, so Sales Revenue is a measure. Summing up Product List Price is not necessarily useful, so Product List Price is a dimension. You can create measures from categories by counting their elements, for example, Number of Countries visited by our Customers.
Know Your Data - MeasuresWhat do Measures represent?Measures can represent observations in your data or calculated values.
How are they formatted?Measures have an aggregation type associated with them. By default, SAP Lumira sets this type to sum. For example, if the chart includes Revenue by Country, and sum is associated with Revenue, SAP Lumira will show the overall Revenue (sum) for each Country. SAP Lumira allows you to customize the number formatting of measure values, and add a custom prefix or suffix to indicate, for example, units of measures, such as CAD, EUR, and USD.

7
Dimensions constitute categorical data such as: Year, Product, Country, and Salary Range.
What do they represent?
Dimensions can also be organized as hierarchies.
Know Your Data - Dimensions
(also called “nominal”) for discrete values
The dimension members have a set default order
Each value in the dimension represents a range of values
CATEGORICAL ORDINAL INTERVAL
Example: The dimension Product Type may include the values Women’s Clothing and Men’s Clothing.
Example: A dimension reflecting the outcome of a survey result may include the values Agree, Neutral, Disagree that have an implicit order.
Example: The dimension Salary can be categorized into the following salary ranges: <$20k, $20k - $40k, $40k - $80k, >$80k.
8
Know Your Data - HierarchiesA hierarchy models a relationship of related entities on various levels of granularity, for example, Country and City. When used in a chart, hierarchies can be drilled up or down by the user to reveal more or less detailed information.
SAP Lumira supports three types of hierarchies: geographic hierarchies, custom hierarchies, and time hierarchies.
Geographic Hierarchies: Rely on an internal SAP Lumira geographical database to enrich your geographical data on four levels of granularity:
Country Sub-regionRegion City
Custom Hierarchies:Can be defined over dimensions. For example, a Product dimension might be in a hierarchical relationship to a Product Group dimension.
Time Hierarchies:Dates and times have their own data type called Date/Time Hierarchy that allows SAP Lumira to visualize charts in the most suitable way. A Date/Time Hierarchy enriches your data by separating out the time periods:
••
••
Year Quarter Month Week Day
Hour Minute Second

9
Crafting Your MessageHow can you incorporate a summary of yourmessage in your chart titles to emphasize on your overall message?
Think about the story you want to tell with your data. What insights do you want to bring to light. Keeping your audience in mind, you do not want to include any unnecessary noise to obscure the meaning of your message. It is easy to misrepresent data by choosing the wrong visualization type.
Every little detail matters in the telling of your story and connecting with your audience.
After you have explored your data, you will have a better sense of what you want to tell your audience. Now it is time to craft your message and see which viz best articulates your information.
Keep these questions in mind:
What is your overall goal of your data analysis?Who is this message intended for? What do you know aboutyour audience?
Then ask yourself:
What questions do you want to answer with your data? What kind of relationships exist in your data? What are the best techniques for displaying these? Do you need a chart(overview), a table (details), or maybe both, to convey your message?Can you highlight specific datapoints to better get yourmessage across?
It is important to know youraudience’s background andthe domain of your data.
“ “1.2.
1.2.
3.
4.

10
People are more inclined to perceive certain visual cues (variables) better than other cues.
VISUAL PERCEPTION
MORE ACCURATE LESS ACCURATE
POSITION LENGTH ANGLE DIRECTION AREA VOLUME SATURATION HUE

11
VISUAL PERCEPTIONMost quantitative analysis can be performed with charts that use only four kinds of objects. These objects (and their subsequent related charts) work because we immediately and more precisely perceive both position and length.
Points: Example:Scatter Plot
2D position
Lines: Example:Line Chart
2D position
Bars/Columns:
Example:Bar Chart
2D position+ length
Boxes:
(but unlike bars, show distribution of an entire set of values),
Example:Box Plot
2D and length
Some visual cues (for example, position, length, direction) are better at supporting:
Selection or GroupingDo changes in the visual cue allow you to distinguish a point from others?Do changes in the cue allow you to group datapoints?
Ordering Does the visual cue have a perceived order?
Steps How many distinct “steps” can be perceived in the cue?
Measurement Can you make a numeric observation from a change?

12
SELECTING THE RIGHTCHART TYPE
How to select the right chart type based on the goal of your message.

13
CHANGE OVER TIME
PART-TO-WHOLE
Shows how a measure changes over time, and allows the user to highlight temporal trends
Shows how the categories contribute to the whole value
Line Chart: highlights potential trends in data
Bar Chart: set to % scale
Bar Chart: highlights comparison between individual values
Stacked Bar Chart: shows overall measure total
COMPARISON
DISTRIBUTION
Shows the comparison of categorical values, where the data does not have any intrinsic order, for example, a list of products
Shows how a measure is spread across its domain
Bar Chart: used for comparing categorical values
Histogram: Column Chart showing the count of binned measure values
Trellis: uses multiple views to show different partitions of a dataset
Scatter Plot: shows distribution and correlations of two measures
RANKING
CORRELATION
Shows the top or bottom N values to emphasize the largest, or smallest values
Shows, whether there is a potential correlation between two measures
OVERVIEWShows the exact values in table format
Table: highlights exact values
GEOGRAPHICAL INFORMATION AND MAPS
Shows the geographical distribution of measure values
Goal Description Suggested Chart in SAP Lumira
Bar Chart: shows categorical values in decreasing or increasing order
Pie Chart: Compares percentage values
Box Plot: shows distributions for different categorical values
Trellis: shows potential correlation among multiple measures
Scatter Plot: hightlights potentional correlation of two measures
Geo Bubble Chart: highlights geographical data by showing them as bubbles on a map
Choropleth Chart: highlights geographical data by colouring geographical areas according to their measure values

14
Focus Area: Line and Area Chart and Column Line Chart
CHANGE OVER TIME
15
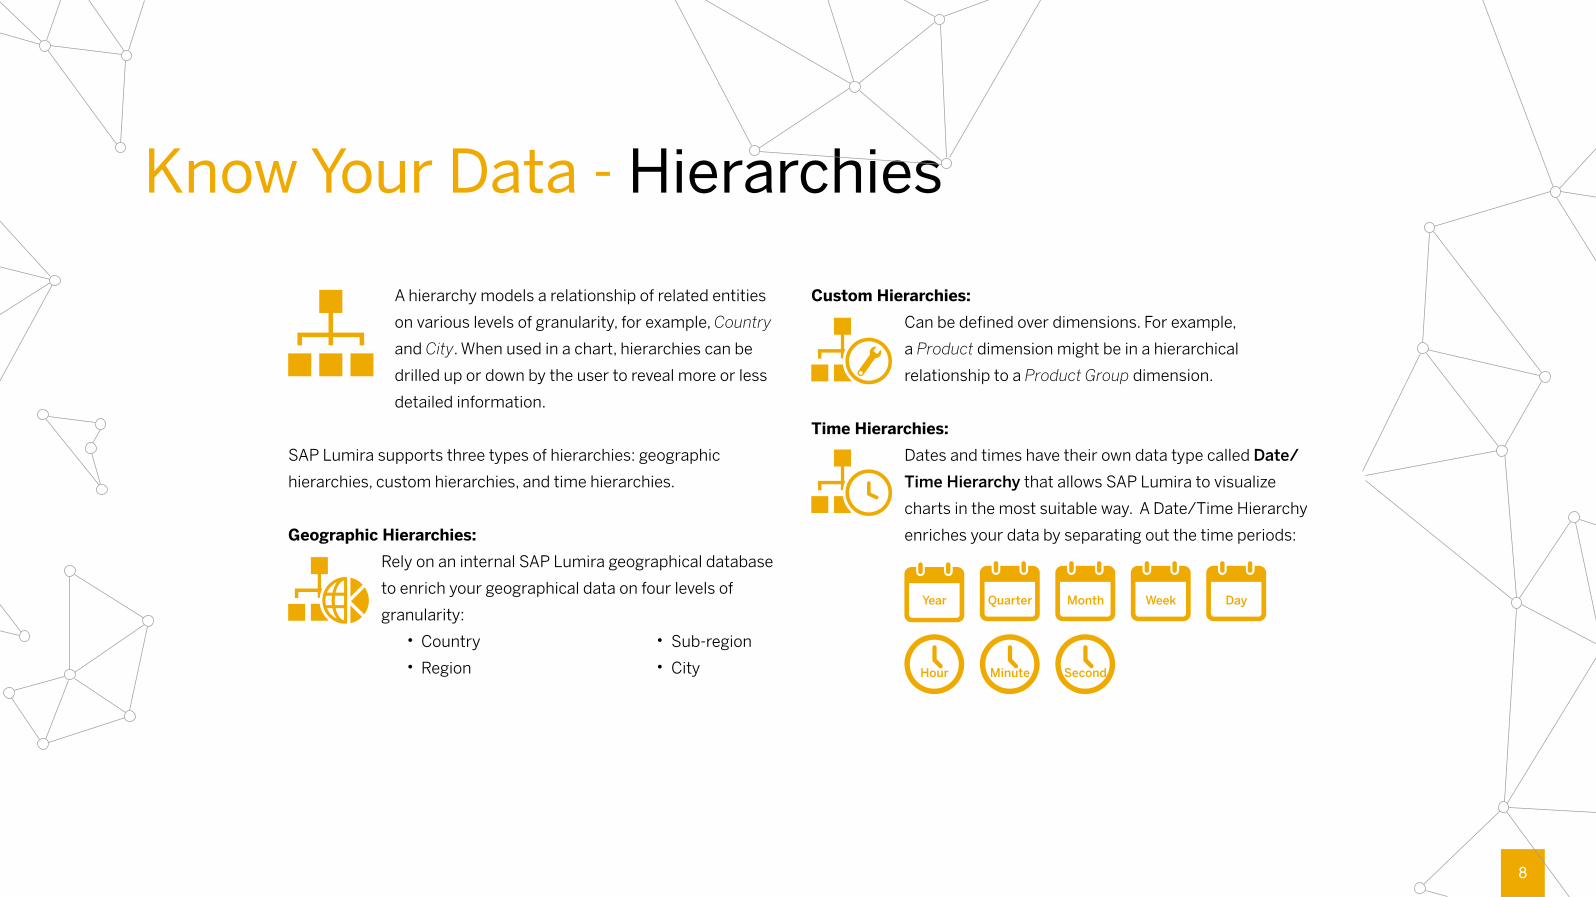
Line and Area ChartThe Line Chart displays measures over a time period. Line Charts are used frequently to show trends and relationships between them. The Y-Axis always shows a measure value, and the X-Axis denotes a time dimension such as Month, Quarter, or Year.
Used for: Trends, data over time, temporal patterns and correlation, period-over-period
••••
Suggestions:Create a time hierarchy to allow drilling up or down to Days, Months, and Years Add a moving average line to smooth the trend over timeAdd a forecast or linear regression to emphasize current or future trendsConsider an Area Chart for showing cumulative totals
Figure 1: Line Charts are often used to show trends in historical data. Figure 2: This Area Chart shows the same information as Figure 1, but organized by Product Lines.

16
Column Line ChartThe Column Line Chart is a combination of a Line Chart and Column Chart. This chart type displays one measure as a column and a secondary measure as a line. The two measures are displayed over a Time Dimension which may include Years, Quarters, or Months. This chart is great for showing the relationship between two measures over a period of time such as Gross Margin and Sales Revenue, or Net Income after Tax and Tax Rates.
Used for: Trends, data over time, temporal patterns and correlation
Suggestions:Use this chart type to show two trends of different types (for example, Returning Customers and Sold Items) over time
•
Figure 3: Line and Column charts are often used to depict two different measures.
Other options for showing change over time include Bar Charts or Tables.
Tip

17
Focus Area: Bar Chart and Stacked Bar Chart, Trellis Layout of Multiple Charts
COMPARISON

18
Bar Chart and Stacked Bar ChartBar Charts are probably the most frequently used chart type. Used for: Comparing different categorical values Suggestions:
Use data labels, such as in Figure 5, to improve the readability of data valuesCustomize hierarchies to allow drilling from a high-level overview to more specific details; users easily drill up and downUse Color to clearly differentiate separate categorical values in your dimension
•••
Focus the attention of your audience to important details by:Ranking data from largest to smallest or vice versaFiltering out data that isn’t important for your messageGrouping data by combining values in a chart - if there are too many categories, you can group less relevant categorical values together into an Other group (for example, “Other Clothing”)
••
•
•
Figure 4: Bar Charts are often used to compare categorical values. Figure 5: Stacked Bar charts break down the bars into various categorical values.
Figure 6: A Bar Chart that includes a Product Group and Product Type hierarchy

19
Trellis Layout of Multiple ChartsThe Trellis Layout, also known as Small Multiples, contains a set of charts based on the same set of data using the same axes to allow the viewer categorical comparisons of different values within a dimension. Most chart types in SAP Lumira support the Trellis layout.
Used for: Comparison, identifying patterns across multiple categorical values
Suggestions:Used to compare values within a category (such as Trellis by Milk Type to show the Sales Values for each Milk Type in a separate chart).
•
Figure 7: Trellis Layout allows for the comparison of different values within a dimension.

20
Focus Area: Ranking
Ranking

21
RANKINGThe Ranking feature in SAP Lumira allows the user to sort and filter data based on their importance. For example, we may want to sort Countries based on their Number of Participants. The Group by Selection functionality in the Prepare Room can be used in order to group values in SAP Lumira,
Used for: emphasizing on top or bottom values in a chart
Suggestions:Often categorical values (in this case Countries) that contribute less to the overall measure value might be filtered out or grouped together in an Other category.
Figure 8: Ranking of measure values highlights the categorical values that contribute most.
•

22
Focus Area: Part-to-Whole, Pie, Ring, and Funnel Charts
PART-TO-WHOLE

23
Part-to-WholeUsed for: A Part-to-Whole relationship shows how measure values that make up the whole of something (for example, Number of containers sold) compare to one another and how they each compare to the whole.
Suggestions:You can use stacked or side-by-side bars to compare different hierarchy levels (Country -> Region) or classifications (Men’s Clothing, Women’s Clothing). You can use a 100% Stacked Bar Chart (or Marimekko Chart) to show the portion that each segment makes up in a category.
In addition to Stacked Bar Charts and Marimekko Charts, other charts (such as pie, ring, and funnel charts) can be used to show Part-to-Whole relationships.
•
•
Figure 9: The 100% Stacked Bar Chart shows a breakdown of each categorical value.
24
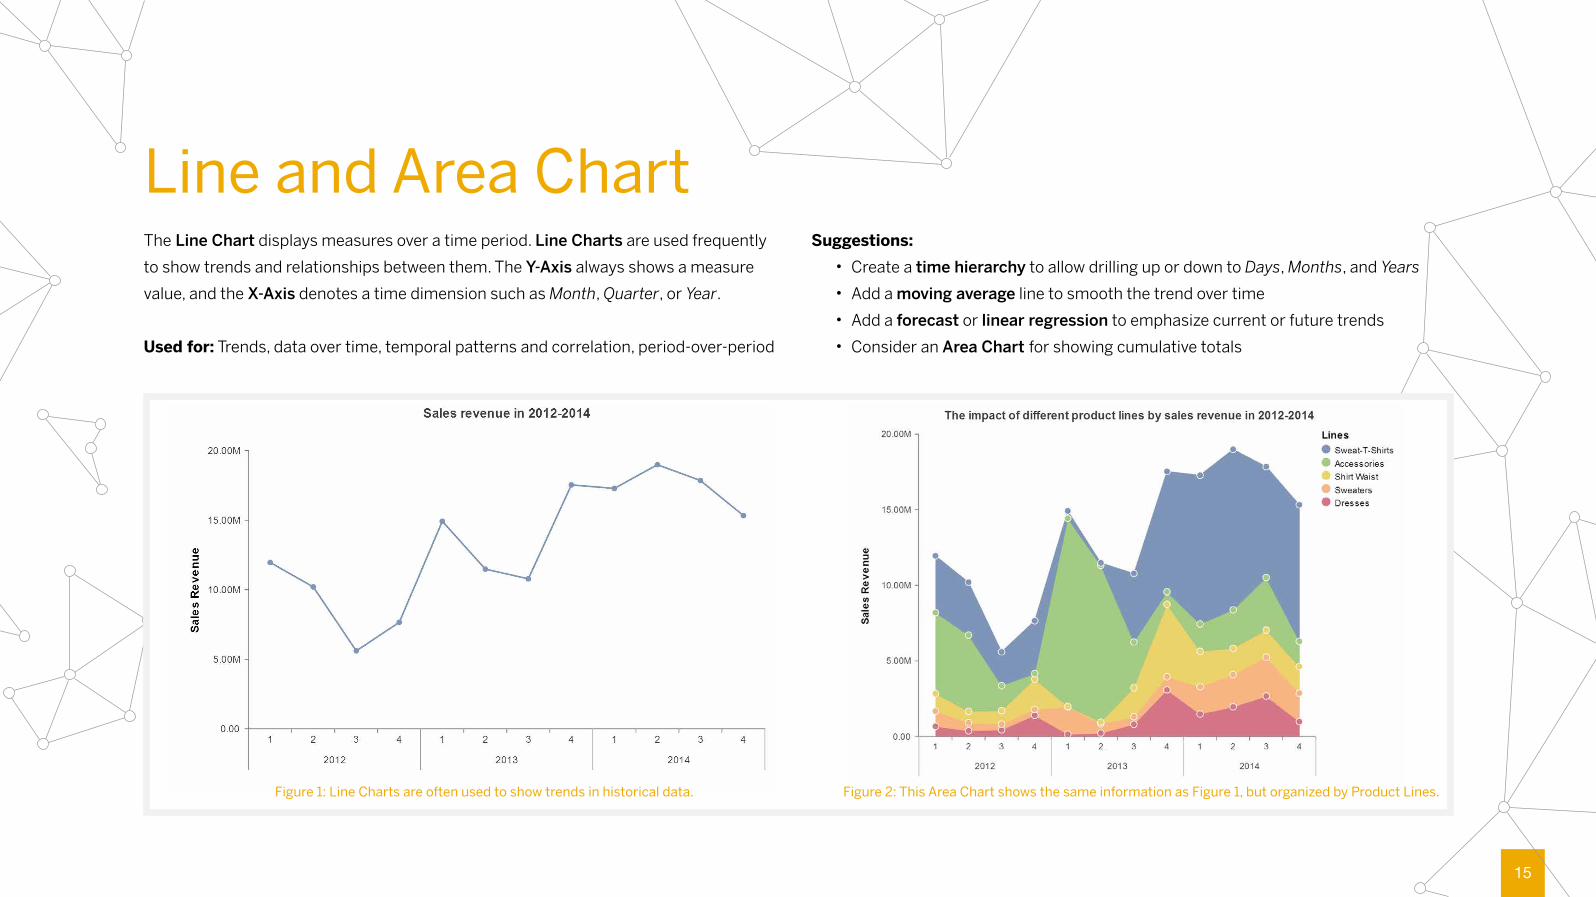
Pie, Ring, and Funnel ChartsPie, Ring (Donut), and Funnel Charts are used to discern part-to-whole comparisons to either highlight a portion of the data or to compare values for different categorical values. These chart types are generally not recommended if they include too many segments, as the viewer will have a difficult time differentiating between too many different colors.
Used for: Comparing percentage values in proportion to the whole
Suggestions:Limit use of Pie Charts to a small number of slices (no more than 7 slices)Consider showing data labels for ease of readingHighlight only the most important slice if possibleCompare with using a bar chart or ring (donut) chart - the viewer is more likely to perceive the length of a bar over the size of angular slices
••••
Figure 10: The Pie Chart shows the contribution of each categorical value.

25
Focus Area: Histogram and Binning, Box Plot, Heat and Tree Map
DISTRIBUTION

26
Histogram and BinningA Histogram is a type of Column Chart that shows the distribution of measure values, for example, Number of Items Sold. Instead of showing each measure value directly, in a histogram, values are binned first. For example, in Figure 9, instead of creating one column per Age, we binned the values first into the age ranges [11-20], [21-30],...[81-90]. This allowed us to show the distribution of Number of Prescription Drugs Sold in an audience friendly way.
Used for: Distribution of measure values, identifying data issues including outliers
Suggestions:Create bins or ranges of numbers to count the number of occurrences within your data. In SAP Lumira, this can be done either in the Prepare Room using the Group by Range functionality or in the Visualize Room using a Calculated Dimension.
•
Figure 9: The Column Chart (Histogram) shows the distribution of data.

27
Box PlotA Box Plot visually displays statistical distribution of a measure within a dataset. It is often used to also show the range in values for each categorical value. Boxplots show the minimum and maximum values, as well as the median and the 25th and 75th quartile. Outliers are visually represented by dots. Used for: Comparison, distribution of values, identifying outliers
Suggestions:Compare data distribution for several categorical values Show distribution of medians in dataInclude a reference line for the overall median in your data
•••
Figure 10: Each box shows the median, top and bottom 25%, and outliers withineach categorical value.
28
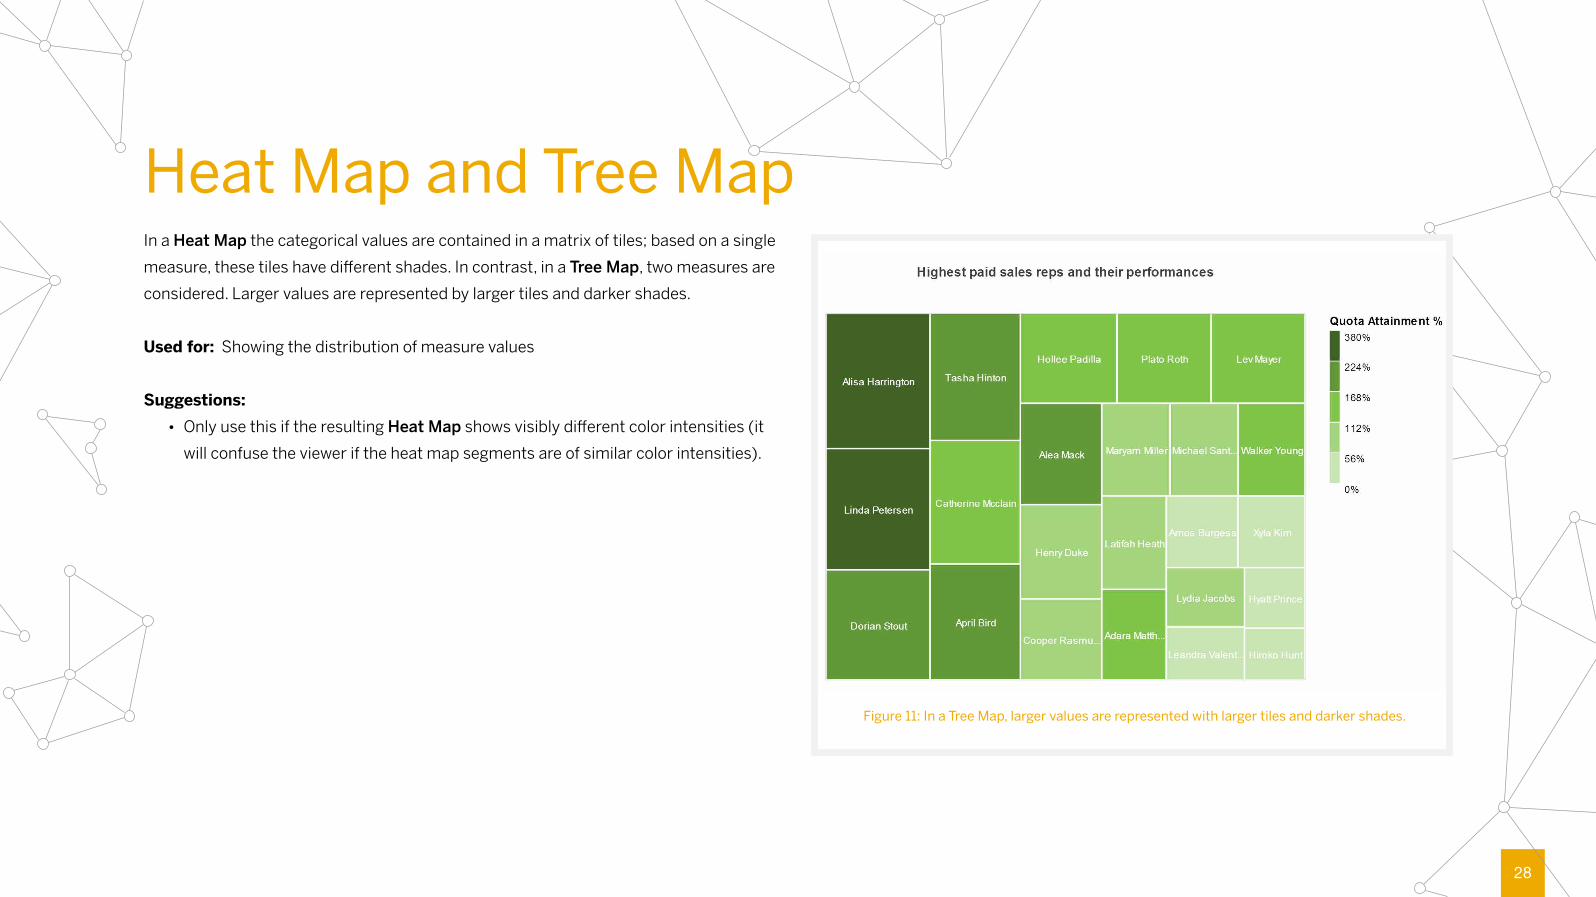
Heat Map and Tree MapIn a Heat Map the categorical values are contained in a matrix of tiles; based on a single measure, these tiles have different shades. In contrast, in a Tree Map, two measures are considered. Larger values are represented by larger tiles and darker shades.
Used for: Showing the distribution of measure values
Suggestions:Only use this if the resulting Heat Map shows visibly different color intensities (it will confuse the viewer if the heat map segments are of similar color intensities).
•
Figure 11: In a Tree Map, larger values are represented with larger tiles and darker shades.

29
Focus Area: Scatter Plot, Scatter Matrix, and Bubble Chart
CORRELATION
30
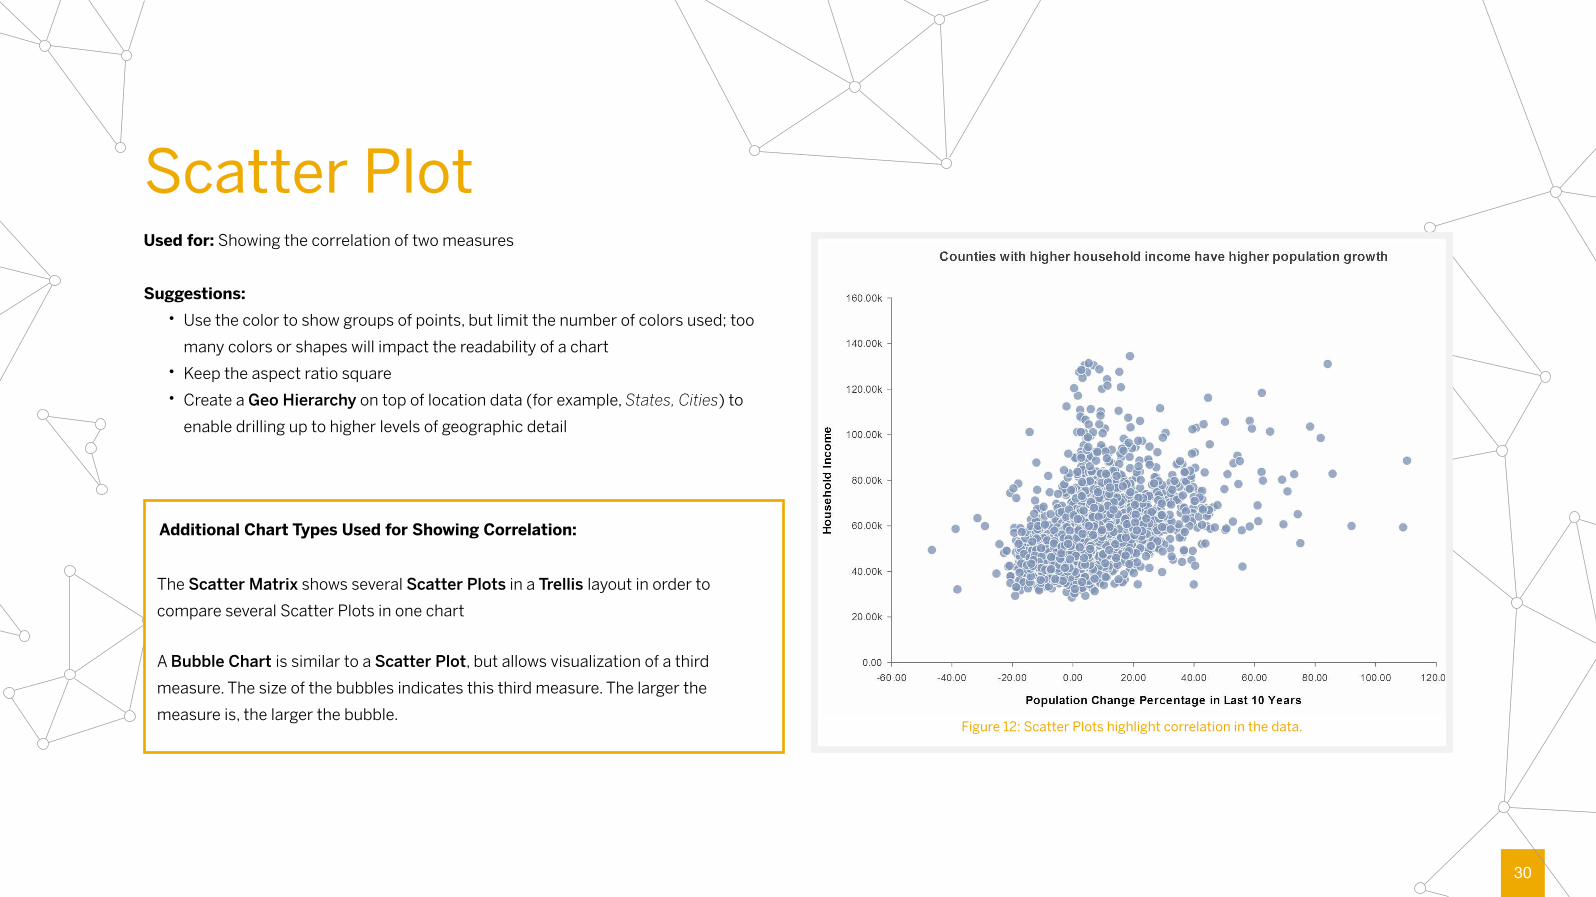
Scatter PlotUsed for: Showing the correlation of two measures
Suggestions:Use the color to show groups of points, but limit the number of colors used; too many colors or shapes will impact the readability of a chartKeep the aspect ratio squareCreate a Geo Hierarchy on top of location data (for example, States, Cities) to enable drilling up to higher levels of geographic detail
•
••
Figure 12: Scatter Plots highlight correlation in the data.
The Scatter Matrix shows several Scatter Plots in a Trellis layout in order to compare several Scatter Plots in one chart
A Bubble Chart is similar to a Scatter Plot, but allows visualization of a third measure. The size of the bubbles indicates this third measure. The larger the measure is, the larger the bubble.
Additional Chart Types Used for Showing Correlation:

31
Focus Area: Table
DATA OVERVIEW

32
TableYou can find the Table as one of the visualization types in the Visualize Room.
Used for: Show multiple measures in one or two categories or hierarchies Suggestions:
Best for showing exact valuesOften charts and Tables are shown on the same page, as they emphasize different aspects Highlight key information with the Conditional Formatting feature (see Figure 13)Setting the correct precision (number formatting) for measures included in a Table is paramount in order to not overload the user
••
••
Figure 13: In a Table, use conditional formatting to highlight key information

33
Focus Area: Choropleth Map, Geo Bubble Chart, and ESRI
GEOGRAPHICAL INFORMATION

34
Choropleth MapA Choropleth Map uses differences in shading, coloring, or the placing of symbols within predefined regions to indicate measure values in those areas.
Used for: Supports location-based comparisons of standardized data such as Rates, Densities, or Percentages.
Suggestions:Use the Choropleth Map for locations of similar size, as the size of the area colored may overemphasize larger areas (for example, Canada covers a much larger area than Japan despite being much smaller in terms of population)Make sure your measure values are normalized by the geographic properties, for example, by the population of a geographic areaRemember that the granularity of your regions (counties, for example) will impact the signal (aggregated measure values) from your data.
•
•
•
Figure 14: A Choropleth Map showing darker colors for larger data values.

35
Geo Bubble ChartThe Geo Bubble Chart shows measure values in the form of bubbles on a map. The larger the measure, the larger will be the bubble on the map.
Used for: Viewing a measure by Country, Region, or City; comparing measures across different geographic areas
Suggestions:Use to show values on a map and to create an animation over timeUse Geo Bubble or Pie Charts on maps to show measure values if the relative size of the underlying regions cannot be compared
••
Figure 15: In a Geo Bubble Chart, larger circles denote larger measures.

36
ESRIESRI is an international supplier of Geographic Information System (GIS) software, web GIS and geodatabase management applications. SAP’s alliance with ESRI allows for access to their base maps, geo-spatial functions, and data from within SAP Lumira for customers with an ARCGIS online account. You can get started on a free 60 day ARCGIS trial here.
ESRI Maps integration in SAP Lumira connects geospatial assets with business data. Geo-enable your business data to quickly discover new patterns and share your insights across the organization.
For more information visit www.esri.com
Figure 16 Figure 17

37
Focus Area: Numeric Point, Network Chart, Radar Chart, Tag Cloud, Tree Chart, Waterfall Chart, Parallel Coordinates Chart and Custom Extensions
OTHER CHARTS

38
Custom Chart Extensions - Designed with a Developer in MindWe know that there’s always that edge case, which makes a certain chart type great just for your story. And we know that data sits in a wealth of different sources – and that you might have a very special one to report on. In both cases, we have you covered with the SAP Lumira SDK, which lets you build your own custom charts and connectors.For more information visit here.
Other Chart TypesIn addition to the chart types mentioned above, SAP Lumira also supports the following chart types:
Custom Extensions
Figure 18: Examples of custom chart extensions
42K Numeric Point:Often used in Stories to reflect an important key figure
Network Chart:Used to show the relationship between the categorical values of two dimensions, for example, People and Locations
Parallel CoordinatesChart:Used to compare multiple measures for a single category
Radar Chart:Compares multiple measures across categorical values
Tag Cloud:Visualization type used for text data. The size and color of the value reflects the measure values
Tree Chart:Often used to show the hierarchical relationship between dimensionsWaterfall Chart:
Used to show the cumulative effect of temporal (or other sequential) data
Combined Stacked Column + Line Chart with 2 Y-Axes
Combined Stacked Column + Line Chart

39
Get Started Today
Try SAP Lumira for Free Nowwww.sap.com/Lumira
For more resources please visit Lumira Community on SCN