
SAP Crystal for Enterprise 4 0
78
SAP – BO 4.0 Crystal Reports for Enterprise Krishna Pingali ( [email protected] ) Naresh Katakam ([email protected])
-
Upload
krishna-pingali -
Category
Documents
-
view
68 -
download
2
description
This PDF gives you basic idea of SAP Crystal for Enterprise 4 0 and tool navigation. After going through this pdf, you can create a basic report using SAP Crystal for Enterprise 4 0.
Transcript of SAP Crystal for Enterprise 4 0

SAP – BO 4.0
Crystal Reports for Enterprise
Krishna Pingali ( [email protected] )
Naresh Katakam ([email protected])

- 2 -
Training Agenda... Crystal Reports Overview
Log on to SAP BO Enterprise
Available Data sources & Connecting to Data Sources
Creating Connection to SAP Sources from IDT
Creating a Simple Report
Report Design Interface
Inserting Groups
Inserting Summaries
Applying Sorting Working with Prompts
Using Formulas and Functions
Working with Cross Tabs
Working with Sub Reports
Q&A
Hands on

- 3 -
What is Crystal Reports?
Crystal Reports is a Business intelligence application used to design and generate reports from a wide range of Data sources.
Several other applications, such as Microsoft Visual studio, uses OEM version of Crystal Reports as a general purpose reporting tool.
Crystal Reports became a standard report writer when Microsoft released it with Visual studio.
Now, it’s one of the best Business intelligence product from SAP.

- 4 -
History of Crystal Reports
The product was originally created by Crystal Services Inc. as Quick Reports to meet the reporting needs for their accounting software. They Produced versions 1.0 through 3.0,
The company was acquired in 1994 by Seagate Technology and renamed itself to Seagate
Software.
Later it was renamed to Crystal Decisions and produced versions 4.0 through 9.0.
Crystal Decisions was acquired in December 2003 by Business Objects, which has produced versions 10, 11 (XI).
In Oct 2007, Business Objects was acquired by SAP and they released Crystal Reports 2008 (in
Apr 2008.)
In 2011, SAP released two versions of Crystal Reports as mentioned below. 1. SAP Crystal Reports 2011: This is regular traditional CR version which is a successor of CR2008
with 3 major additional features
2. Crystal Reports for Enterprise (cr4e): This is entirely new version of CR which is targeted for SAP environment reporting. But, it has many functionality limitations unlike CR2011.

- 5 -
What is Crystal Reports for Enterprise?
SAP Crystal Reports for Enterprise is the newly designed version of the Crystal Reports designer.
Where as “Crystal Report 2011” inherits all the features and GUI from it’s previous versions.
This version is focused on streamlined report design, reporting against the new BI 4.0 semantic layer and SAP BW data.
SAP Crystal Reports for Enterprise is the foundation for all future releases of Crystal Reports.

- 6 -
What’s New?
The user interface has been completely redesigned offering a streamlined interface to allow the creation of reports with reduced amount of effort.
Semantic layer support is improved. With SAP Crystal Reports for Enterprise you can create reports against the new BI 4.0 common semantic layer.
From SAP Crystal Reports for Enterprise you can connect directly to a SAP BEx query using SAP BICS connectivity.
Multilingual capabilities have been improved as you can translate all text-based elements, and all translations can be managed and scheduled at the platform level by the Translation Management tool.
New BI platform alerting framework can leverage alerts created in SAP Crystal Reports for Enterprise. This allows users to manage their alert subscriptions on their own, thus reducing management overhead on the report designers.

- 7 -
Crystal Reports for Enterprise Vs Crystal Reports 2011

- 8 -
BI 4.0 Landscape

- 9 -
BI 4.0 with SAP Landscape

- 10 -
Basic Architecture

- 11 -
Getting Started - Interface

- 12 -
Log On To BO BI Platform
To work with SAP data sources we must need to connect to SAP BO BI platform to access data source connections.
Even after report development, if we want to publish the reports, we need to be connected to this BI platform.
Click File > Log on to SAP Business Objects Business Intelligence platform. The "Log on to SAP Business Objects Business Intelligence platform" dialog box appears.
Click New Connection. When you have created at least one connection, this button displays as Manage Connections.

- 13 -
Log On To BO BI Platform….

- 14 -
Log On To BO BI Platform… BI platform Web Services Server Name:
1. Provide the server name of the SAP Business Objects Business Intelligence platform system that you want to connect to.
2. You do not need to type the complete URL here, only the server name. If the server requires an encrypted connection, select the This server requires an encrypted connection (SSL) check box.
3. The server name and port number are for where the BI platform Web Services is installed and configured. This is not where the BI platform servers are installed.
BI platform Web Services Server Port Number: 1. Provide the web server port number that is associated with the SAP Business Intelligence
platform server name. 2. Your system administrator can tell you the value to use for the web port number.
BI platform Web Services Server Context: 1. The server context information refers to the server path of the SAP Business Objects
Business Intelligence platform Web Service. The default value is /dswsbobje/services. 2. Your system administrator can tell you the value to use for the server context information.

- 15 -
Log On To BO BI Platform
Authentication Type : 1. "Enterprise" authentication requires a user name and password that are recognized by the
BI platform. 2. "LDAP" authentication requires a user name and password that are recognized by an LDAP
directory server. 3. "Windows AD" (Active Directory) authentication requires a user name and password that
are recognized by Windows AD. 4. "SAP" authentication requires a user name and password that are recognized by SAP.
Your system administrator can tell you which authentication type to use. Import/Export:
1. We can import files containing server connection information. You can connect to such servers the next time you connect to the BI platform.
2. We can save (Export) your server configuration settings to a file. Other users can share and import the file.
- 16 -
Data Connectivity
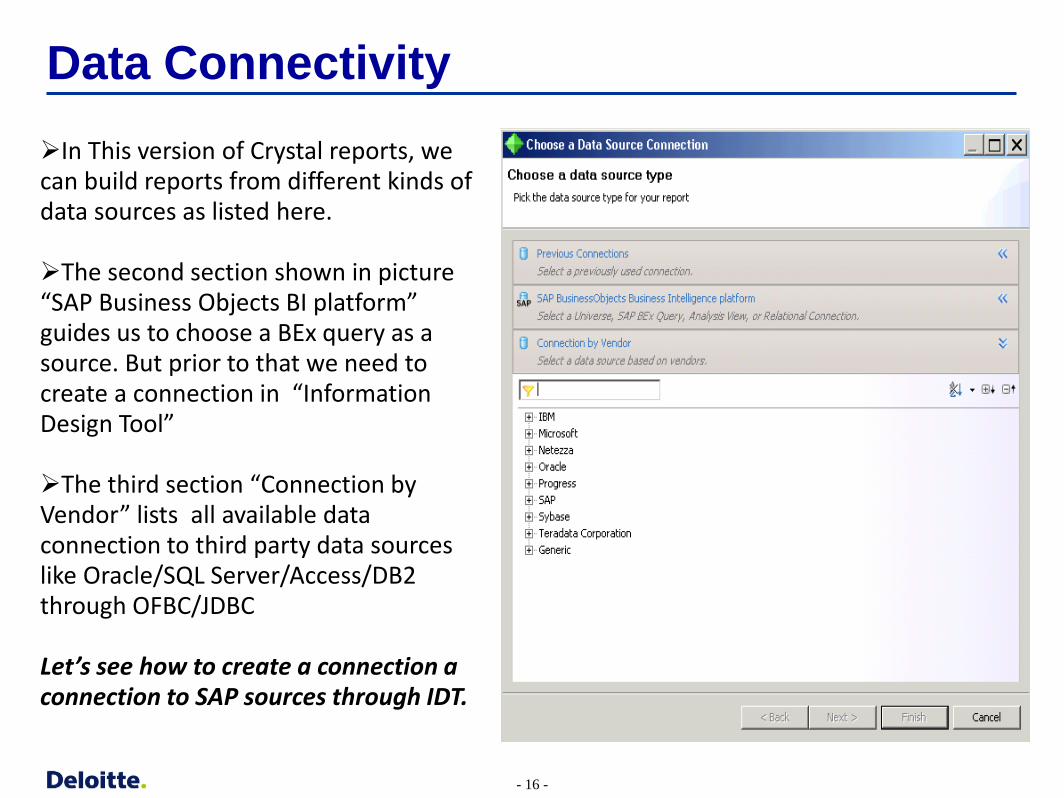
In This version of Crystal reports, we can build reports from different kinds of data sources as listed here.
The second section shown in picture “SAP Business Objects BI platform” guides us to choose a BEx query as a source. But prior to that we need to create a connection in “Information Design Tool”
The third section “Connection by Vendor” lists all available data connection to third party data sources like Oracle/SQL Server/Access/DB2 through OFBC/JDBC
Let’s see how to create a connection a connection to SAP sources through IDT.

- 17 -
Creating a Connection to SAP through IDT…
The information design tool is an SAP Business Objects metadata design environment that enables a designer to extract, define, and manipulate metadata from relational and OLAP sources to create and deploy SAP Business Objects universes.
By using this tool, we will create a connection to SAP data sources as described below.
- 18 -
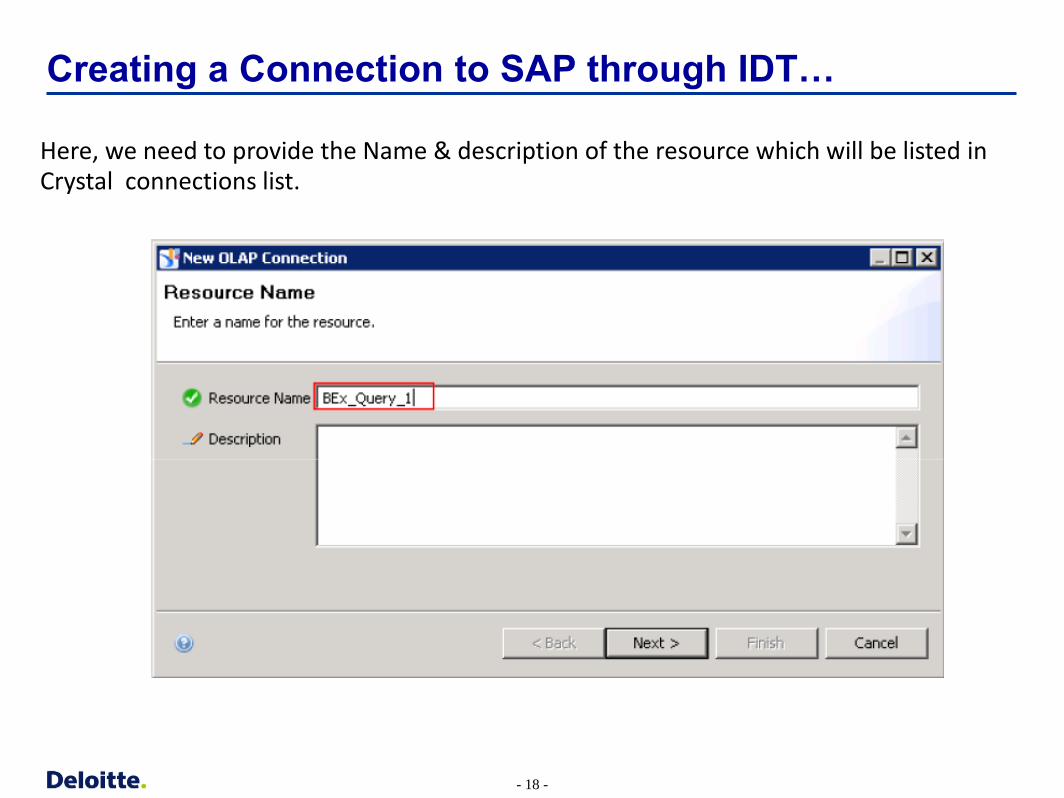
Creating a Connection to SAP through IDT…
Here, we need to provide the Name & description of the resource which will be listed in Crystal connections list.

- 19 -
Creating a Connection to SAP through IDT…
As we are creating this connection to connect to SAP data sources, please select “SAP BICS client” driver

- 20 -
Creating a Connection to SAP through IDT…

- 21 -
Creating a Connection to SAP through IDT…
Authentication Mode: The method used to authenticate the user's login credentials when accessing the data source: 1. Use specified user name and password: Uses the User Name and Password parameters
defined for the connection. 2. Use Business Objects credential mapping: Uses the database credentials associated with the
user's account defined on the Central Management Server (CMS) to connect to the data source. The database credentials are set in the User's Properties in the Central Management Console.
3. Use Single Sign On: This authentication mode is used to support end-to-end single sign on defined in the Central Management Server (CMS). If you use an external authentication source (for example LDAP), the CMS and the data source must be configured to use this external authentication source.
Client Number: The number used to identify the client on the SAP NetWeaver BW system. User Name/ Password : The user name and Password to access the data source if Authentication Mode is Use specified
user name and password.

- 22 -
Creating a Connection to SAP through IDT… Language:
The 2-character ISO language code for the language to be used for the connection to the data source. For example, EN for English.
Save Language: 1. If you select the Save Language option, the value from the Language parameter is used. 2. If you clear Save Language, the value from the user's session (Preferred Viewing Locale) is
used.
System ID: 1. The 3-character SAP system ID. 2. Required for both application and message server types. 3. For a successful connection to the message server, you need to add the message server
system ID to the following file on the machine hosting the application
C:\WINDOWS\system32\drivers\etc\services At the end of the existing file, add the line: sapmsXXX <tab> 3601/tcp where sapms means SAP message server, xxx is the is the System ID of the server that is
used, and 3601/tcp is the default TCP port used for communication.

- 23 -
Creating a Connection to SAP through IDT…
Server type: 1.Select Application Server to connect directly to the SAP server without using load balancing. 2.Select Message Server to benefit from SAP load balancing capabilities.
Server Name for Application server: The name of the SAP application server.
System Number for Application Server:
The system number of the SAP application server. This is a 2 digit integer between 00 and 99.
Server Name for Message Server: The name or IP address of the SAP message server used for load balancing.
Group Name forMessage Server: Name of the Logon group; a set of dedicated application servers used to log on.
Infoprovider: For SAP NetWeaver BW relational connections, the name of the InfoCube or MultiProvider to be used as the fact table in the center of the snowflake schema in the data foundation.
Catalog: For SAP NetWeaver BW relational connections, the name used to identify the connection to the query server.

- 24 -
Creating a Connection to SAP through IDT…
Do not specify a cube in the connection: In this case, each time you access the connection, either when building a business layer or in a query and reporting tool, you will be prompted to select a cube.
Specify a cube in the connection: 1. Select this option to always associate a cube
with the connection. 2. The cube selection page lists the cubes available
for the target database. For connections using the SAP BICS Client driver,
select the Specify a cube in the connection option. In the Information Area folders, select an InfoCube. Then select a BEx Query for the connection.
Once we created this connection, we need to publish this to repository to make use of this globally in crystal reports/webi intelligence.

- 25 -
Connecting to BEx Query from Report Designer…
Once the connection is published to repository, we can use that from crystal report to connect to BEx.
Now to create a simple report, Select New Report from Report Designer. Choose the Source as “SAP BEx Query”. Apart from BEx query, we will have Universe also as
another source.

- 26 -
Connecting to BEx Query from Report Designer…
Provide the required BEx query name and search it as given below.

- 27 -
Connecting to BEx Query from Report Designer…
Crystal itself creates a virtual universe on selected BEx and prompts to select required objects from the selected BEx query as shown below.
If we check “Generate Report” , crystal will automatically generate a simple report with basic formatting.

- 28 -
Designer Interface
Click on page to view report out put format.

- 29 -
Report sections
1. Report Header : Objects placed in this area are printed only once per report and at
the beginning of the report. 2 .Page Header: Objects placed in this area are printed at the beginning of each new
page.
3. Group Header: Objects placed in this area are printed at the beginning of each new group.
4. Details Area: Objects placed in this area are printed with each new record. 5. Group Footer: Objects placed in this area are printed at the end of each group. 6. Report Footer: Objects placed in this area are printed at the end of the report. 7. Page Footer: Objects placed in this area are printed at the bottom of each page. ** Group Header & Footer are created when we insert a group.

- 30 -
Report Output
- 31 -
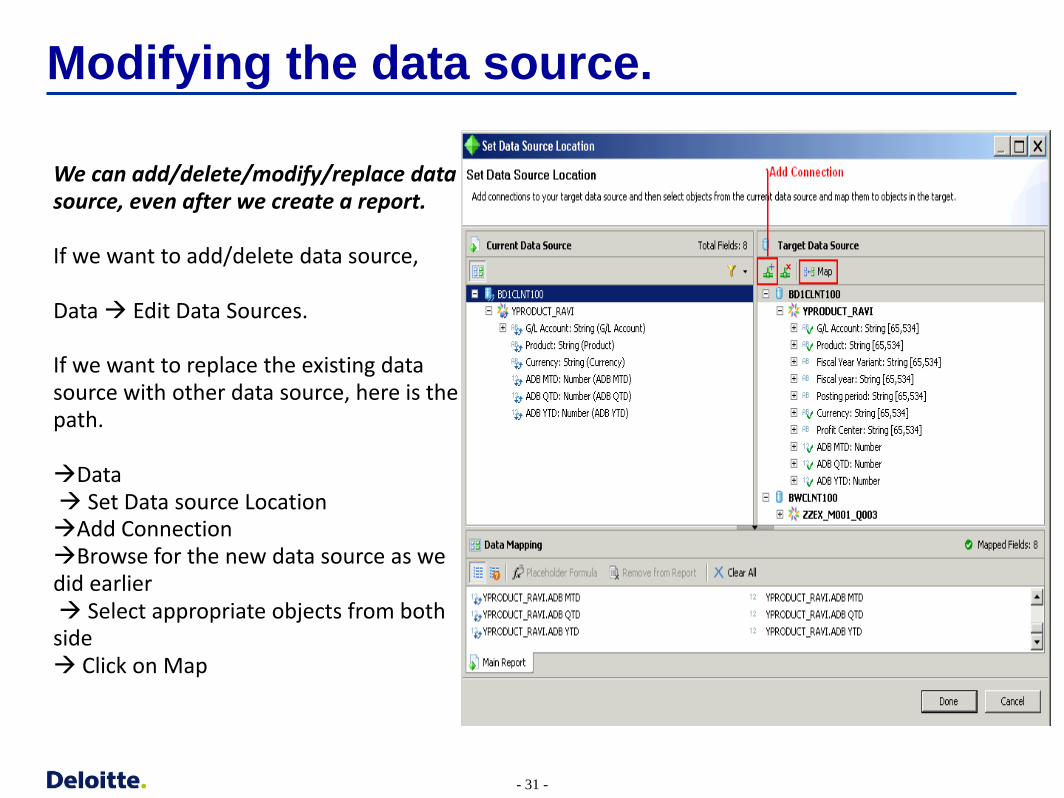
Modifying the data source.
We can add/delete/modify/replace data source, even after we create a report. If we want to add/delete data source, Data Edit Data Sources. If we want to replace the existing data source with other data source, here is the path. Data Set Data source Location Add Connection Browse for the new data source as we did earlier Select appropriate objects from both side Click on Map

- 32 -
Grouping & Sorting
Creating Groups
Customizing group names
Hierarchical Grouping
Sorting on Groups
Inserting Summary
Sorting

- 33 -
Creating Groups
We can create GROUPS to eliminate data redundancy and it makes the report looks good. INSERT GROUP EDIT GROUPS (For Advanced Options) Now, we can insert as many groups as we need.
If we group on Hierarchy column, Crystal displays the group name with provided indentation. For regular columns, we can assign “Hierarchical group parent” if we want to have hierarchical relation with other column.

- 34 -
Customizing Group Names
Assume we have grouped on Product hierarchy, but we want to display group name as the combination of Product key and Product Description. In such cases, we can use the below option to display customized group name. For this, we can select another database/formula field or we can write a formula there it self.

- 35 -
Hierarchical Grouping
When we get data from SAP sources, we must think about “Hierarchical Fields” which SAP generally have. To support such kind of functionality we can create Hierarchical grouping in this new version of Crystal reports. Here, we can display Hierarchical grouping functionality in two ways. Grouping on direct SAP “Hierarchical Fields”:
When we group on direct SAP field, crystal automatically shows hierarchy type is as “External Hierarchy". So, it shows parent – node relationship as its in SAP.

- 36 -
Hierarchical Grouping
Hierarchical grouping on non – hierarchy fields:
1. We can create hierarchical grouping on non- hierarchy fields as well as we did in earlier versions of crystal reports.
2. Once we created group on a field (which acts as child), we need to define hierarchy type as “Hierarchical group parent” and then need to set it’s parent field.
3. This is useful in earlier versions as we can’t have a direct SAP hierarchy fields in those versions.

- 37 -
Sorting – Group level As a default crystal behavior from it’s previous versions, Crystal will create sorting priority first on grouped fields and then the other report fields. Group level Sorting:
1. At group level, we can apply sorting in 2 ways. One is on Grouped dimensions as shown in below pic 1 and the second way is sorting based on corresponding measure value as shown in pic 2.
2. We have an option to choose the sorting order like Ascending/Descending/Original/Custom/Formula
3. Original order carries the sorting order as it is in back end data source.
4. Custom is an option when we can manually define the order of the records.
5. Formula is where we can dynamically select a sorting order type like Ascending/descending etc..
6. The “Group” window itself have “Sorts” as another tab as shown below (DataSorts)

- 38 -
Sorting – Record level Record level Sorting:
1. Record level sorting can also be applied from the same screen that we used for group sorting as shown below.
2. Record level sorting will have only two types of sorting orders (Ascending/Descending).
3. We can apply sorting on as many as required fields and we can change the sorting priority by using arrow buttons.

- 39 -
Inserting Summary We can insert summaries of Measure values for each group level (Sub Totals) and Report level (Grand Total).
1. Click on Insert Total
2. On left side, ,Select the aggregating function (Sum/Avg/max etc..)
3. On left side, Select the measure on which aggregation is required.
4. On right side, select the location where we want to place aggregated value.

- 40 -
Data Filtering (Static & Dynamic)
Data Filtering types
Query level Data Filtering
Report level Data Filtering
Creating Parameter fields
Static/Dynamic Parameters
Parameter Options

- 41 -
Data Filtering Types
Data filtering can be done at two levels in two types as mentioned below.
Data Filtering
Query Level
Static Filters
Dynamic/
Interactive
Report Level
Dynamic/
Interactive
Record Level Group Level
Static Filters
Group Level Record Level

- 42 -
Query Level Filters - Static
Query level filters are applied while browsing the data from data source it self.
As these filter the data at database level itself, it helps for report performance.
For SAP/Universe data source, we can insert query level filters as below while browisng the data.
Even after query creation, we can insert these filters from crystal interface.( Data Query filters)
If we provide a static value as inputs for filters, that’s known as static filter.
We can either enter a value or select from available list of values of the field.

- 43 -
Query Level Filters - Dynamic
Rather than providing a fixed value, we can make user to select his choice of input on refresh.
If we select prompt as an operand, that’s known as dynamic/interactive filter.
This kind of filters provide more flexibility to user for report analysis.
Foe each query level dynamic filter (Prompt), crystal automatically create a prompt at report level
which prompts user for input on report refresh.

- 44 -
Report Level Filters - Static
Report level filters are applied once the data is pulled in to report. So, though we are filtering the data,
report has to pull the selected set of data from data source.
These filters needs be written as formulas in formula work shop as shown below.(Data Formulas)
We can apply these filters at two levels
1. Record level: Filters that needs to be applied on each record of the report
2. Group Level: Filters that needs to be applied on group level summaries.

- 45 -
Report Level Filters – Dynamic/Interactive
Similar to query level filter, we can create dynamic/interactive filters at report level as well which
prompts which to enter/select his choice of inputs to filter the data on each refresh.
In static filter we will use a “hardcoded” value as an input to filter the data. But, here we will use a
“Parameter filed” which holds the user input dynamically and supplies the same value to filters.
Now, lets see how to create a parameter field in crystal .
1. We can see all parameter fields in left window of crystal reports as below.
2. All query level prompts are listed as shown below.
3. To create a new parameter, Right click New New Parameter
4. To change parameter order , Right click Reorder

- 46 -
Creating Parameter fields
Parameter field data type should be as same as the field on which we apply filter.
i.e. If we are applying filter on Revenue filed, corresponding parameter filed would be of “Number” data type.
List of values can be either manually entered or imported from external files or dynamically inserted from any database filed. Click on (…) for more options.
Hidden prompts option selection makes the prompts to be invisible in run time but filters the data based on initial value.

- 47 -
Report Level Filters – Dynamic/Interactive
Once “Parameter” filed is created, now we need to input that to our filters to make it use in report.
Data Interactive filter Select the data base field Select the corresponding Parameter field .
Once done, report prompts user as shown in Pic 2 for inputs on refresh.

- 48 -
Using Formulas
Creating formula field
Formula Workshop
Available Functions & Operators

- 49 -
Formula Fields
Formula fields are customized data fields, which can be created at crystal level by using available database fields and crystal functions.
These are prefixed with ‘@’ symbol.
To create a new formula field, Right click New Formula
Crystal has many functions, operators and variables which can be used to create customize formula fields.
Any formula can be written/view through “Formula Workshop” window. (Data Formulas)

- 50 -
Formula Workshop Crystal support different kind of functions/operators which we can view through
Functions/Operators window at left bottom.
For more details about a function/operator, we can go through help.
In Crystal, if any option is shown with a symbol (fx), can be manipulated through formula.

- 51 -
Sample Formulas
There are many uses for formulas. If you have a need for specialized data manipulation, you can do it with a formula. Adding calculated objects to your report
To calculate a price discounted 15%: Crystal syntax example: {Orders_Detail.Unit Price}*.85
Formatting text on a report :
To change all values in the CUSTOMER_NAME object to uppercase: Crystal syntax example: UpperCase ({Customer.CUSTOMER_NAME})
Pulling out portions of a text string:
To extract the first letter of the customer name: Crystal syntax example: {Customer.CUSTOMER_NAME} [1]
Extracting parts of a date:
To determine what month an order was placed: Crystal syntax example: Month ({Orders.Order Date})
Using a custom function:
To convert $500 from U.S. currency to Canadian: Crystal syntax example: cdConvertUSToCanadian (500)
- 52 -
Managing Sections
Insert/delete Sections
Hiding a sections
Page Break Options
Using formulas in sections
Formatting sections

- 53 -
Insert/Delete Section
As we discussed earlier Crystal report design is completely based on sections. So, managing section is very important while developing a report
1. We can insert multiple sections for each type of section (RH/PH etc..) and we can delete them if not
required. However, the default section would remain same.
2. To Insert a section, right click on section Insert Below/Above

- 54 -
Section Properties
All sections will have global properties like hiding/formatting/paging apart from few section specific properties.
1. We can hide any section directly by checking the box or dynamically through writing a condition.
2. Similarly we can apply a condition based formatting for a section.
3. We can insert a page break after/before a section or we can do this through a formula based on a condition as well.
4. We can set any property for a master section which inherits to all its child sections (If we have multiple page headers, we can right click on page header section and set the property which inherits all its page headers like Page header a and page header b)

- 55 -
Section Properties
General Options:
1.Name: Type in a name to identify the section.
2.Color: Select a background color for the section.
3.Show on Drill Only: Select this check box if you do not want the section to print, but you want the section contents to be
available for drill-down (It’s visible when we right click on Master section, not individual sections).
4.Hide: Select this check box if you do not want the section to print, and you do not want the section contents to be available
for drill-down.
5.Hide If Blank: Select this check box to hide the report section only when it is blank.
6.Print at Bottom of Page: Select this check box to print the section at the bottom of the page. If you use this option for the
"Body" section, each report record prints on a separate page.
7.Underlay Following Sections: Select this check box if you want the selected section to underlay the following section(s)
when it prints.
8.Relative Positions: Select this check box to lock the relative position of a report element next to a grid element within a
section. For example, if you place a text element one centimeter to the right of a cross-tab element, during report
generation the program will push the text element to the right, so that the one centimeter space is maintained regardless
of the width of the cross-tab element.
9.Height: Specify the height of the section in inches.

- 56 -
Section Properties Paging Options:
Group :
These options appear only if you select a "Group Header" or "Group Footer" section.
Avoid Page Break in Group: Select this check box to keep your group from breaking across pages. If the group extends beyond a single page, Crystal Reports begins printing the group at the top of the next empty page, but then breaks the
group across pages as necessary. If the first group in a report extends beyond a single page, and this check box is selected, Crystal Reports begins printing the group on the
second page of the report instead of the first page. To avoid this behavior on the first page of the report, clear the "Avoid Page Break on First Page" check box in the "Report Options" dialog box.
Repeat Group Header on Each Page: Select this check box to print the "Group Header" once at the top of each page.
New page after: Select this check box if you want the program to print the report contents on a new page after printing a specific number of
visible groups. Type a whole number in the field to specify the number of visible groups.
Section : Page Break Before: Select this check box if you want the program to insert a page break before it prints the section. If you use this option for
the "Body" section, the program inserts a page break before each report record.
Page Break After: Select this check box if you want the program to insert a page break after it prints the section.
Reset Page Number After: Select this check box to reset the page number to “1” for the following page. This option is useful when you are
printing multiple reports from a single file (for example, invoices), and you want each report to start with page 1.
Avoid Page Break: Select this check box to keep the section from breaking across pages. If the current page does not have enough space for
the entire section, then the section begins printing on the next page. If the section does not fit on a single page, then the section prints over
multiple pages.
Page Orientation: Specify whether to print the section in portrait or landscape orientation.

- 57 -
Field level formatting
General formatting
1. Size & Position 2. Wrap Text 3. Display String 4. Hyperlinks 5. Tool Tips
Number Formatting
Date Formatting
Conditional Formatting/Alerts

- 58 -
Generic Formatting Options Right Click on any field from design canvas Format Result object
We can format each field in Crystal to customize it’s font, color etc..
All fields have generic formatting features apart from few specific formatting options based on field data type.

- 59 -
Hyperlinks
As we saw in previous slide, this options is available in “Advanced” category.
We can set hyperlink for a field in different type as listed here.
Below table explains when & how each type has to be used.

- 60 -
String - Formatting Options

- 61 -
Number - Formatting Options

- 62 -
Date/Time - Formatting Options

- 63 -
Conditional Formatting
Apart from regular formatting, we can format a
field based on condition as well
Right Click on any field from design canvas
Select Conditional formatting.
Click on Add Condition.
Provide the condition by choosing operator,
operand values from dropdown.
Select corresponding formatting from below table
option for each condition.
We need to define the set conditions as shown
here for each column that we want to
conditionally format. We can’t re use these
conditions across all columns.

- 64 -
Cross Tabs
Inserting Crosstabs
Crosstab options

- 65 -
Inserting Crosstab
Cross-tab reports are a powerful way to show the data in multi dimensional way.
They generate summary data in a grid as a combination of rows and columns.
This provides the user with a report format that is easy to read.
Similar to charts, cross tabs can only be placed in Report Header/footer, Group header/footer as they are meant
for summarized data.
Insert Cross Tab Right click Format/Edit Cross Tab.
We can display hierarchies as well in cross tabs. Below is the sample view.

- 66 -
Crosstab Options
When we Right click on Cross Tab, we can view all available options of cross tabs. Few of them are,
”Grid Options” – which lets user to customize totals display
“Pivot” – which toggles columns as rows and rows as columns
“Create Chart from Cross Tab data” – creates a chart by consuming data fields supplied for crosstabs.

- 67 -
Sub Reports/Drill Down Reports
What is a Sub Report?
Inserting a Sub Report
Linking Sub Reports
Editing Sub Reports
Sub Report Options
Drill Down Reports

- 68 -
What is a Sub Report?
The concept Sub Report in Crystal Reports is a unique feature where as the other traditional BI tools doesn’t have this. We can say its similar to “drill through”.
Sub Report is a report within a report. We can insert another report which is already created or we can create at that point of time also.
The Sub Report has all of the characteristics of a regular report, but cannot include other sub report within itself.
Sub report can be free-standing or it can be linked to the data in the primary report.
We can insert maximum of 256 sub reports into a regular report.
If we insert a sub report in to a main report, finally the main report file (.rpt file) will be treated as only one file (.rpt file)

- 69 -
Types of Sub Reports?
Unlinked Sub report:
CR does not need any parameters between main and sub reports. So, sub report displays all of the records available. The data in the main and sub report is not linked i.e. totally unrelated and can be from different databases with different formats.
Linked Sub report:
Linked sub reports use data that is coordinated with data in the main report. The program matches up the data in the sub report with data in the main report. If you create a main report with customer information and a sub report with order information and then link them, the program creates a sub report for each customer that includes all their orders. Sub reports can be linked with data-passing links or with sub report filters.
On-Demand Sub report:
We can provide the ability to retrieve the data executed when the user clicks the hyperlink (similar to a hyperlink) .
- 70 -
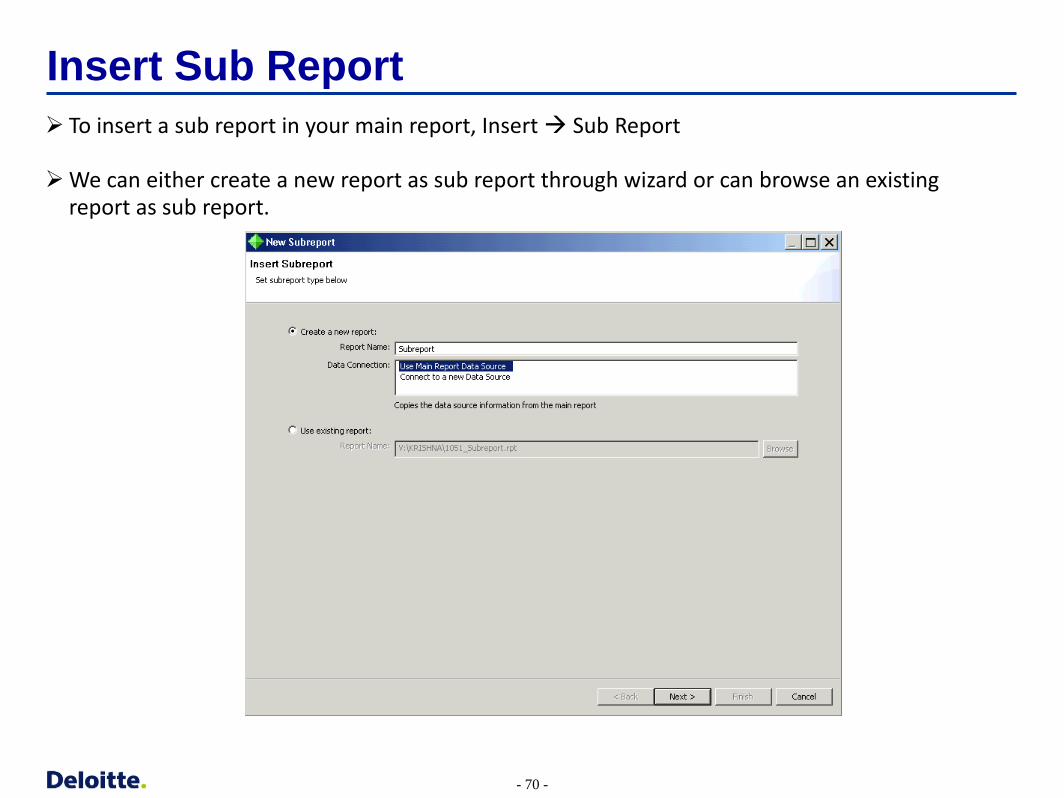
Insert Sub Report
To insert a sub report in your main report, Insert Sub Report
We can either create a new report as sub report through wizard or can browse an existing report as sub report.

- 71 -
Linking Sub Report – Sub Report filters
Use sub report filters to modify the sub report query so that the data in the sub report is coordinated with the data in the main report. When we first create a sub report, subreport filters are automatically suggested. The suggested filters will vary depending on where you insert your subreport. For example:
1.If you place the subreport in the "Group Header" or the "Group Footer", links will be created between all objects in the group, if a possible match can be made.
2.If you place the subreport in the "Body", links will be made between all objects in the subreport. 3.If you place the subreport in the "Report Header", "Report Footer", "Page Header", or "Page Footer", no automatic matching will
occur.
Even though subreport filters may be suggested, you can modify them, remove them, and add additional filters.

- 72 -
Linking Sub Report – Data Passing Links
Data passing links connect result objects, formulas, or parameters in the main report to a parameter in the subreport. The subreport parameter is set to the value of the specified element at runtime.
Unlike subreport filters, data passing links do not modify the subreport query.
Note: When you initially set up a report, the data passing links page appears only if you specify parameters in the "Query Panel" or if you use an existing report with parameters as your subreport. However, after you have created a subreport, you can add data passing links from the "Data" tab.

- 73 -
Sub Report Options These options appear when you open the Format Subreport dialog box and click Subreport. Use these options to add captions and change the report file that is displayed in the subreport element.
Subreport Name: Specify a name for the subreport.
Source: Click this button to open the "Open" dialog box and select a report file to use as a subreport.
On Demand: Select this check box if you want the program to retrieve the data for this subreport only when you view it.
On Demand Caption: Specify a caption that appears on your subreport element when you view the containing report in "Page" mode.
Note: This caption displays only if the "On Demand" check box is selected.
Preview Tab Caption: Specify a caption that appears when you preview your subreport.

- 74 -
Drill Down Reports Crystal defaults the drilldown functionality, if we create a group on any field.
No need to set up any options to create Drilldown reports.
A tool tip will be guiding us , when we place mouse on a Grouped field.
A simple double click on group field leads us to next level data.
Here is a example to create sample Drill down report.
Create a report with “Profit Center”, “Annual YTD” at detail section
Make a Group on Product. (For drill down report, grouping order must have 1 to may relation hierarchal order).
Insert summary of measure filed at each group level and keep summaries in Group header fields beside of
group name field.
Now, go to section expert and select the option “Show On Drill down only” for the Details and suppress the Group footers as they are blank.
Now, if you double click on any Product filed, it shows the corresponding list of Profit centers in a separate tab.
No Drill up functionality available, but you can navigate through the tabs for Drill up.

- 75 -
Drill Down Reports
Before Drill Down
After Drill Down

- 76 -
Publishing/Scheduling Once the report development is completed, we can save the report as a local file in our machine or we can
save the report to a centralized web portal known as “Business Objects Enterprise” through which users can access the report.
To save a report to Enterprise, we must log on to “Business Objects Enterprise” and then just “Save” it.
We can schedule the report on daily/weekly/monthly basis to run and deliver the output of the report to end user mail boxes/Specified location.
We can set up users to access this BOE and we can assign rights for users to access corresponding reports.
For more information, please refer BOE Administration guide which is available on SAP website.

- 77 -
Disclaimer
Thank You
This presentation contains general information only and is based on the experiences and research
of Deloitte practitioners. Deloitte is not, by means of this presentation, rendering business,
financial, investment, or other professional advice or services. This presentation is not a substitute
for such professional advice or services, nor should it be used as a basis for any decision or action
that may affect your business. Before making any decision or taking any action that may affect your
business, you should consult a qualified professional advisor. Deloitte, its affiliates, and related
entities shall not be responsible for any loss sustained by any person who relies on this
presentation

Copyright © 2011 Deloitte Development LLC. All rights reserved. Member of Deloitte Touche Tohmatsu Limited