Sanminas21.q4cdn.com/392851627/files/doc_financials/quarterly/2018/Q2/Q2... · *Non-GAAP revenue...
19
WHAT WE MAKE, MAKES A DIFFERENCE Concept to Delivery / Advanced Technology / Manufacturing & Global Supply Chain Solutions / Systems & Intelligence Sanmina April 23, 2018 Q2 FY’18 Results
Transcript of Sanminas21.q4cdn.com/392851627/files/doc_financials/quarterly/2018/Q2/Q2... · *Non-GAAP revenue...

WHAT WE MAKE, MAKES A DIFFERENCE Concept to Delivery / Advanced Technology / Manufacturing & Global Supply Chain Solutions / Systems & Intelligence
Sanmina
April 23, 2018
Q2 FY’18 Results

2
Safe Harbor Statement
Certain statements made during this presentation, including the Company's outlook for the third quarter fiscal year 2018 and improvements in the second half of 2018, constitute forward-looking statements within the meaning of the safe harbor provisions of Section 21E of the Securities Exchange Act of 1934. Actual results could differ materially from those projected in these statements as a result of a number of factors, including adverse changes to the key markets we target; reliance on a small number of customers for a substantial portion of our sales; risks arising from our international operations; competition that could cause us to lose sales; and the other factors set forth in the Company's annual and quarterly reports filed with the Securities Exchange Commission (“SEC”). In addition, during the course of today's presentation, we will refer to certain non-GAAP financial information. The corresponding GAAP financial information and a reconciliation of the non-GAAP results disclosed during this presentation to more directly comparable GAAP measures are included on slide 16 of this presentation.
The Company is under no obligation to (and expressly disclaims any such obligation to) update or alter any of the forward-looking statements made in this presentation, the press release, the conference call or the Investor Relations section of our website whether as a result of new information, future events or otherwise, unless otherwise required by law.

3
Financial Results (Unaudited)
Three Month Period
($ in millions, except per share data) Q2’18 Q1’18 Q2’17
GAAP:
Revenue $1,676 $1,745 $1,682
Gross profit $115 $109 $133
Operating expense $66 $96 $75
Operating income $49 $14 $58
Other expense $7 $3 $1
Taxes $17 $166 $25
Net income (loss) $25 ($155) $32
Diluted earnings (loss) per share $0.33 ($2.16) $0.41
Non-GAAP(1):
Revenue $1,676 $1,745 $1,682
Gross profit $117 $112 $136
Operating expense $65 $65 $65
Operating income $52 $47 $71
Other expense $7 $3 $1
Taxes $8 $8 $10
Net income $37 $36 $59
Diluted earnings per share $0.50 $0.48 $0.76
(1)Non-GAAP financial results exclude charges or gains relating to: stock-based compensation expenses, restructuring costs (including employee severance and benefits costs and charges related to excess facilities and assets), acquisition and integration costs (consisting of costs associated with the acquisition and integration of acquired businesses into our operations), asset impairment charges, amortization expense and amounts associated with distressed customers, litigation settlements, gains on sales of assets and redemptions of debt and adjustments for deferred tax and discrete tax items. Please refer to “Reconciliation of Non-GAAP Measures” on slide 16 of this presentation.
Numbers may not foot due to rounding.

$1,382 $1,408 $1,440 $1,429 $1,375
7.3% 7.6%
6.5% 5.8%
6.3%
Q2'17 Q3'17 Q4'17 Q1'18 Q2'18
4
Segment Reporting - Revenue and Non-GAAP Gross Margin* ($ in Millions)
Integrated Manufacturing Solutions
*Non-GAAP revenue and gross margin for IMS segment and CPS category includes inter-segment revenues that are eliminated under GAAP and excludes the same GAAP items that are excluded from the calculation of non-GAAP gross margin for the consolidated business. The reconciliation of non-GAAP gross margin for the consolidated business to GAAP gross margin is shown on slide 16.
Components, Products and Services
$350 $357 $365 $357 $346
10.2%
7.3%
8.8% 8.4%
9.1%
Q2'17 Q3'17 Q4'17 Q1'18 Q2'18
Components, Products & Services
Components ‒ Interconnect Systems
• High Technology Printed Circuits • Backplane Assemblies • Cable Assemblies
‒ Mechanical Systems • Precision Machining • Enclosures • Plastics
Integrated Manufacturing Solutions PCB Assembly & Test Final System Assembly & Test Direct Order Fulfillment
Products
‒ Computing & Storage ‒ Defense & Aerospace ‒ Memory & SSD Modules ‒ Optical & RF Modules
Services ‒ Design & Engineering ‒ Logistics ‒ Repair

$1,682 $1,711
$1,755 $1,745
$1,676
Q2'17 Q3'17 Q4'17 Q1'18 Q2'18
Non-GAAP P&L Performance ($ in Millions, except per share data)
$0.76 $0.74
$0.64
$0.48 $0.50
Q2'17 Q3'17 Q4'17 Q1'18 Q2'18
Revenue
Earnings Per Share
$71 $71 $61
$47 $52
4.2% 4.2%
3.5%
2.7% 3.1%
Q2'17 Q3'17 Q4'17 Q1'18 Q2'18
Operating Income / Margin
$136 $133 $126
$112 $117
8.1% 7.8%
7.2% 6.4%
7.0%
Q2'17 Q3'17 Q4'17 Q1'18 Q2'18
Gross Profit / Margin
5

6
Summary Balance Sheet ($ in Millions)
3/31/18 12/30/17
$405 $405
1,088 1,122
1,122 1,080
635 635
355 357
175 161
$3,779 $3,759
$1,224 $1,260
244 169
393 392
455 435
1,463 1,502
$3,779 $3,759
Total stockholders' equity
Total liabilities and stockholders' equity
Other assets
Inventories
Property, plant and equipment, net
Total assets
Accounts payable
Long-term debt
Other liabilities
Cash and cash equivalents
Accounts receivable, net
Short-term debt
Deferred tax assets
Numbers may not foot due to rounding.

41.9 42.3 42.8 46.1
51.1
Q2'17 Q3'17 Q4'17 Q1'18 Q2'18
7
Balance Sheet Metrics ($ in Millions)
$1,019 $1,047 $1,052 $1,080 $1,122
6.2x 6.1x 6.2x 6.1x 5.7x
Q2'17 Q3'17 Q4'17 Q1'18 Q2'18
$433 $436 $407 $405 $405
Q2'17 Q3'17 Q4'17 Q1'18 Q2'18
Cash and Cash Equivalents
24.0% 23.8% 19.9%
14.9% 15.8%
Q2'17 Q3'17 Q4'17 Q1'18 Q2'18
Inventory $ / Turns
Cash Cycle Days Non-GAAP Pre-Tax ROIC
Inventory turns (annualized) are calculated as the ratio of four times cost of sales for the quarter to average inventory.
Cash cycle days is calculated as days inventory on hand (ratio of average inventory for the quarter to average daily cost of sales for the quarter) plus days sales outstanding (ratio of average net accounts receivable to average daily net sales for the quarter) minus accounts payable days (ratio of 365 days divided by accounts payable turns - ratio of four times cost of sales for the quarter to average accounts payable).
Refer to slide 17 for non-GAAP pre-tax ROIC reconciliation.
8
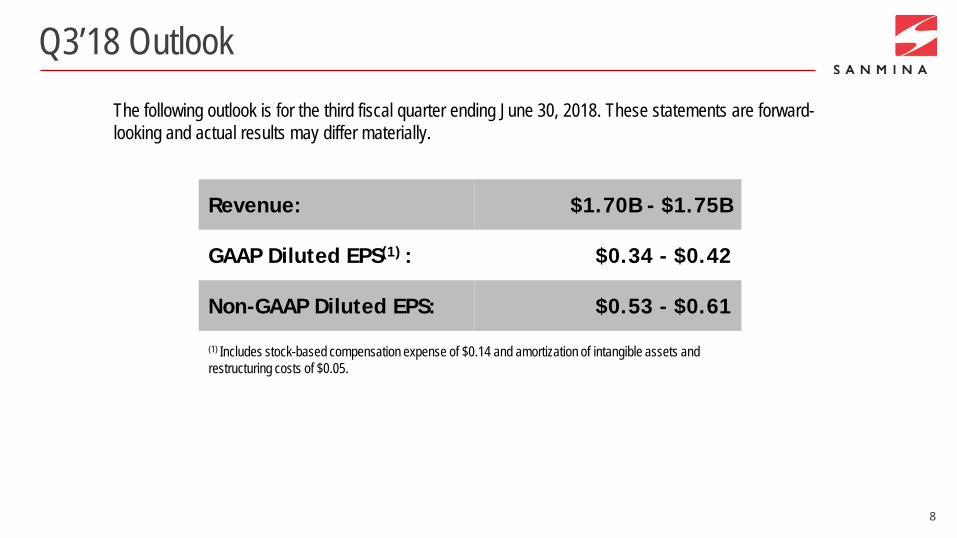
Q3’18 Outlook The following outlook is for the third fiscal quarter ending June 30, 2018. These statements are forward-looking and actual results may differ materially.
Revenue: $1.70B - $1.75B
GAAP Diluted EPS(1) : $0.34 - $0.42
Non-GAAP Diluted EPS: $0.53 - $0.61
(1) Includes stock-based compensation expense of $0.14 and amortization of intangible assets and restructuring costs of $0.05.

WHAT WE MAKE, MAKES A DIFFERENCE Concept to Delivery / Advanced Technology / Manufacturing & Global Supply Chain Solutions / Systems & Intelligence
Sanmina
April 23, 2018
CEO Remarks

Industrial/Medical/ Defense
45%
Communications Networks 38%
Embedded Computing & Storage
17%
Industrial/Medical/Defense (Industrial equipment, energy, oil and gas, medical
equipment and aerospace & defense)
Communications Networks (Networking, optical & wireless infrastructure)
Embedded Computing & Storage (Casino gaming equipment, set-top boxes, cinematography, point-of-
sale equipment, automotive electronics and storage systems)
Sequential 4.8% 5.4% 2.2%
10
Q2’18 Revenue Breakdown By End-Market
Numbers may not foot due to rounding.
Top 10 Customers – 53.0% of Revenue

11
Q3’18 End-market Outlook
Industrial/Medical/Defense (Industrial equipment, energy, oil and gas and medical equipment, aerospace & defense)
Communications Networks (Networking, optical & wireless infrastructure)
FLAT
Embedded Computing & Storage (Casino gaming equipment, set-top boxes, cinematography, point-of-sale equipment, automotive electronics and storage systems)

12
Summary
Q2’18 – Seasonally soft quarter – Results were better than expected – Cost structure improved – Yields improved – Access to critical components remained challenging – Sequential and year over year growth in Medical, Defense and Automotive
Q3’18 – New programs will continue ramp – Solid pipeline of new business – The supply chain will be an ongoing challenge – Continue to optimize our cost structure
Optimistic About Second Half of FY’18

WHAT WE MAKE, MAKES A DIFFERENCE Concept to Delivery / Advanced Technology / Manufacturing & Global Supply Chain Solutions / Systems & Intelligence
Sanmina
Quarter Ended March 31, 2018
Consolidated Financial Statements
Reconciliation of GAAP vs. Non-GAAP

14
GAAP Condensed Consolidated Balance Sheet
March 31, September 30,($ in thousands) 2018 2017
(Unaudited)ASSETS
Current assets:Cash and cash equivalents 405,277$ 406,661$ Accounts receivable, net 1,087,713 1,110,334 Inventories 1,122,018 1,051,669 Prepaid expenses and other current assets 55,510 47,586
Total current assets 2,670,518 2,616,250
Property, plant and equipment, net 635,127 640,275 Deferred tax assets 354,658 476,554 Other 119,052 114,284
Total assets 3,779,355$ 3,847,363$
LIABILITIES AND STOCKHOLDERS' EQUITY
Current liabilities:Accounts payable 1,224,062$ 1,280,106$ Accrued liabilities 125,332 116,582 Accrued payroll and related benefits 123,549 130,939 Short-term debt 244,416 88,416
Total current liabilities 1,717,359 1,616,043
Long-term liabilities:Long-term debt 393,236 391,447 Other 205,770 192,189
Total long-term liabilities 599,006 583,636
Stockholders' equity 1,462,990 1,647,684 Total liabilities and stockholders' equity 3,779,355$ 3,847,363$

15
GAAP Condensed Consolidated Statement of Operations (Unaudited)
March 31, April 1, March 31, April 1,2018 2017 2018 2017
Net sales 1,675,629$ 1,682,262$ 3,420,429$ 3,402,239$ Cost of sales 1,560,931 1,549,052 3,196,265 3,136,867
Gross profit 114,698 133,210 224,164 265,372
Operating expenses:Selling, general and administrative 65,384 62,388 128,987 127,528 Research and development 8,221 8,437 15,836 16,608 Amortization of intangible assets 910 918 1,828 1,836 Restructuring costs (8,591) 3,301 14,951 4,029 Gain on sales of long-lived assets - - - (1,451) Total operating expenses 65,924 75,044 161,602 148,550
Operating income 48,774 58,166 62,562 116,822
Interest income 287 238 572 439 Interest expense (6,826) (5,486) (13,040) (10,753) Other income (expense), net (483) 3,812 2,747 5,069
Interest and other, net (7,022) (1,436) (9,721) (5,245)
Income before income taxes 41,752 56,730 52,841 111,577 Provision for income taxes 17,120 25,013 183,119 34,996
Net income (loss) 24,632$ 31,717$ (130,278)$ 76,581$
Basic income (loss) per share 0.35$ 0.42$ (1.83)$ 1.03$ Diluted income (loss) per share 0.33$ 0.41$ (1.83)$ 0.99$
Weighted-average shares used in computing per share amounts: Basic 70,441 74,761 71,096 74,156 Diluted 73,582 77,864 71,096 77,531
($ in thousands, except per share data)
Six Months EndedThree Months Ended

Reconciliation of Non-GAAP Measures (Unaudited)
($ in thousands, except per share data) Q2'18 Q1'18 Q4'17 Q3'17 Q2'17
GAAP Gross Profit 114,698$ 109,466$ 123,851$ 130,688$ 133,210$ GAAP gross margin 6.8% 6.3% 7.1% 7.6% 7.9%
AdjustmentsStock compensation expense (1) 1,851 2,448 2,180 1,880 2,035 Amortization of intangible assets 902 902 902 902 902 Distressed customer charges (2) (163) (333) (573) (400) -
Non-GAAP Gross Profit 117,288$ 112,483$ 126,360$ 133,070$ 136,147$ Non-GAAP gross margin 7.0% 6.4% 7.2% 7.8% 8.1%
GAAP Operating Expenses 65,924$ 95,678$ 80,782$ 64,112 75,044$ Adjustments
Stock compensation expense (1) (8,444) (6,194) (8,832) (5,409) (5,607) Amortization of intangible assets (910) (918) (918) (918) (918) Restructuring costs 8,591 (23,542) (1,218) 3,908 (3,301) Asset impairments - - (4,600) - -
Non-GAAP Operating Expenses 65,161$ 65,024$ 65,214$ 61,693$ 65,218$
GAAP Operating Income 48,774$ 13,788$ 43,069$ 66,576$ 58,166$ GAAP operating margin 2.9% 0.8% 2.5% 3.9% 3.5%
AdjustmentsStock compensation expense (1) 10,295 8,642 11,012 7,289 7,642 Amortization of intangible assets 1,812 1,820 1,820 1,820 1,820 Distressed customer charges (2) (163) (333) (573) (400) - Restructuring costs (8,591) 23,542 1,218 (3,908) 3,301 Asset impairments - - 4,600 - -
Non-GAAP Operating Income 52,127$ 47,459$ 61,146$ 71,377$ 70,929$ Non-GAAP operating margin 3.1% 2.7% 3.5% 4.2% 4.2%
GAAP Interest and Other, net (7,022)$ (2,699)$ (3,410)$ (4,332)$ (1,436)$ Adjustments
Litigation settlements (3) - (287) - - - Non-GAAP Interest and Other, net (7,022)$ (2,986)$ (3,410)$ (4,332)$ (1,436)$
GAAP Provision for Income Taxes 17,120$ 165,999$ 13,811$ 25,840$ 25,013$ Adjustments
Tax impact of non-GAAP adjustments 125 656 152 206 934 Discrete tax items (2,552) 700 (50) (1,089) (1,105) Other deferred tax adjustments (6,574) 3,050 (5,948) (15,922) (14,418) Impact of US tax reform - (162,400) - - -
Non-GAAP Provision for Income Taxes 8,119$ 8,005$ 7,965$ 9,035$ 10,424$
GAAP Net Income (Loss) 24,632$ (154,910)$ 25,848$ 36,404$ 31,717$
Adjustments:Operating income adjustments (see above) 3,353 33,671 18,077 4,801 12,763 Litigation settlements (3) - (287) - - - Adjustments for taxes 9,001 157,994 5,846 16,805 14,589
Non-GAAP Net Income 36,986$ 36,468$ 49,771$ 58,010$ 59,069$
GAAP Net Income (Loss) Per Share:Basic 0.35$ (2.16)$ 0.35$ 0.48$ 0.42$ Diluted 0.33$ (2.16)$ 0.33$ 0.47$ 0.41$
Non-GAAP Net Income Per Share:Basic 0.53$ 0.51$ 0.67$ 0.77$ 0.79$ Diluted 0.50$ 0.48$ 0.64$ 0.74$ 0.76$
Basic 70,441 71,605 74,281 75,332 74,761 Diluted 73,582 71,605 77,575 78,241 77,864
Basic 70,441 71,605 74,281 75,332 74,761 Diluted 73,582 75,485 77,575 78,241 77,864
(1) Stock compensation expense was as follows:
Q2'18 Q1'18 Q4'17 Q3'17 Q2'17
Cost of sales 1,851$ 2,448$ 2,180$ 1,880$ 2,035$ Selling, general and administrative 8,388 6,164 8,677 5,276 5,376 Research and development 56 30 155 133 231 Total 10,295$ 8,642$ 11,012$ 7,289$ 7,642$
(2)
(3) Represents cash received in connection with certain litigation settlements.
Relates to recovery of previously written-off inventory and bad debt associated with distressed customers.
Three Month Periods
Weighted-average shares used in computing GAAP per share amounts:
Three Month Periods
Weighted-average shares used in computing non-GAAP per share amounts:
16

17
Pre-tax Return on Invested Capital (ROIC) (Unaudited)
Q2 FY18
Pre-tax Return on Invested Capital (ROIC)
GAAP operating income 48,774$ x 4
Annualized GAAP operating income 195,096 Average invested capital (1) ÷ 1,321,166 GAAP pre-tax ROIC 14.8%
Non-GAAP operating income 52,127$ x 4
Annualized non-GAAP operating income 208,508 Average invested capital (1) ÷ 1,321,166 Non-GAAP pre-tax ROIC 15.8%
(1) Invested capi ta l i s defined as tota l assets (not including cash and cash equiva lents and deferred tax assets ) less tota l l iabi l i ties (excluding short-term and long-term debt).

18
Condensed Consolidated Cash Flow (Unaudited)
($ in thousands) Q2'18 Q1'18 Q2'17
GAAP Net Income 24,632$ (154,910)$ 31,717$ Depreciation and amortization 29,879 29,623 29,277 Other, net* 11,676 171,685 19,021 Net change in net working capital (40,504) (37,958) 8,706 Cash provided by operating activities 25,683 8,440 88,721
Purchases of long-term investments (2,019) - - Net purchases of property & equipment (22,482) (48,391) (33,370) Cash used in investing activities (24,501) (48,391) (33,370)
Net share repurchases (75,842) (42,959) 12,048 Net borrowing activities 75,000 81,000 (40,000) Cash used in financing activities (842) 38,041 (27,952)
Effect of exchange rate changes 23 163 (112)
Net change in cash & cash equivalents 363$ (1,747)$ 27,287$
Free cash flow: Cash provided by operating activities 25,683$ 8,440$ 88,721$ Net purchases of property & equipment (22,482) (48,391) (33,370)
3,201$ (39,951)$ 55,351$
Three Month Periods
*Primarily changes in deferred income taxes ($162.4M in Q1 FY18 due to Tax Reform Act) and stock-based compensation expense