Sanjai Bhagat University of Colorado at Boulder Dennis C. Carey...
57
Director Ownership, Corporate Performance, and Management Turnover Sanjai Bhagat University of Colorado at Boulder Dennis C. Carey Spencer Stuart Charles M. Elson University of Maryland Law School
Transcript of Sanjai Bhagat University of Colorado at Boulder Dennis C. Carey...
Director Ownership, Corporate Performance, and Management Turnover
Sanjai BhagatUniversity of Colorado at Boulder
Dennis C. CareySpencer Stuart
Charles M. ElsonUniversity of Maryland Law School
1. Introduction
The corporate form has consistently proven to be a superior method of
business organization. Great industrial economies have grown and prospered
where the corporate legal structure has been prevalent. This organizational
form, however, has not existed and served without flaw. The multiple problems
arising out of the fundamental agency nature of the corporate relationship have
continually hindered its complete economic effectiveness. Where ownership and
management are structurally separated, how does one assure effective
operational efficiencies? Traditionally, the solution lay in the establishment of a
powerful monitoring intermediary Ñ the board of directors, whose primary
responsibility was management oversight and control for the benefit of the
residual equity owners. To assure an effective agency, traditionally, the board
was chosen by and comprised generally of the businessÕs largest shareholders.
Substantial shareholdership acted to align board and shareholder interests to
create the best incentive for effective oversight. Additionally, legal fiduciary
duties evolved to prevent director self dealing, through the medium of the duty of
loyalty, and to discourage lax monitoring, through the duty of care. No direct
compensation for board service was permitted.1 By the early 1930's, however, in
the largest public corporations, the board was no longer essentially the

dominion of the companyÕs most substantial shareholders.
The early twentieth century witnessed not only the phenomenal growth of
the American economy, but also the growth of those corporate entities whose
activities comprised that economy. Corporations were no longer local ventures
owned, controlled, and managed by a handful of local entrepreneurs, but instead
had become national in size and scope. Concomitant with the rise of the
large-scale corporation came the development of the professional management
class, whose skills were needed to run such far-flung enterprises.1 And as the
capitalization required to maintain such entities grew, so did the number of
individuals required to contribute the funds to create such capital. Thus, we saw
1Coincident with the rise of a new managerial class, was the development of an educationalsystem to train this group. The creation of the modern business school and collegiate businesscurriculum was a response to the need for the professional manager. A history of theColumbia University Graduate School of Business written in 1954 details this phenomenon:
In the Wharton school, before the nineteenth century ended, business education beganto shift in interest and emphasis from the general to the special, from the speculative to thepractical, to the scientific, to the professional.
The remarkable spread of collegiate business education during the last forty years isnot difficult to explain. It has been part and parcel of the growth and expansion of Americaneconomic activity. The increase in the number, in the size, and the complexity of businessenterprises has given rise to progressive needs for better means and methods of supervisionmanagement, and control, as well as for highly specialized services designed to meet therequirements created by the division and the diversification of functions of the individualenterprise. Among all the needs of the business world, none has given greater concern than theneed for a high grade of managerial personnel, competent to analyze problems as they ariseand competent to cope with them promptly and successfully.
The main tasks of schools of business are (1) the training of technicians infundamentals recognized as measurably common to a variety of businesses; and (2) thedeveloping, in a carefully selected group of students, of an awareness of factors underlyingpolicy and planning in business enterprise requiring the exercise of managerial responsibilityand judgment.THURMAN W. VAN METRE, A HISTORY OF THE GRADUATE SCHOOL OF BUSINESS COLUMBIA UNIVERSITY
6, 7, 9 (1954).
the rise of the large-scale public corporation Ñ owned not by a few, but literally
thousands and thousands of investors located throughout the nation. And with
this growth in the size and ownership levels of the modern corporation,
individual shareholdings in these ventures became proportionally smaller and
smaller, with no shareholder or shareholding group now owning enough stock
to dominate the entity. Consequently, the professional managers moved in to fill
this control vacuum. Through control of the proxy process, incumbent
management nominated its own candidates for board membership. The board of
directors, theoretically composed of the representatives of various shareholding
groups, instead was comprised of individuals selected by management. The
directors' connection with the enterprise generally resulted from a prior
relationship with management, not the stockholding owners, and they often had
little or no shareholding stake in the company.2
Berle and Means, in their path-breaking book The Modern Corporation and
Private Property, described this phenomenon of the domination of the large
public corporation by professional management as the separation of ownership
2See Elizabeth MacIver Neiva, Are Directors Overpaid? What History Tells Us AboutCompensation, in DIRECTORSHIP -- SIGNIFICANT ISSUES FACING DIRECTORS 2-6 (1996), Elson, DirectorCompensation, supra note 1, at 131.
and control.3 The firm's nominal owners, the shareholders, in such companies
exercised virtually no control over either day-to-day operations or long-term
policy.4 Instead control was vested in the professional managers who typically
owned only a very small portion of the firm's shares.5
One consequence of this phenomenon identified by Berle and Means was the
filling of board seats with individuals selected not from the shareholding ranks,
but chosen instead because of some prior relationship with management.
Boards were now comprised either of the managers themselves (the inside
directors) or associates of the managers, not otherwise employed by or affiliated
with the enterprise (the outside or non-management directors). This new breed of
outside director often had little or no shareholding interest in the enterprise and,
as such, no longer represented their own personal financial stakes or those of the
other shareholders in rendering board service. However, as the shareholders'
legal fiduciaries, the outside directors were still expected to expend independent
time and effort in their roles, and, consequently, it began to be recognized that
3See ADOLF A. BERLE & GARDINER C. MEANS, THE MODERN CORPORATION AND PRIVATE PROPERTY
(1932).
4See id. at 3-6.
5See id.

they must now be compensated directly for their activities.6
The consequences of this shift in the composition of the board was to
exacerbate the agency problem inherent in the corporate form. Without the direct
economic incentive of substantial stock ownership , directors, given a natural
loyalty to their appointing party and the substantial reputation enhancement
and monetary compensation board service came to entail, had little incentive
other than their legal fiduciary duties to engage in active managerial oversight.
It may also be argued that the large compensation received for board service may
have actually acted as a disincentive for active management monitoring, given
management control over the director appointment and retention process.
Since the identification of this phenomenon, both legal and finance
theorists have struggled to formulate effective solutions. Numerous legal reforms
have been proposed, often involving such acts as the creation of the professional
Òindependent director,Ó7 the development of strengthened board fiduciary
6See generally Elson, supra note 1.
7 See Ronald J. Gilson & Reinier Kraakman, Reinventing the Outside Director: An Agenda forInstitutional Investors, 43 STAN. L. REV. 863, 883-92 (1991) (calling for institutional investors toorganize a core of professional directors who would sit on corporate boards to ensure effectivemanagement); Jayne W. Barnard, Institutional Investors and the New Corporate Governance, 69N.C. L. REV. 1135, 1168-73 (1991) (recommending that institutional investors sit on thecorporate boards to oversee daily activity); George W. Dent, Jr., Toward Unifying Ownership andControl in the Public Corporation, 1989 WIS. L. REV. 881, 896 (1989) (encouraging the use ofprofessional directors to supervise day-to-day operations).

duties,8 or the stimulation of effective institutional shareholder activism.9 All, it
8 Professor Cox has argued for the application of a stronger, more rigorous duty of care. See James D. Cox, Compensation, Deterrence, and the Market as Boundaries for Derivative SuitProcedures, 52 GEO. WASH. L. REV. 745, 762- 63 (1984). Other commentators suggested similarapproaches. See, e.g., Stuart R. Cohn, Demise of the Director's Duty of Care: Judicial Avoidance ofStandards and Sanctions Through the Business Judgment Rule, 62 TEX. L. REV. 591, 595 (1983)(proposing a standard of reasonable care so that Òthe business judgment rule would resumeits historical basis as a protection against hindsight evaluation of erroneous decisions, butwould shed its protective role as a shield for all director action in the absence of fraud or otherillegal behaviorÓ).
9Indeed, much scholarly attention has been devoted to the ÒpromiseÓ of Òinstitutional investorvoice.Ó Bernard Black, Agents Watching Agents: The Promise of Institutional Investor Voice , 39UCLA L. REV. 811, 816 (1992). See generally ROBERT A.G. MONKS & NELL MINOW, POWER AND
ACCOUNTABILITY 73-79 (1991) (noting that institutional investors closely monitor boardsbecause of their desire to increase portfolio values and avoid Òliability for breach of fiduciarydutyÓ); Jayne W. Barnard, Institutional Investors and the New Corporate Governance, 69 N.C. L.REV. 1135, 1135 (1991) (examining the concept of shareholder advisory committees and theappropriate role of institutional investors in corporate governance); Bernard S. Black, The Valueof Institutional Investor Monitoring: The Empirical Evidence, 39 UCLA L. REV. 895 (1992)(discussing the benefits institutional oversight could have on corporate performance); RichardM. Buxbaum, Institutional Owners and Corporate Managers: A Comparative Perspective , 57 BROOK
L. REV. 1 (1991) (analyzing the transnational effects of institutional investments); John C.Coffee, Jr., Liquidity Versus Control, The Institutional Investor As Corporate Monitor, 91 COLUM. L.REV. 1277 (1991) (discussing the efficiency and development of institutional investors in theUnited States); Alfred F. Conard, Beyond Managerialism: Investor Capitalism?, 22 U. MICH. J.L.REFORM 117 (1988) (discussing the motivations of institutional investors and the prospectiveconsequences of investor activism); George W. Dent, Jr., Toward Unifying Ownership and Controlin the Public Corporation, 1989 WIS. L. REV. 881, 881 (1989) (analyzing the separation ofownership control and offering a solution to corporate governance); Ronald J. Gilson & ReinierKraakman, Reinventing the Outside Director: An Agenda for Institutional Investors, 43 STAN. L.REV. 863, 863 (1991) (proposing a strategy for improving corporate governance throughincreased activity on the part of the institutional investors); Louis Lowenstein, WhyManagements Should (And Should Not) Have Respect for Their Shareholders, 17 J. CORP. L. 1 (1991)(advising corporations on the proper relationships with shareholders); Thomas C. Paefgen,Institutional Investors Ante Portas: A Comparative Analysis of an Emergent Force in CorporateAmerica and Germany, 26 INT'L LAW. 327 (1992) (suggesting that long-term financial strategiesof institutional investors will increase effective board monitoring in American and Germancorporations); Edward B. Rock, The Logic and (Uncertain) Significance of Institutional ShareholderActivism, 79 GEO. L.J. 445 (1991) (analyzing the significance of increased shareholder activism);Robert D. Rosenbaum, Foundations of Sand: The Weak Premises Underlying the Current Push forProxy Rule Changes, 17 J. CORP. L. 163 (1991) (addressing the underlying premise on calls forproxy reformation). For a contrary view on the effectiveness of institutional shareholderactivism, see D. Gordon Smith, Corporate Governance and Marginal Incompetence: Lessons fromKmart, 74 N.C. L. REV. 1037 (1996).

seems have proven ineffective, as the passive board still flourishes.
Shareholders, mindful of disasters at General Motors, IBM, AT&T,
Archer-Daniels-Midland, W.R. Grace, and Morrison Knudsen, are keenly aware
of this problem.10 Yet the solution may be simple and obvious. Traditionally,
10 The effects of a derelict board are evidenced by the recent fortunes at a number ofwell-known American companies. The recent turmoil at General Motors, IBM, AT&T,Archer-Daniels-Midland, W.R. Grace, and Morrison Knudsen demonstrates the consequencesof an inattentive board. Throughout its history, the GM Board was typically beholden to GMmanagement with board meetings being little more than social gatherings in which the CEO'sagenda was approved. After a long, steady decline during which GM's share of the Americancar market dropped from 52% to 35%, the GM Board finally took affirmative steps to improvethe company's performance, including firing GM's CEO Robert Stempel. See John Greenwald,What Went Wrong?, TIME, Nov. 9, 1992, at 42, 44; see also Dana W. Linden et al., The CossetedDirector, FORBES, May 22, 1995, at 168; Kathleen Day, GM's Move Symbolizes Wider Fight, WASH.POST, Oct. 27, 1992, at Al (noting that Òboards typically have been captive to the wishes of thecompany chairman,Ó but that pressure has been mounting on the boards to assume a moreproactive stance in the fulfillment of their duties).
In January 1993, IBM CEO John Akers was forced to resign amid sagging profits andlost market share. Preceding this resignation, IBM saw its worldwide market share drop from30% in 1985 to 19% in 1991, its stock price lose half its value over a six-month period, wasforced to make a 55% cut in its quarterly dividend, and recorded a $4.97 billion loss in 1992. See Carol J. Loomis, King John Wears an Uneasy Crown, FORTUNE, Jan. 11, 1993, at 44; Michael W.Miller & Laurence Hooper, Signing Off: Akers Quits at IBM Under Heavy Pressure; Dividend IsSlashed; Outsiders Will Lead Search for New Chief Executive to Be a ÒChange-master,Ó WALL ST. J.,Jan. 27, 1993, at Al.
In 1997, C. Michael Armstrong replaced Robert Allen as AT&TÕs CEO. Hisappointment ended a year-long search that paralyzed the company at such a critical juncture. AT&T had problems replacing Robert Allen because he refused to specify exactly when hewould step down. Many of AT&TÕs top executives left for better offers and because it wasclear that they would never become CEO. During AllenÕs stormy nine-year tenure, AT&T lostmarket share, eliminated over 100,000 jobs, incurred billions of dollars in losses, and itsdirectors were criticized as one of the most passive boards in corporate America. See John a.Byrne, AT&T: How To Turn A Dud into A Dynamo, BUS. WK., Dec. 8, 1997, at 95; Peter Coy,AT&T Faces Hard Calls, BUS. WK., Sept. 2, 1996, at 40; John J. Keller, Outside In: How AT&TDirectors Decided It Was Time for Change at the Top, WALL ST. J., Oct. 20, 1997, at A1; MichaelMeyer, AT&TÕs New Operator? The Long Search for the Next Chief May Be Over, NEWSWEEK, Oct.27, 1997, at 47; Shaifali Puri, Pay for Underperformance: The Problem with Stock Options, FORTUNE,Dec. 8, 1997, at 52; Fred Vogelstein, In Telecom, Bigger May No Longer Be Better; Joseph NacchioLeft a Top Job at AT&T for an Upstart. It Has Turned out to Be A Step Up, U.S. NEWS & WORLD
REPORT, Nov. 17, 1997, at 64.Following a shareholder revolt resulting from damaging disclosures relating to a federal

antitrust investigation of the company, the Archer-Daniels-Midland board of directors inOctober 1995 announced that it would form a corporate governance committee consisting ofseveral present board members to recommend possible changes in board structure. Angryinstitutional shareholders had withheld their votes for reelecting the board--resulting in boardmembers being reelected with only 80% of the total vote. See Archer-Daniels Faces Informal SECInquiry into Executive Pay, WALL ST. J., Oct. 10, 1995, at C18; Thomas M. Burton & RichardGibson, ADM Director Ross Johnson Spouts Off on FBI Inquiry, Whitacre and Forgery, WALL ST. J.,Oct. 12, 1995, at A4; Kurt Eichenwald, A Shareholder Rebellion: Investors Demand Answers fromArcher-Daniels, N.Y. TIMES, Oct. 19, 1995, at D1; Kurt Eichenwald, Cheers, and Boos, atArcher-Daniels Meeting, N.Y. TIMES, Oct. 20, 1995, at D2; Joann S. Lublin, Is ADM's Board TooBig, Cozy and Well Paid?, WALL ST. J., Oct. 17, 1995, at B1.
The governance committee recommended that the size of the board be reduced from itscurrent size of 17 members to between 9-15 members and that a majority of the boardmembers be outside directors. The committee defined an outside director as someone Òwho isnot a current or former Archer-Daniels executive, has no material business or professionalrelationship with the company, has no close family relationship with the company'smanagement and is not receiving compensation from the company other than as a director.Ó Kurt Eichenwald, Shift by Company Will Bring in More Outsiders, N.Y. TIMES, Jan. 16, 1996, atD1. The committee also proposed a mandatory age 70 board retirement policy. Id. Additionally, the committee recommended that the directors' pension plan be eliminated andthe board members be compensated 50% in company stock. Id.
On March 2, 1995, it was reported that J.P. Bolduc, W.R. Grace's president and CEO,had abruptly resigned following a long dispute with the former company chairman, PeterGrace. It had been alleged that Grace and his son had received substantial stipends from thecompany in addition to their regular salaries. Grace himself, in addition to his monthlyconsulting fee of $50,000, received $165,000 annually for nursing care, $200,000 for securityguards, $30,000 for a full-time cook, and $74,500 to maintain a New York apartment largelyfor his family's personal use. Later, pressure from institutional shareholders forced thecompany to announce substantial changes in the structure of its board, including a reductionof the board's size, an age limit of 70 for directors, and the inclusion of six new outsidedirectors. See PR NEWSWIRE, Feb. 2, 1995; PR NEWSWIRE, Mar. 2, 1995; James P. Miller et al., BadChemistry: W.R. Grace Is Roiled by Flap Over Spending and What to Disclose, Departed CEO MakesIssue of the Chairman's Perks, Son's Use of Grace Funds, WALL ST. J., Mar. 10, 1995, at Al; Joann S.Lublin, Attempts to Banish Harassment Reach into Executive Suite, Action on Grace CEO ReflectsFirms' Greater Willingness to Oust High Officials, WALL ST. J., Mar. 31, 1995, at B4.
In 1992, Morrison Knudsen's chairman William Agee announced that he wanted to turnthe construction company into a rail-car maker. The effort initially seemed successful;however, one year later, in July 1994, the company announced an unexpected second-quarterloss of $40.5 million and disclosed delays with various construction projects as well as withtesting and delivery of new rail-cars. In early 1995, the company announced that it expected asubstantial loss for 1994, was in default on its loan agreements, and would eliminate itsdividend. Agee was then relieved of his duties, and it was disclosed that he had attempted torun the Boise, Idaho-based company from his Pebble Beach, California estate, flying incorporate vice presidents for weekly briefings. His 1993 compensation of $2.4 millionamounted to 6.8% of MK's net income; the $4 million spent on Mr. Agee's jet equaled 13% ofthe general and administrative budget. Board resignations followed and eventually the entire
directors, as large shareholders, had a powerful personal incentive to exercise
effective oversight. It was the equity ownership that created an effective agency.
To recreate this powerful monitoring incentive, directors must become
substantial shareholders once again. This is the theoretical underpinning
behind the current movement toward equity-based compensation for corporate
directors. The idea is to reunite ownership and control through meaningful
director stock ownership and hence better management monitoring.11
Underpinning this theory, however, is the assumption that equity ownership by
directors does in fact create more active monitoring. In this paper, we attempt to
demonstrate empirically a link between significant outside director stock
board was replaced. See Carrie Dolan, Morrison Knudsen Rail Plans Hurt by Unexpected Loss,WALL ST. J., July 20, 1994, at A14; Joann S. Lublin, Five More Big Companies to Stop GivingPensions to Outside Members of Boards, WALL ST. J., Feb. 12, 1996, at A2; Morrison Knudsen Pact,WALL ST. J., Oct. 27, 1993, at B14; Morrison Knudsen Gets Contract, WALL ST. J., Dec. 21, 1993, atC24; Joan E. Rigdon, William Agee Will Leave Morrison Knudsen, WALL ST. J., Feb. 2, 1995, at B1.
11
For a full history and discussion of this theory, see Charles M. Elson, The Duty of Care,Compensation, and Stock Ownership, 63 U. CIN. L. REV. 649 (1995); Charles M. Elson, ExecutiveOvercompensation--A Board-Based Solution, 34 B.C. L. REV. 937 (1993); Charles M. Elson,Shareholding Directors Create Better Corporate Performance, ISSUE ALERT, May 1996, at 3; CharlesM. Elson, Shareholding Directors Create Better Corporate Performance, in DIRECTORSHIP--SIGNIFICANT
ISSUES FACING DIRECTORS 7-1 (1996); Charles M. Elson, Major Shifts Seen in Director Pay, CORP.GOVERNANCE ADVISOR, May-June 1996, at 1; Charles M. Elson, The Director as Employee ofManagement, DIRECTORS & BOARDS, Spring 1996, at 34; Charles M. Elson, Shareholding Non-Executives Should Limit Excessive Directors' Pay, FIN. TIMES, July 28, 1995, at A2; Charles M.Elson, Manager's Journal: Board Pay Affects Executive Pay, CORP. BOARD, Mar.-Apr. 1994, at 7;Charles M. Elson, Manager's Journal: A Board-Based Solution to Overpaid CEOs, WALL ST. J., Sept.27, 1993, at A22; Charles M. Elson, Director- Owners Can Lower High Pay, N.Y. TIMES, July 18,1993, at F15; see also Dennis C. Carey et al., How Should Directors Be Compensated?, DIRECTORS &BOARDS, Special Report No. 1, 1996.
ownership, effective monitoring and firm performance.
The primary responsibility of the corporate board of directors is to engage,
monitor, and, when necessary, replace company management. The central
criticism of many modern public company boards has been their failure to
engage in the kind of active management oversight that results in more effective
corporate performance. It has been suggested that substantial equity ownership
by the outside directors creates a personally-based incentive to actively monitor.
An integral part of the monitoring process is the replacement of the CEO when
circumstances warrant. An active, non-management obligated board will
presumably make the necessary change sooner rather than later, as a poorly
performing management team creates more harm to the overall enterprise the
longer it is in place. On the other hand, a management dominated board,
because of its loyalty to the company executives, will take much longer to replace
a poor performing management team because of strong loyalty ties.
Consequently, it may be argued that companies where the CEO is replaced
expeditiously in times of poor performance may have more active and effective
monitoring boards than those companies where ineffective CEOÕs remain in
office for longer periods of time. An examination, therefore, of the equity-holding
positions of the outside directors of the companies where CEO succession occurs
more expeditiously and those where it does not, should provide some evidence
of the effect of equity ownership on management monitoring by outside
directors.12
The remainder of the paper is organized as follows: The next section
describes our sample and data for stock-ownership and compensation of board
members as a group, and performance measures for our sample firms. Section
three considers determinants of stock and stock option compensation for board
members. Section four discusses the relation between director stock ownership
and firm performance. Section five considers the relation between firm
performance and CEO turnover. The subsequent section provides evidence on
the impact of director ownership and firm performance on CEO turnover. The
final section discusses some policy implications.
2. Sample and Data
A sample of about 1700 publicly-held U.S. companies was obtained from
S&PÕs Execucomp database. This sample consists of the S&P 500 firms (for 1995),
the S&P mid-cap 400 firms (for 1996), and the S&P small-cap 600 firms (for 1996).
Table 1 provides summary statistics on director compensation and
12Two reports recently released by the National Association of Corporate Directors recognizethe importance of director equity ownership and management monitoring. See NATÕL ASSÕN OF
CORP. DIRECTORS, REPORT OF THE NACD BEST PRACTICES COUNCIL: COPING WITH FRAUD AND OTHER
ILLEGAL ACTIVITY (1998); NATÕL ASSÕN OF CORP. DIRECTORS, REPORT OF THE NACD BLUE RIBBON
COMMISSION ON CEO SUCCESSION (1998).

company size for the sample firms. The average annual director cash
compensation (retainer) for our entire sample of 1724 U.S. companies is $16,300
for 1992, and increases to $18,300 in 1996.
The extant literature notes that firm-size is a significant determinant of
CEO compensation, for example, see Jensen and Murphy (1990); hence it is
possible that firm-size is also a significant determinant of director
compensation.13 We decided to partition our sample by firm-size: large, medium,
and small-size firms. We partitioned our sample of 1724 firms into roughly three
groups by firm-size (sales); firms in the top-third of sales were classified as large
companies, and firms in the bottom-third of sales were classified as small
companies. For 1996, firms with sales less than $0.5 billion were classified as
small; firms with sales between $3.2 and $160 billion were classified as large.
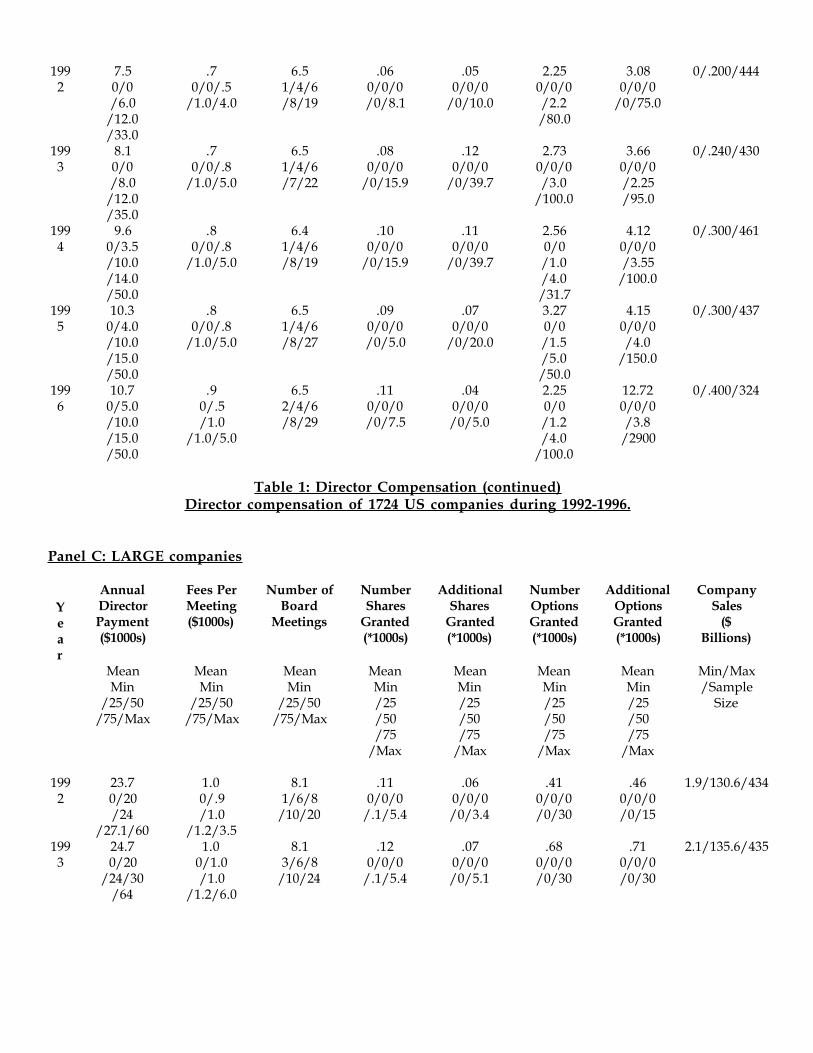
The annual director cash compensation has experienced a secular
increase during 1992-1996 for small and large firms. For small firms the cash
compensation increased from $7,500 in 1992 to $10,700 in 1996. For large firms
the cash compensation increased from $23,700 in 1992 to $26,700 in 1996. As
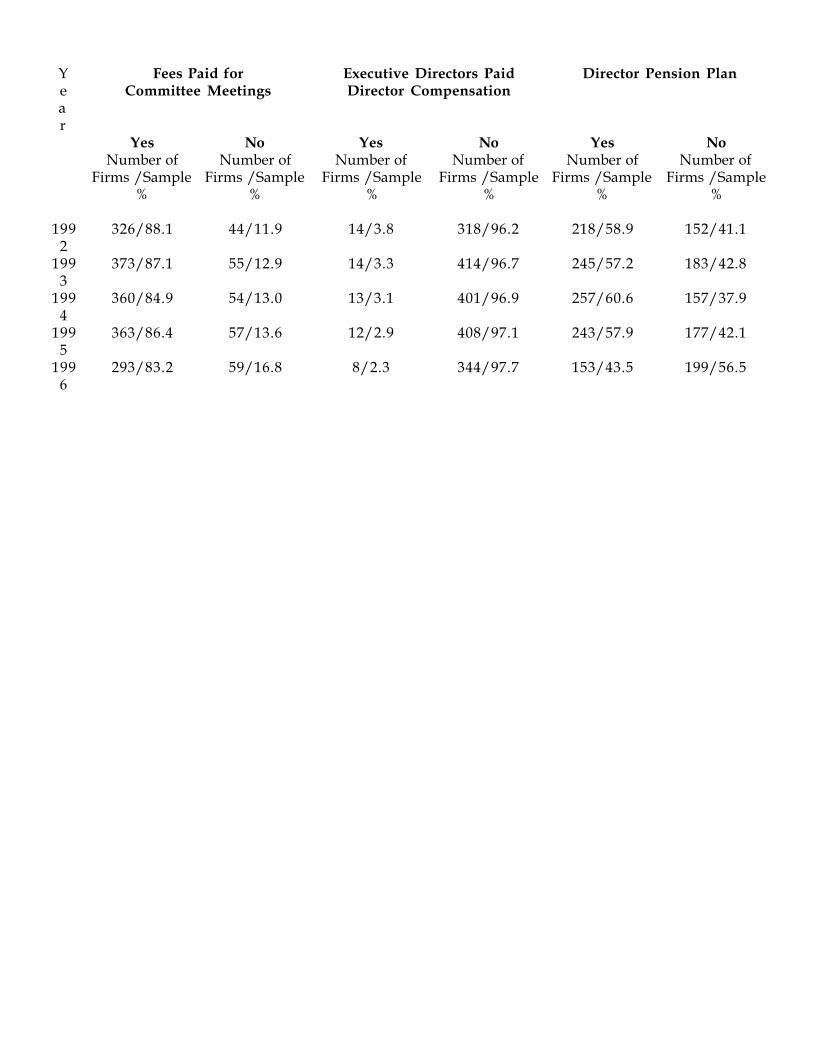
Table 2 indicates, about 78 percent of our sample companies pay their directors
additional cash compensation for attending various board and committee
13 M.C. Jensen and K.J. Murphy, "Performance Pay and Top-Management Incentives," Journal ofPolitical Economy 98, 1990, 225-264.

meetings. The small companies have increased their per meeting cash
compensation from $700 per meeting in 1992 to $900 per meeting in 1996 (Table
1, Panel B). This cash compensation per meeting for large firms has stayed about
the same Ð at $1,000 per meeting during 1992-1996 (Table 1, Panel C). The
number of board meetings for our sample firms has stayed roughly constant at
7.2 meetings per year during 1992-1996; small firms have less board meetings
(6.5 per year) than large firms (8.1 per year) (Table 1).
Equity-based compensation is a feature of many board-compensation
plans. The number of shares granted to a director has increased from 70 shares
in 1992 to 120 shares in 1996 for our entire sample (Table 1, Panel A). For small
firms, the number of shares granted doubled from 60 shares in 1992 to 110
shares in 1996. For large firms, the number of shares granted has increased from
110 shares in 1992 to 240 shares in 1996.
The number of stock-options granted to directors is significantly more than
number of shares granted. The number of stock-options granted has increased
from 1,550 in 1992 to 2,220 in 1996 for all firms in our sample (Table 1). The
number of options granted to small-firm directors has remained roughly
constant at 2,250 stock-options. The number of stock-options granted to
large-firm directors has more than doubled from 410 stock-options in 1992 to
1,030 in 1996.
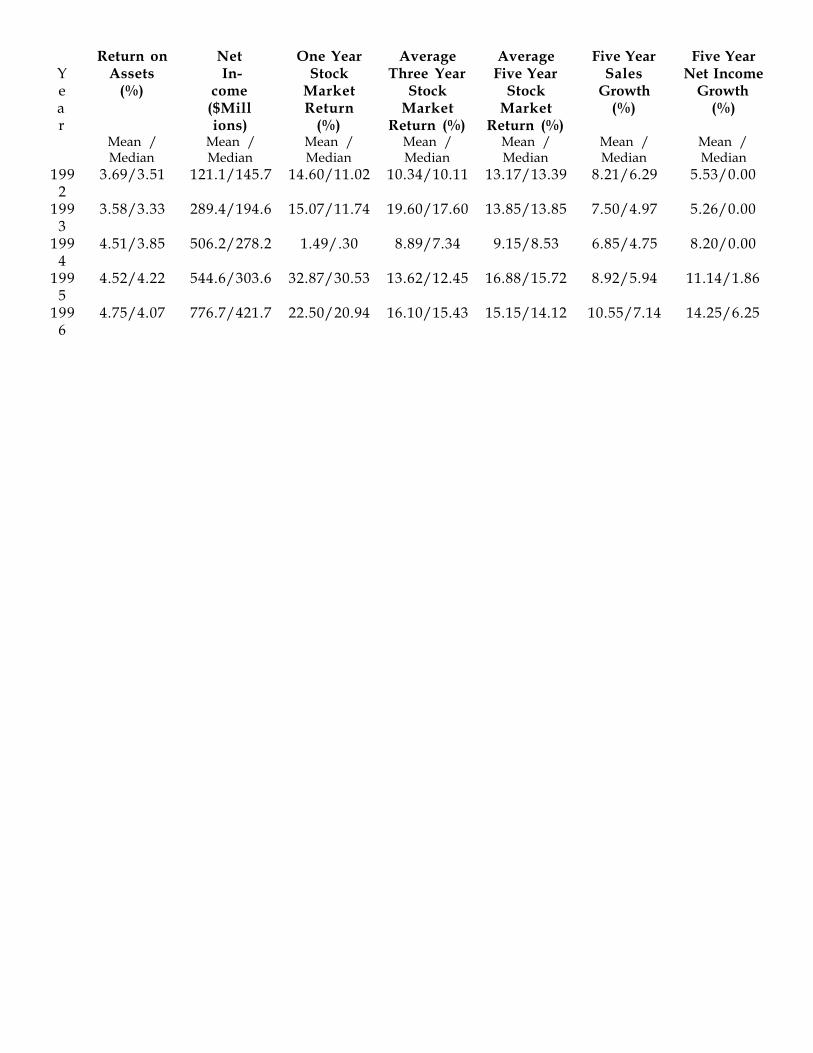
Table 3 details the summary statistics of the financial performance
measures of our sample firms. The return on assets, ROA, of our sample firms
has stayed roughly constant at 4% during 1992-1996. The return on assets is
generally smaller for small-firms compared to large-firms.
The average annual stock-market returns for our sample firms is 21.64%
for 1992, 25.21% for 1993, 0.97% for 1994, 29.76% for 1995, and 19.36% for 1997.
These returns are rather high compared to historical norms in the U.S. stock
market, but reflect the 1990s bull market in the U.S. The average five-year
stock-market return is 9.89% for small-firms compared to 15.15% for large-firms.
The higher stock-market return and ROA for large-firms vis-�-vis small firms is
different from the historical comparative experience of large and small firms in
the U.S. Historically, returns on small firms are generally higher than large firms;
for example, see Fama and French (1992).14
3. Determinants of Director Compensation
As noted above, firm-size appears to be a determinant of director
compensation. Jensen and Murphy (1990) have argued that stock-ownership is
quite important in aligning the incentives of managers with that of shareholders,
14 E.F. Fama and K.R. French, ÒThe cross-section of expected stock returns,Ó 1992, Journal ofFinance 47, 427-466.

and increasing the pay-for-performance sensitivity. An impressive set of recent
papers suggest that stock-options might be even more relevant in aligning the
incentives of managers with that of shareholders Ð see Hall and Liebman (1997),
Baber, Janakiraman and Kang (1996), and Berger and Ofek (1997).15
Table 4, Panel A, summarizes regression results where the dependent
variable is 1 if the company grants some shares to each director, and 0 otherwise.
(Results of logit regression, not reported, are qualitatively identical.)
¥ The results suggest that for each of the years, 1992-1996, large companies are more
likely to compensate their directors with shares than small companies.
¥ Also, for the years 1994, 1995, and 1996, there is a negative relation between
granting of shares and the companyÕs stock-market returns during the current
and two previous years. This suggests that during 1994, 1995, and 1996 Ð companies
that underperformed the stock-market were more likely to grant shares to their directors.
¥ Interestingly, there is no relation between granting of shares to directors in any of
15 W. R. Baber, S. N. Janakiraman, and S. Kang, ÒInvestment Opportunities and the Structureof Executive Compensation,Ó 1996, Journal of Accounting & Economics 21, 297-318. P. G. Bergerand E. Ofek, ÒCauses and Effects of Corporate Refocusing Programs,Ó 1997, University ofPennsylvania working paper. B. J. Hall and J. B. Liebman, ÒAre CEOs Really Paid LikeBureaucrats?Ó 1997, Harvard University working paper.

the years 1992-1995 and subsequent stock-performance of the company.16
¥ Finally, we consider the relation between a companyÕs growth opportunities
and granting of shares to directors. We measure a companyÕs growth
opportunities as the ratio of the market value of the companyÕs stock divided by
the book value of the companyÕs stock.17 We find no significant relationship
between granting of shares to directors and a companyÕs growth opportunities.
Table 4, Panel B, summarizes regression results where the dependent
variable is 1 if the company grants some stock options to each director, and 0
otherwise.
¥ The results suggest that for each of the years, 1992-1996, large companies are less
likely to compensate their directors with stock options than small companies.
¥ There is no consistent and significant relation between the companyÕs
16Efficient market considerations would suggest no relation between future stock returns andany current observable event, such as, granting of shares to directors. An efficient marketwould impound the value consequences of such events, in this case Ð granting of shares, andincorporate them into the share price at the time the stock-market participants were first madeaware of this event. We will also consider accounting performance measures, to partiallyaddress this concern.
17The literature suggests many more sophisticated ways of measuring a companyÕs growthopportunities. However, evidence in Gaver and Gaver (1993), and Baber, Janakiraman andKang (1996) suggests that our simple measure is not much inferior, if at all, to the moresophisticated measures. W. R. Baber, S. N. Janakiraman, and S. Kang, id. J. Gaver and K.Gaver, ÒAdditional evidence on the association between the investment opportunity set andcorporate financing, dividend, and compensation policies,Ó 1993, Journal of Accounting andEconomics 16, 125-160.
stock-market returns during the current and two previous years and whether or
not the company grants stock options to its directors.
¥ There is a positive relation between granting of stock options to directors
during 1992 and 1993 and subsequent stock-performance of the company.
However, such a relation is not observed for 1994, 1995, or 1996.
¥ Finally, we find a significant positive relationship between granting of stock
options to directors and a companyÕs growth opportunities. In other words,
companies that have more growth opportunities are more likely to include stock options
in their directorsÕ compensation package. While we observe this result for each of the
years, 1992 through 1996, there is a suggestion in our data that this relationship
is growing stronger with each year, that is, the relationship is stronger for 1993
compared to 1992 and so on. This result is even more interesting given the fact
that we have already controlled for the effect of firm-size.
4. Director Ownership and Company Performance
Table 5 details share ownership (including and excluding options) of all
(4874) the directors in 1993 for 449 US companies. About 200 of these 449
companies are the largest US companies, and the remaining are of smaller size.
Share ownership of these 4874 directors was obtained from the 1994 proxies of
these 449 companies.
Panel A of Table 5 summarizes the share ownership (including options) of
these 4874 directors. The median number of shares owned is 10,000; the mean
number of shares owned is 329,100. Median value of shares owned as percent of
shares outstanding is 0.02%; the mean is 0.57%. These percentage director
holdings are comparable to the findings of other authors, for example, Core,
Holthausen, and Larcker (1998). 18 Also, all of the extant literature on director
ownership and corporate performance has considered the percentage director
holdings as the appropriate measure of director ownership. A central tenet of
this paper is that to the extent that directors care about the dollar value of their
holdings in a company Ð it is the dollar value of the holdings of these directors that
should be used to measure their ownership when considering the relation between
director holdings and company performance. 19 Panel A notes that the median value
of shares owned by these directors is $228,000; the mean value is $10,203,100.
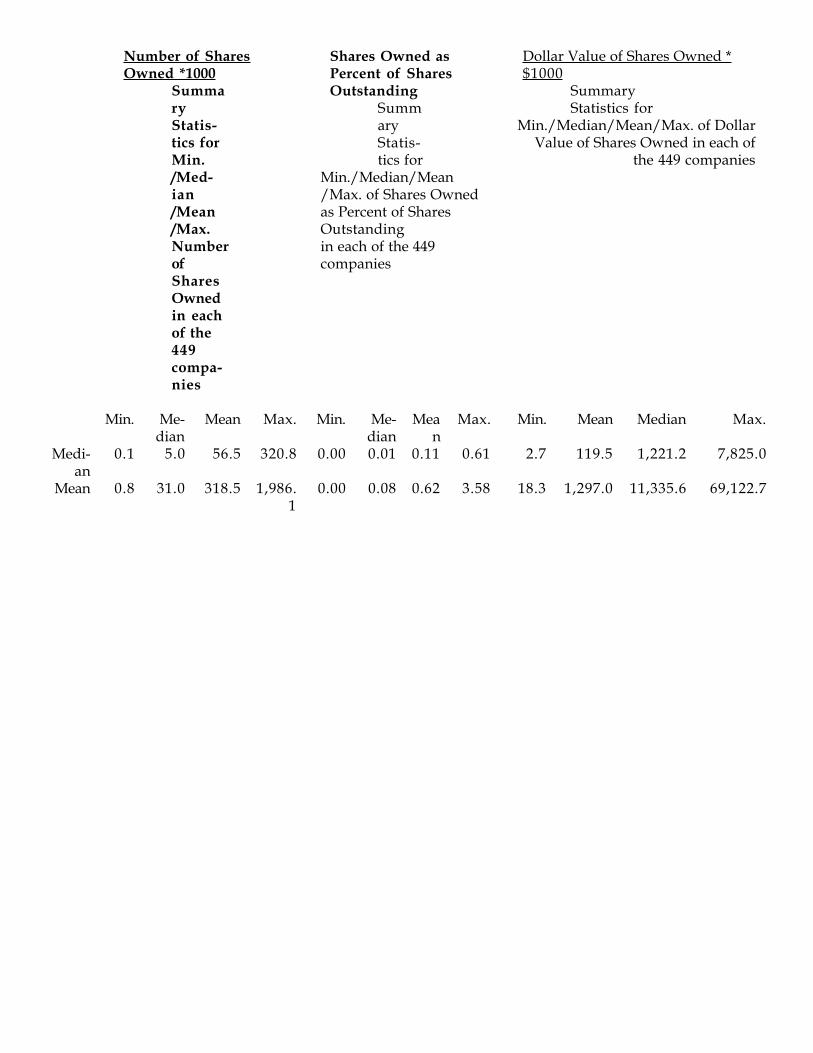
Panel B notes the share ownership excluding options.
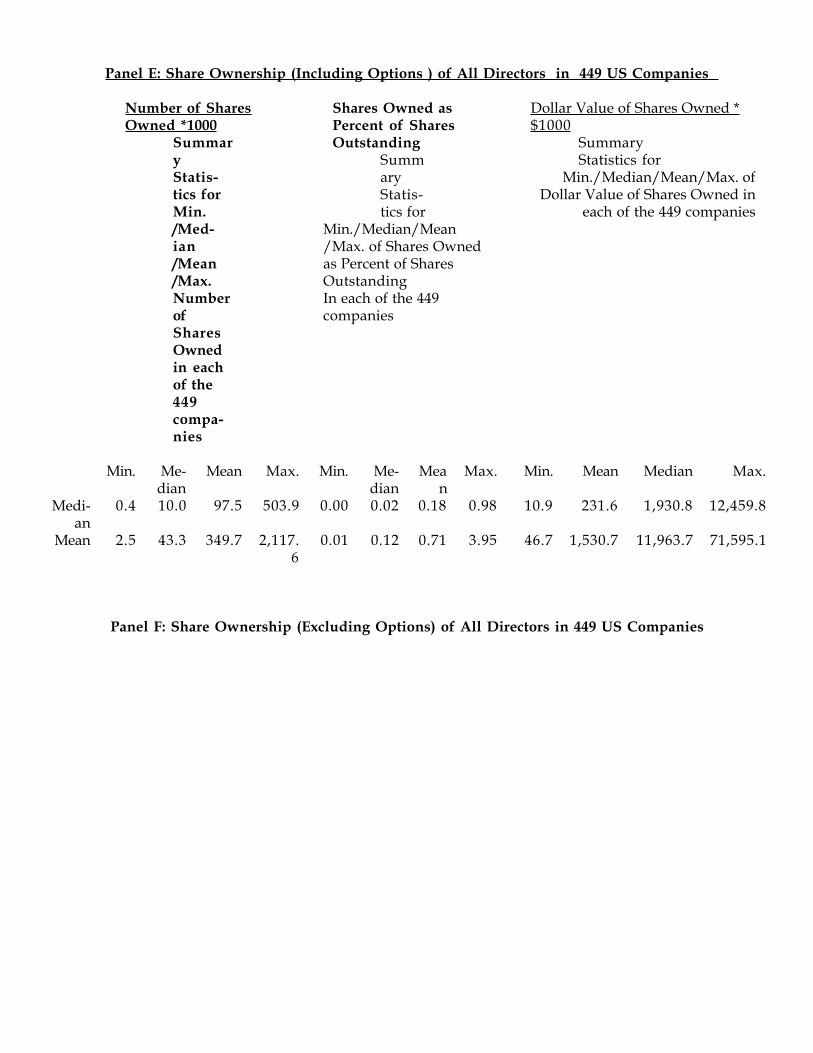
Panel C of Table 5 details share ownership of the median director. The
median director is determined by rank-ordering (from low to high) the number of
18 Core, J.E., Holthausen, R.W., and D.F. Larcker, ÒCorporate Governance, Chief ExecutiveOfficer Compensation and Firm Performance,Ó 1998, Journal of Financial Economics forthcoming.
19 Of-course, percentage ownership of the directors becomes more relevant when consideringcorporate control transactions.

shares owned by all the directors in a particular company, and considering the
share-ownership of the director that can cast the swing-vote to form a majority in
a board. For example, if a board has 11 members, after the directors are ordered
by their share-holdings, the sixth director would be the median director. The
median number of shares owned by the 449 median directors is 10,000; the mean
number of shares owned is 43,400. Median value of shares owned as percent of
shares outstanding is 0.02%; the mean is 0.12%. the median value of shares
owned by these directors is $231,600; the mean value is $1,530,700.
These median director holdings are also noted for small companies (1993
sales of less than $500 million, mid-size companies (1993 sales between $500
million and $3 billion), and large companies (1993 sales greater than $3 billion).
As expected, the median percentage ownership of the median director decreases
from 0.12% for the small companies to 0.02% for the mid-size companies, and
0.003% for the large companies. The median dollar value of shares owned by the
median director decreases from $393,100 for small companies to $252,800 for mid-size
companies, and $153,400 for large companies. Apparently, if we ignore the impact
of a few large holdings, directors on-average have invested more dollars in smaller
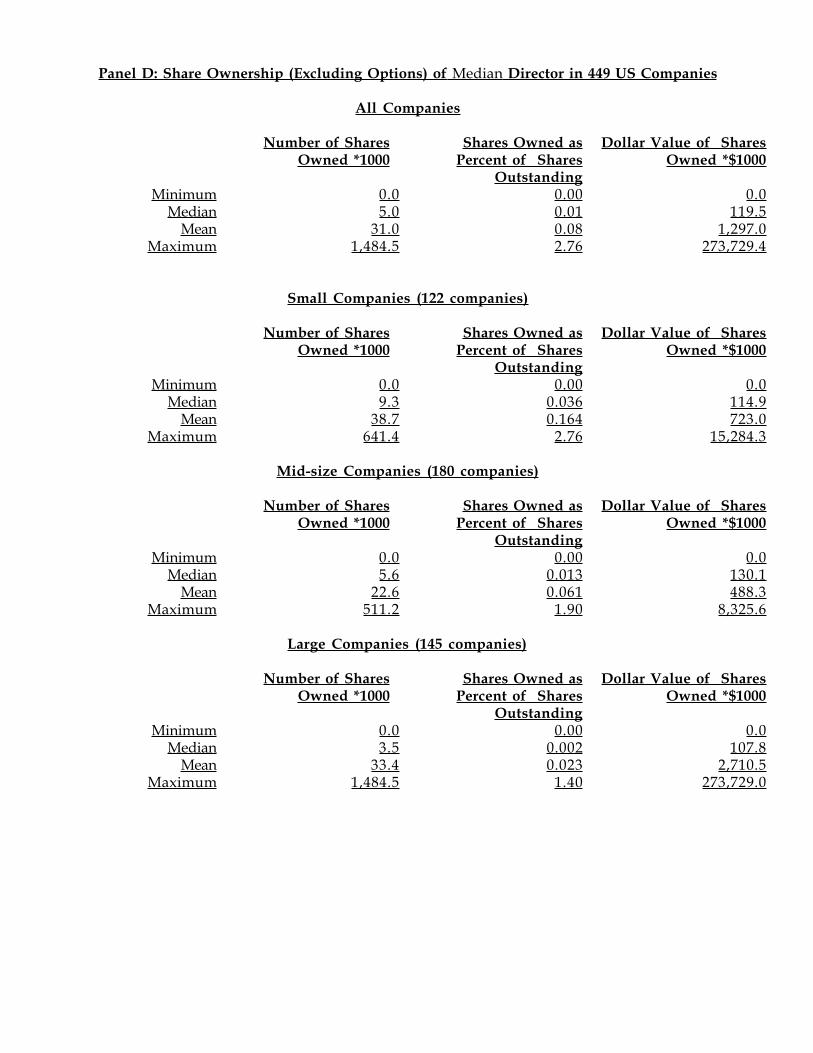
companies than in large companies by more than a factor of two! Panel D details the
share ownership -- excluding options - of the median directors for all companies,
and the companies broken down by size. The median dollar value of shares

owned, not including options, is similar across small, mid-size, and large firms,
and is just over $100,000. This suggests, as our results did in Table 4, that
ownership of options might play a critical role in understanding director
compensation -- especially in smaller companies.
Table 6 presents regression results that relates percentage holding of the
median director, the dollar value of the median director's stock holdings, and
company performance for the 449 companies. Company performance is
measured in four different ways in Panels A, B, C, and D: 3-year growth in
operating income in Panel A, 3-year growth in sales in Panel B, ROE in Panel C,
and stock returns in Panel D. Growth in operating income and growth in sales
are less likely to be correlated with profitability at the firm level; however, across
a large sample of firms, these growth measures should correlate with
profitability.
The first two regressions in each of the Panels A through D consider the
economic determinants of the median director's holdings both as percentage and
dollar value. The third regression considers the relation between the median
director's holdings both as percentage and dollar value and future company
performance; for efficient market reasons noted above, no relation is expected
with future stock return as the measure of performance. The following results
are worth highlighting:
¥ The percentage and the dollar value of the median director's stock-holdings
are less in companies that have a majority of outside directors on their board.
This suggests that share ownership of directors and the composition of board
(outsiders vis-�-vis insiders) are possibly substitute governance/monitoring
mechanisms.
¥ The dollar value of the median director's stock-holdings is positively related to the
company's growth opportunities. There is no relationship between the percentage
of the median director's stock-holdings and the company's growth opportunities.
¥ There is a positive relation between a company's prior performance and the dollar
value of the median director's stock-holdings, for all measures of performance except
growth in operating income. There is no consistent relationship between the
percentage of the median director's stock-holdings and the company's prior
performance.
¥ Finally, there is a positive relation between a company's future sales growth and the
dollar value of the median director's stock-holdings. There is a negative relation
between a company's future sales growth and the percentage of the median
director's stock-holdings. Such a significant relation is not observed for the other
measures of performance.
5. Firm Performance and CEO Turnover

Table 7 indicates that of the 449 companies that we have director
ownership data on, 1162 companies experienced CEO turnover during
19919-1997. News articles from Lexis-Nexis were read to determine probable
cause for the CEO turnover. We are interested in CEO turnover as a result of
disciplinary action initiated by the board related to poor performance. The
Appendix contains two news articles each for CEO turnover classified as
"retired," "older than 63," "resigned," and "no reason given." These news articles
suggest that CEO turnover associated with "resigned" and "no reason given" are
more likely to be disciplinary. We emphasize that not every CEO turnover in the
"resigned" or "no reason given" category is disciplinary; we cannot be sure of the
disciplinary nature of the turnover in every case because many of the press
releases and news articles are unclear on this issue. Hence, to avoid too much
subjectivity in our analysis, we decided to classify every CEO turnover
associated with "resigned" and "no reason given" as disciplinary. Also, not
every CEO turnover due to retirement is unrelated to possible disciplinary actin.
We are assuming that CEO turnover associated with "resigned" and "no reason
given" and more likely to be disciplinary, whereas CEO turnovers associated with
retirements are less likely to be disciplinary.20
20 In econometric terms: We are biasing our tests in favor of the null hypothesis that CEOturnover, firm performance and board ownership are unrelated.

Table 8 indicates that firm performance measured prior to CEO turnover is
quite poor when the turnover is due to a resignation or no reason is given in the
news article. For example, the average 3-year stock return prior to CEO turnover
classified as ÒresignedÓ or Òno reason givenÓ is 1.5%, compared to 16.7% for
other firms in the same industry that did not experience a CEO turnover during
1991-1997. (The average 3-year stock return prior to CEO resignations is Ð0.4%,
and 5.0% when no reason is given.)
6. Director Ownership, Firm Performance and CEO Turnover
Table 9 summarizes results of logit regressions relating CEO turnover to
dollar value of median directorÕs stock holding, percentage holding of median
director, and company performance for 449 US companies during 1991-1997.
Company performance is measured five different ways, all prior to the turnover
year:
3-year growth in earnings per share
5-year growth in earnings per share
1-year stock return
3-year stock return
5-year stock return.
In Panel A, we consider CEO turnovers where the CEO resigned, or no

reason was given for the CEOÕs departure in the news article. We could consider
the two somewhat different types of CEO turnovers separately, as we do in
Panels B and C; however, this would reduce the sample size for turnover events
in the logit regressions with a potential decrease in statistical significance of the
coefficients. The negative coefficients for Company Performance times log of
Dollar Value of Median DirectorÕs Holdings indicates that as the dollar value of
the median directorÕs holdings increases, given poor prior performance, there is
an increasing probability of observing a disciplinary type CEO turnover. This
result is statistically significant for four of the five firm performance measures:
3-year growth in earnings per share, 1-year stock return, 3-year stock return, and
5-year stock return. The insignificant coefficients for Company Performance times
Percentage Holding of Median Director indicates that as the dollar value of the
median directorÕs holdings increases, given poor prior performance, there is no
systematic change in probability of observing a disciplinary type CEO turnover.
Panels B and C consider CEO resignations, and Òno reason givenÓ
separately. These results while consistent with those reported in Panel A, are
statistically less significant. Panel D only considers the stock ownership of the
directors (Panels A, B, and C include director ownership of stock and options);
these results are consistent with the sign and statistical significance of the
results reported in Panel A.

Table 10 provides summary statistics on CEO turnover, dollar value of
median directorÕs stock holding, percentage holding of median director, and
company performance for 302 companies for which have the requisite data. 2 For
firms with the worst performance (the prior 3-year stock return is less than -10%),
there is a 61% probability of observing a disciplinary CEO turnover, compared to
25% for average performance (the prior 3-year stock return is between Ð10% and
10%), and 17% for good performance (the prior 3-year stock return is greater than
10%). Also, for firms with the worst performance (the prior 3-year stock return is
less than -10%), the median dollar value of the median directorÕs stock holding is
$470,000 when a disciplinary turnover is observed, compared to $300,000 for
such poorly performing firms that experienced no turnover.
The above results suggest that both company performance and the dollar value
of director stock ownership are relevant in understanding CEO turnover in poorly
performing companies. However, percentage ownership of the directors is not a
statistically significant variable in understanding CEO turnover in poorly
performing companies.
7. Policy Implications
The purpose of this paper has been to study the linkage between
significant outside director stock ownership, effective monitoring and firm

performance. Through an examination of the impact of director equity
ownership on general firm performance and, more specifically, CEO turnover in
poor performing enterprises, we sought to understand this linkage. Our results
were consistent with our initial hypothesis of a connection between substantial
director share ownership and better monitoring. First, we found a significant
correlation between the amount of stock owned by individual outside directors
and firm performance (based on a variety of performance measures). Second,
and more important for our analysis, we found that greater the dollar value of
the individual outside director's equity-holdings in the enterprise, the more
likely that one would witness a disciplinary-type CEO turnover in a
poorly-performing company.
As for our first finding, that there appears to be a correlation between
significant director stock ownership and heightened corporate performance, one
explanation for this phenomenon would be that the equity ownership created
better management monitoring on the part of the board and hence improved
results. This would, of course, be consistent with our original hypothesis. There
is, however, an alternative explanation that would counter our initial
conclusion. It might be argued that the directors, possessing insider information
about the company and its prospects, simply, in the case of a successful
operation, increased their individual holdings to take advantage of the

company's anticipated success. This explains the hesitance on the part of the
academic and professional communities to confirm that earlier studies on the
linkage between director equity ownership and corporate performance clearly
demonstrated a linkage between board equity possession and more effective
monitoring.
It is, therefore, our second finding that has the greatest significance for the
future and impact of director equity ownership. The fact that we have observed a
correlation between the dollar amount of a director's personal equity holdings
and the likelihood of a disciplinary-type CEO succession in a poorly performing
company, is consistent with the hypothesis -- that the equity positions of the
outside directors created the kind of heightened awareness among the board of
the impact of an inadequate management team and that led to its early
termination. While the empirical evidence we have gathered strongly suggests
this linkage between substantial director stockholdings and better monitoring,
the anecdotal evidence also seems to confirm our findings. One of the authors of
this study served as a director of a major public corporation which, following a
relatively short period of poor performance, replaced its CEO in a disciplinary
succession. Each outside director at that company was both completely
compensated for his or her service on the board in company stock and was
required to purchase substantial amounts of company equity prior to board
service.21
What then is the significance of our findings? There is a probable
correlation between substantial individual director equity-holding and better
management monitoring. Whether this improved monitoring actually leads to
better corporate performance or simply the replacement of a poorly-performing
management team prior to a fatal consequence to the company's fortunes, should
be the subject of future research. However, our findings lend research support to
the movement for increased director equity ownership and provide the empirical
basis for a board-focused legal reform currently being prepared.
In a recent report, the National Association of Corporate Directors'
(NACD) Best Practices Council on Coping with Fraud and Other Illegal Activity
proposed restructuring the traditional procedurally-based legal duty of care into
a more aspirational equity-centered duty. Following the Delaware Supreme
Court's ruling in Smith v. VanGorkom, while most director-decisionmaking was
entitled to the protection of the business judgment rule, certain procedures were
to be followed by a board to avail itself of that rule's protection. But as most
commentators would agree, these procedures have led not to more effective
management oversight but, instead, to a classic triumph of form over
21 We are referring to the case of Sunbeam Corporation, and the recent CEO turnover in thatcompany.

function--where, although prescribed procedure has been followed,
decisionmaking appears to be little more than staged play-acting, absent critical
engaged oversight. Consequently, the NACD Council suggested a new legal
approach. Independent and disinterested directors with meaningful equity
ownership would be entitled to a presumption that as directors they have acted
as rational economic beings in their own economic interest and have
consequently met their legal duty of care. Therefore, no longer would rote
adherence to judicially-mandated decisionmaking procedures be the norm, but
director decisionmaking and oversight based on proprietary interest--that board
action in what was in the shareholders' best interest would become the rule. The
duty of care for an equity-holding director would hence be more aspirational
than litigation and procedure-centered, as ownership, rather than the threat of
legal action, would create the desired behavior. Central, of course, to this
recommendation is some kind of evidence that substantial director-equity
ownership actually leads to better management monitoring. This paper provides
such evidence.
While a direct causal linkage between director stockholdings and
heightened corporate performance may only be tentatively suggested by our
findings, it is clear that given the results of our CEO turnover analysis, better
management monitoring and substantial board equity ownership are correlated.
Hence, empirical support for the notion of an equity-based director duty of care
has been provided. This is why we believe that our results have such
significance. The linkage between director equity ownership and heightened
management monitoring will provide the basis for much needed reform in the
legal arena governing director behavior. Board equity, we believe, will create the
kind of effective boards that the shareholding public expects and demands.
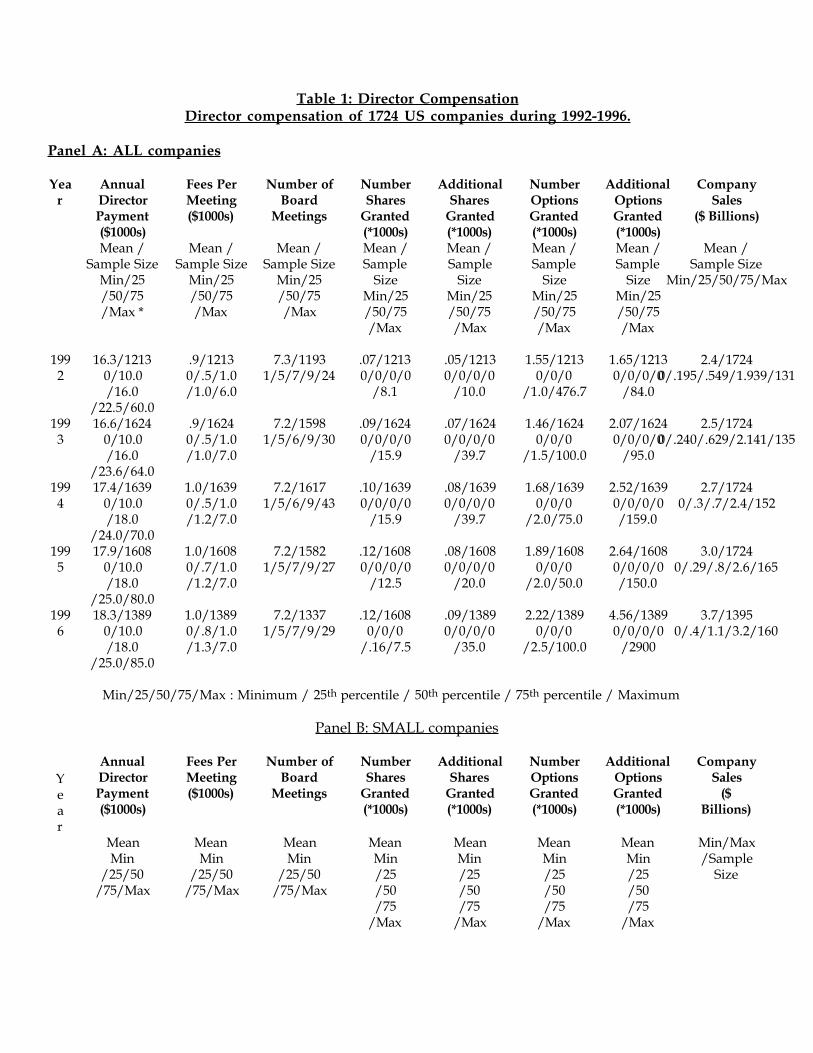
Table 1: Director CompensationDirector compensation of 1724 US companies during 1992-1996.
Panel A: ALL companies
Year
AnnualDirectorPayment($1000s)
Fees PerMeeting($1000s)
Number ofBoard
Meetings
NumberShares
Granted(*1000s)
AdditionalShares
Granted(*1000s)
NumberOptionsGranted(*1000s)
AdditionalOptionsGranted(*1000s)
CompanySales
($ Billions)
Mean /Sample Size
Min/25/50/75/Max *
Mean /Sample Size
Min/25/50/75/Max
Mean /Sample Size
Min/25/50/75/Max
Mean /Sample
SizeMin/25/50/75/Max
Mean /Sample
SizeMin/25/50/75/Max
Mean /Sample
SizeMin/25/50/75/Max
Mean /Sample
SizeMin/25/50/75/Max
Mean /Sample Size
Min/25/50/75/Max
1992
16.3/12130/10.0/16.0
/22.5/60.0
.9/12130/.5/1.0/1.0/6.0
7.3/11931/5/7/9/24
.07/12130/0/0/0
/8.1
.05/12130/0/0/0
/10.0
1.55/12130/0/0
/1.0/476.7
1.65/12130/0/0/0
/84.0
2.4/17240/.195/.549/1.939/131
1993
16.6/16240/10.0/16.0
/23.6/64.0
.9/16240/.5/1.0/1.0/7.0
7.2/15981/5/6/9/30
.09/16240/0/0/0
/15.9
.07/16240/0/0/0
/39.7
1.46/16240/0/0
/1.5/100.0
2.07/16240/0/0/0
/95.0
2.5/17240/.240/.629/2.141/135
1994
17.4/16390/10.0/18.0
/24.0/70.0
1.0/16390/.5/1.0/1.2/7.0
7.2/16171/5/6/9/43
.10/16390/0/0/0
/15.9
.08/16390/0/0/0
/39.7
1.68/16390/0/0
/2.0/75.0
2.52/16390/0/0/0/159.0
2.7/17240/.3/.7/2.4/152
1995
17.9/16080/10.0/18.0
/25.0/80.0
1.0/16080/.7/1.0/1.2/7.0
7.2/15821/5/7/9/27
.12/16080/0/0/0
/12.5
.08/16080/0/0/0
/20.0
1.89/16080/0/0
/2.0/50.0
2.64/16080/0/0/0/150.0
3.0/17240/.29/.8/2.6/165
1996
18.3/13890/10.0/18.0
/25.0/85.0
1.0/13890/.8/1.0/1.3/7.0
7.2/13371/5/7/9/29
.12/16080/0/0
/.16/7.5
.09/13890/0/0/0
/35.0
2.22/13890/0/0
/2.5/100.0
4.56/13890/0/0/0
/2900
3.7/13950/.4/1.1/3.2/160
Min/25/50/75/Max : Minimum / 25th percentile / 50th percentile / 75th percentile / Maximum
Panel B: SMALL companies
Year
AnnualDirectorPayment($1000s)
Fees PerMeeting($1000s)
Number ofBoard
Meetings
NumberShares
Granted(*1000s)
AdditionalShares
Granted(*1000s)
NumberOptionsGranted(*1000s)
AdditionalOptionsGranted(*1000s)
CompanySales
($Billions)
MeanMin
/25/50/75/Max
MeanMin
/25/50/75/Max
MeanMin
/25/50/75/Max
MeanMin/25/50/75
/Max
MeanMin/25/50/75
/Max
MeanMin/25/50/75
/Max
MeanMin/25/50/75
/Max
Min/Max/Sample
Size
1992
7.50/0/6.0
/12.0/33.0
.70/0/.5
/1.0/4.0
6.51/4/6/8/19
.060/0/0/0/8.1
.050/0/0
/0/10.0
2.250/0/0/2.2/80.0
3.080/0/0
/0/75.0
0/.200/444
1993
8.10/0/8.0
/12.0/35.0
.70/0/.8
/1.0/5.0
6.51/4/6/7/22
.080/0/0
/0/15.9
.120/0/0
/0/39.7
2.730/0/0/3.0
/100.0
3.660/0/0/2.25/95.0
0/.240/430
1994
9.60/3.5/10.0/14.0/50.0
.80/0/.8
/1.0/5.0
6.41/4/6/8/19
.100/0/0
/0/15.9
.110/0/0
/0/39.7
2.560/0/1.0/4.0/31.7
4.120/0/0/3.55
/100.0
0/.300/461
1995
10.30/4.0/10.0/15.0/50.0
.80/0/.8
/1.0/5.0
6.51/4/6/8/27
.090/0/0/0/5.0
.070/0/0
/0/20.0
3.270/0/1.5/5.0/50.0
4.150/0/0/4.0
/150.0
0/.300/437
1996
10.70/5.0/10.0/15.0/50.0
.90/.5/1.0
/1.0/5.0
6.52/4/6/8/29
.110/0/0/0/7.5
.040/0/0/0/5.0
2.250/0/1.2/4.0
/100.0
12.720/0/0/3.8
/2900
0/.400/324
Table 1: Director Compensation (continued)Director compensation of 1724 US companies during 1992-1996.
Panel C: LARGE companies
Year
AnnualDirectorPayment($1000s)
Fees PerMeeting($1000s)
Number ofBoard
Meetings
NumberShares
Granted(*1000s)
AdditionalShares
Granted(*1000s)
NumberOptionsGranted(*1000s)
AdditionalOptionsGranted(*1000s)
CompanySales
($Billions)
MeanMin
/25/50/75/Max
MeanMin
/25/50/75/Max
MeanMin
/25/50/75/Max
MeanMin/25/50/75
/Max
MeanMin/25/50/75
/Max
MeanMin/25/50/75
/Max
MeanMin/25/50/75
/Max
Min/Max/Sample
Size
1992
23.70/20/24
/27.1/60
1.00/.9/1.0
/1.2/3.5
8.11/6/8
/10/20
.110/0/0
/.1/5.4
.060/0/0/0/3.4
.410/0/0/0/30
.460/0/0/0/15
1.9/130.6/434
1993
24.70/20
/24/30/64
1.00/1.0/1.0
/1.2/6.0
8.13/6/8
/10/24
.120/0/0
/.1/5.4
.070/0/0/0/5.1
.680/0/0/0/30
.710/0/0/0/30
2.1/135.6/435

1994 25.80/20
/25/30/70
1.10/1.0/1.0
/1.3/6.0
8.12/6/8
/10/24
.130/0/0
/.2/2.2
.060/0/0/0/3.6
.940/0/0
/1.0/50
.920/0/0/0/30
2.4/152.2/424
1995
26.00/20
/25/30/80
1.10/1.0/1.0
/1.3/5.0
8.01/6/8
/10/18
.170/0/0
/.2/3.1
.090/0/0/0/7.6
1.020/0/0
/1.0/16
1.320/0/0/0/50
2.6/165.4/431
1996
26.70/20/25.8
/30/85
1.00/1.0/1.0
/1.5/5.0
8.12/6/8
/10/24
.240/0/0
/.4/2.8
.090/0/0/0/4.0
1.030/0/0/1.0/16.7
1.080/0/0/0/50
3.2/160.1/354

Table 2: Director CompensationDirector compensation of 1724 US companies during 1992-1996.
Panel A: ALL companies
Year
Fees Paid forCommittee Meetings
Executive Directors PaidDirector Compensation
Director Pension Plan
Yes No Yes No Yes NoNumber of
Firms /Sample%
Number ofFirms /Sample
%
Number ofFirms /Sample
%
Number ofFirms /Sample
%
Number ofFirms /Sample
%
Number ofFirms /Sample
%
1992
940/77.5 273/22.5 69/5.7 1144/94.3 382/31.5 831/68.5
1993
1241/76.4 383/23.6 87/5.4 1537/94.6 474/29.2 1150/70.8
1994
1266/77.2 373/22.8 83/5.1 1556/94.9 503/30.7 1136/69.3
1995
1248/77.6 360/22.4 67/4.2 1541/95.8 485/30.2 1123/69.8
1996
1086/78.2 303/21.8 53/3.8 1336/96.2 364/26.2 1025/73.8
Note: Number of firms under ÒYesÓ and ÒNoÓ do not sum to 1724 because of missing data.
Panel B: SMALL companies
Year
Fees Paid forCommittee Meetings
Executive Directors PaidDirector Compensation
Director Pension Plan
Yes No Yes No Yes NoNumber of
Firms /Sample%
Number ofFirms /Sample
%
Number ofFirms /Sample
%
Number ofFirms /Sample
%
Number ofFirms /Sample
%
Number ofFirms /Sample
%
1992
136/55.5 109/44.5 14/5.7 231/94.3 11/4.5 234/95.5
1993
214/57.4 159/42.6 20/5.4 353/94.6 19/5.1 354/94.9
1994
255/62.3 154/37.7 20/4.9 389/95.1 26/6.4 383/93.6
1995
211/61.2 134/38.8 14/4.1 331/95.9 19/5.5 326/94.5
1996
207/64.5 114/35.5 14/4.4 307/95.6 27/8.4 294/91.6
Panel C: LARGE companies
Year
Fees Paid forCommittee Meetings
Executive Directors PaidDirector Compensation
Director Pension Plan
Yes No Yes No Yes NoNumber of
Firms /Sample%
Number ofFirms /Sample
%
Number ofFirms /Sample
%
Number ofFirms /Sample
%
Number ofFirms /Sample
%
Number ofFirms /Sample
%
1992
326/88.1 44/11.9 14/3.8 318/96.2 218/58.9 152/41.1
1993
373/87.1 55/12.9 14/3.3 414/96.7 245/57.2 183/42.8
1994
360/84.9 54/13.0 13/3.1 401/96.9 257/60.6 157/37.9
1995
363/86.4 57/13.6 12/2.9 408/97.1 243/57.9 177/42.1
1996
293/83.2 59/16.8 8/2.3 344/97.7 153/43.5 199/56.5
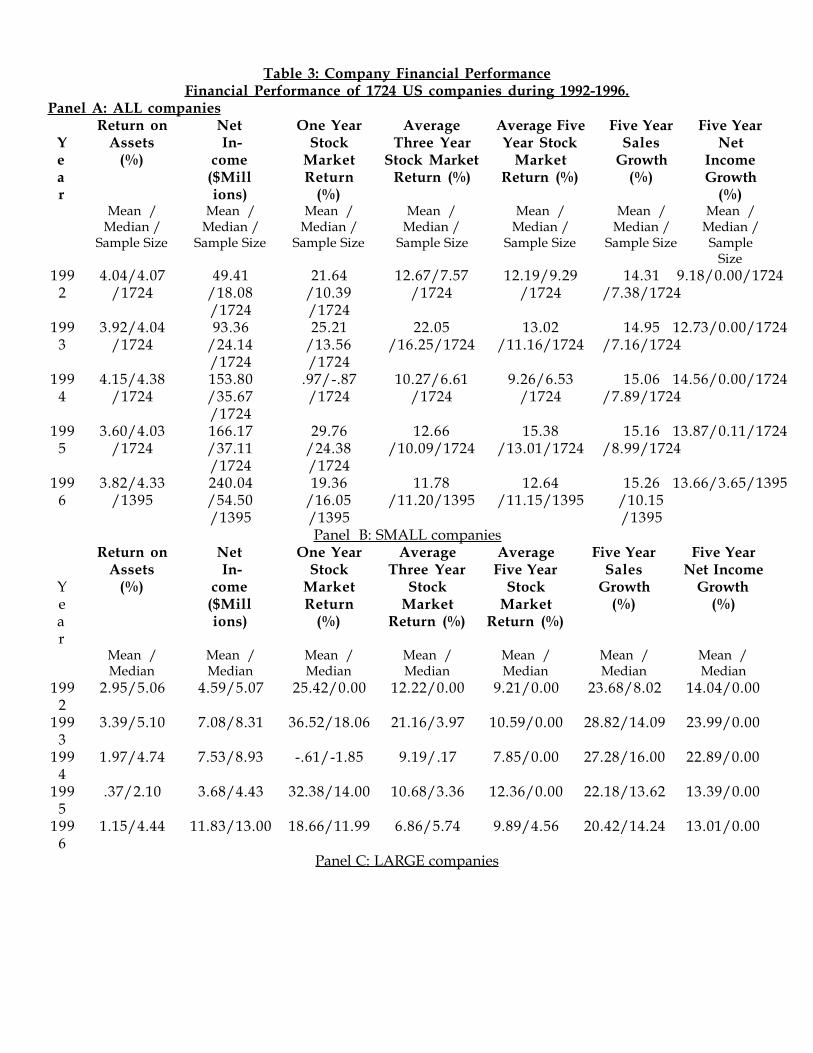
Table 3: Company Financial PerformanceFinancial Performance of 1724 US companies during 1992-1996.
Panel A: ALL companies
Year
Return onAssets
(%)
NetIn-
come($Millions)
One YearStock
MarketReturn
(%)
AverageThree Year
Stock MarketReturn (%)
Average FiveYear Stock
MarketReturn (%)
Five YearSales
Growth(%)
Five YearNet
IncomeGrowth
(%)Mean /
Median / Sample Size
Mean / Median /
Sample Size
Mean / Median /
Sample Size
Mean / Median /
Sample Size
Mean / Median /
Sample Size
Mean / Median /
Sample Size
Mean / Median / Sample
Size199
24.04/4.07
/172449.41
/18.08/1724
21.64/10.39/1724
12.67/7.57/1724
12.19/9.29/1724
14.31/7.38/1724
9.18/0.00/1724
1993
3.92/4.04/1724
93.36/24.14/1724
25.21/13.56/1724
22.05/16.25/1724
13.02/11.16/1724
14.95/7.16/1724
12.73/0.00/1724
1994
4.15/4.38/1724
153.80/35.67/1724
.97/-.87/1724
10.27/6.61/1724
9.26/6.53/1724
15.06/7.89/1724
14.56/0.00/1724
1995
3.60/4.03/1724
166.17/37.11/1724
29.76/24.38/1724
12.66/10.09/1724
15.38/13.01/1724
15.16/8.99/1724
13.87/0.11/1724
1996
3.82/4.33/1395
240.04/54.50/1395
19.36/16.05/1395
11.78/11.20/1395
12.64/11.15/1395
15.26/10.15/1395
13.66/3.65/1395
Panel B: SMALL companies
Year
Return onAssets
(%)
NetIn-
come($Millions)
One YearStock
MarketReturn
(%)
AverageThree Year
StockMarket
Return (%)
AverageFive Year
StockMarket
Return (%)
Five YearSales
Growth(%)
Five YearNet Income
Growth(%)
Mean / Median
Mean / Median
Mean / Median
Mean / Median
Mean / Median
Mean / Median
Mean / Median
1992
2.95/5.06 4.59/5.07 25.42/0.00 12.22/0.00 9.21/0.00 23.68/8.02 14.04/0.00
1993
3.39/5.10 7.08/8.31 36.52/18.06 21.16/3.97 10.59/0.00 28.82/14.09 23.99/0.00
1994
1.97/4.74 7.53/8.93 -.61/-1.85 9.19/.17 7.85/0.00 27.28/16.00 22.89/0.00
1995
.37/2.10 3.68/4.43 32.38/14.00 10.68/3.36 12.36/0.00 22.18/13.62 13.39/0.00
1996
1.15/4.44 11.83/13.00 18.66/11.99 6.86/5.74 9.89/4.56 20.42/14.24 13.01/0.00
Panel C: LARGE companies
Year
Return onAssets
(%)
NetIn-
come($Millions)
One YearStock
MarketReturn
(%)
AverageThree Year
StockMarket
Return (%)
AverageFive Year
StockMarket
Return (%)
Five YearSales
Growth(%)
Five YearNet Income
Growth(%)
Mean / Median
Mean / Median
Mean / Median
Mean / Median
Mean / Median
Mean / Median
Mean / Median
1992
3.69/3.51 121.1/145.7 14.60/11.02 10.34/10.11 13.17/13.39 8.21/6.29 5.53/0.00
1993
3.58/3.33 289.4/194.6 15.07/11.74 19.60/17.60 13.85/13.85 7.50/4.97 5.26/0.00
1994
4.51/3.85 506.2/278.2 1.49/.30 8.89/7.34 9.15/8.53 6.85/4.75 8.20/0.00
1995
4.52/4.22 544.6/303.6 32.87/30.53 13.62/12.45 16.88/15.72 8.92/5.94 11.14/1.86
1996
4.75/4.07 776.7/421.7 22.50/20.94 16.10/15.43 15.15/14.12 10.55/7.14 14.25/6.25
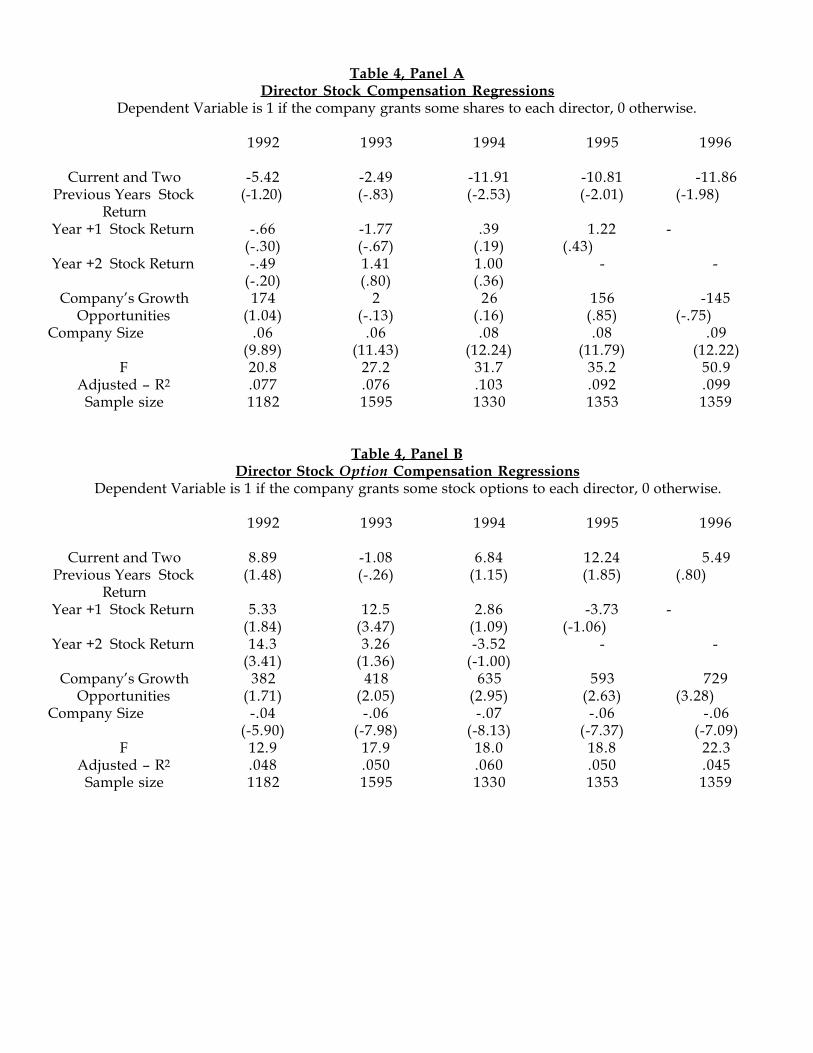
Table 4, Panel ADirector Stock Compensation Regressions
Dependent Variable is 1 if the company grants some shares to each director, 0 otherwise.
1992 1993 1994 1995 1996
Current and TwoPrevious Years Stock
Return
-5.42(-1.20)
-2.49(-.83)
-11.91(-2.53)
-10.81(-2.01)
-11.86(-1.98)
Year +1 Stock Return -.66(-.30)
-1.77(-.67)
.39(.19)
1.22(.43)
-
Year +2 Stock Return -.49(-.20)
1.41(.80)
1.00(.36)
- -
CompanyÕs GrowthOpportunities
174(1.04)
2(-.13)
26(.16)
156(.85)
-145(-.75)
Company Size .06(9.89)
.06(11.43)
.08(12.24)
.08(11.79)
.09(12.22)
F 20.8 27.2 31.7 35.2 50.9Adjusted Ð R2 .077 .076 .103 .092 .099
Sample size 1182 1595 1330 1353 1359
Table 4, Panel BDirector Stock Option Compensation Regressions
Dependent Variable is 1 if the company grants some stock options to each director, 0 otherwise.
1992 1993 1994 1995 1996
Current and TwoPrevious Years Stock
Return
8.89(1.48)
-1.08(-.26)
6.84(1.15)
12.24(1.85)
5.49(.80)
Year +1 Stock Return 5.33(1.84)
12.5(3.47)
2.86(1.09)
-3.73(-1.06)
-
Year +2 Stock Return 14.3(3.41)
3.26(1.36)
-3.52(-1.00)
- -
CompanyÕs GrowthOpportunities
382(1.71)
418(2.05)
635(2.95)
593(2.63)
729(3.28)
Company Size -.04(-5.90)
-.06(-7.98)
-.07(-8.13)
-.06(-7.37)
-.06(-7.09)
F 12.9 17.9 18.0 18.8 22.3Adjusted Ð R2 .048 .050 .060 .050 .045
Sample size 1182 1595 1330 1353 1359
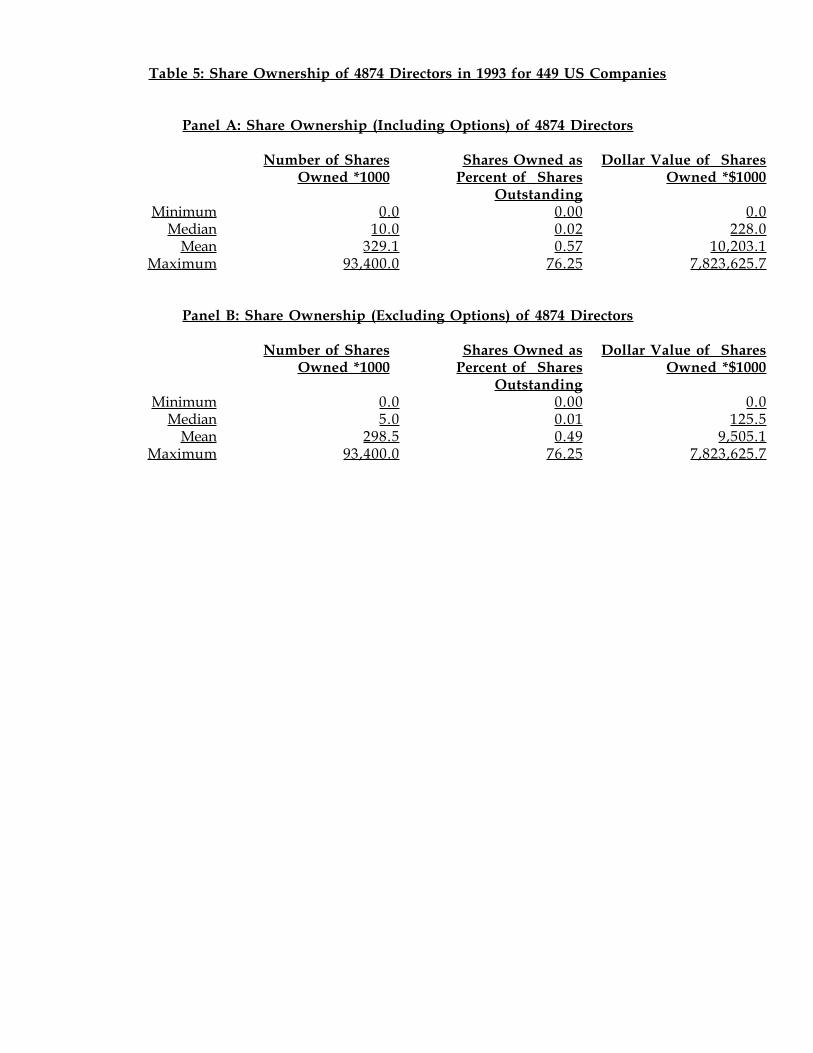
Table 5: Share Ownership of 4874 Directors in 1993 for 449 US Companies
Panel A: Share Ownership (Including Options) of 4874 Directors
Number of SharesOwned *1000
Shares Owned asPercent of Shares
Outstanding
Dollar Value of SharesOwned *$1000
Minimum 0.0 0.00 0.0Median 10.0 0.02 228.0
Mean 329.1 0.57 10,203.1Maximum 93,400.0 76.25 7,823,625.7
Panel B: Share Ownership (Excluding Options) of 4874 Directors
Number of SharesOwned *1000
Shares Owned asPercent of Shares
Outstanding
Dollar Value of SharesOwned *$1000
Minimum 0.0 0.00 0.0Median 5.0 0.01 125.5
Mean 298.5 0.49 9,505.1Maximum 93,400.0 76.25 7,823,625.7

Panel C: Share Ownership (Including Options) of Median Director in 449 US Companies
All Companies
Number of SharesOwned *1000
Shares Owned asPercent of Shares
Outstanding
Dollar Value of SharesOwned *$1000
Minimum 0.0 0.00 0.0Median 10.0 0.020 231.6
Mean 43.3 0.124 1,530.7Maximum 1,788.8 2.76 273,729.4
Small Companies (122 companies)
Number of SharesOwned *1000
Shares Owned asPercent of Shares
Outstanding
Dollar Value of SharesOwned *$1000
Minimum 0.2 0.00 3.1Median 29.3 0.122 393.1
Mean 63.3 0.284 1,061.1Maximum 641.4 2.76 16,401.5
Mid-size Companies (180 companies)
Number of SharesOwned *1000
Shares Owned asPercent of Shares
Outstanding
Dollar Value of SharesOwned *$1000
Minimum 0.0 0.00 0.0Median 10.0 0.020 252.8
Mean 30.4 0.080 709.5Maximum 511.1 1.90 8,325.6
Large Companies (145 companies)
Number of SharesOwned *1000
Shares Owned asPercent of Shares
Outstanding
Dollar Value of SharesOwned *$1000
Minimum 0.2 0.00 6.4Median 4.5 0.003 153.4
Mean 40.5 0.028 2,895.3Maximum 1,788.8 1.40 273,729.0
Panel D: Share Ownership (Excluding Options) of Median Director in 449 US Companies
All Companies
Number of SharesOwned *1000
Shares Owned asPercent of Shares
Outstanding
Dollar Value of SharesOwned *$1000
Minimum 0.0 0.00 0.0Median 5.0 0.01 119.5
Mean 31.0 0.08 1,297.0Maximum 1,484.5 2.76 273,729.4
Small Companies (122 companies)
Number of SharesOwned *1000
Shares Owned asPercent of Shares
Outstanding
Dollar Value of SharesOwned *$1000
Minimum 0.0 0.00 0.0Median 9.3 0.036 114.9
Mean 38.7 0.164 723.0Maximum 641.4 2.76 15,284.3
Mid-size Companies (180 companies)
Number of SharesOwned *1000
Shares Owned asPercent of Shares
Outstanding
Dollar Value of SharesOwned *$1000
Minimum 0.0 0.00 0.0Median 5.6 0.013 130.1
Mean 22.6 0.061 488.3Maximum 511.2 1.90 8,325.6
Large Companies (145 companies)
Number of SharesOwned *1000
Shares Owned asPercent of Shares
Outstanding
Dollar Value of SharesOwned *$1000
Minimum 0.0 0.00 0.0Median 3.5 0.002 107.8
Mean 33.4 0.023 2,710.5Maximum 1,484.5 1.40 273,729.0
Panel E: Share Ownership (Including Options ) of All Directors in 449 US Companies
Number of SharesOwned *1000
SummaryStatis-tics forMin./Med-ian/Mean/Max.NumberofSharesOwnedin eachof the449compa-nies
Shares Owned asPercent of SharesOutstanding
SummaryStatis-tics for
Min./Median/Mean/Max. of Shares Ownedas Percent of SharesOutstandingIn each of the 449companies
Dollar Value of Shares Owned *$1000
SummaryStatistics for
Min./Median/Mean/Max. ofDollar Value of Shares Owned in
each of the 449 companies
Min. Me-dian
Mean Max. Min. Me-dian
Mean
Max. Min. Mean Median Max.
Medi-an
0.4 10.0 97.5 503.9 0.00 0.02 0.18 0.98 10.9 231.6 1,930.8 12,459.8
Mean 2.5 43.3 349.7 2,117.6
0.01 0.12 0.71 3.95 46.7 1,530.7 11,963.7 71,595.1
Panel F: Share Ownership (Excluding Options) of All Directors in 449 US Companies
Number of SharesOwned *1000
SummaryStatis-tics forMin./Med-ian/Mean/Max.NumberofSharesOwnedin eachof the449compa-nies
Shares Owned asPercent of SharesOutstanding
SummaryStatis-tics for
Min./Median/Mean/Max. of Shares Ownedas Percent of SharesOutstandingin each of the 449companies
Dollar Value of Shares Owned *$1000
SummaryStatistics for
Min./Median/Mean/Max. of DollarValue of Shares Owned in each of
the 449 companies
Min. Me-dian
Mean Max. Min. Me-dian
Mean
Max. Min. Mean Median Max.
Medi-an
0.1 5.0 56.5 320.8 0.00 0.01 0.11 0.61 2.7 119.5 1,221.2 7,825.0
Mean 0.8 31.0 318.5 1,986.1
0.00 0.08 0.62 3.58 18.3 1,297.0 11,335.6 69,122.7

Table 6
Regressions relating Percentage Holding of Median Director, Dollar Value of Median DirectorÕs StockHoldings, and Company Performance for 449 US Companies (t-statistics in parentheses)
Panel A: Company Performance Measured as 3-year Growth in Operating Income
Independet Variable Dependent VariablePercentage Holding of
Median Director in1993
Dollar Value of MedianDirectorÕs Stock
Holdings in 1993
CompanyPerformance
During 1993-1995CompanyÕs Growth
Opportunities in 1993-.00
(-.36).59
(4.65)--
CompanyÕs Board Has AMajority of Outside
Directors
-.001(-3.63)
-1.33(-6.59)
1.78(.22)
Company Size -.001(-7.25)
-.04(-.99)
-3.96(-2.28)
Company PerformanceDuring 1990-1992
-.001(-1.29)
.002(.94)
--
Percentage Holding ofMedian Director in 1993
-- -- 525(.47)
Dollar Value of MedianDirectorÕs Holdings in 1993
-- -- 1.52(.76)
Adjusted R2 .141 .144 .011F-statistic 19.1 19.4 2.2
Panel B: Company Performance Measured as 3-year Growth in Sales
Independet Variable Dependent VariablePercentage Holding of
Median Director in1993
Dollar Value of MedianDirectorÕs Stock
Holdings in 1993
CompanyPerformance
During 1993-1995CompanyÕs Growth
Opportunities in 1993-.00
(-.44).56
(4.42)--
CompanyÕs Board Has AMajority of Outside
Directors
-.001(-3.61)
-1.29(-6.41)
-1.60(-.68)
Company Size -.001(-7.05)
-.028(-.64)
-4.13(-8.20)
Company PerformanceDuring 1990-1992
-.001(-.47)
.009(2.17)
--
Percentage Holding ofMedian Director in 1993
-- -- -590.4(-1.81)
Dollar Value of MedianDirectorÕs Holdings in 1993
-- -- 1.91(3.30)
Adjusted R2 .138 .151 .159F-statistic 18.7 20.5 22.0


Table 6
(continued)
Panel C: Company Performance Measured as ROE
Independet Variable Dependent VariablePercentage Holding of
Median Director in1993
Dollar Value of MedianDirectorÕs Stock
Holdings in 1993
CompanyPerformance
During 1993-1995CompanyÕs Growth
Opportunities in 1993-.00
(-.78).56
(4.37)--
CompanyÕs Board Has AMajority of Outside
Directors
-.001(-3.54)
-1.32(-6.58)
-4.30(-1.50)
Company Size -.001(-7.30)
-.062(-1.46)
1.68(2.76)
Company PerformanceDuring 1992
.001(1.59)
.008(2.24)
--
Percentage Holding ofMedian Director in 1993
-- -- -290.7(-.74)
Dollar Value of MedianDirectorÕs Holdings in 1993
-- -- -.03(-.04)
Adjusted R2 .143 .152 .018F-statistic 19.4 20.6 2.98
Panel D: Company Performance Measured as 3-year Stock Return
Independet Variable Dependent VariablePercentage Holding of
Median Director in1993
Dollar Value of MedianDirectorÕs Stock
Holdings in 1993
CompanyPerformance
During 1993-1995CompanyÕs Growth
Opportunities in 1993-.00
(-.65).50
(3.86)--
CompanyÕs Board Has AMajority of Outside
Directors
-.001(-3.52)
-1.28(-6.40)
-2.53(-.94)
Company Size -.001(-7.12)
-.05(-1.13)
-.70(-1.21)
Company PerformanceDuring 1990-1992
.00(.55)
.010(2.95)
--
Percentage Holding ofMedian Director in 1993
-- -- 16.4(.04)
Dollar Value of MedianDirectorÕs Holdings in 1993
-- -- -.67(-1.02)
Adjusted R2 .139 .159 -.000F-statistic 18.7 21.7 .89

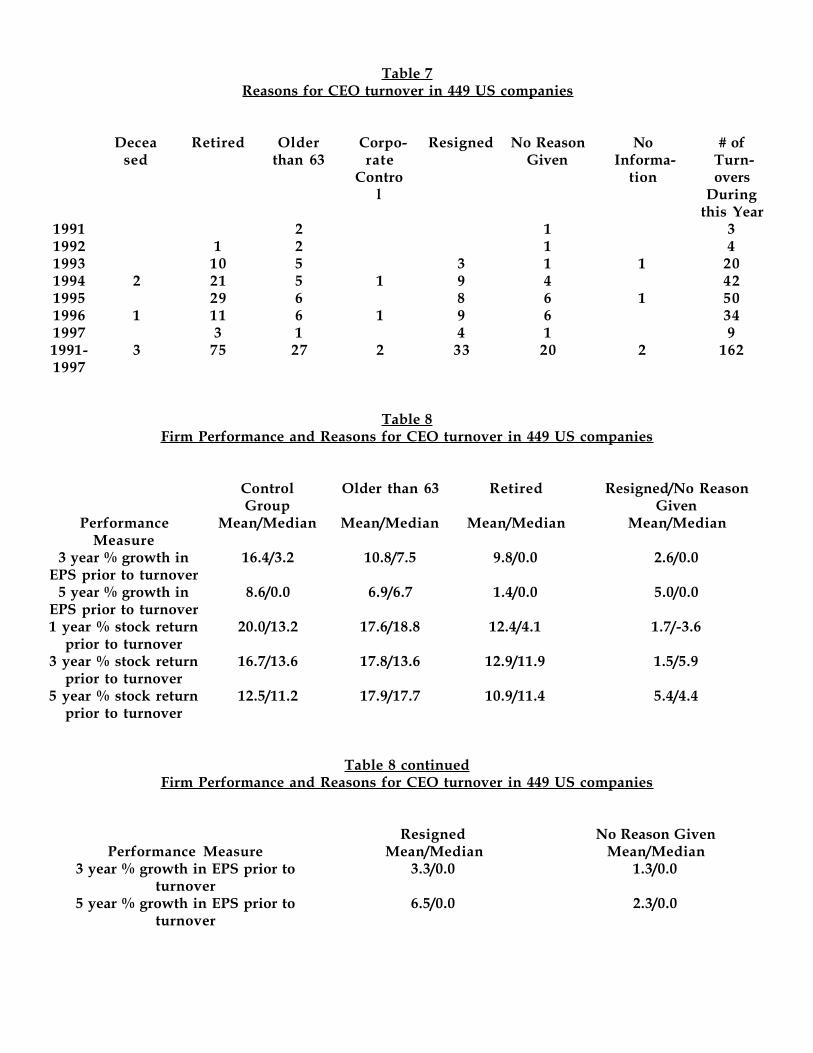
Table 7Reasons for CEO turnover in 449 US companies
Deceased
Retired Olderthan 63
Corpo-rate
Control
Resigned No ReasonGiven
NoInforma-
tion
# ofTurn-overs
Duringthis Year
1991 2 1 31992 1 2 1 41993 10 5 3 1 1 201994 2 21 5 1 9 4 421995 29 6 8 6 1 501996 1 11 6 1 9 6 341997 3 1 4 1 91991-1997
3 75 27 2 33 20 2 162
Table 8Firm Performance and Reasons for CEO turnover in 449 US companies
ControlGroup
Older than 63 Retired Resigned/No ReasonGiven
PerformanceMeasure
Mean/Median Mean/Median Mean/Median Mean/Median
3 year % growth inEPS prior to turnover
16.4/3.2 10.8/7.5 9.8/0.0 2.6/0.0
5 year % growth inEPS prior to turnover
8.6/0.0 6.9/6.7 1.4/0.0 5.0/0.0
1 year % stock returnprior to turnover
20.0/13.2 17.6/18.8 12.4/4.1 1.7/-3.6
3 year % stock returnprior to turnover
16.7/13.6 17.8/13.6 12.9/11.9 1.5/5.9
5 year % stock returnprior to turnover
12.5/11.2 17.9/17.7 10.9/11.4 5.4/4.4
Table 8 continuedFirm Performance and Reasons for CEO turnover in 449 US companies
Resigned No Reason GivenPerformance Measure Mean/Median Mean/Median
3 year % growth in EPS prior toturnover
3.3/0.0 1.3/0.0
5 year % growth in EPS prior toturnover
6.5/0.0 2.3/0.0

1 year % stock return prior to turnover -5.0/-4.2 13.9/17.43 year % stock return prior to turnover -0.4/1.0 5.0/8.85 year % stock return prior to turnover 4.1/2.9 7.6/5.3

Table 9Logit regressions relating CEO turnover to Dollar Value of Median DirectorÕs Stock Holding,Percentage Holding of Median Director, and Company Performance for 449 US Companies (t-statisticsin parentheses)
Panel A: The dependent variable is 1 if the CEO resigned or if no reason was given for the CEOÕsdeparture in the press release, and 0 for the control firms (picked on basis of industry) thatexperienced no CEO turnover during 1991-1997.
Independent Variables Performance Measure (measured prior to turnover)3-year
Growth inEPS
5-yearGrowth in
EPS
1-yearStock
Return
3-year StockReturn
5-Year Stockreturn
Company Performance times log ofDollar Value of Median DirectorÕs
Holdings
-.001(-1.94)
-.001(-.95)
-.001(-2.68)
-.003(-3.71)
-.003(-2.23)
Company Performance timesPercentage Holding of Median
Director
.012(.77)
-.014(-.48)
.007(.66)
.022(1.43)
-.030(-.50)
Company Size -.116(-1.33)
-.114(-1.30)
-.086(-.95)
-.110(-1.10)
-.100(-1.09)
Intercept -.22(-.35)
-.23(-.37)
-.38(-.59)
-.03(-.04)
-.08(-.13)
Panel B: The dependent variable is 1 if the CEO resigned, and 0 for the control firms (picked on basis ofindustry) that experienced no CEO turnover during 1991-1997.
Independent Variables Performance Measure (measured prior to turnover)3-year
Growth inEPS
5-yearGrowth in
EPS
1-year StockReturn
3-year StockReturn
5-Year Stockreturn
Company Performance times logof Dollar Value of Median
DirectorÕs Holdings
-.001(-1.55)
-.0002(-.22)
-.001(-2.44)
-.004(-3.43)
-.003(-1.78)
Company Performance timesPercentage Holding of Median
Director
.008(.46)
-.041(-.80)
-.024(-.59)
.016(.82)
-.086(-.82)
Company Size -.107(-1.08)
-.11(-1.13)
-.05(-.50)
-.095(-.81)
-.094(-.91)
Intercept -.68(-.96)
-.68(-.96)
-1.02(-1.32)
-.52(-.61)
-.53(-.72)
Panel C: The dependent variable is 1 if no reason was given for the CEOÕs departure in the press release, and0 for the control firms (picked on basis of industry) that experienced no CEO turnover during 1991-1997.
Independent Variables Performance Measure (measured prior to turnover)3-year
Growth inEPS
5-yearGrowth in
EPS
1-year StockReturn
3-year StockReturn
5-Year Stockreturn
Company Performance times logof Dollar Value of Median
DirectorÕs Holdings
-.001(-1.37)
-.003(-1.48)
-.000(-.54)
-.002(-1.76)
-.002(-1.06)

Company Performance timesPercentage Holding of Median
Director
.016(.79)
.019(.60)
.009(.82)
.024(1.37)
-.001(-.03)
Company Size -.117(-.91)
-.104(-.82)
-.088(-.65)
-.078(-.55)
-.10(-.75)
Intercept -1.33(-1.46)
-1.33(-1.45)
-1.61(-1.67)
-1.46(-1.46)
-1.30(-1.42)
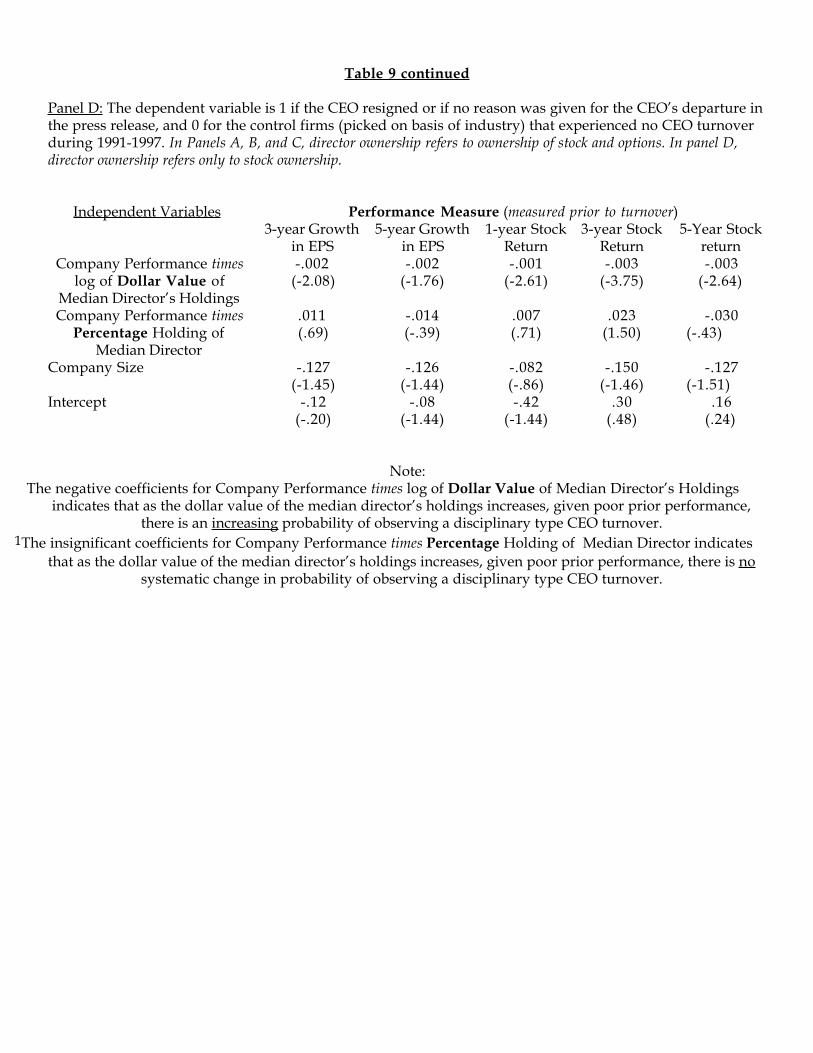
Table 9 continued
Panel D: The dependent variable is 1 if the CEO resigned or if no reason was given for the CEOÕs departure inthe press release, and 0 for the control firms (picked on basis of industry) that experienced no CEO turnoverduring 1991-1997. In Panels A, B, and C, director ownership refers to ownership of stock and options. In panel D,director ownership refers only to stock ownership.
Independent Variables Performance Measure (measured prior to turnover)3-year Growth
in EPS5-year Growth
in EPS1-year Stock
Return3-year Stock
Return5-Year Stock
returnCompany Performance times
log of Dollar Value ofMedian DirectorÕs Holdings
-.002(-2.08)
-.002(-1.76)
-.001(-2.61)
-.003(-3.75)
-.003(-2.64)
Company Performance timesPercentage Holding of
Median Director
.011(.69)
-.014(-.39)
.007(.71)
.023(1.50)
-.030(-.43)
Company Size -.127(-1.45)
-.126(-1.44)
-.082(-.86)
-.150(-1.46)
-.127(-1.51)
Intercept -.12(-.20)
-.08(-1.44)
-.42(-1.44)
.30(.48)
.16(.24)
Note: The negative coefficients for Company Performance times log of Dollar Value of Median DirectorÕs Holdings
indicates that as the dollar value of the median directorÕs holdings increases, given poor prior performance,there is an increasing probability of observing a disciplinary type CEO turnover.
1The insignificant coefficients for Company Performance times Percentage Holding of Median Director indicatesthat as the dollar value of the median directorÕs holdings increases, given poor prior performance, there is no
systematic change in probability of observing a disciplinary type CEO turnover.
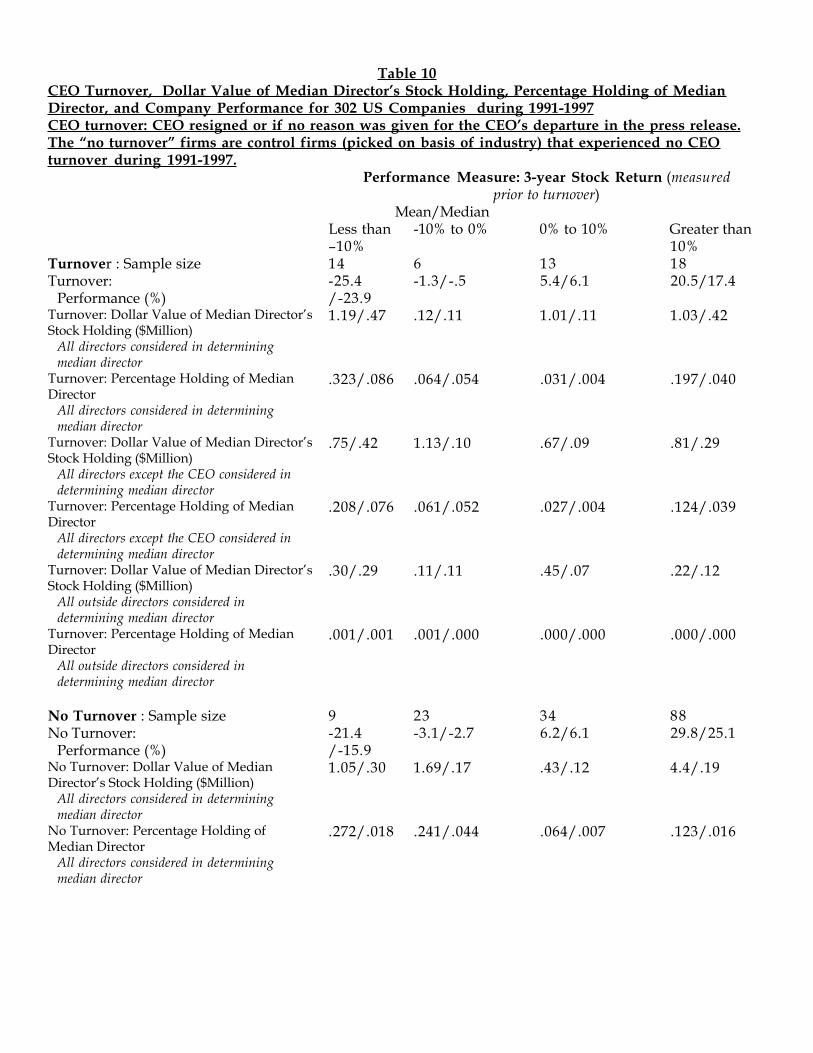
Table 10CEO Turnover, Dollar Value of Median DirectorÕs Stock Holding, Percentage Holding of MedianDirector, and Company Performance for 302 US Companies during 1991-1997CEO turnover: CEO resigned or if no reason was given for the CEOÕs departure in the press release.The Òno turnoverÓ firms are control firms (picked on basis of industry) that experienced no CEOturnover during 1991-1997.
Performance Measure: 3-year Stock Return (measuredprior to turnover)
Mean/MedianLess thanÐ10%
-10% to 0% 0% to 10% Greater than10%
Turnover : Sample size 14 6 13 18Turnover:
Performance (%)-25.4/-23.9
-1.3/-.5 5.4/6.1 20.5/17.4
Turnover: Dollar Value of Median DirectorÕsStock Holding ($Million)
All directors considered in determiningmedian director
1.19/.47 .12/.11 1.01/.11 1.03/.42
Turnover: Percentage Holding of MedianDirector
All directors considered in determiningmedian director
.323/.086 .064/.054 .031/.004 .197/.040
Turnover: Dollar Value of Median DirectorÕsStock Holding ($Million)
All directors except the CEO considered indetermining median director
.75/.42 1.13/.10 .67/.09 .81/.29
Turnover: Percentage Holding of MedianDirector
All directors except the CEO considered indetermining median director
.208/.076 .061/.052 .027/.004 .124/.039
Turnover: Dollar Value of Median DirectorÕsStock Holding ($Million)
All outside directors considered indetermining median director
.30/.29 .11/.11 .45/.07 .22/.12
Turnover: Percentage Holding of MedianDirector
All outside directors considered indetermining median director
.001/.001 .001/.000 .000/.000 .000/.000
No Turnover : Sample size 9 23 34 88No Turnover:
Performance (%)-21.4/-15.9
-3.1/-2.7 6.2/6.1 29.8/25.1
No Turnover: Dollar Value of MedianDirectorÕs Stock Holding ($Million)
All directors considered in determiningmedian director
1.05/.30 1.69/.17 .43/.12 4.4/.19
No Turnover: Percentage Holding ofMedian Director
All directors considered in determiningmedian director
.272/.018 .241/.044 .064/.007 .123/.016

No Turnover: Dollar Value of MedianDirectorÕs Stock Holding ($Million)
All directors except the CEO considered indetermining median director
1.34/.27 1.14/.095 .319/.09 3.2/.17
No Turnover: Percentage Holding ofMedian Director
All directors except the CEO considered indetermining median director
.356/.018 .164/.024 .053/.007 .098/.012
No Turnover: Dollar Value of MedianDirectorÕs Stock Holding ($Million)
All outside directors considered indetermining median director
.77/.14 .26/.07 .22/.07 2.9/.11
No Turnover: Percentage Holding ofMedian Director
All outside directors considered indetermining median director
.002/.000 .001/.000 .001/.000 .001/.000

Table 11Logit regressions relating CEO turnover to Dollar Value of Median DirectorÕs Stock Holding,Percentage Holding of Median Director, and Company Performance for 449 US Companies (t-statisticsin parentheses)
Panel A: The dependent variable is 1 if the CEO resigned or if no reason was given for the CEOÕsdeparture in the press release, and 0 for the control firms (picked on basis of industry) thatexperienced no CEO turnover during 1991-1997. This table is similar to Table 9, Panel A with oneexception: In Table 9, Panel A we considered all the directors in determining the median director.Here we consider all directors except the CEO in determining the median director.
Independent Variables Performance Measure (measured prior to turnover)3-year Growth
in EPS5-year Growth
in EPS1-year Stock
Return3-year Stock
Return5-Year Stock
ReturnCompany Performance times log
of Dollar Value of MedianDirectorÕs Holdings
-.001(-2.02)
-.001(-.97)
-.001(-2.78)
-.003(-3.77)
-.003(-2.51)
Company Performance timesPercentage Holding of Median
Director
.015(.84)
-.022(-.58)
.012(.90)
.027(1.46)
-.025(-.37)
Company Size -.12(-1.39)
-.11(-1.32)
-.08(-.94)
-.12(-1.21)
-.093(-1.03)
Intercept -.16(-.26)
-.22(-.34)
-.38(-.59)
.06(.09)
-.11(-.17)
Panel B: The dependent variable is 1 if the CEO resigned or if no reason was given for the CEOÕs departure inthe press release, and 0 for the control firms (picked on basis of industry) that experienced no CEO turnover
during 1991-1997. This table is similar to Table 9, Panel A with one exception: In Table 9, Panel A weconsidered all the directors in determining the median director. Here we consider all directors except the inside
directors in determining the median director.
Independent Variables Performance Measure (measured prior to turnover)3-year Growth
in EPS5-year Growth
in EPS1-year Stock
Return3-year Stock
Return5-Year Stock
ReturnCompany Performance times log
of Dollar Value of MedianDirectorÕs Holdings
-.001(-1.81)
-.001(-.95)
-.001(-1.82)
-.003(-3.45)
-.003(-2.49)
Company Performance timesPercentage Holding of Median
Director
1.17(.32)
-2.08(-.33)
-4.50(-.78)
2.57(.82)
-3.49(-.31)
Company Size -.125(-1.44)
-.118(-1.34)
-.10(-1.06)
-.127(-1.30)
-.09(-1.02)
Intercept -.134(-.21)
-.195(-.31)
-.30(-.46)
.10(.14)
-.12(-.20)
Note: The negative coefficients for Company Performance times log of Dollar Value of Median DirectorÕs Holdings
indicates that as the dollar value of the median directorÕs holdings increases, given poor prior performance,

there is an increasing probability of observing a disciplinary type CEO turnover.The insignificant coefficients for Company Performance times Percentage Holding of Median Director indicates that
as the dollar value of the median directorÕs holdings increases, given poor prior performance, there is nosystematic change in probability of observing a disciplinary type CEO turnover.
1 For a detailed discussion on the history of director compensation and its relationship to shareholderdominance of corporate boards, see Charles M. Elson, Director Compensation and the Management-CapturedBoard: The History of a Symptom and a Cure, 50 SMU L. REV. 127, 135-56 (1996) [hereinafter Elson, DirectorCompensation.
2 In computing the dollar value and percentage holding of the median director, we consider three definitionsof the median director: First, we consider all directors in determining the median director. Second, we considerall directors except the CEO in determining the median director. Finally, we only consider the outsidedirectors in determining the median director. As shown in table 10, the results on the median directorÕs stockholdings are qualitatively identical under any of these three definitions of median director. Also, Table 11reports logit regression results similar to the logit regressions in Table 9, Panel A, except we use the latter twodefinitions of median director; the results are identical to that in Table 9, Panel A.