Sanitation Demand and Strategic Complementarities -...
25
Sanitation Demand and Strategic Complementarities Raymond Guiteras, Maryland Jim Levinsohn, Yale A. Mushfiq Mobarak, Yale Partners: Innovations for Poverty Action; Wateraid, Bangladesh; Bill and Melinda Gates Foundation; VERC, Bangladesh
Transcript of Sanitation Demand and Strategic Complementarities -...

Sanitation Demand and Strategic Complementarities
Raymond Guiteras, Maryland Jim Levinsohn, Yale
A. Mushfiq Mobarak, Yale
Partners: Innovations for Poverty Action; Wateraid, Bangladesh; Bill and Melinda Gates Foundation; VERC, Bangladesh
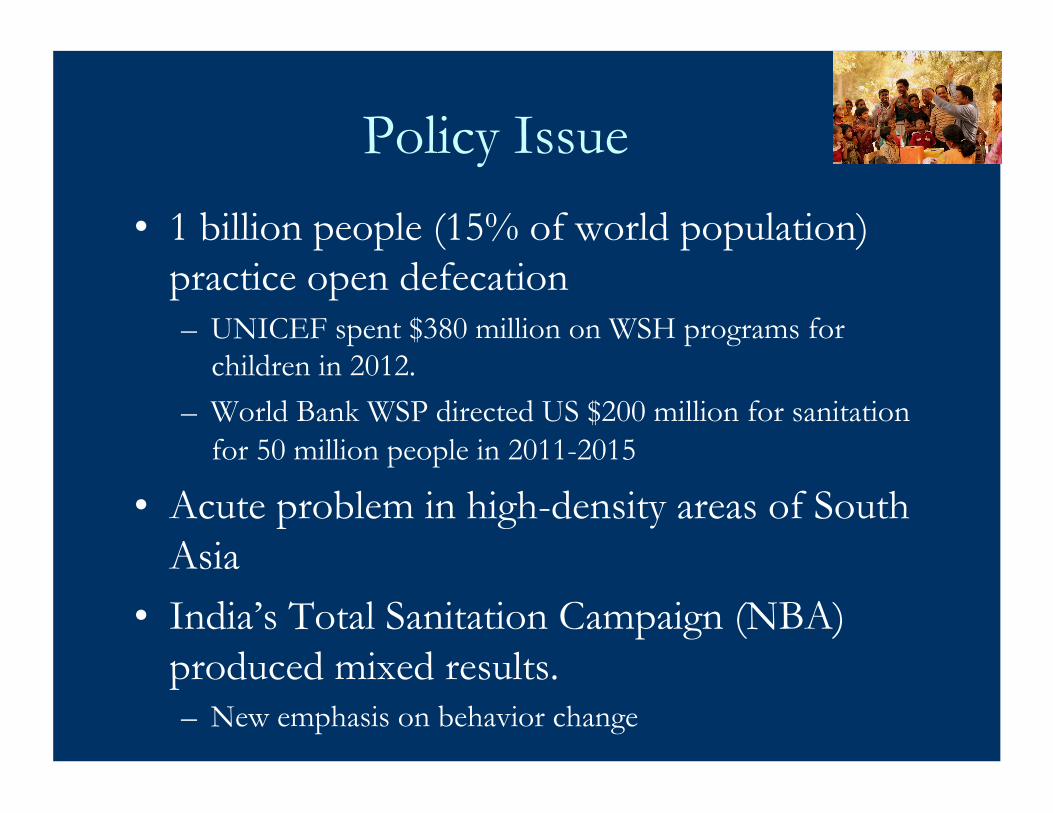
Policy Issue
• 1 billion people (15% of world population) practice open defecation – UNICEF spent $380 million on WSH programs for
children in 2012. – World Bank WSP directed US $200 million for sanitation
for 50 million people in 2011-2015
• Acute problem in high-density areas of South Asia
• India’s Total Sanitation Campaign (NBA) produced mixed results. – New emphasis on behavior change

Debates in the Sector
• Supply-side strategies or Behavior Change? • Both Supply and Demand constraints need to be
addressed? • Within Demand strategies, should we subsidize?
– Causes dependencies, kills markets?
• Part of the research design simply evaluates different strategies.

Theory Building: Interdependencies in Household Decisions
• Latrine adoption decisions may be interdependent – Epidemiological Complementarity – Social spillovers – learning/shame/status
• If these interdependencies are significant, how can we use them to improve interventions? – e.g. what’s the threshold to push over to the “good
equilibrium”? – Should we subsidize? – How should subsidies be targeted?


Context
• 4 rural sub-districts (roughly comparable to U.S. counties) in Tanore district in Bangladesh

Sample and Methods • Study Sample:
– 4 of 7 sub-districts (unions), 115 villages, 372 neighborhoods (paras), 18,000 households
– 32% open defecation at baseline • Main outcomes of interest:
– Investment in any latrines, – Investments in hygienic latrines (cost US$ 30-60) – Open defecation
• Only near-landless (poorest 75%) eligible for subsidies – Approximately half of unsubsidized cost – Vary share of poor households offered subsidy (25%, 50%,
75%) • Randomization at either village or neighborhood level

Experimental Design

Summary of Research Design • 2-by-2 of demand and supply:
– Control – Supply only – Demand (LPP + Subsidy) only – Demand (LPP + Subsidy) + Supply
• Plus: LPP only – Comparing LPP Only with LPP + Subsidy gives
marginal contribution of subsidies
• Within Subsidy communities, randomize intensity (share of eligibles winning)

Identifying Mechanisms behind Complementarities in Demand
• Collected detailed social network data at baseline – Useful for identifying demand spillovers from specific
types of social connections using IV methods: • Children’s friends’ parents (epidemiological channel) • Community leaders (social influence channel) • Technically competent individuals (learning channel)
• Experimentally varied targeting of subsidies to socially-connected or socially-marginal households


Are the latrines used?

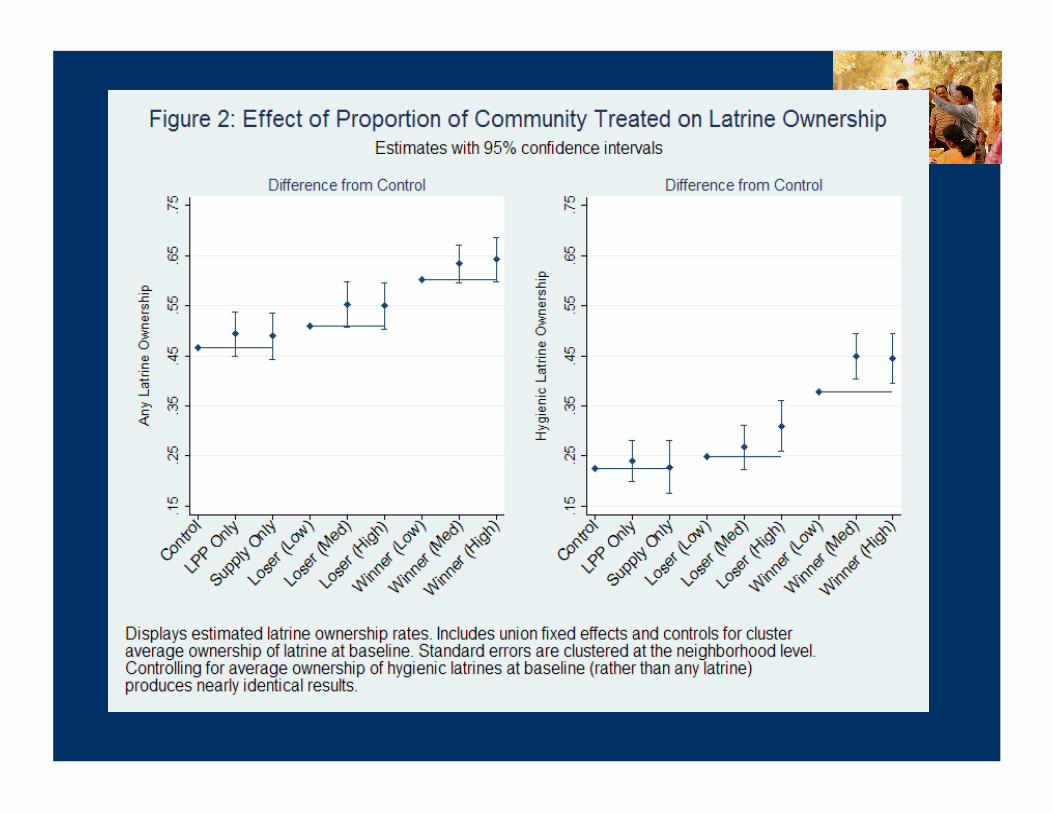
Experimentally Identifying Demand Inter-dependencies
• Holding a household’s own price constant, how does investment depend on the share of its neighbors receiving subsidies? – Designed random variation
• Three samples: – “Lucky” Eligibles who won subsidy vouchers – “Unlucky” Eligibles who lost in the lottery – Ineligibles

Mechanisms behind Social Multiplier • Attempt to distinguish between
– technical complementarity – Social influence (shame, or changes in norms) – Learning
• Using – IV methods on detailed social network data – Experiments on the way subsidies were targeted
• To socially connected versus marginal households • Early adopter discounts
– Detailed data on sequence and dates of purchase

75% HHs
provided latrine
coverage
30% HHs
provided latrine
coverage
Random selection for flat subsidies
Random selection for early adopter discounts
Random selection for flat subsidies
Random selection for early adopter discounts
Random selection for flat subsidies
Random selection for early adopter discounts
Random selection for flat subsidies
Random selection for early adopter discounts
Treatment 2: Demand side
interventions only (LPP + subsidy)
Treatment 3: Demand (LPP+
subsidy) and supply side interventions
Random selection for flat subsidies
Random selection for early adopter discounts
Random selection for flat subsidies
Random selection for early adopter discounts
18% HHs
provided latrine
coverage
Treatment 4: Only
supply side interventions
Control
~115 clusters ~115 clusters ~35 clusters ~35 clusters
Treatment 1: Only LPP
interventions
~35 clusters
Design is even more Complicated!
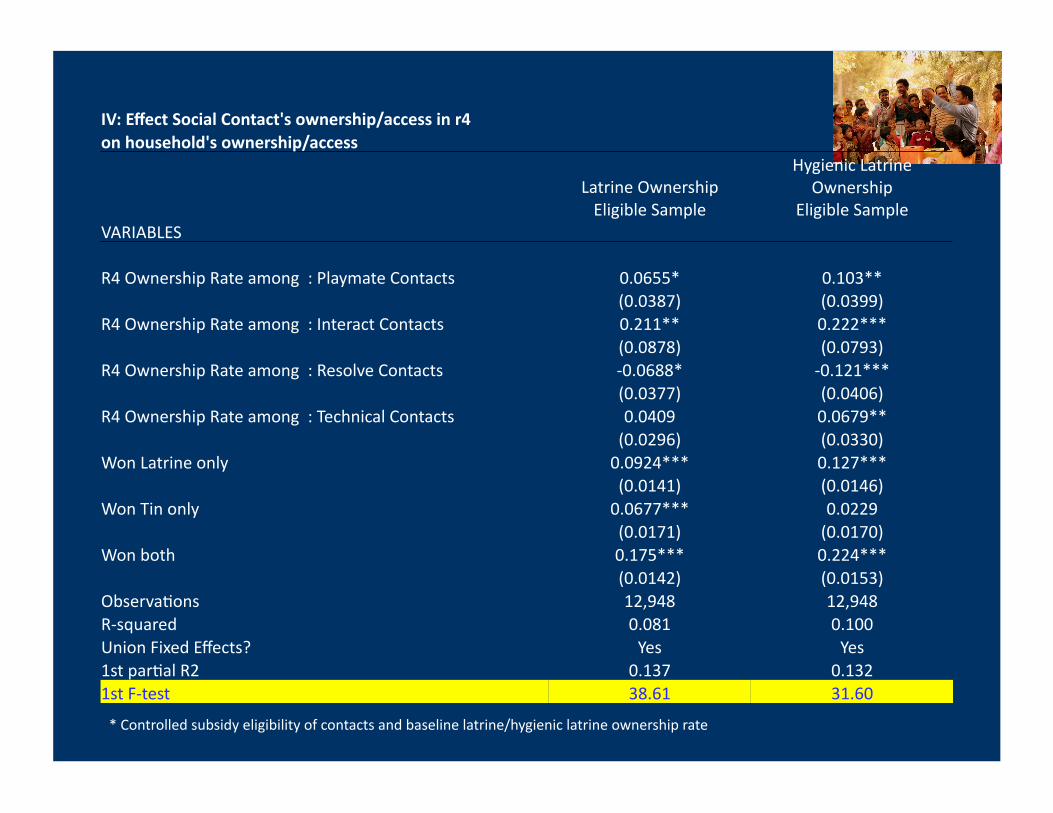
IV: Effect Social Contact's ownership/access in r4 on household's ownership/access
Latrine Ownership Hygienic Latrine
Ownership Eligible Sample Eligible Sample
VARIABLES
R4 Ownership Rate among : Playmate Contacts 0.0655* 0.103** (0.0387) (0.0399)
R4 Ownership Rate among : Interact Contacts 0.211** 0.222*** (0.0878) (0.0793)
R4 Ownership Rate among : Resolve Contacts -‐0.0688* -‐0.121*** (0.0377) (0.0406)
R4 Ownership Rate among : Technical Contacts 0.0409 0.0679** (0.0296) (0.0330)
Won Latrine only 0.0924*** 0.127*** (0.0141) (0.0146)
Won Tin only 0.0677*** 0.0229 (0.0171) (0.0170)
Won both 0.175*** 0.224*** (0.0142) (0.0153)
ObservaRons 12,948 12,948 R-‐squared 0.081 0.100 Union Fixed Effects? Yes Yes 1st parRal R2 0.137 0.132 1st F-‐test 38.61 31.60
* Controlled subsidy eligibility of contacts and baseline latrine/hygienic latrine ownership rate

IV: Effect Social Contact's ownership/access in r4 on household's ownership/access HCI Non-‐HCI
Latrine Ownership
Hygienic Latrine Ownership
Latrine Ownership
Hygienic Latrine Ownership
Eligible Sample Eligible Sample Eligible Sample Eligible Sample VARIABLES
R4 Ownership Rate : Playmate Contacts 0.0314 0.126** 0.0541 0.0126 (0.0474) (0.0556) (0.0513) (0.0620)
R4 Ownership Rate : Interact Contacts 0.0586 0.104 0.464*** 0.360*** (0.0957) (0.0940) (0.122) (0.119)
R4 Ownership Rate : Resolve Contacts -‐0.101** -‐0.149*** -‐0.0886 -‐0.125** (0.0478) (0.0511) (0.0571) (0.0506)
R4 Ownership Rate : Technical Contacts 0.00483 0.0364 0.0308 0.0456 (0.0443) (0.0458) (0.0368) (0.0446)
Won Latrine only 0.0870*** 0.123*** 0.0761*** 0.122*** (0.0257) (0.0239) (0.0187) (0.0205)
Won Tin only 0.0515** 0.0271 0.0770*** 0.00895 (0.0238) (0.0269) (0.0272) (0.0231)
Won both 0.166*** 0.222*** 0.169*** 0.218*** (0.0252) (0.0245) (0.0193) (0.0199)
ObservaRons 4,255 4,255 8,674 8,674 R-‐squared 0.057 0.081 0.056 0.088 Union Fixed Effects? Yes Yes Yes Yes 1st parRal R2 0.296 0.242 0.103 0.0947 1st F-‐test 39.74 31.39 19.89 12.61
* Controlled subsidy eligibility of contacts and baseline latrine/hygienic latrine ownership rate

Targeting Subsidies to the Socially Connected
Eligible Eligible HCI HCI Non-HCI Non-HCI
VARIABLES HCI Village
Non-HCI Village Won Latrine Lost Latrine Won Latrine Lost Latrine
Won Latrine only 0.0695*** 0.0498* (0.0260) (0.0265)
Won Tin only 0.0481* 0.0526 (0.0248) (0.0353)
Won both 0.156*** 0.136*** (0.0245) (0.0287)
Treatment: Medium Intensity
0.0385 0.0807** -0.00124 0.0895** 0.120*** 0.0250
(0.0297) (0.0344) (0.0362) (0.0371) (0.0373) (0.0465) Treatment: High Intensity
0.0446 0.0724* 0.0184 0.0667* 0.106** 0.0253
(0.0307) (0.0417) (0.0364) (0.0354) (0.0468) (0.0511)

Structural Demand Estimation
• Specify a random utility model, and estimate parameters:
• Leads to BLP-style two step estimation: 1. Cluster fixed effects regression:
2. Experiments provide instruments for prices:

Why?
• What is the optimal way to allocate subsidies? – Tradeoff between subsidizing more people
versus increasing intensity of subsidies
• Who should we subsidize? • Identify thresholds using variation within
clusters (experiment only tried 3 thresholds)

2nd step

END Thank you

Sample of “Ineligibles” (richest 25%)