Sanitary, Phytosanitary and Technical Measures in … · Sanitary, Phytosanitary and Technical...
40
Sanitary, Phytosanitary and Technical Measures in Agri-food Trade Dr. Sofía Boza Department of Agricultural Economics Faculty of Agricultural Sciences University of Chile Brown Bag Seminar, April, 16. GTAP, PurdueUniversity
-
Upload
nguyencong -
Category
Documents
-
view
225 -
download
0
Transcript of Sanitary, Phytosanitary and Technical Measures in … · Sanitary, Phytosanitary and Technical...
Sanitary, Phytosanitary and Technical
Measures in Agri-food TradeDr. Sofía Boza
Department of Agricultural Economics
Faculty of Agricultural SciencesFaculty of Agricultural Sciences
University of Chile
Brown Bag Seminar, April, 16. GTAP, Purdue University
Overview
• Introduction
• SPS/TBT Agreements
• WTO member participation• WTO member participation
• Current research review
• Project: “Assessing the impact of sanitary,
phytosanitary and technical requirements on
Chilean food and agricultural trade”
“Non-tariff measures (NTMs) are policy measures, other than
ordinary customs tariffs, that can potentially have an
economic effect on international trade in goods, changingeconomic effect on international trade in goods, changing
quantities traded, or prices or both” (UNCTAD, 2010).
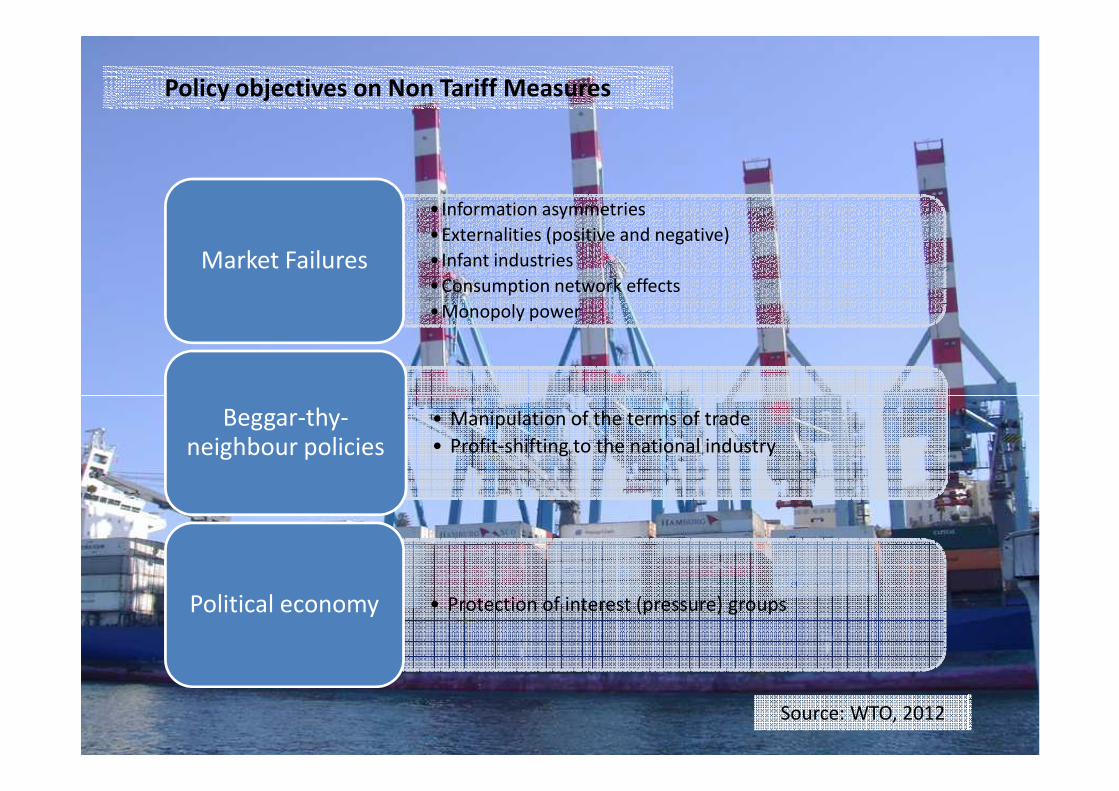
•Information asymmetries
•Externalities (positive and negative)
•Infant industries
•Consumption network effects
•Monopoly power
Market Failures
Policy objectives on Non Tariff Measures
• Manipulation of the terms of trade
• Profit-shifting to the national industry
Beggar-thy-neighbour policies
• Protection of interest (pressure) groupsPolitical economy
Source: WTO, 2012
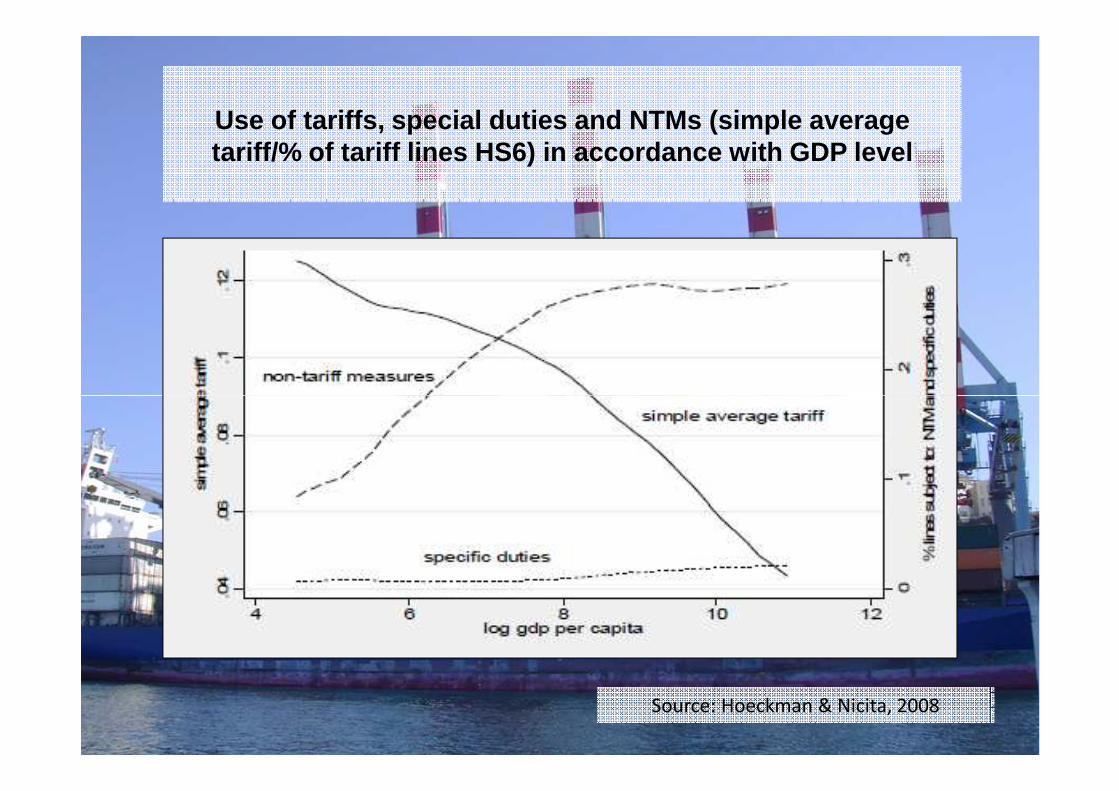
Use of tariffs, special duties and NTMs (simple averag etariff/% of tariff lines HS6) in accordance with GDP le vel
Source: Hoeckman & Nicita, 2008
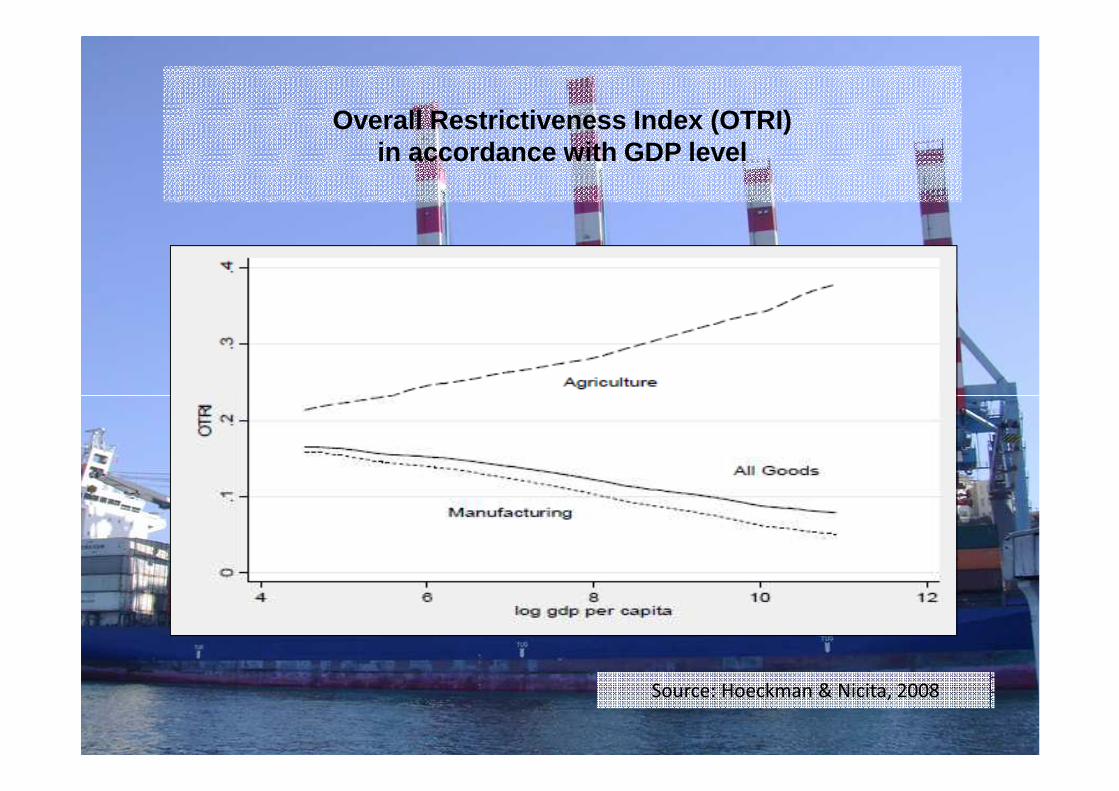
Overall Restrictiveness Index (OTRI) in accordance with GDP level
Source: Hoeckman & Nicita, 2008
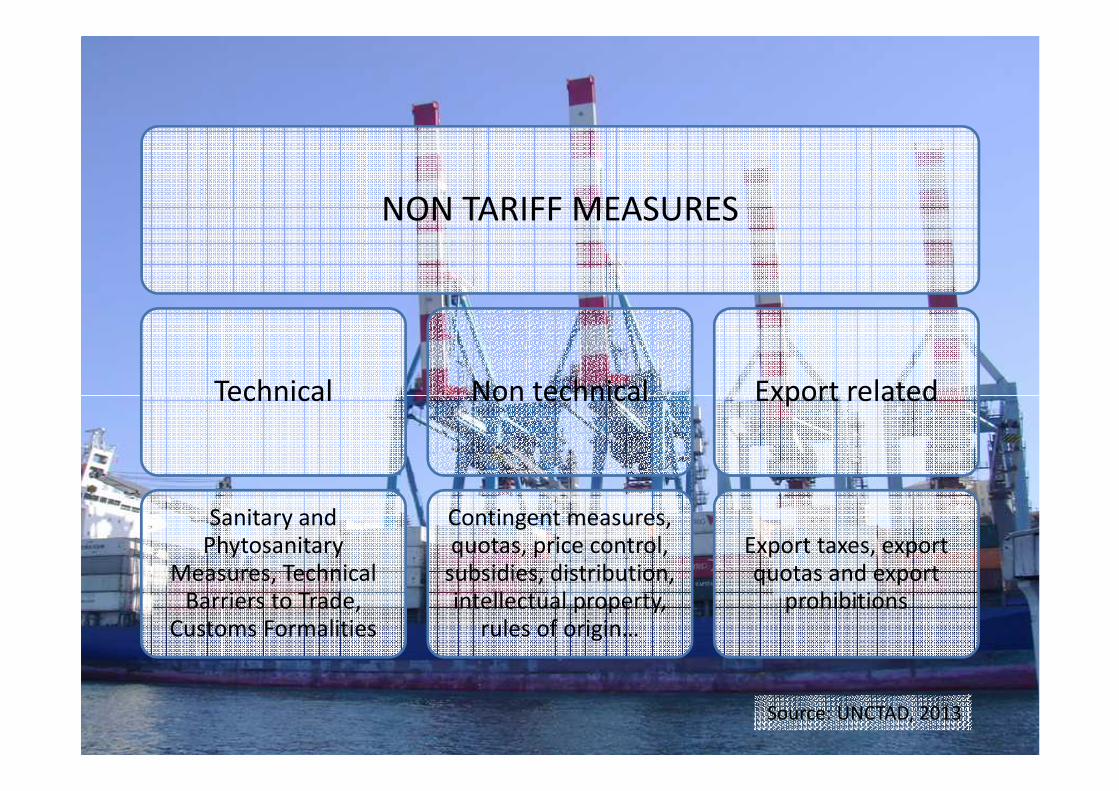
NON TARIFF MEASURES
Technical Non technical Export relatedTechnical
Sanitary and Phytosanitary
Measures, TechnicalBarriers to Trade,
Customs Formalities
Non technical
Contingent measures, quotas, price control,
subsidies, distribution, intellectual property,
rules of origin…
Export related
Export taxes, exportquotas and export
prohibitions
Source: UNCTAD, 2013
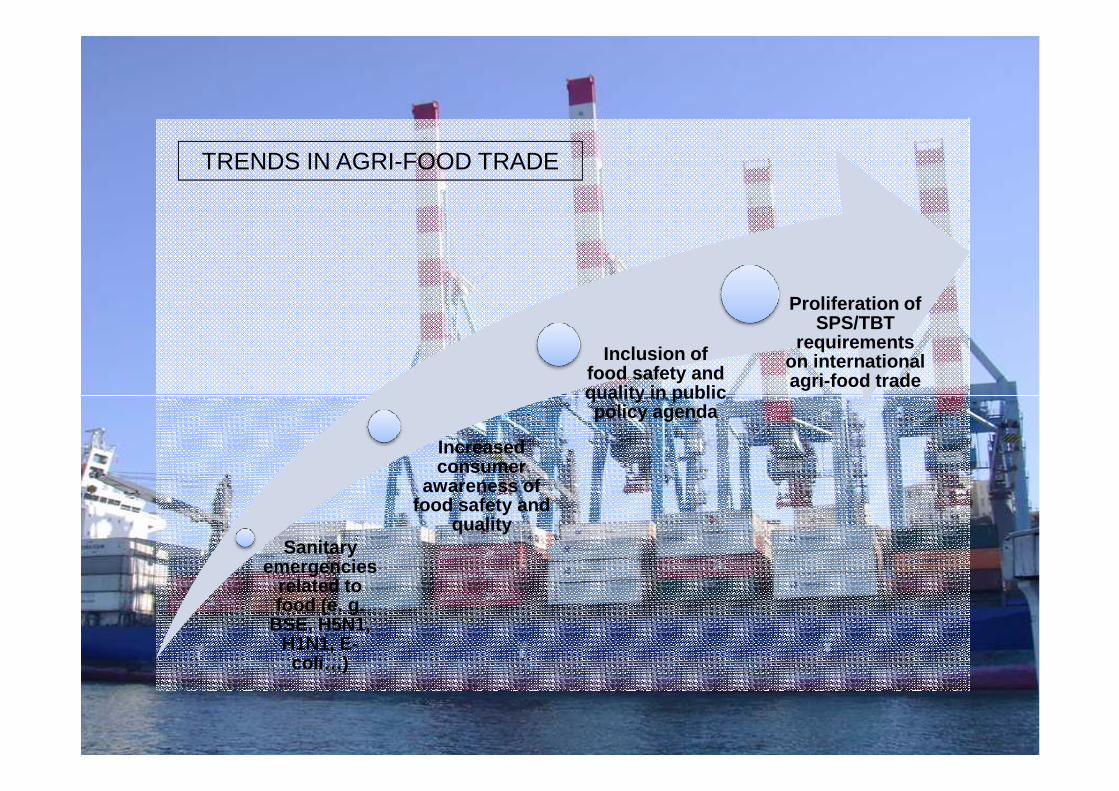
Inclusion of food safety and quality in public
Proliferation of SPS/TBT
requirements on international agri-food trade
TRENDS IN AGRI-FOOD TRADE
Sanitaryemergencies
related tofood (e. g.
BSE, H5N1, H1N1, E-coli…)
Increasedconsumer
awareness of food safety and
quality
quality in publicpolicy agenda
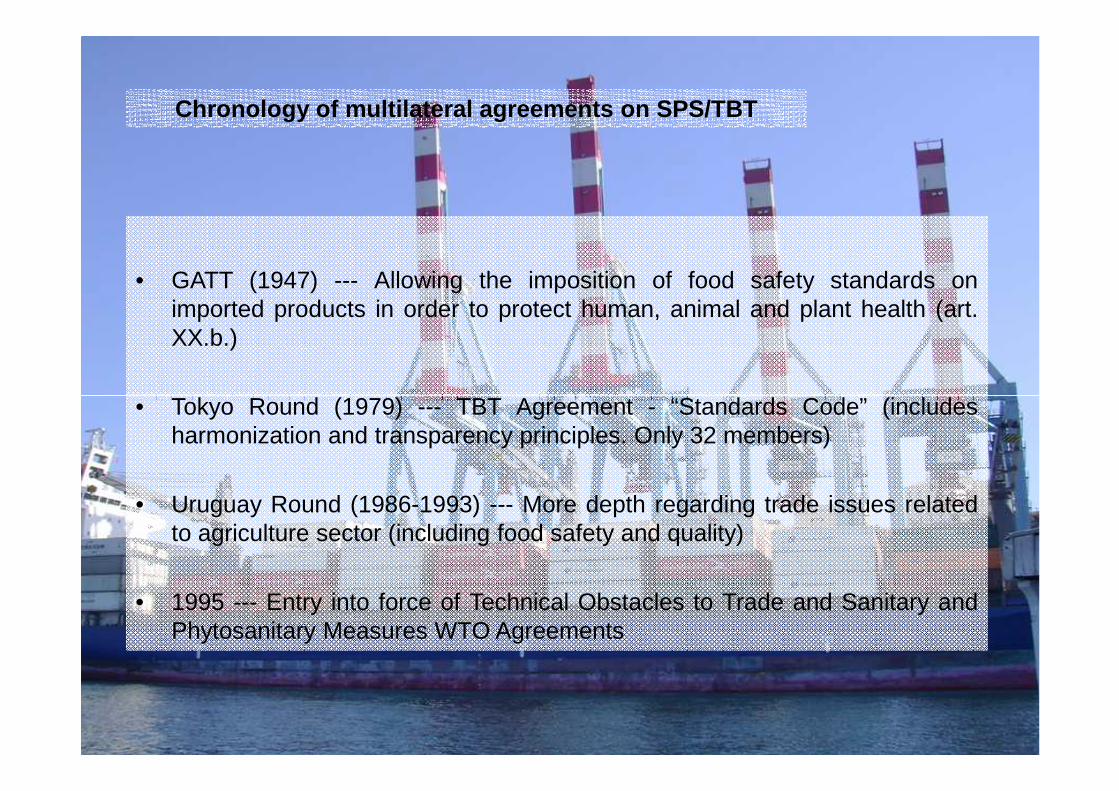
• GATT (1947) --- Allowing the imposition of food safety standards onimported products in order to protect human, animal and plant health (art.XX.b.)
• Tokyo Round (1979) --- TBT Agreement - “Standards Code” (includes
Chronology of multilateral agreements on SPS/TBT
• Tokyo Round (1979) --- TBT Agreement - “Standards Code” (includesharmonization and transparency principles. Only 32 members)
• Uruguay Round (1986-1993) --- More depth regarding trade issues relatedto agriculture sector (including food safety and quality)
• 1995 --- Entry into force of Technical Obstacles to Trade and Sanitary andPhytosanitary Measures WTO Agreements
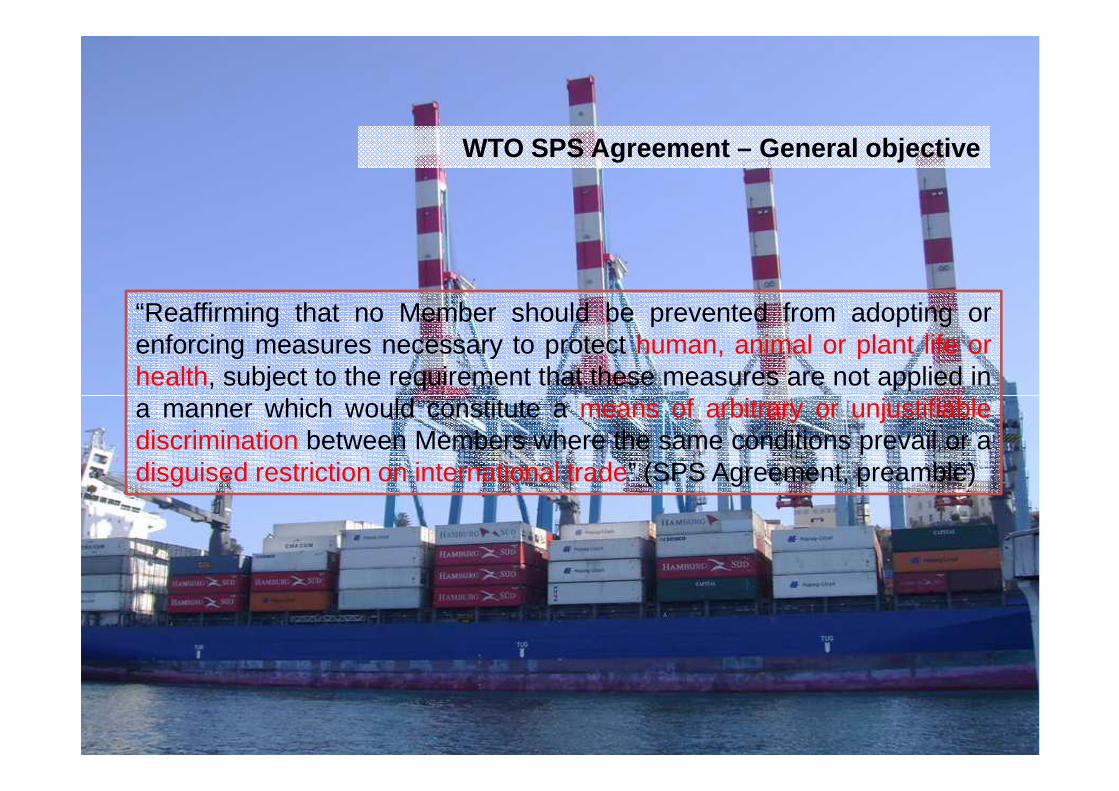
“Reaffirming that no Member should be prevented from adopting orenforcing measures necessary to protect human, animal or plant life orhealth, subject to the requirement that these measures are not applied ina manner which would constitute a means of arbitrary or unjustifiable
WTO SPS Agreement – General objective
a manner which would constitute a means of arbitrary or unjustifiablediscrimination between Members where the same conditions prevail or adisguised restriction on international trade” (SPS Agreement, preamble)
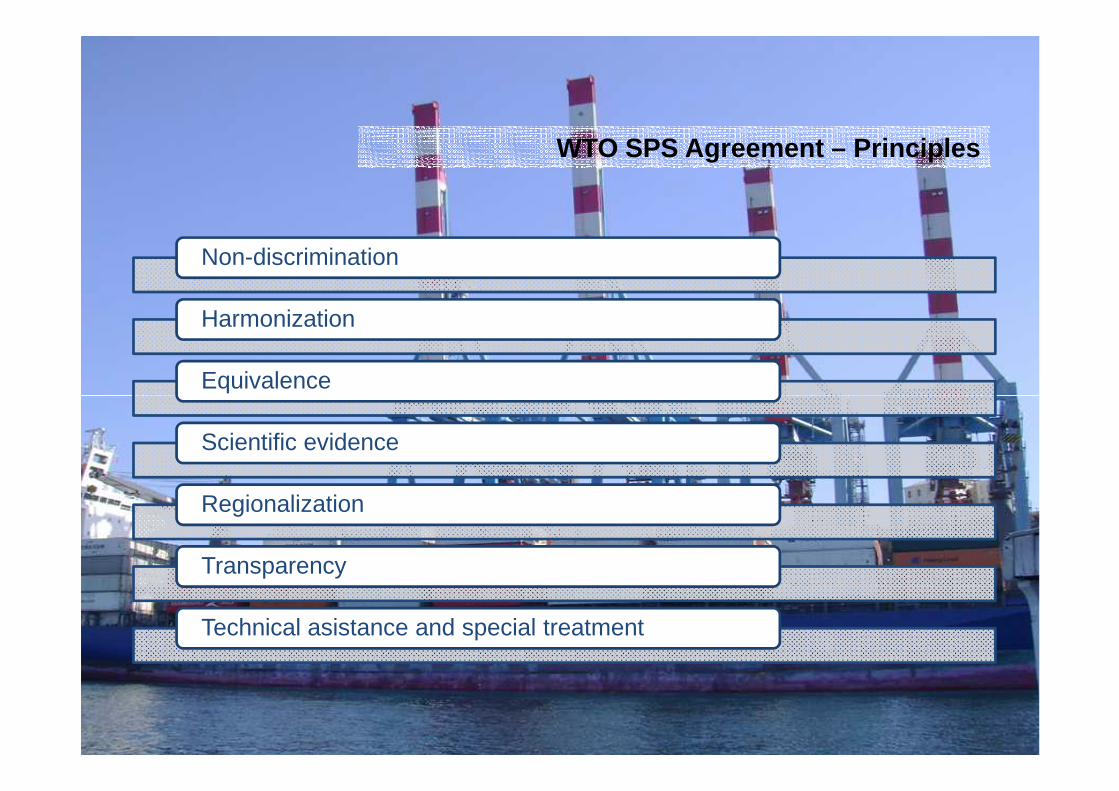
Non-discrimination
Harmonization
Equivalence
WTO SPS Agreement – Principles
Scientific evidence
Regionalization
Transparency
Technical asistance and special treatment
“Recognizing that no country should be prevented from taking measuresnecessary to ensure the quality of its exports, or for the protection ofhuman, animal or plant life or health, of the environment, or for theprevention of deceptive practices, at the levels it considers appropriate,
WTO TBT Agreement – General objective
prevention of deceptive practices, at the levels it considers appropriate,subject to the requirement that they are not applied in a manner whichwould constitute a means of arbitrary or unjustifiable discriminationbetween countries where the same conditions prevail or a disguisedrestriction on international trade” (TBT Agreement, preamble)

Technicalregulations
Measures under the TBT Agreement
Conformityassessmentprocedures
Standards
• “Document which lays down product characteristics or their related processesand production methods, including the applicable administrative provisions, withwhich compliance is mandatory”
1. Technical regulations
• “It may also include or deal exclusively with terminology, symbols, packaging,marking or labelling requirements as they apply to a product, process orproduction method”
(TBT Agreement, Paragraph 1, Annex 1)
• “Document approved by a recognized body, that provides, for common andrepeated use, rules, guidelines or characteristics for products or relatedprocesses and production methods, with which compliance is not mandatory”
2. Standards
• “It may also include or deal exclusively with terminology, symbols, packaging,marking or labeling requirements as they apply to a product, process orproduction method”
(TBT Agreement, Paragraph 2, Annex 1)
• “Any procedure used, directly or indirectly, to determine that relevantrequirements in technical regulations or standards are fulfilled”
• Explanatory note “Conformity assessment procedures include, inter alia,
3. Conformity assessment procedures
• Explanatory note “Conformity assessment procedures include, inter alia,procedures for sampling, testing and inspection; evaluation, verification andassurance of conformity; registration, accreditation and approval as well as theircombinations”
(TBT Agreement, Paragraph 3, Annex 1)
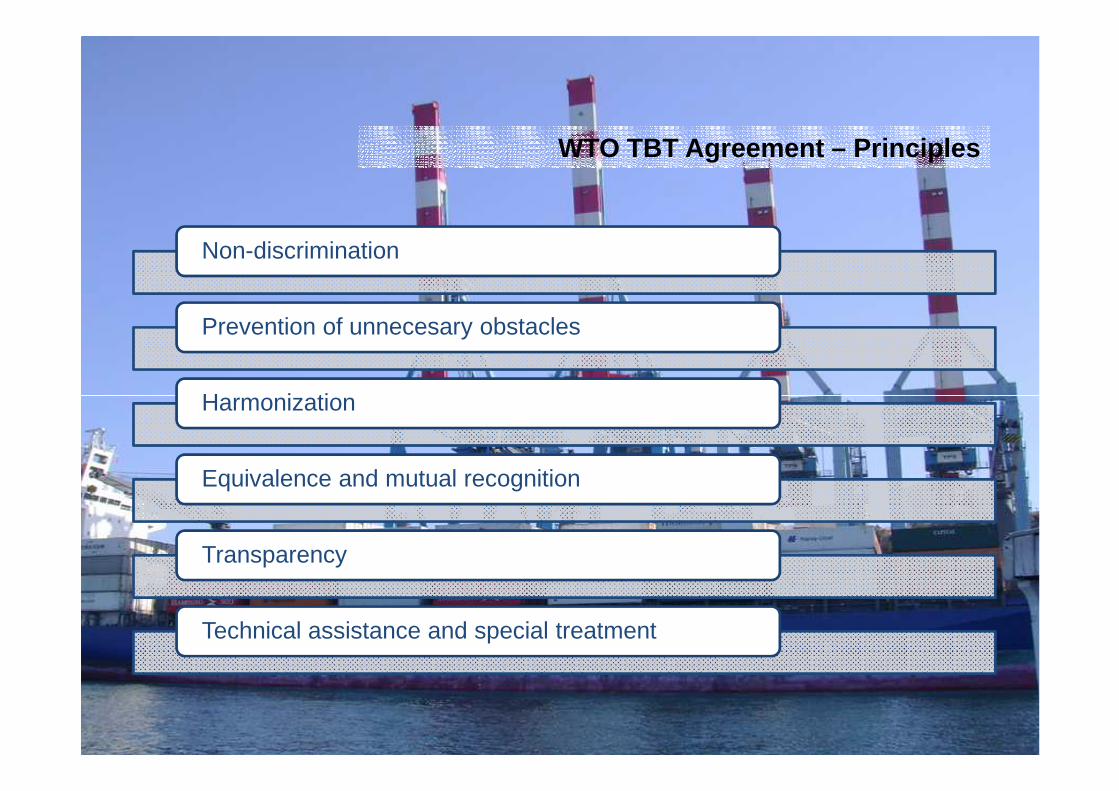
Non-discrimination
Prevention of unnecesary obstacles
Harmonization
WTO TBT Agreement – Principles
Harmonization
Equivalence and mutual recognition
Transparency
Technical assistance and special treatment
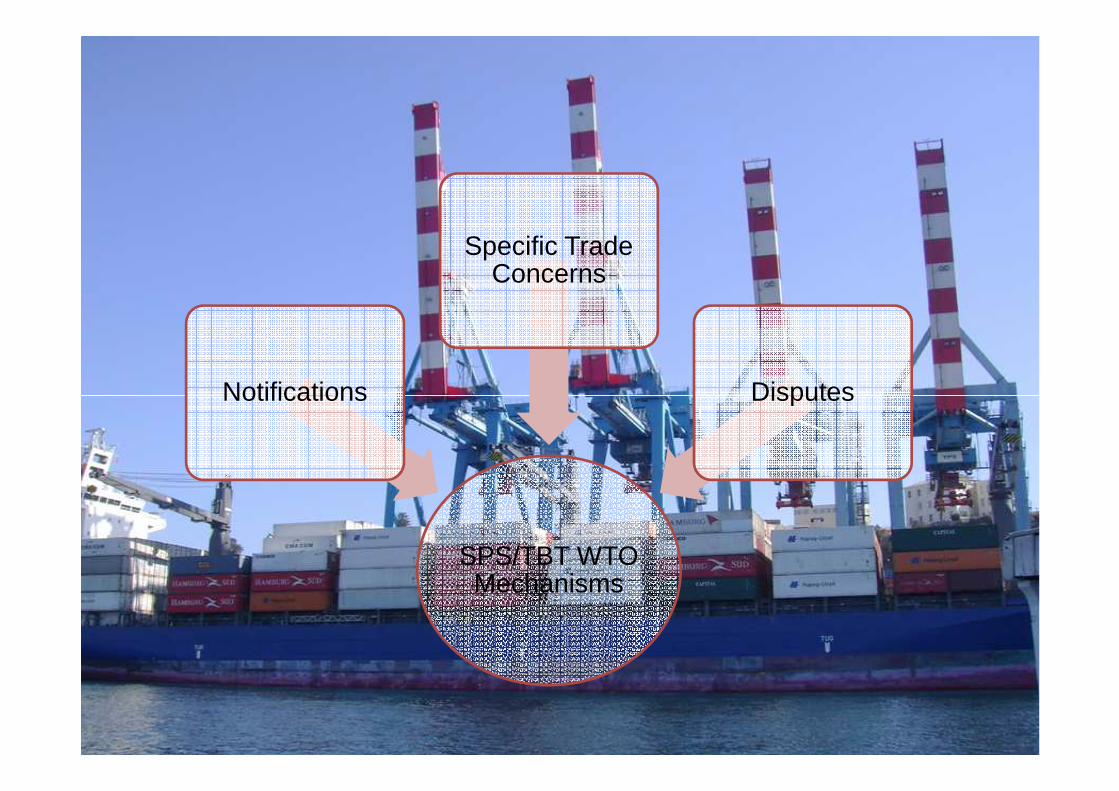
Notifications
Specific TradeConcerns
Disputes
SPS/TBT WTO Mechanisms
Notifications Disputes
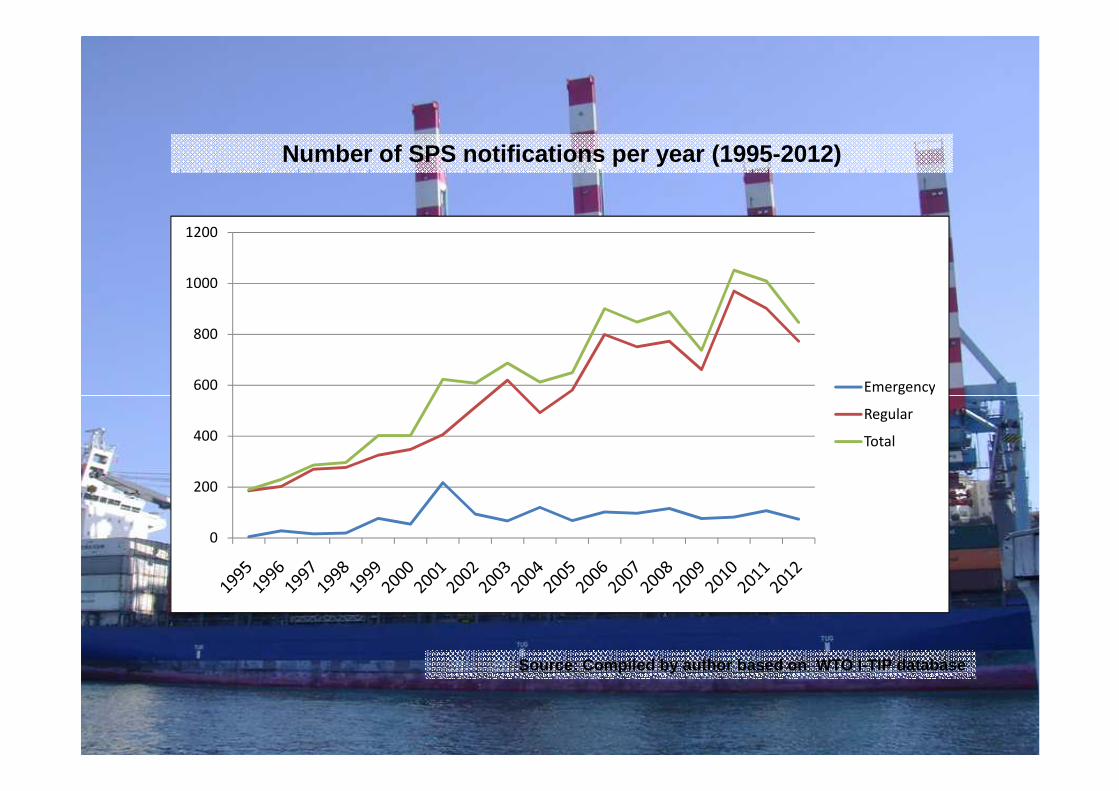
Number of SPS notifications per year (1995-2012)
600
800
1000
1200
Emergency
0
200
400
Emergency
Regular
Total
Source: Compiled by author based on WTO I-TIP data base

Countries participation on SPS notifications by inc ome level (1995-2012)
50
60
70
80
90
100
Low Income
0
10
20
30
40
50Lower-Middle Income
Upper-Middle Income
High Income
Source: Compiled by author based on WTO I-TIP data base
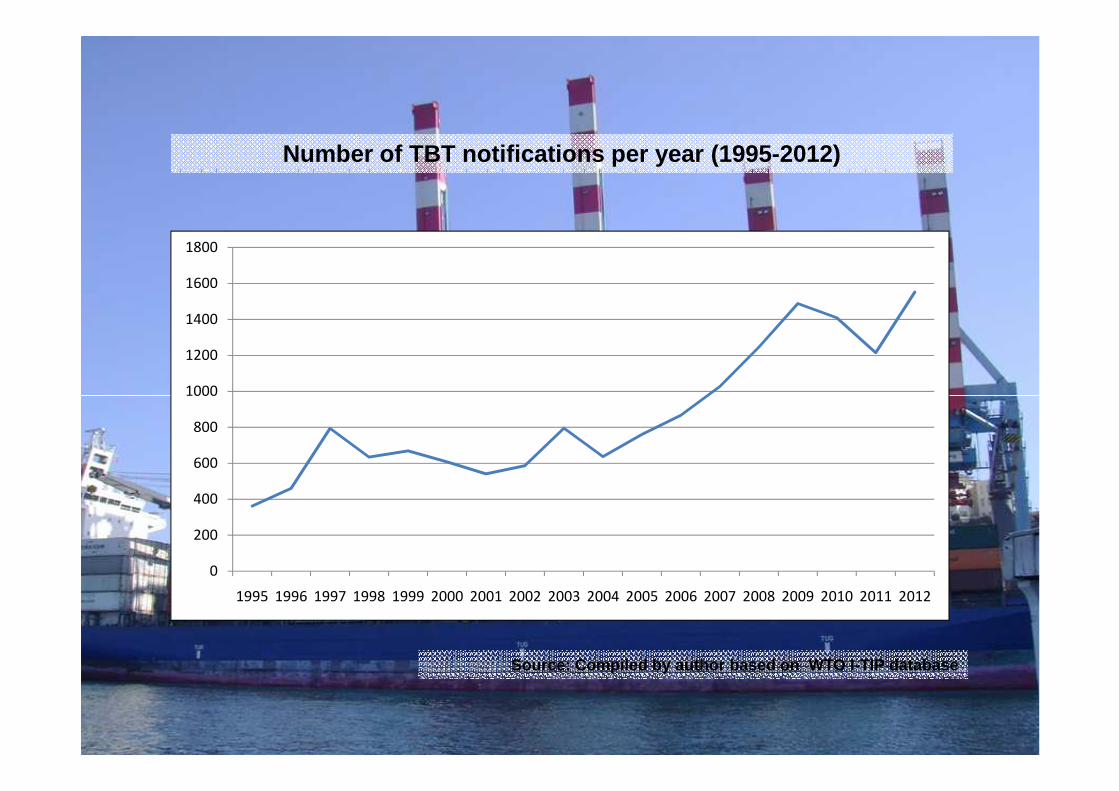
Number of TBT notifications per year (1995-2012)
1000
1200
1400
1600
1800
0
200
400
600
800
1000
1995 1996 1997 1998 1999 2000 2001 2002 2003 2004 2005 2006 2007 2008 2009 2010 2011 2012
Source: Compiled by author based on WTO I-TIP data base
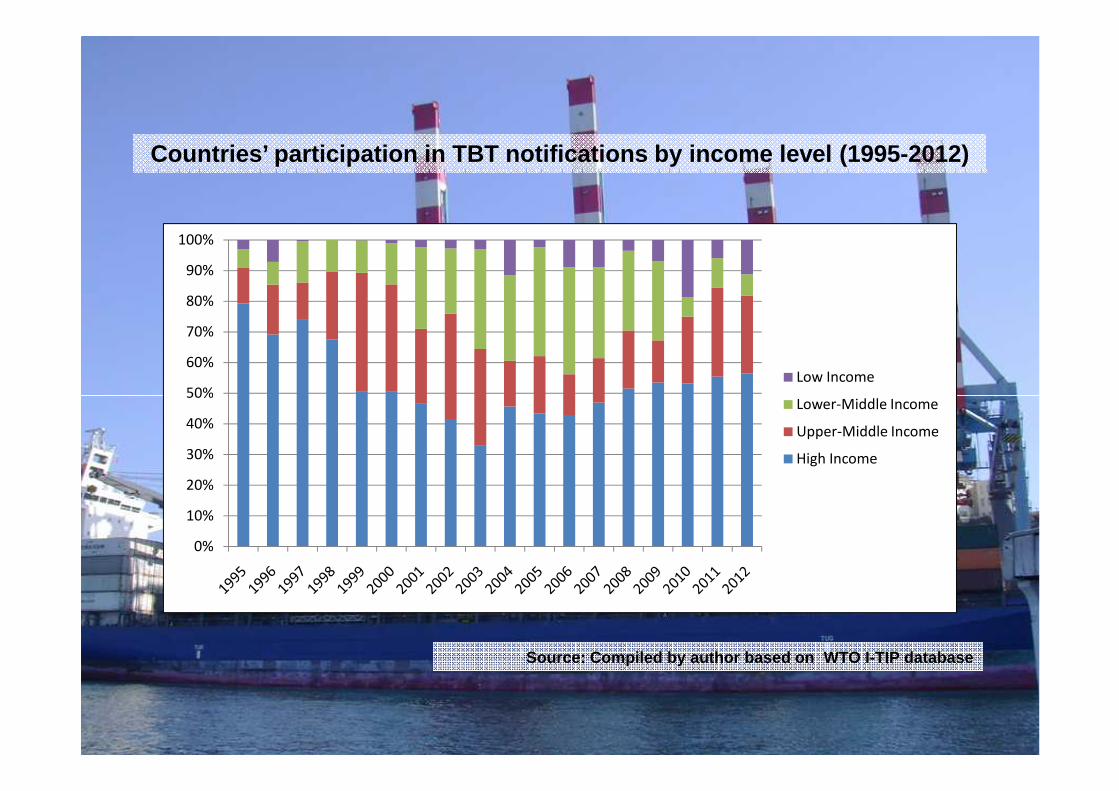
Countries’ participation in TBT notifications by in come level (1995-2012)
50%
60%
70%
80%
90%
100%
Low Income
Lower-Middle Income
0%
10%
20%
30%
40%
50%Lower-Middle Income
Upper-Middle Income
High Income
Source: Compiled by author based on WTO I-TIP data base
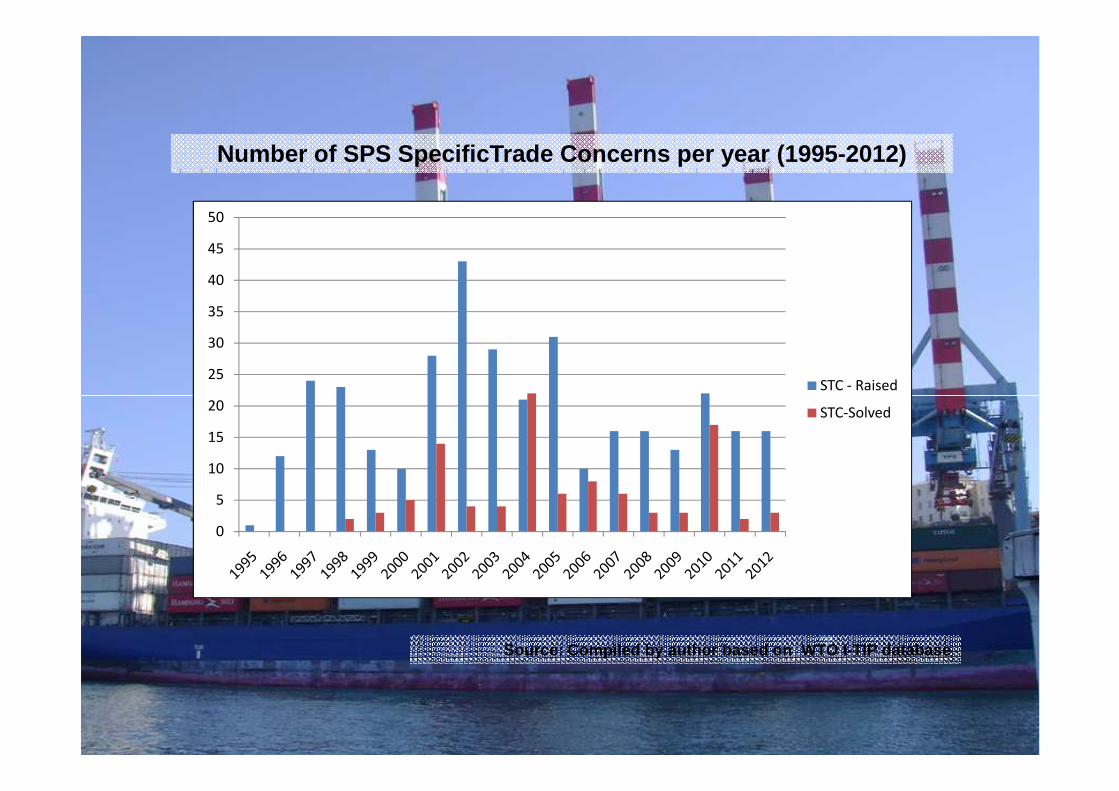
20
25
30
35
40
45
50
STC - Raised
Number of SPS SpecificTrade Concerns per year (1995 -2012)
0
5
10
15
20 STC-Solved
Source: Compiled by author based on WTO I-TIP data base
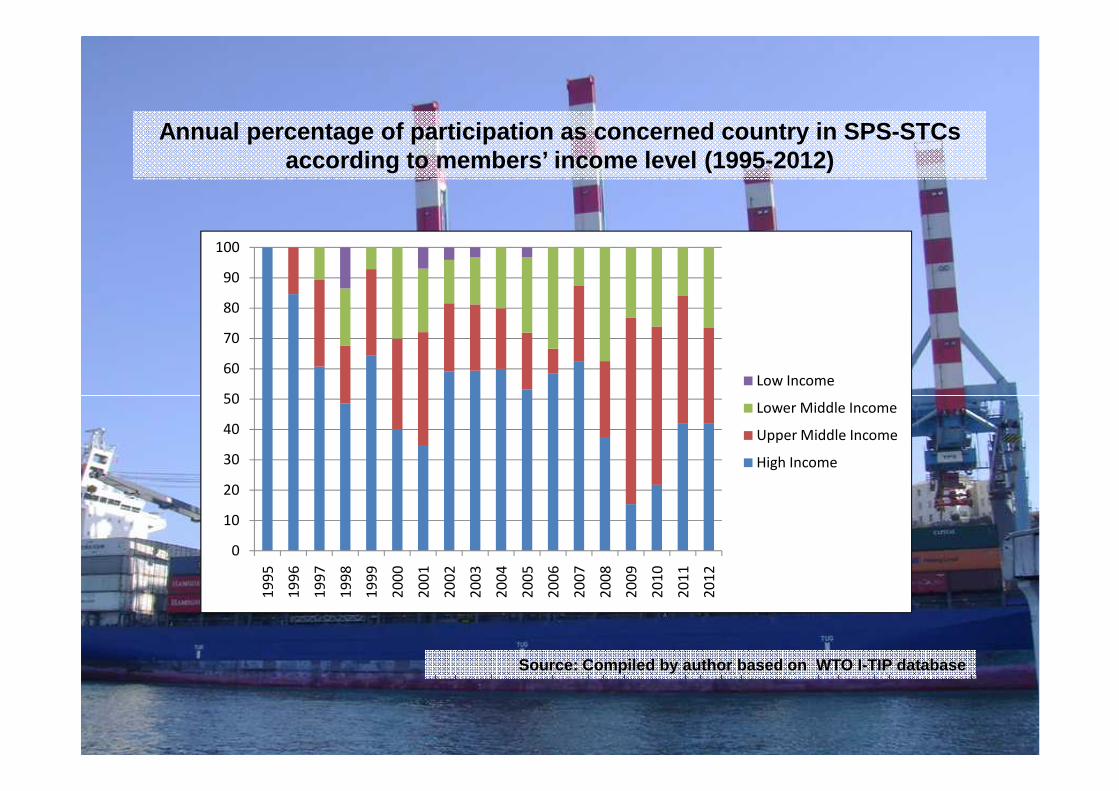
50
60
70
80
90
100
Low Income
Annual percentage of participation as concerned cou ntry in SPS-STCs according to members’ income level (1995-2012)
0
10
20
30
40
50
19
95
19
96
19
97
19
98
19
99
20
00
20
01
20
02
20
03
20
04
20
05
20
06
20
07
20
08
20
09
20
10
20
11
20
12
Lower Middle Income
Upper Middle Income
High Income
Source: Compiled by author based on WTO I-TIP data base
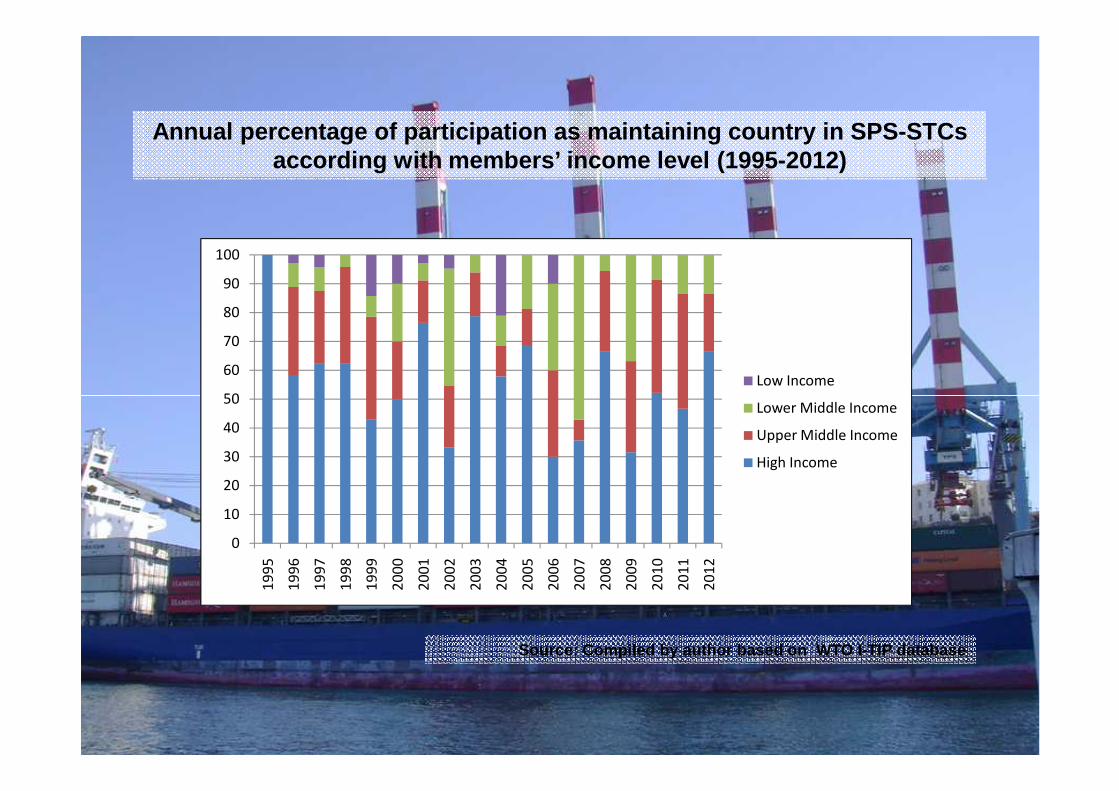
Annual percentage of participation as maintaining c ountry in SPS-STCs according with members’ income level (1995-2012)
50
60
70
80
90
100
Low Income
0
10
20
30
40
50
19
95
19
96
19
97
19
98
19
99
20
00
20
01
20
02
20
03
20
04
20
05
20
06
20
07
20
08
20
09
20
10
20
11
20
12
Lower Middle Income
Upper Middle Income
High Income
Source: Compiled by author based on WTO I-TIP data base

Number of TBT SpecificTrade Concerns per year (1995 -2012)
30
40
50
60
0
10
20
30
19
95
19
96
19
97
19
98
19
99
20
00
20
01
20
02
20
03
20
04
20
05
20
06
20
07
20
08
20
09
20
10
20
11
20
12
TBT-STC
Source: Compiled by author based on WTO I-TIP data base
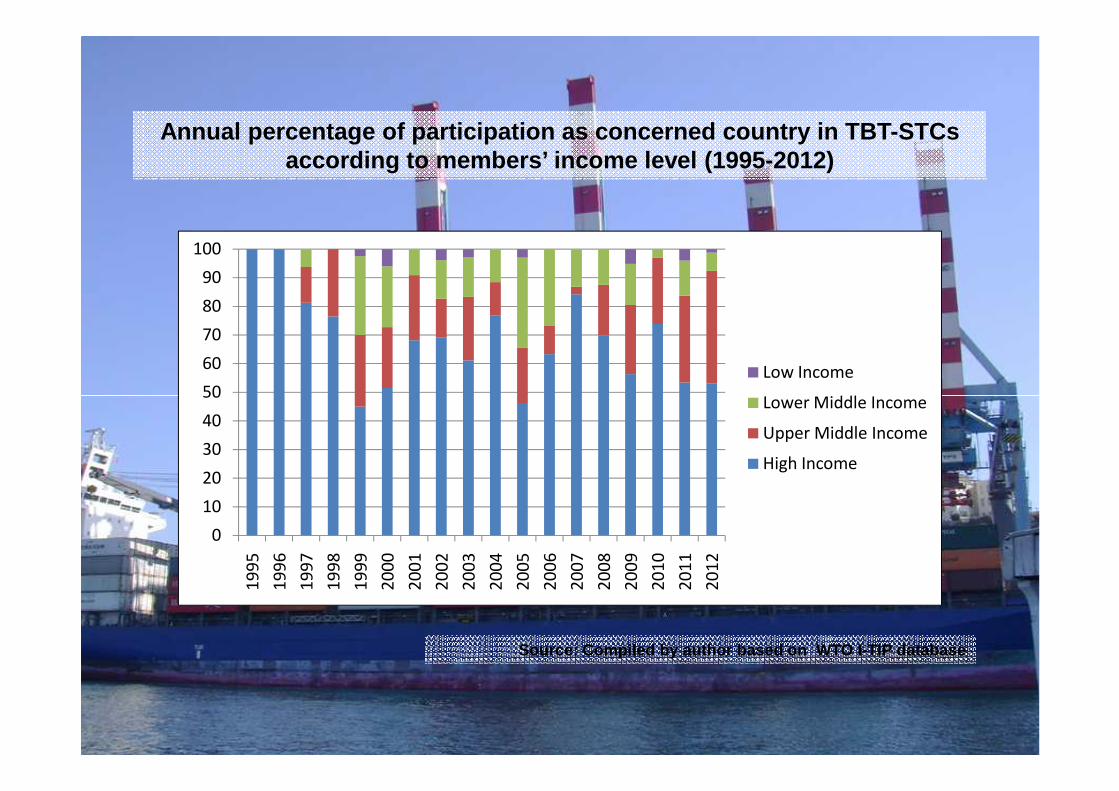
Annual percentage of participation as concerned cou ntry in TBT-STCs according to members’ income level (1995-2012)
50
60
70
80
90
100
Low Income
Lower Middle Income
0
10
20
30
40
50
19
95
19
96
19
97
19
98
19
99
20
00
20
01
20
02
20
03
20
04
20
05
20
06
20
07
20
08
20
09
20
10
20
11
20
12
Lower Middle Income
Upper Middle Income
High Income
Source: Compiled by author based on WTO I-TIP data base
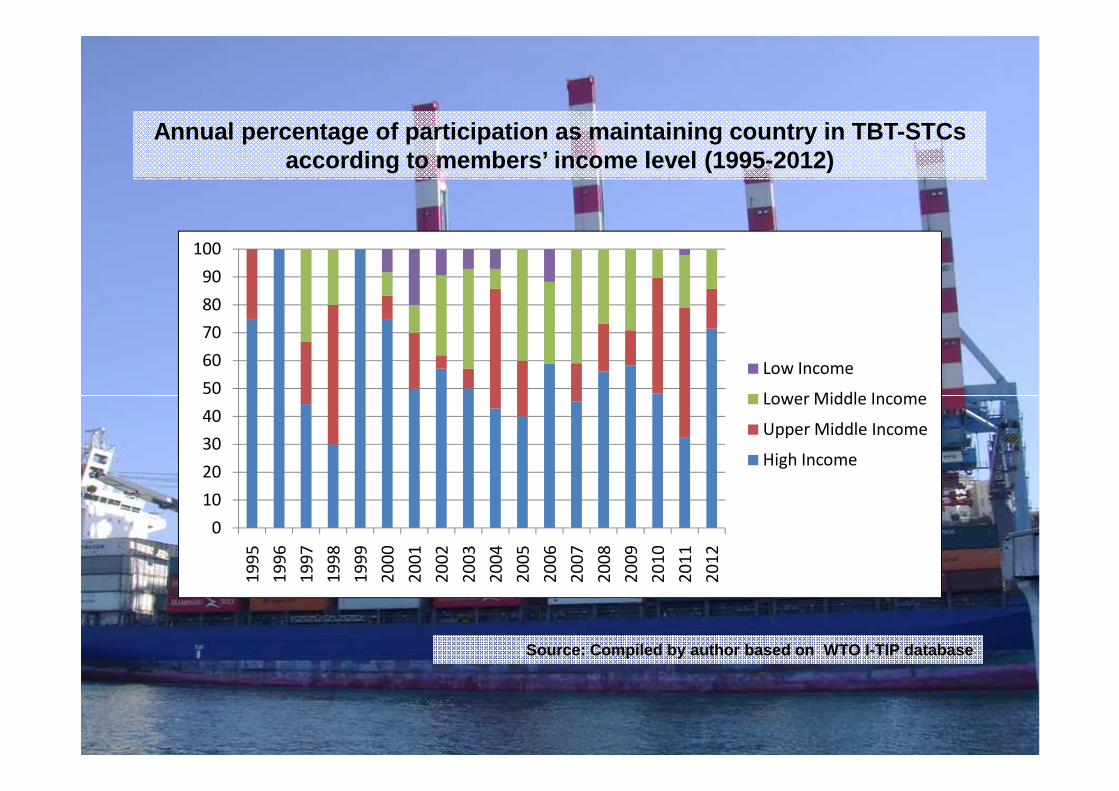
Annual percentage of participation as maintaining c ountry in TBT-STCs according to members’ income level (1995-2012)
50
60
70
80
90
100
Low Income
Lower Middle Income
0
10
20
30
40
50
19
95
19
96
19
97
19
98
19
99
20
00
20
01
20
02
20
03
20
04
20
05
20
06
20
07
20
08
20
09
20
10
20
11
20
12
Lower Middle Income
Upper Middle Income
High Income
Source: Compiled by author based on WTO I-TIP data base
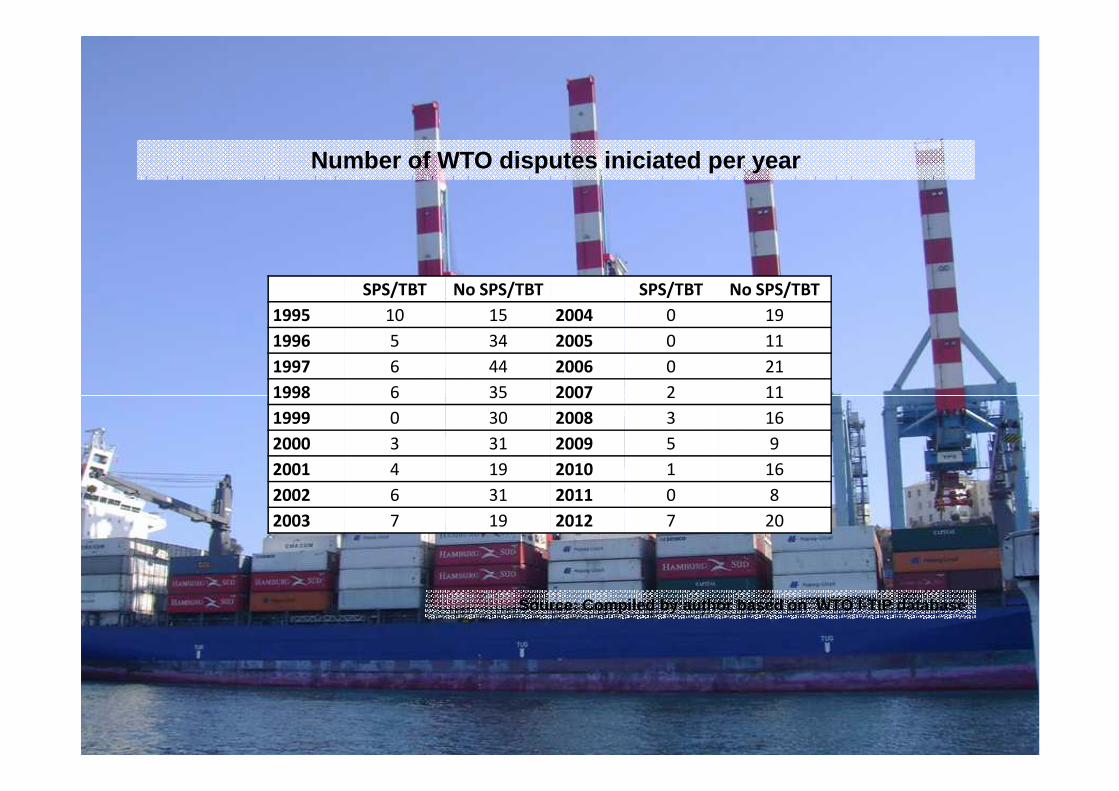
Number of WTO disputes iniciated per year
SPS/TBT No SPS/TBT SPS/TBT No SPS/TBT
1995 10 15 2004 0 19
1996 5 34 2005 0 11
1997 6 44 2006 0 21
1998 6 35 2007 2 111998 6 35 2007 2 11
1999 0 30 2008 3 16
2000 3 31 2009 5 9
2001 4 19 2010 1 16
2002 6 31 2011 0 8
2003 7 19 2012 7 20
Source: Compiled by author based on WTO I-TIP data base
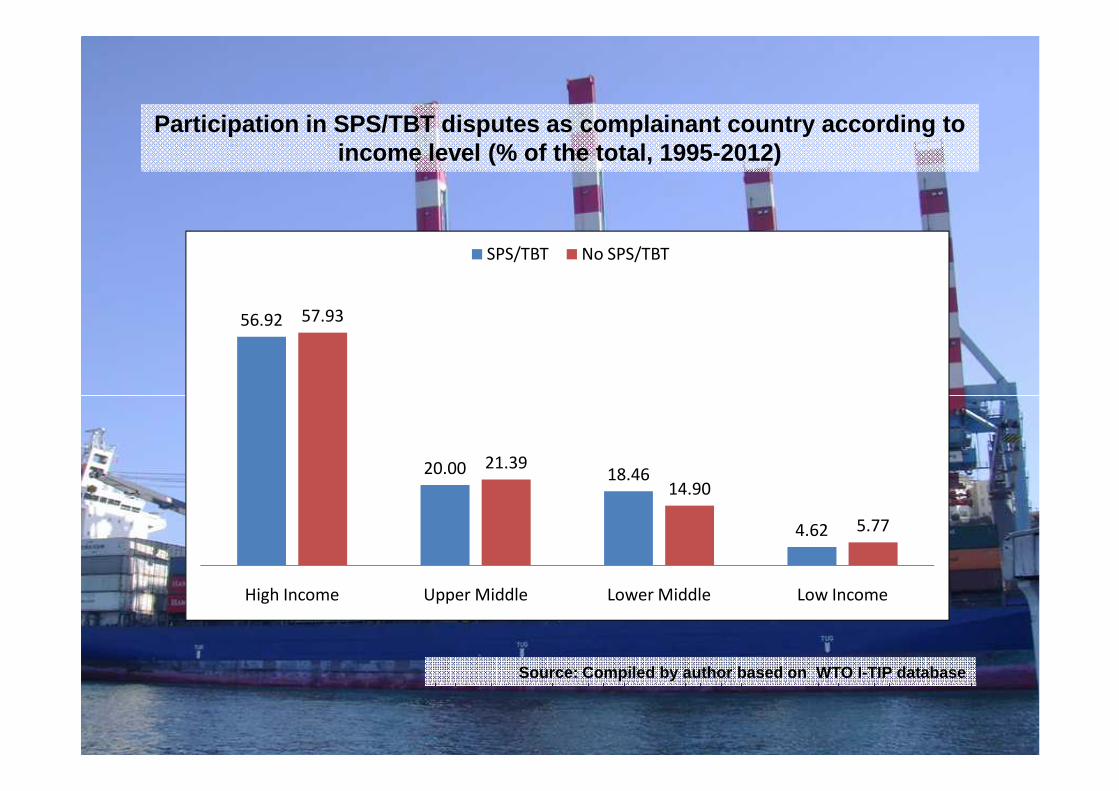
56.92 57.93
SPS/TBT No SPS/TBT
Participation in SPS/TBT disputes as complainant co untry according to income level (% of the total, 1995-2012)
20.00 18.46
4.62
21.39
14.90
5.77
High Income Upper Middle Lower Middle Low Income
Source: Compiled by author based on WTO I-TIP data base
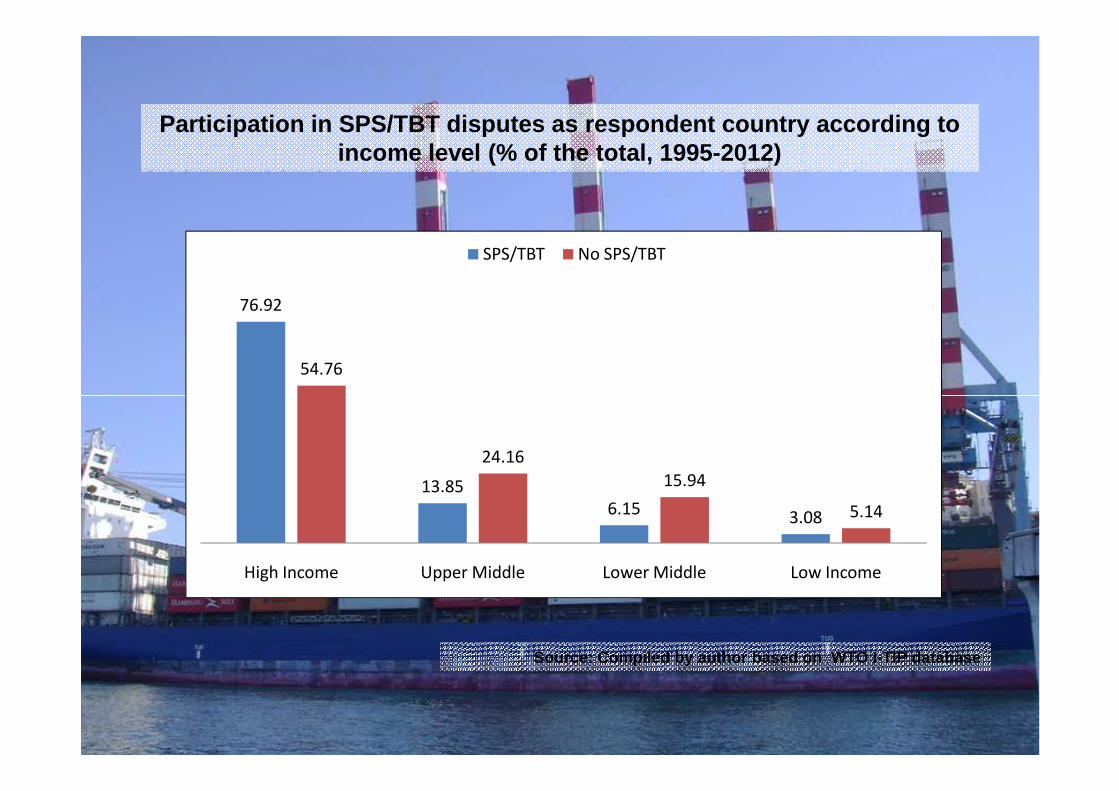
Participation in SPS/TBT disputes as respondent cou ntry according to income level (% of the total, 1995-2012)
76.92
54.76
SPS/TBT No SPS/TBT
13.85
6.153.08
24.16
15.94
5.14
High Income Upper Middle Lower Middle Low Income
Source: Compiled by author based on WTO I-TIP data base
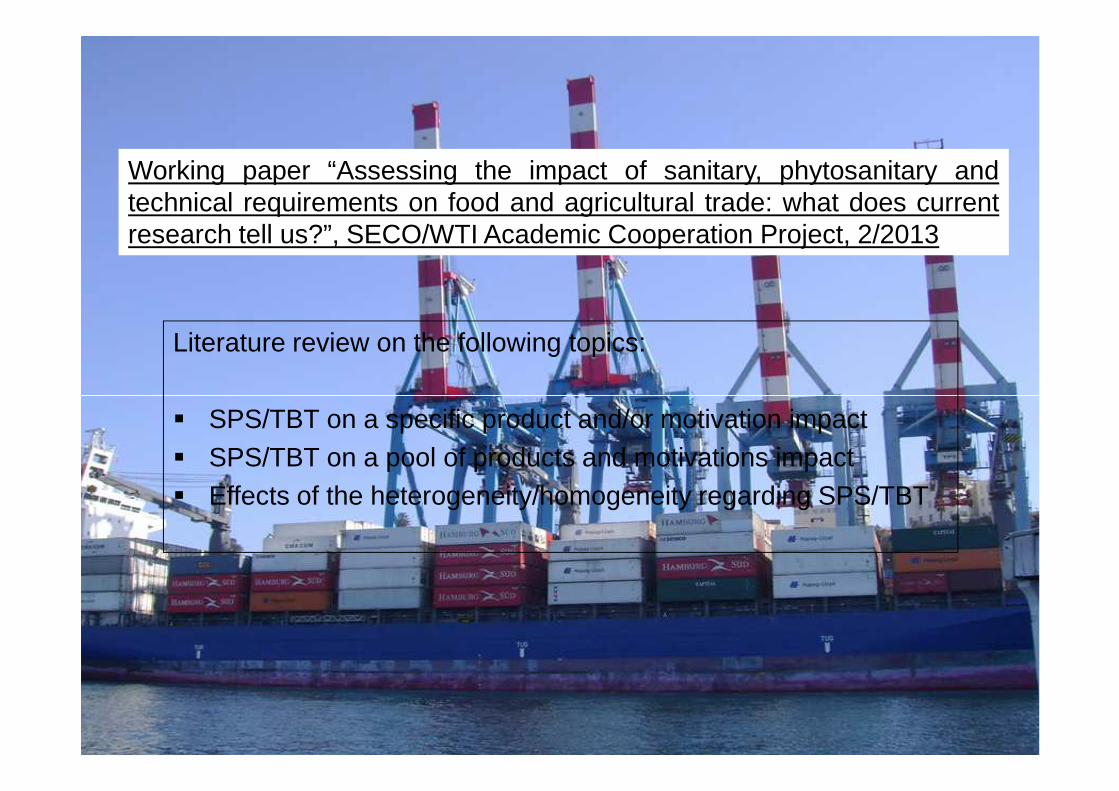
Literature review on the following topics:
Working paper “Assessing the impact of sanitary, phytosanitary andtechnical requirements on food and agricultural trade: what does currentresearch tell us?”, SECO/WTI Academic Cooperation Project, 2/2013
� SPS/TBT on a specific product and/or motivation impact� SPS/TBT on a pool of products and motivations impact� Effects of the heterogeneity/homogeneity regarding SPS/TBT
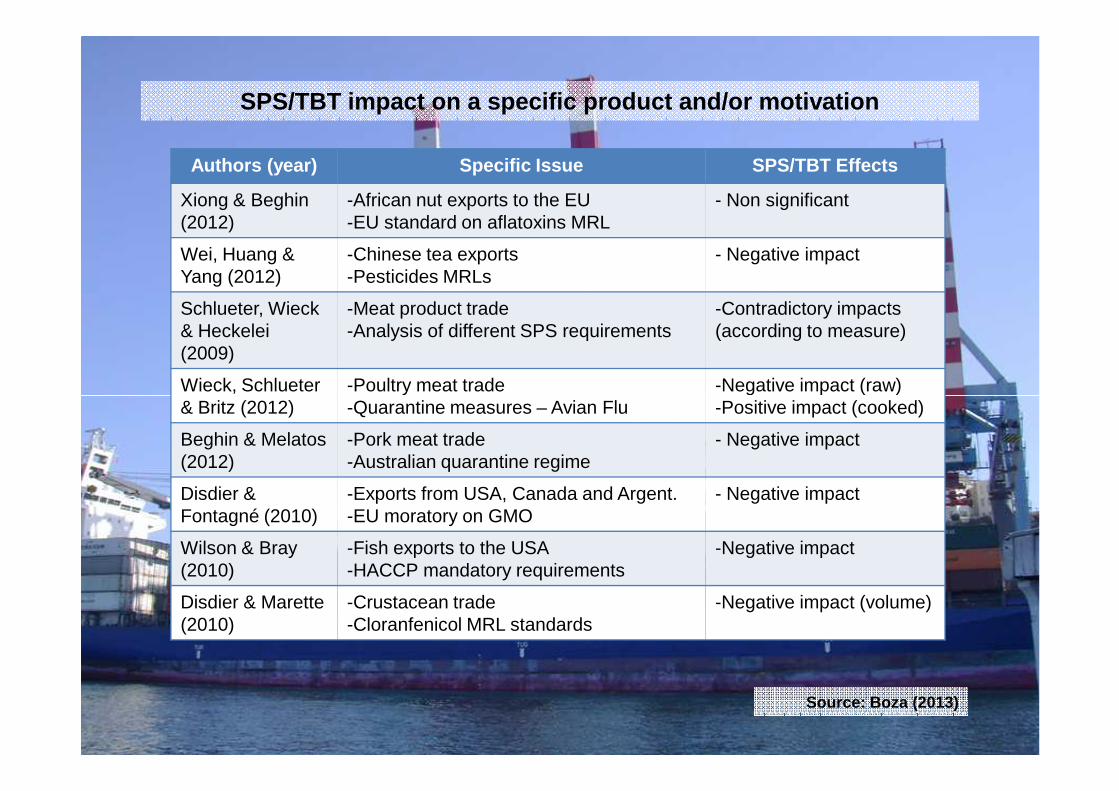
Authors (year) Specific Issue SPS/TBT Effects
Xiong & Beghin(2012)
-African nut exports to the EU-EU standard on aflatoxins MRL
- Non significant
Wei, Huang & Yang (2012)
-Chinese tea exports-Pesticides MRLs
- Negative impact
Schlueter, Wieck& Heckelei(2009)
-Meat product trade-Analysis of different SPS requirements
-Contradictory impacts(according to measure)
Wieck, Schlueter -Poultry meat trade -Negative impact (raw)
SPS/TBT impact on a specific product and/or motivat ion
& Britz (2012) -Quarantine measures – Avian Flu -Positive impact (cooked)
Beghin & Melatos(2012)
-Pork meat trade-Australian quarantine regime
- Negative impact
Disdier & Fontagné (2010)
-Exports from USA, Canada and Argent.-EU moratory on GMO
- Negative impact
Wilson & Bray(2010)
-Fish exports to the USA-HACCP mandatory requirements
-Negative impact
Disdier & Marette(2010)
-Crustacean trade-Cloranfenicol MRL standards
-Negative impact (volume)
Source: Boza (2013)

Authors (year) Specific Issue SPS/TBT Effects
Hoeckman & Nicita(2008)
- Global trade overview-Tariffs, NTMs and “red tape”
- Significant impact
Disdier, Fontagné & Mimouni (2008)
-International agricultural trade-SPS/TBT
-Non significant (OECD)-Negative impact (non OECD)
Crivelli & Groschl(2012)
-International agricultural trade-SPS/TBT
-Contradictory impacts(according to measure)
Bao & Qiu (2010) -Imports to China-TBT raised by China
-Negative impact
SPS/TBT impact on a pool of products and motivation s
-TBT raised by China
Song & Chen (2010) -Chinese agricultural exports-SPS
-Non significant (voluntary)-Positive impact (mandatory)
Mangelsdorf,Portugal-Pérez & Wilson (2012)
-Chinese agricultural exports-Standards (local/international)
-Negative impact(short term)-Positive impact (long term)
Meneguelli Pinto de Souza & Lee (2011)
-Brazilian poultry exports-SPS/TBT
-Contradictory impacts(according to measure)
Melo et. al. (2012) -Chilean fruit exports-SPS
- Negative impact (accordingto perceived stringency)
Source: Boza (2013)
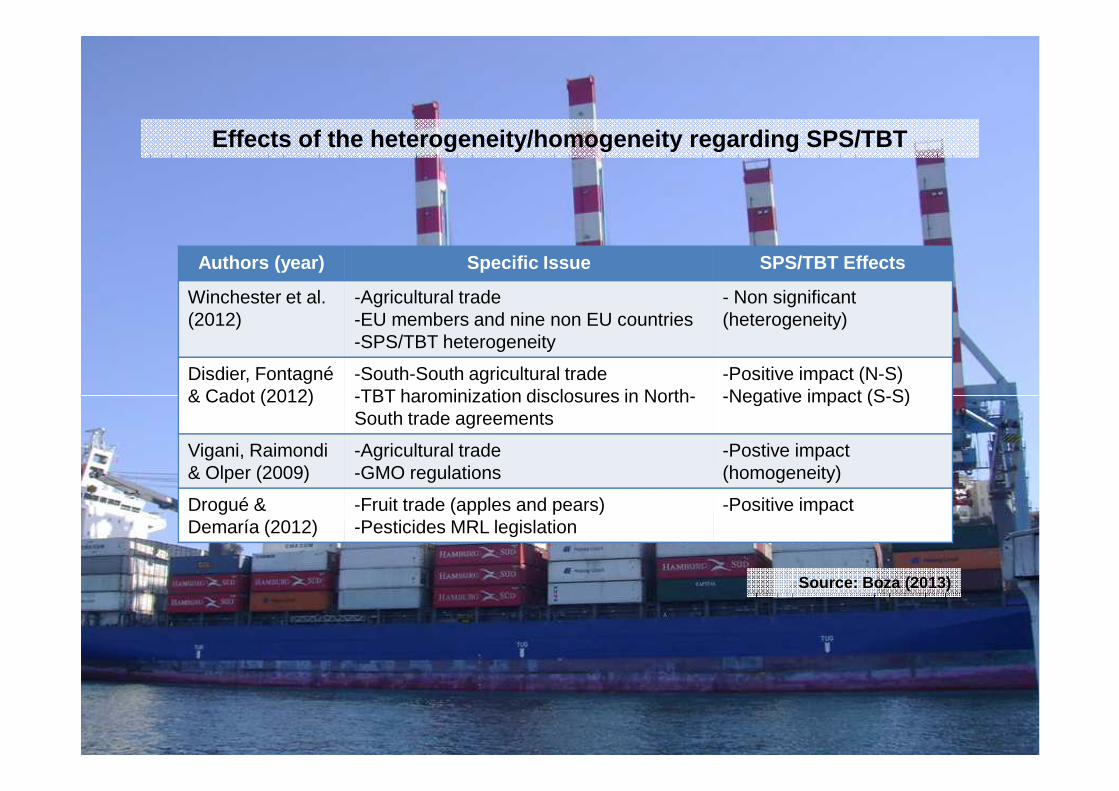
Authors (year) Specific Issue SPS/TBT Effects
Winchester et al. (2012)
-Agricultural trade-EU members and nine non EU countries-SPS/TBT heterogeneity
- Non significant(heterogeneity)
Disdier, Fontagné& Cadot (2012)
-South-South agricultural trade-TBT harominization disclosures in North-
-Positive impact (N-S)-Negative impact (S-S)
Effects of the heterogeneity/homogeneity regarding S PS/TBT
& Cadot (2012) -TBT harominization disclosures in North-South trade agreements
-Negative impact (S-S)
Vigani, Raimondi& Olper (2009)
-Agricultural trade-GMO regulations
-Postive impact(homogeneity)
Drogué & Demaría (2012)
-Fruit trade (apples and pears)-Pesticides MRL legislation
-Positive impact
Source: Boza (2013)
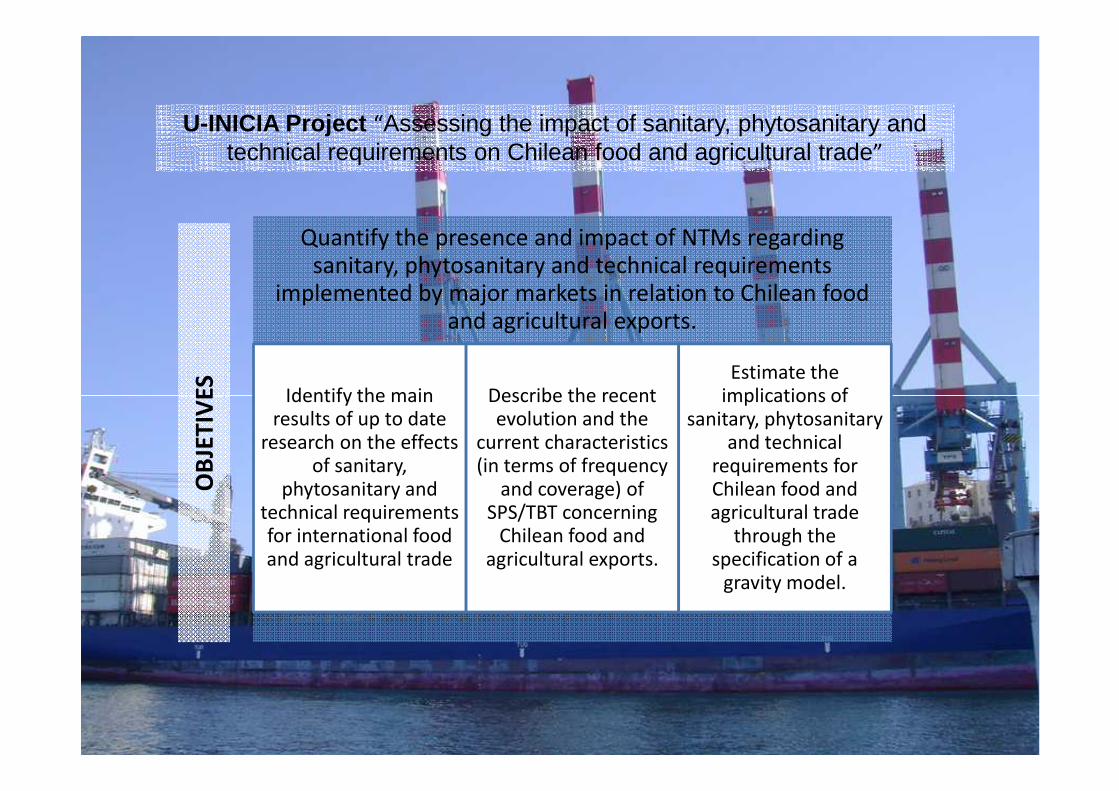
Quantify the presence and impact of NTMs regarding sanitary, phytosanitary and technical requirements
implemented by major markets in relation to Chilean food and agricultural exports.
Identify the main Describe the recent Estimate the
implications of
U-INICIA Project “Assessing the impact of sanitary, phytosanitary and technical requirements on Chilean food and agricultural trade”
OB
JET
IVE
S
Identify the main results of up to date
research on the effects of sanitary,
phytosanitary and technical requirements for international food and agricultural trade
Describe the recent evolution and the
current characteristics (in terms of frequency
and coverage) of SPS/TBT concerning
Chilean food and agricultural exports.
implications of sanitary, phytosanitary
and technical requirements for Chilean food and agricultural trade
through the specification of a
gravity model.
OB
JET
IVE
S
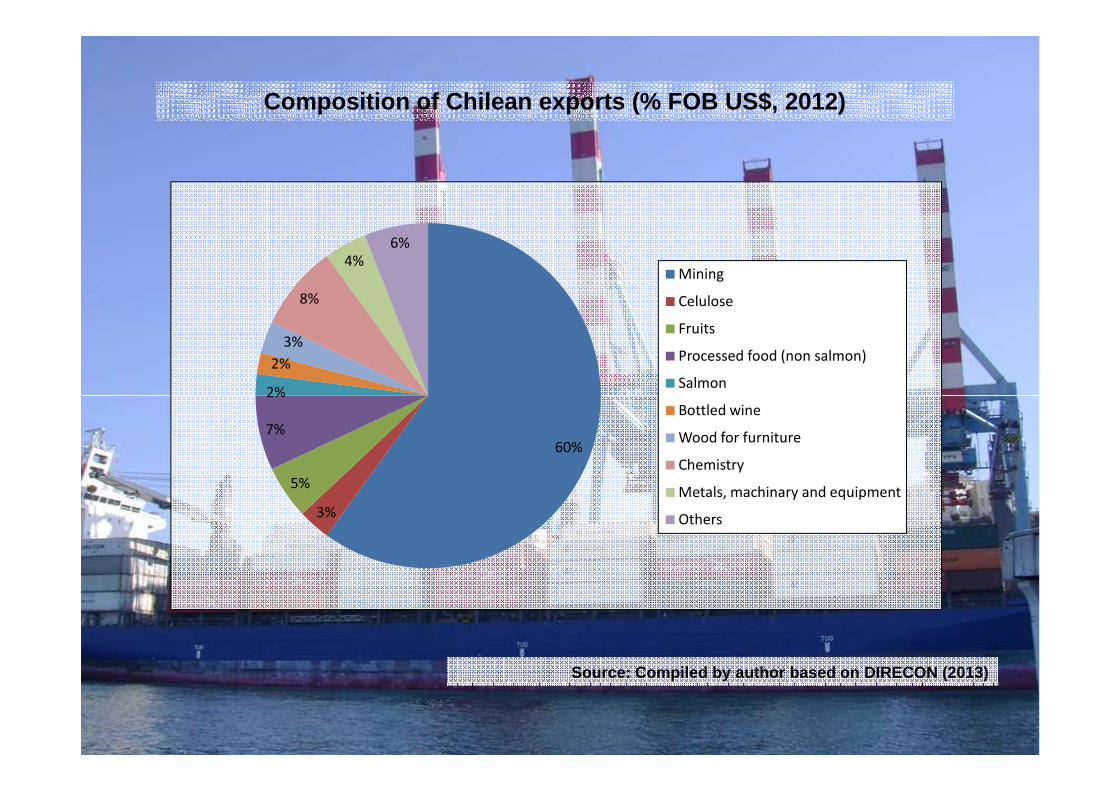
Composition of Chilean exports (% FOB US$, 2012)
2%
2%
3%
8%
4%
6%
Mining
Celulose
Fruits
Processed food (non salmon)
Salmon
Source: Compiled by author based on DIRECON (2013)
60%
3%
5%
7%
2%
Bottled wine
Wood for furniture
Chemistry
Metals, machinary and equipment
Others
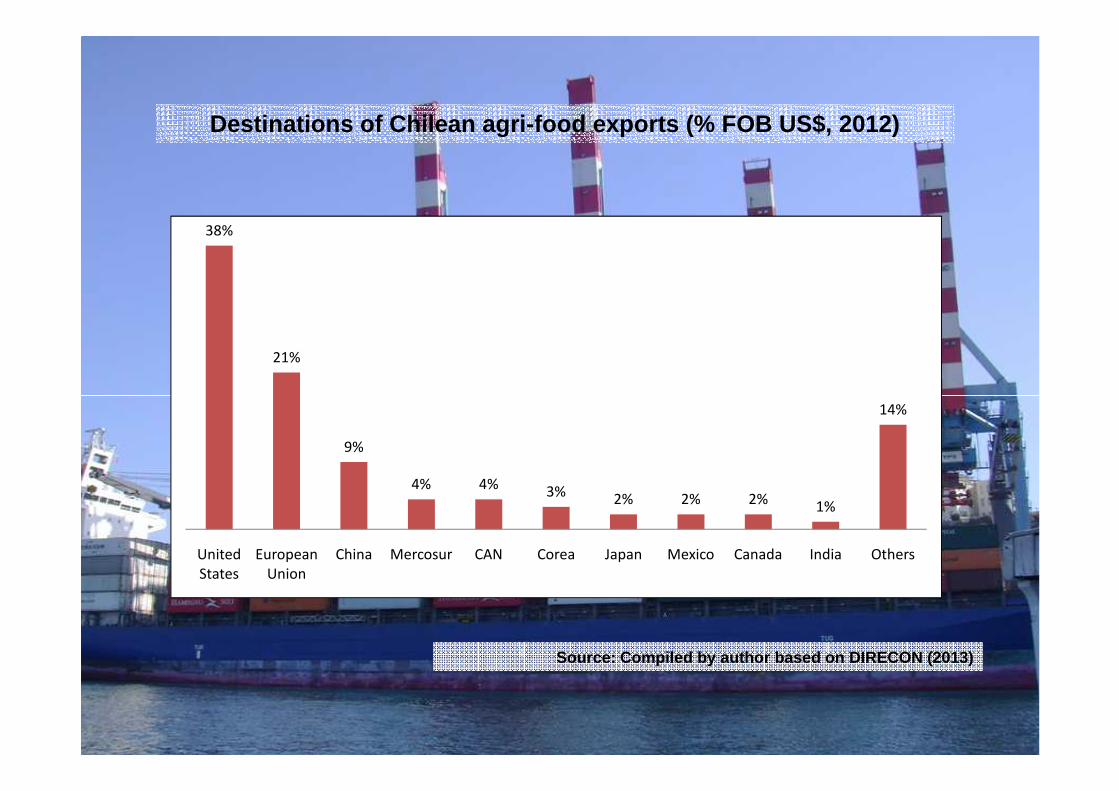
38%
21%
Destinations of Chilean agri-food exports (% FOB US $, 2012)
9%
4% 4%3%
2% 2% 2%1%
14%
United
States
European
Union
China Mercosur CAN Corea Japan Mexico Canada India Others
Source: Compiled by author based on DIRECON (2013)
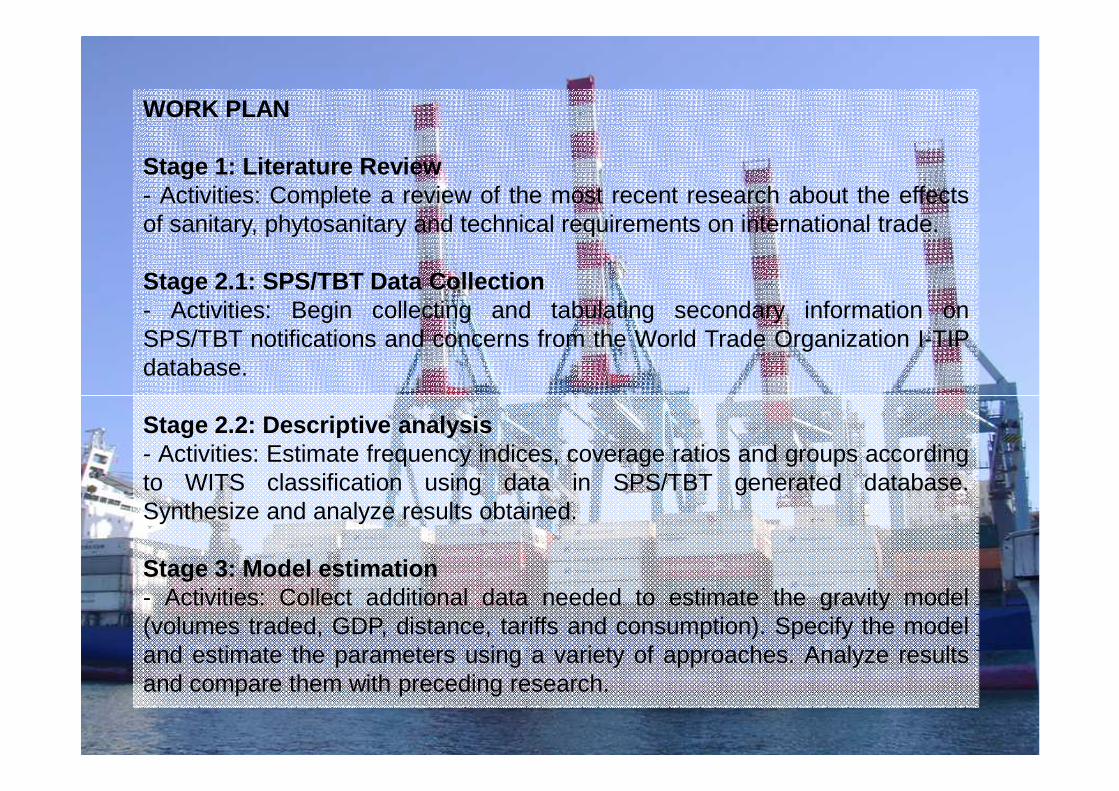
WORK PLAN
Stage 1: Literature Review- Activities: Complete a review of the most recent research about the effectsof sanitary, phytosanitary and technical requirements on international trade.
Stage 2.1: SPS/TBT Data Collection- Activities: Begin collecting and tabulating secondary information onSPS/TBT notifications and concerns from the World Trade Organization I-TIPdatabase.
Stage 2.2: Descriptive analysis- Activities: Estimate frequency indices, coverage ratios and groups accordingto WITS classification using data in SPS/TBT generated database.Synthesize and analyze results obtained.
Stage 3: Model estimation- Activities: Collect additional data needed to estimate the gravity model(volumes traded, GDP, distance, tariffs and consumption). Specify the modeland estimate the parameters using a variety of approaches. Analyze resultsand compare them with preceding research.
Dr. Sofía Boza
Department of Agricultural Economics
Faculty of Agricultural Sciences
University of Chile