Sandy - Risk Budget - · PDF fileactive portfolio are equal. 7 ... Active Management...
25
1 Risk Budgeting Northfield Information Services Northfield Information Services Newport Conference Newport Conference June 2005 June 2005 Sandy Warrick, CFA Sandy Warrick, CFA
Transcript of Sandy - Risk Budget - · PDF fileactive portfolio are equal. 7 ... Active Management...

1
Risk BudgetingNorthfield Information ServicesNorthfield Information Services
Newport ConferenceNewport ConferenceJune 2005June 2005
Sandy Warrick, CFASandy Warrick, CFA

2
What is Risk Budgeting?
§§ Risk budgeting is the process of setting Risk budgeting is the process of setting and allocating active (alpha) risk to and allocating active (alpha) risk to enhance the returns available from enhance the returns available from passive management (beta).passive management (beta).§§ “… separates risk budgeting and “… separates risk budgeting and VaRVaR
measurement from … asset allocation.” measurement from … asset allocation.” (McCarthy in (McCarthy in RahlRahl))

3
Literature:
WaringWaring, B., Whitney, , B., Whitney, PironePirone and and CastilleCastille, “Optimizing , “Optimizing Manager Structure and Budgeting Manager Risk,” Manager Structure and Budgeting Manager Risk,” Journal of Portfolio ManagementJournal of Portfolio Management, Spring 2000., Spring 2000.
RahlRahl, Leslie, , Leslie, Risk Budgeting: A New Investment Risk Budgeting: A New Investment ApproachApproach, Risk Books, 2000, Risk Books, Risk Books, 2000, Risk Books
Chow, G. and Kritzman, M., “Risk Budgets,” Chow, G. and Kritzman, M., “Risk Budgets,” Journal of Journal of Portfolio ManagementPortfolio Management, Winter 2001, Winter 2001
Blitz, D and Blitz, D and HottingaHottinga, A., “Tracking Error Allocation,” , A., “Tracking Error Allocation,” Journal of Portfolio Management, Journal of Portfolio Management, Summer 2001Summer 2001
4
Literature, continued:Lee, Lee, WaiWai and Lam, D. “Implementing Optimal Risk and Lam, D. “Implementing Optimal Risk
Budgeting,” Budgeting,” Journal of Portfolio ManagementJournal of Portfolio Management, Fall 2001, Fall 2001Sharpe, William F. “Budgeting and Monitoring Pension Fund Sharpe, William F. “Budgeting and Monitoring Pension Fund
Risk,” Risk,” Financial Analyst JournalFinancial Analyst Journal, Sept/Oct 2002, Sept/Oct 2002ArnottArnott, Robert D. “Risk Budgeting and Portable Alpha,” , Robert D. “Risk Budgeting and Portable Alpha,”
Journal of InvestingJournal of Investing, Summer 2002, Summer 2002LittermanLitterman, Bob, , Bob, WinkelmanWinkelman, K, et al., “Developing an Optimal , K, et al., “Developing an Optimal
Active Risk Budget,”Active Risk Budget,” Modern Investment Management: An Modern Investment Management: An Equilibrium ApproachEquilibrium Approach, 2003, Wiley, 2003, Wiley
ShererSherer, B. and Martin, D, , B. and Martin, D, Introduction to Modern Portfolio Introduction to Modern Portfolio OptimizationOptimization, Springer, 2005, Springer, 2005

5
Tracking Error Allocation
§§ The risk budgeting (which Blitz and The risk budgeting (which Blitz and HottingaHottinga call call tracking error allocation) framework is a threetracking error allocation) framework is a three--step step process:process:1.1. Identifying the independent investment decisions; Identifying the independent investment decisions; 2.2. Ranking the forecasting capabilities for the Ranking the forecasting capabilities for the
investment decisions; and investment decisions; and 3.3. Calculating the optimum partial tracking errors, given Calculating the optimum partial tracking errors, given
an overall tracking error limit. an overall tracking error limit. §§ Target tracking error for each investment decision Target tracking error for each investment decision
should be proportional to the corresponding expected should be proportional to the corresponding expected information ratio. (This assumes that active risks are information ratio. (This assumes that active risks are uncorrelated)uncorrelated)
6
Allocating Between Market and Active Risk
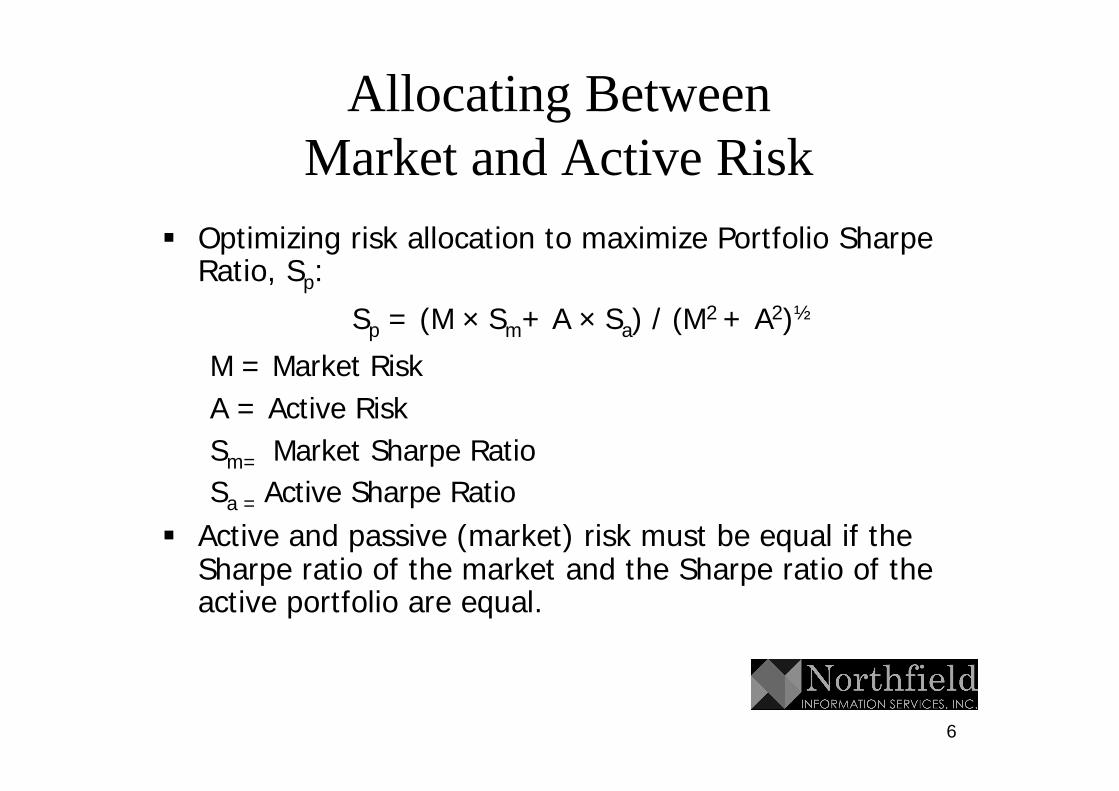
§§ Optimizing risk allocation to maximize Portfolio Sharpe Optimizing risk allocation to maximize Portfolio Sharpe Ratio, SRatio, Spp::
SSpp = (M = (M ×× SSmm+ A + A ×× SSaa) / (M) / (M2 2 + A+ A22))½½
M = Market RiskM = Market RiskA = Active RiskA = Active RiskSSmm= = Market Sharpe RatioMarket Sharpe RatioSSa = a = Active Sharpe RatioActive Sharpe Ratio
§§ Active and passive (market) risk must be equal if the Active and passive (market) risk must be equal if the Sharpe ratio of the market and the Sharpe ratio of the Sharpe ratio of the market and the Sharpe ratio of the active portfolio are equal.active portfolio are equal.
7
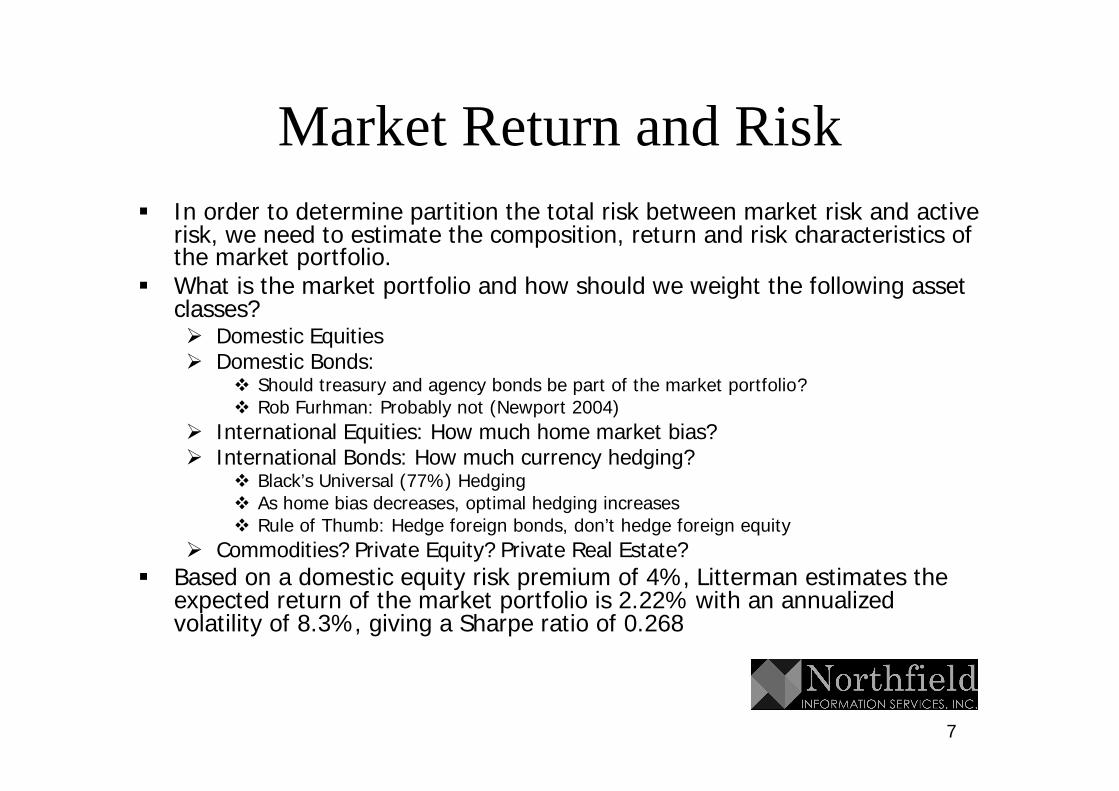
Market Return and Risk§§ In order to determine partition the total risk between market riIn order to determine partition the total risk between market risk and active sk and active
risk, we need to estimate the composition, return and risk chararisk, we need to estimate the composition, return and risk characteristics of cteristics of the market portfolio.the market portfolio.
§§ What is the market portfolio and how should we weight the followWhat is the market portfolio and how should we weight the following asset ing asset classes?classes?ØØ Domestic EquitiesDomestic EquitiesØØ Domestic Bonds: Domestic Bonds:
vv Should treasury and agency bonds be part of the market portfolioShould treasury and agency bonds be part of the market portfolio? ? vv Rob Rob FurhmanFurhman: Probably not (Newport 2004): Probably not (Newport 2004)
ØØ International Equities: How much home market bias?International Equities: How much home market bias?ØØ International Bonds: How much currency hedging?International Bonds: How much currency hedging?
vv Black’s Universal (77%) HedgingBlack’s Universal (77%) Hedgingvv As home bias decreases, optimal hedging increasesAs home bias decreases, optimal hedging increasesvv Rule of Thumb: Hedge foreign bonds, don’t hedge foreign equityRule of Thumb: Hedge foreign bonds, don’t hedge foreign equity
ØØ Commodities? Private Equity? Private Real Estate?Commodities? Private Equity? Private Real Estate?§§ Based on a domestic equity risk premium of 4%, Based on a domestic equity risk premium of 4%, LittermanLitterman estimates the estimates the
expected return of the market portfolio is 2.22% with an annualiexpected return of the market portfolio is 2.22% with an annualized zed volatility of 8.3%, giving a Sharpe ratio of 0.268volatility of 8.3%, giving a Sharpe ratio of 0.268

8

9
Why Separate Alpha from Beta?
§§ Why don’t we simply put each manger’s expected Why don’t we simply put each manger’s expected returns, risk and correlations into an optimizer and use returns, risk and correlations into an optimizer and use those results?those results?
§§ We have a higher confidence in the our asset class We have a higher confidence in the our asset class return predictions than we do for active returns.return predictions than we do for active returns.ØØWe can use use economic theory, econometric We can use use economic theory, econometric
and Bayesian techniques to improve asset class and Bayesian techniques to improve asset class return and risk estimations.return and risk estimations.
§§ Weights are very sensitive to small changes in the risk Weights are very sensitive to small changes in the risk and return estimates for both asset class and active and return estimates for both asset class and active return expectations.return expectations.
§§ Small changes in active return estimates could result in Small changes in active return estimates could result in (undesirable) large changes in asset allocation.(undesirable) large changes in asset allocation.

10
Why Do Risk Budgeting?
§§ Active management is effective because Active management is effective because returns that are uncorrelated to market returns that are uncorrelated to market returns require a very low hurdle rate to returns require a very low hurdle rate to add value to a portfolio. add value to a portfolio. §§ “(It is) an extension of mean“(It is) an extension of mean--variance variance
optimization that enables us to optimization that enables us to decouple a portfolio’s allocation from decouple a portfolio’s allocation from fixed monetary values.” (Chow and fixed monetary values.” (Chow and Kritzman)Kritzman)

11
What Risk Budgeting is Not
§§ Having a different asset allocation than the market Having a different asset allocation than the market portfolio is not risk budgeting.portfolio is not risk budgeting.
§§ Pension liabilities usually differ from the market portfolio.Pension liabilities usually differ from the market portfolio.ØØ Pension liabilities are usually modeled by a longPension liabilities are usually modeled by a long--term bond term bond
index, with a duration of about 10 years vs. 4½ for the index, with a duration of about 10 years vs. 4½ for the Lehman Aggregate.Lehman Aggregate.
ØØ Global diversification is usually preferable for overGlobal diversification is usually preferable for over--funded funded plans.plans.
ØØ Domestic equities have a higher correlation with liabilities Domestic equities have a higher correlation with liabilities and may be preferable for underand may be preferable for under--funded plans, because funded plans, because liabilities are not well correlated with the global equities.liabilities are not well correlated with the global equities.
ØØ Set up the optimization using return and risk estimations Set up the optimization using return and risk estimations that are relative to liabilities.that are relative to liabilities.

12
Active Return
§§ Markets must be inefficient Markets must be inefficient –– rejection of rejection of efficient market hypothesis. efficient market hypothesis. §§ Can You Select Superior Managers?Can You Select Superior Managers?ØØ You must be able to identify skill You must be able to identify skill –– it does not it does not
matter if someone else can, unless that someone matter if someone else can, unless that someone else is your consultant.else is your consultant.ØØ You can efficiently allocate risk among skilled You can efficiently allocate risk among skilled
managers.managers.ØØ You can identify deterioration in skill and act You can identify deterioration in skill and act
accordingly.accordingly.ØØ You can rebalance with reasonable transaction You can rebalance with reasonable transaction
costs.costs.
13
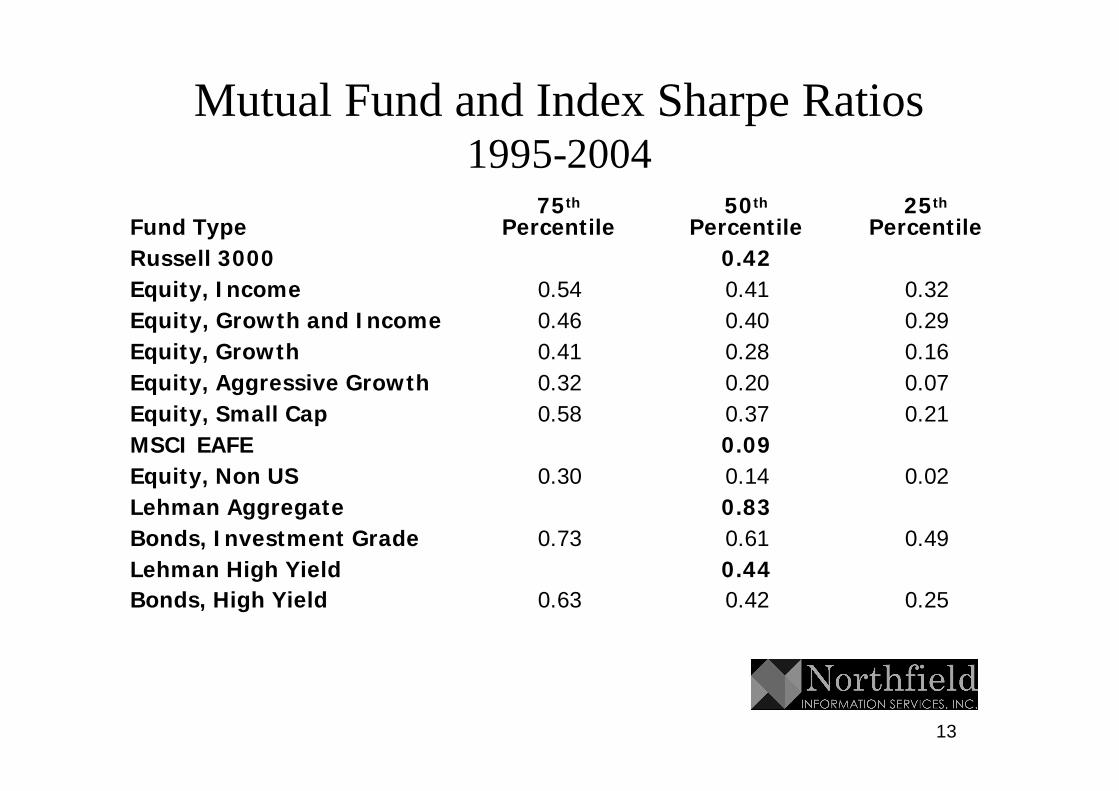
Mutual Fund and Index Sharpe Ratios1995-2004
0.440.44Lehman High YieldLehman High Yield
0.020.020.140.140.300.30Equity, Non USEquity, Non US0.830.83Lehman AggregateLehman Aggregate
0.420.42Russell 3000Russell 3000
0.250.250.420.420.630.63Bonds, High YieldBonds, High Yield
0.490.490.610.610.730.73Bonds, Investment GradeBonds, Investment Grade
0.090.09MSCI EAFEMSCI EAFE0.210.210.370.370.580.58Equity, Small CapEquity, Small Cap0.070.070.200.200.320.32Equity, Aggressive GrowthEquity, Aggressive Growth0.160.160.280.280.410.41Equity, GrowthEquity, Growth0.290.290.400.400.460.46Equity, Growth and IncomeEquity, Growth and Income0.320.320.410.410.540.54Equity, IncomeEquity, Income
2525thth
PercentilePercentile5050thth
PercentilePercentile7575thth
PercentilePercentileFund TypeFund Type

14
Hedge Fund Sharpe Ratios2000-2005, Hedgefund.net
1.051.051.441.442.292.29Equally WeightedEqually Weighted0.470.470.860.861.521.52AverageAverage0.850.851.221.222.302.30MultiMulti--StrategyStrategy0.070.070.420.421.211.21Market Neutral EquityMarket Neutral Equity0.120.120.360.360.640.64Managed FuturesManaged Futures--0.010.010.370.370.930.93Long/Short EquityLong/Short Equity0.230.230.610.611.001.00Global MacroGlobal Macro0.860.861.541.542.602.60Fixed IncomeFixed Income0.710.711.111.111.651.65Event DrivenEvent Driven0.400.400.790.791.471.47Emerging MarketsEmerging Markets1.041.041.511.511.951.95Convertible ArbitrageConvertible Arbitrage0.380.380.700.701.471.47Arbitrage, OtherArbitrage, Other
2525thth
PercentilePercentile5050thth
PercentilePercentile7575thth
PercentilePercentileFund TypeFund Type

15
Institutional Managers
108%108%225225255255High YieldHigh Yield39%39%75752525Core+ Fixed IncomeCore+ Fixed Income53%53%610610340340Emerging Market EquityEmerging Market Equity73%73%460460335335International EquityInternational Equity41%41%710710275275US Small Cap ValueUS Small Cap Value88%88%880880720720US Small Cap GrowthUS Small Cap Growth17%17%4604605050US Large Cap ValueUS Large Cap Value45%45%583583230230US Large Cap GrowthUS Large Cap Growth61%61%1451457575Enhanced IndexEnhanced Index
InformationInformationRatioRatio
T.E.T.E.2 Managers2 ManagersAlphaAlphaAsset ClassAsset Class

16
Institutional Manager Data from Previous and Following Slides
§§ Data from Data from Litterman’sLitterman’s Modern Investment Modern Investment ManagementManagement p. 177p. 177
§§ Returns data from Nelson’s database,1992 to 2002Returns data from Nelson’s database,1992 to 2002§§ Table and graph show median gross (before fee) for Table and graph show median gross (before fee) for
randomly selected portfolios of managers:randomly selected portfolios of managers:ØØ ReturnsReturnsØØ Tracking error or residual volatility “adjusted for market Tracking error or residual volatility “adjusted for market
directionality”directionality”ØØ Information ratio.Information ratio.ØØ Because this is median data from random ‘n manager’ Because this is median data from random ‘n manager’
portfolios, the information ratio is not equal to the median portfolios, the information ratio is not equal to the median return divided by the median tracking error.return divided by the median tracking error.

17
Information Ratio vs. Number of Managers

18
Successful Active Management Requires
§§ Confidence in manager skill and Confidence in manager skill and selectionselectionØØ “Hope is not a strategy” (Robert “Hope is not a strategy” (Robert ArnottArnott, ,
March/April 2005 March/April 2005 Financial Analyst Journal)Financial Analyst Journal)ØØ Should not be undertaken simply to match Should not be undertaken simply to match
liabilities.liabilities.
§§ The ability to optimize the active risk The ability to optimize the active risk information ratio using information ratio using risk budgetingrisk budgeting..

19
Active Management
§§ Which asset classes do you want to actively Which asset classes do you want to actively manage?manage?§§ What are your return and risk expectations?What are your return and risk expectations?ØØ Information Ratio = Information Ratio = ReturnReturnactiveactive / Risk = / Risk = E(rE(ractiveactive) / ) /
σσactiveactive
§§ Should you use Tactical Asset Allocation?Should you use Tactical Asset Allocation?§§ Should you use an Active Currency Overlay?Should you use an Active Currency Overlay?§§ How much is risk is each manager allowed to How much is risk is each manager allowed to
take?take?

20
Active Management
§§ How many managers?How many managers?§§ What are the correlations between active What are the correlations between active
strategies?strategies?§§ How do you monitor their performance How do you monitor their performance
and update expectations?and update expectations?§§ When do you rebalance managers and When do you rebalance managers and
implement transition?implement transition?
21
Optimizing the Active Risk BudgetModern Investment Management, Chapter 13
§§ Select level of active risk, which depends on the Select level of active risk, which depends on the relative Sharpe ratio between the market and active relative Sharpe ratio between the market and active portfolios.portfolios.
§§ Determine weight of passive vs. active managersDetermine weight of passive vs. active managers§§ Allocate active risk across asset classes.Allocate active risk across asset classes.§§ Allocate active risk active risk to specific manager Allocate active risk active risk to specific manager
within each asset class:within each asset class:ØØ According to According to substylessubstyles, such as growth/value, large/small, such as growth/value, large/smallØØ According to risk levels such as structured or concentratedAccording to risk levels such as structured or concentrated
§§ Frequency of portfolio rebalancingFrequency of portfolio rebalancing§§ Allocation of active risk to overlay (TAA, currency) Allocation of active risk to overlay (TAA, currency)
strategiesstrategies

22
Modeling Active Management
§§ There is no difference between:There is no difference between:ØØ An active manager with a tracking error of 4%An active manager with a tracking error of 4%ØØ An active manager with a 1% tracking error levered four An active manager with a 1% tracking error levered four
times by shorting index futures on the benchmark.times by shorting index futures on the benchmark.§§ We assume that each active manager has tracking We assume that each active manager has tracking
error equal to 1.0.error equal to 1.0.§§ We estimate the ideal “leverage” to be associated We estimate the ideal “leverage” to be associated
with each active manager.with each active manager.§§ This gearing ratio will be numerically equivalent to This gearing ratio will be numerically equivalent to
the ideal tracking error for each manager. the ideal tracking error for each manager. §§ In an optimal and unconstrained risk allocation, the In an optimal and unconstrained risk allocation, the
marginal contribution to risk is proportional to its marginal contribution to risk is proportional to its expected excess return.expected excess return.

23
Example: Active ManagementRisks and Strategic Allocation
0.00.00.00.00.00.00.00.00.00.00.00.0--115115SlackSlack
1.01.00.10.10.00.00.00.00.00.00.50.5100100TAATAA
0.10.11.01.00.10.10.00.00.10.11.01.02525CurrencyCurrency
0.00.00.10.11.01.00.10.10.20.21.01.04040BondsBonds
0.00.00.00.00.10.11.01.00.30.30.70.71010Foreign EquityForeign Equity
0.00.00.10.10.20.20.30.31.01.00.30.34040Domestic EquityDomestic EquityTAATAACurrencyCurrencyBondsBonds
ForeignForeignEquityEquity
DomestiDomesticc
EquityEquitySharpeSharpeRatioRatio
StrategicStrategicAllocatioAllocatio
nnAsset ClassAsset Class

24
Active Management:Risks and Strategic Allocation
0.0%0.0%--215215--115115SlackSlack
0.0%0.0%0.00.0100100Tactical Asset AllocationTactical Asset Allocation
6.2%6.2%1561562525CurrencyCurrency
3.0%3.0%1201204040BondsBonds
4.0%4.0%40401010Foreign EquityForeign Equity
0.0%0.0%004040Domestic EquityDomestic Equity
RiskRiskAllocationAllocation
OptimumOptimumAllocationAllocation
StrategicStrategicAllocationAllocationAsset ClassAsset Class

25
Conclusions
§§ You create a risk budget because you typically will have a You create a risk budget because you typically will have a difference confidence in your predictions of asset class vs. difference confidence in your predictions of asset class vs. active return.active return.
§§ Based on your liabilities and the relative expectations between Based on your liabilities and the relative expectations between active and market Sharpe ratio, you can set the portfolio’s active and market Sharpe ratio, you can set the portfolio’s market exposure, asset class allocations and active risk.market exposure, asset class allocations and active risk.
§§ You can use an optimizer to determine the optimum active risk You can use an optimizer to determine the optimum active risk allocation by:allocation by:ØØ Setting the risk level to 1.Setting the risk level to 1.ØØ Setting the expected return to the manager’s Sharpe ratioSetting the expected return to the manager’s Sharpe ratioØØ Using a slack asset class to represent a short position in the Using a slack asset class to represent a short position in the
benchmark.benchmark.ØØ Setting constraints, if necessary.Setting constraints, if necessary.ØØ Optimizing to determine the risk allocation to each asset class.Optimizing to determine the risk allocation to each asset class.