Sand Dune Vegetation Monitoring Lake Disappointment Potash ... · Draft documents are submitted to...
45
Sand Dune Vegetation Monitoring Lake Disappointment Potash Project For Reward Minerals Limited September 2015 FINAL Prepared by: Botanica Consulting PO Box 2027 Boulder WA 6432 90930024
Transcript of Sand Dune Vegetation Monitoring Lake Disappointment Potash ... · Draft documents are submitted to...

Sand Dune Vegetation Monitoring Lake Disappointment Potash Project
For Reward Minerals Limited
September 2015
FINAL
Prepared by: Botanica Consulting PO Box 2027 Boulder WA 6432 90930024

Disclaimer
This document and its contents are to be treated as confidential and are published in accordance with, and subject to an agreement between Botanica Consulting (BC) and the client for whom it has been prepared, and is restricted to those issues that have been raised by the client in its engagement of BC. Neither this document nor its contents may be referred to or quoted in any manner (report or other document) nor reproduced in part or whole by electronic, mechanical or chemical means, including photocopying, recording or any information storage system, without the express written approval of the client and/or BC. This document and its contents have been prepared utilising the standard of care and skill ordinarily exercised by Environmental Scientists in the preparation of such documents. All material presented in this document is published in good faith and is believed to be accurate at the time of writing. Any person or organisation who relies on or uses the document and its contents for purposes or reasons other than those agreed by BC and the client without primarily obtaining the prior written consent of BC, does so entirely at their own risk. BC denies all liability in tort, contract or otherwise for any loss, damage or injury of any kind whatsoever (whether in negligence or otherwise) that may be endured as a consequence of relying on this document and its contents for any purpose other than that agreed with the client.
Quality Assurance An internal quality review process has been implemented to each project task undertaken by BC. Each document and its contents are carefully reviewed by core members of the Consultancy team and signed off at Director level prior to issue to the client. Draft documents are submitted to the client for comment and acceptance prior to final production. Document Job Number: 2015/42 Prepared by: Pat Harton Environmental Scientist
Botanica Consulting
Reviewed by: Andrea Williams Director Botanica Consulting Approved by: Jim Williams Director Botanica Consulting

Table of Contents Page #
1 Introduction ...................................................................................................................................... 1
1.1 Survey Objectives ...........................................................................................................................................1 2 Regional Biophysical Environment ................................................................................................ 3
2.1 Regional Environment .....................................................................................................................................3 2.2 Topography & Soils .........................................................................................................................................5 2.3 Remnant Vegetation .......................................................................................................................................5 2.4 Lake Disappointment (Savory Creek system) ................................................................................................6 2.5 Climate ............................................................................................................................................................6 2.6 Land Use .........................................................................................................................................................7
3 Survey Methodology ........................................................................................................................ 8
3.1 Sampling and Analysis Methods .....................................................................................................................8 3.2 Personnel Involved....................................................................................................................................... 10 3.3 Scientific licences ......................................................................................................................................... 10
4 Results ............................................................................................................................................ 11
4.1 Species Diversity .......................................................................................................................................... 14 4.2 Species Density ........................................................................................................................................... 14 4.3 Total Vegetation Cover ................................................................................................................................ 14 4.4 Health Condition ........................................................................................................................................... 14 4.5 Flora of Conservation Significance .............................................................................................................. 17 4.6 Introduced Species ...................................................................................................................................... 17
5 Conclusions and Recommendations ........................................................................................... 18
6 References ..................................................................................................................................... 20

Tables
Table 1: Remaining Beard Vegetation Associations within the Sand Dune vegetation monitoring program of the Lake Disappointment Potash Project (DAFWA, 2011) ............................................................................................................5 Table 2: Sand Dune Vegetation Monitoring Locations (GDA94, Zone 51K) ............................................................... 10 Table 3: Scientific Licences of Botanica Staff coordinating the survey ....................................................................... 10 Table 4: Summary results of vegetation monitoring from 2013 to 2015 ...................................................................... 12 Table 5: General notes on health rating of each transect in 2015 ............................................................................... 15
Figures
Figure 1: Regional Map of the Lake Disappointment Potash Project .............................................................................2 Figure 2: Map of Interim Biogeographic Regionalisation of Australia (IBRA)-Little Sandy Desert Region of Western Australia ..........................................................................................................................................................................3 Figure 3: Map of IBRA subregions in the vicinity of the Lake Disappointment Potash Project ......................................4 Figure 4: Monthly rainfall from January 2011 to April 2015 and mean monthly rainfall (January 1974 to April 2015) for the Telfer Aero weather station (#13030) (BOM, 2015)..................................................................................................7 Figure 5: Annual rainfall from January 2011 to April 2015 and mean monthly rainfall (January 1974 to April 2015) for the Telfer Aero weather station (#13030) (BOM, 2015)..................................................................................................7 Figure 6: Map of sand dune vegetation monitoring sites Lake Disappointment .............................................................9 Figure 7: Map of fire history along the extent of the area obtained from Landgate fire watch database (Landgate, 2015) ............................................................................................................................................................................ 16
Plates
Plate 1: Photograph taken of camels within the Lake Disappointment Project area (BC, 2015) ................................ 18
Appendices
Appendix 1: Regional Map of Lake Disappointment Potash Project and areas of Conservation Significance ........... 21 Appendix 2: Keighery 1994 Health Rating Scale ........................................................................................................ 22 Appendix 3: List of all species identified in Sand Dune vegetation monitoring program 2015 ................................... 23 Appendix 4: Raw Results of the Sand Dune Vegetation Monitoring 2015 .................................................................. 24 Appendix 5: Photographic Records of Sand Dune Vegetation Monitoring Quadrats .................................................. 30
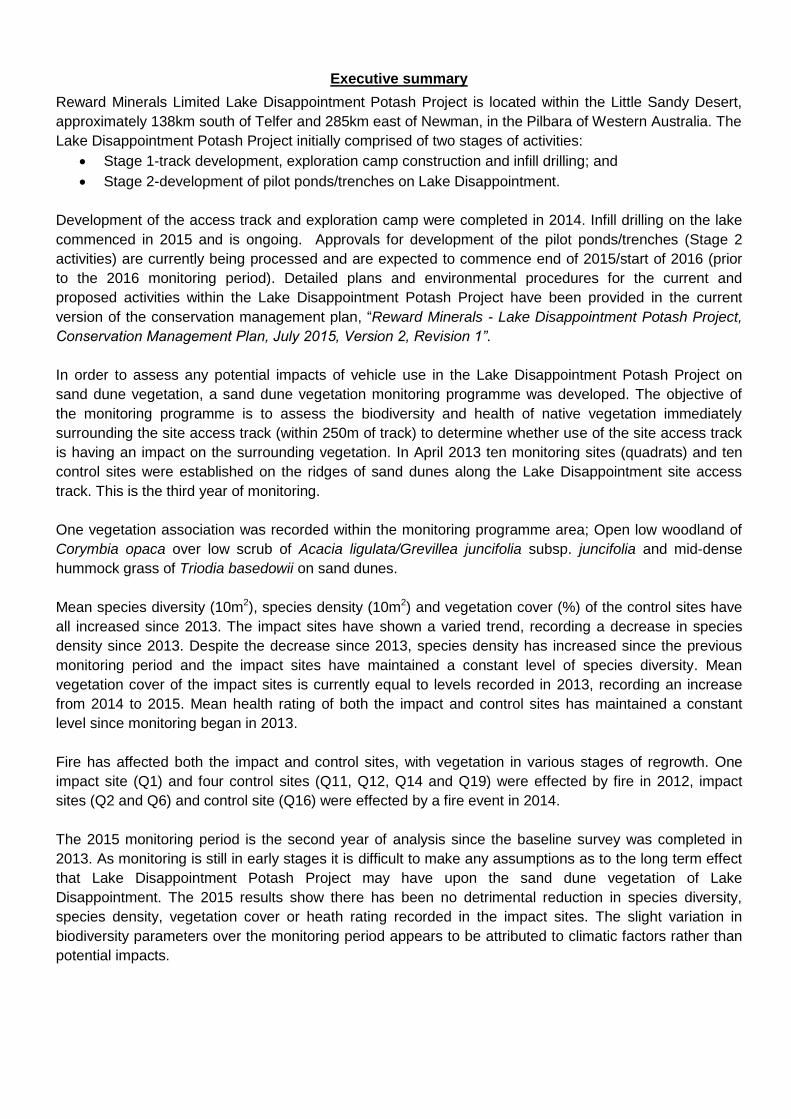
Executive summary
Reward Minerals Limited Lake Disappointment Potash Project is located within the Little Sandy Desert,
approximately 138km south of Telfer and 285km east of Newman, in the Pilbara of Western Australia. The
Lake Disappointment Potash Project initially comprised of two stages of activities:
Stage 1-track development, exploration camp construction and infill drilling; and
Stage 2-development of pilot ponds/trenches on Lake Disappointment.
Development of the access track and exploration camp were completed in 2014. Infill drilling on the lake
commenced in 2015 and is ongoing. Approvals for development of the pilot ponds/trenches (Stage 2
activities) are currently being processed and are expected to commence end of 2015/start of 2016 (prior
to the 2016 monitoring period). Detailed plans and environmental procedures for the current and
proposed activities within the Lake Disappointment Potash Project have been provided in the current
version of the conservation management plan, “Reward Minerals - Lake Disappointment Potash Project,
Conservation Management Plan, July 2015, Version 2, Revision 1”.
In order to assess any potential impacts of vehicle use in the Lake Disappointment Potash Project on
sand dune vegetation, a sand dune vegetation monitoring programme was developed. The objective of
the monitoring programme is to assess the biodiversity and health of native vegetation immediately
surrounding the site access track (within 250m of track) to determine whether use of the site access track
is having an impact on the surrounding vegetation. In April 2013 ten monitoring sites (quadrats) and ten
control sites were established on the ridges of sand dunes along the Lake Disappointment site access
track. This is the third year of monitoring.
One vegetation association was recorded within the monitoring programme area; Open low woodland of
Corymbia opaca over low scrub of Acacia ligulata/Grevillea juncifolia subsp. juncifolia and mid-dense
hummock grass of Triodia basedowii on sand dunes.
Mean species diversity (10m2), species density (10m2) and vegetation cover (%) of the control sites have
all increased since 2013. The impact sites have shown a varied trend, recording a decrease in species
density since 2013. Despite the decrease since 2013, species density has increased since the previous
monitoring period and the impact sites have maintained a constant level of species diversity. Mean
vegetation cover of the impact sites is currently equal to levels recorded in 2013, recording an increase
from 2014 to 2015. Mean health rating of both the impact and control sites has maintained a constant
level since monitoring began in 2013.
Fire has affected both the impact and control sites, with vegetation in various stages of regrowth. One
impact site (Q1) and four control sites (Q11, Q12, Q14 and Q19) were effected by fire in 2012, impact
sites (Q2 and Q6) and control site (Q16) were effected by a fire event in 2014.
The 2015 monitoring period is the second year of analysis since the baseline survey was completed in
2013. As monitoring is still in early stages it is difficult to make any assumptions as to the long term effect
that Lake Disappointment Potash Project may have upon the sand dune vegetation of Lake
Disappointment. The 2015 results show there has been no detrimental reduction in species diversity,
species density, vegetation cover or heath rating recorded in the impact sites. The slight variation in
biodiversity parameters over the monitoring period appears to be attributed to climatic factors rather than
potential impacts.

It is important to note that vegetation destruction caused by fire events and camels is also prevalent within
the Lake Disappointment Potash Project area; the impacts from such natural occurrences outside of
Reward’s control (i.e. Camels and fire) are recorded during monitoring to distinguish the impacts of these
events from the potential impacts of the Lake Disappointment Potash Project.
It is recommended that monitoring be conducted annually in autumn to document and track any future
changes in vegetation condition and recommendations made, if there are any signs of adverse effects on
the vegetation of the sand dunes adjacent to the access track.
Sand Dune Vegetation Monitoring for Lake Disappointment: 2015
Reward Minerals Ltd
Botanica Consulting 1
1 Introduction
Reward Minerals Limited (Reward) Lake Disappointment Potash Project (LDP Project) is located within
the Little Sandy Desert, approximately 138km south of Telfer and 285km east of Newman, in the
Pilbara of Western Australia (Figure 1).
The southern region of the LDP Project occurs within the proposed Lake Disappointment Nature
Reserve (listed under the Environmental Protection Authority Red Book recommendations for
Conservation Reserves 1975-1993) (Appendix 1), which covers an area of 366,700ha and is proposed
to be managed by the Department of Parks and Wildlife (DPaW). To date this proposed reserve has not
been approved. Lake Disappointment is a Nationally Important Wetland of Western Australia as listed
by the Australian Nature Conservation Agency (ANCA).
The LDP Project initially comprised of two stages of activities:
Stage 1-track development, exploration camp construction and infill drilling;
Stage 2-development of pilot ponds/trenches on Lake Disappointment;
Development of the access track and exploration camp was completed in 2014. Infill drilling on the lake
commenced in 2015 and is ongoing. Approvals for development of the pilot ponds/trenches (Stage 2
activities) are currently being processed and are expected to commence end of 2015/start of 2016
(prior to the 2016 monitoring period). Detailed plans and environmental procedures for the current and
proposed activities within the Lake Disappointment Potash Project have been provided in the current
version of the conservation management plan, “Reward Minerals - Lake Disappointment Potash
Project, Conservation Management Plan, July 2015, Version 2, Revision 1”.
At the request of the DPaW and Environmental Protection Authority (EPA), Reward commissioned
Botanica Consulting (BC) to establish a sand dune vegetation monitoring programme along the site
access track leading to Lake Disappointment in order to assess any potential impacts of vehicle use on
sand dune vegetation within the LDP Project area. From the 23rd to 25th April 2013 ten impact sites
(quadrats) and ten control sites were established on ridges of sand dunes within 250m of the site
access track and >1km from the site access track respectively. Each site will be monitored annually in
autumn with a report submitted annually to the DPaW. Findings of this monitoring will be used to
enhance the DPaW’s knowledge of the area, and more effectively assess the potential environmental
impacts the Project may have on the various conservation values of the Lake Disappointment area.
This is the third year of monitoring.
1.1 Survey Objectives
In order to assess any potential impacts of vehicle use in the LDP Project area on sand dune
vegetation, a sand dune vegetation monitoring programme was established. The objective of the
monitoring programme was to assess the biodiversity and health of the native vegetation immediately
surrounding the site access track (within 250m of track) and compare this against control sites >1km
from the site access track to determine whether use of the site access track is having an impact on the
surrounding vegetation.

Sand dune Vegetation Monitoring for Lake Disappointment: 2015
Reward Minerals Limited
Botanica Consulting 2
Figure 1: Regional Map of the Lake Disappointment Potash Project
Riparian Vegetation Monitoring for Lake Disappointment: 2015
Reward Minerals Limited
Botanica Consulting 3
2 Regional Biophysical Environment
2.1 Regional Environment
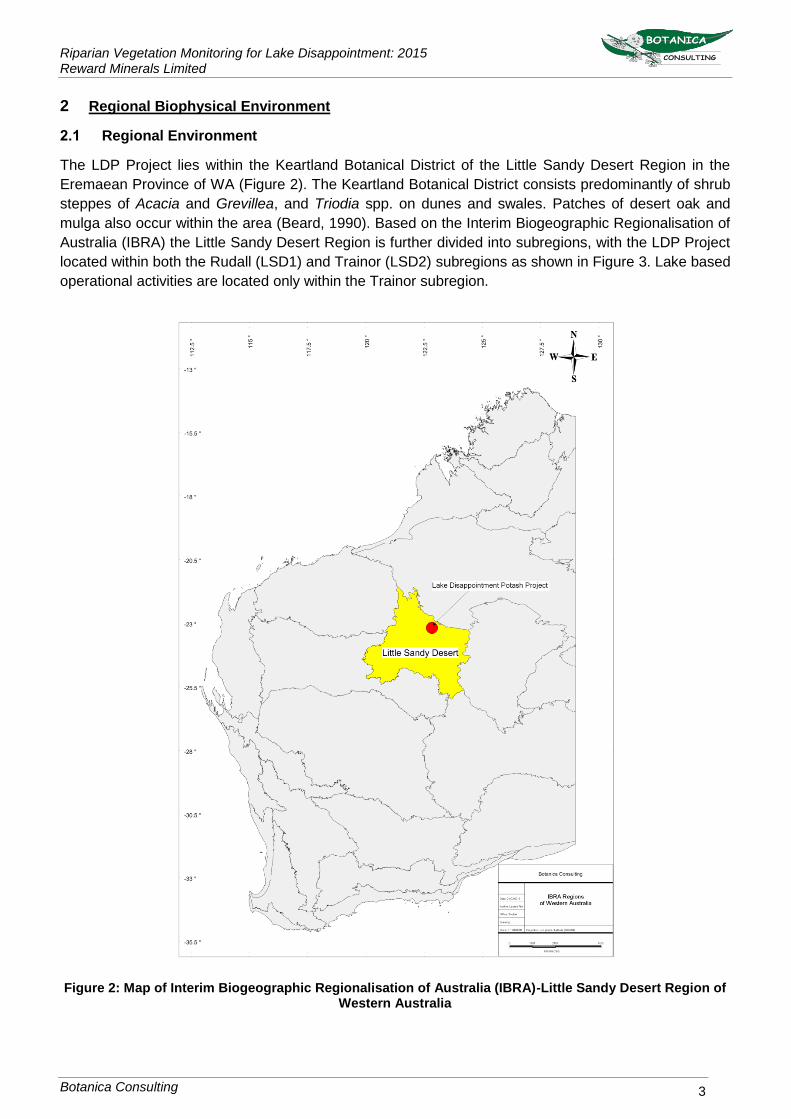
The LDP Project lies within the Keartland Botanical District of the Little Sandy Desert Region in the
Eremaean Province of WA (Figure 2). The Keartland Botanical District consists predominantly of shrub
steppes of Acacia and Grevillea, and Triodia spp. on dunes and swales. Patches of desert oak and
mulga also occur within the area (Beard, 1990). Based on the Interim Biogeographic Regionalisation of
Australia (IBRA) the Little Sandy Desert Region is further divided into subregions, with the LDP Project
located within both the Rudall (LSD1) and Trainor (LSD2) subregions as shown in Figure 3. Lake based
operational activities are located only within the Trainor subregion.
Figure 2: Map of Interim Biogeographic Regionalisation of Australia (IBRA)-Little Sandy Desert Region of Western Australia

Sand Dune Vegetation Monitoring for Lake Disappointment: 2015 Reward Minerals Limited
Botanica Consulting 4
Figure 3: Map of IBRA subregions in the vicinity of the Lake Disappointment Potash Project

Sand Dune Vegetation Monitoring for Lake Disappointment: 2015 Reward Minerals Limited
Botanica Consulting 5
2.2 Topography & Soils
The Rudall subregion (LSD1) of the Little Sandy Desert region lies on the Rudall Complex, Throssell
Group and Lamil Group of the Patterson Orogen. It consists of the Proterozoic hill country of Throssell
Mount Sears, Broadhurst and Harbutt Ranges. It includes the headwaters and course of Rudall River.
The Trainor subregion (LSD2) of the Little Sandy Desert lies in the red centre desert on the
Neoproterozoic sedimentary basement (Officer Basin). It consists of red quaternary dune fields with
abrupt Proterozoic sandstones ranges of the Bangemall Basin (Cowan & Kendrick, 2001). Beard (1990)
describes the topography of the Little Sandy Desert region as a sandplain with numerous low hills and
small ranges. The hills and ranges mainly consist of bare rock and shallow stony soils, while the plains
consist of red earthy sands. Beard (1990) also describes the underlying geology as a quaternary
sandplain with longitudinal dunes that have developed over locally exposed Proterzoic siliceous rocks.
2.3 Remnant Vegetation
The DAFWA GIS file (2011) indicates that the Sand Dune monitoring program of the LDP Project is
located within Pre-European Beard vegetation association Little Sandy Desert 134 in the Trainor
(LSD2) subregion. The extent of this vegetation association as described by the DAFWA is provided in
Table 1.
Table 1: Remaining Beard Vegetation Associations within the Sand Dune vegetation monitoring program of the Lake Disappointment Potash Project (DAFWA, 2011)
IBRA subregion
Vegetation association
Pre-European Extent (ha)
Current Extent (ha)
Pre-European
extent remaining
(%)
% of Current extent within DPaW
managed lands
Vegetation Description (Beard,
1990)
LSD2 Little Sandy Desert 134*
7,363,935.09 7,363,935.09 100 1.64
Mosaic: Hummock grasslands, open low tree steppe; desert
bloodwood and feathertop spinifex
(on) sandhills / Hummock
grasslands, shrub steppe; mixed shrubs over spinifex between
sandhills
**Medium Reservation Priority according the International Union for Conservation of Nature (IUCN)
Areas retaining less than 30% of their pre-European vegetation extent generally experience
exponentially accelerated species loss, while areas with less than 10% are considered “endangered”.

Sand Dune Vegetation Monitoring for Lake Disappointment: 2015 Reward Minerals Limited
Botanica Consulting 6
2.4 Lake Disappointment (Savory Creek system)
The southern extremity of the LDP Project occurs within Lake Disappointment (often referred to as the
Savory Creek system) which is described as a megascale irregular sumpland with numerous
microscale to macroscale islands and is a major feature of the Little Sandy Desert bioregion. Savory
Creek is an extensive creek over 280 km long and approximately 150m wide at its maximum,
occasionally flooding to 2 km width. It is one of only two significant river systems that flow into the Little
Sandy Desert. Savory Creek originates in the Bangemall Basin, flows across the Savory Basin and into
Lake Disappointment in the Paterson Orogen (DotE, 2012a).
Lake Disappointment lies at the lowest point of the Little Sandy Desert. The lake bed consists of poorly
consolidated saline lacustrine sediments (clay, silt, sand and gypsum). The surrounding area is
composed of mixed aeolian-lacustrine silt, sand and kopi forming longitudinal dunes trending east-west,
interspersed with minor salt lakes and claypans. Dunes on the lake form islands rising 5 to 18 m above
the bed (DotE, 2012a).
Savory Creek enters Lake Disappointment from the north-west, but flow is impeded by a substantial
sand bar to form a large permanent pool. The lake is also fed by smaller ephemeral creeks and direct
precipitation. Lake Disappointment may be fresh immediately after substantial rain, but becomes more
saline as it dries (DotE, 2012a).
The margins of Lake Disappointment and lower reaches of Savory Creek support samphire
communities, but there is no vegetation on the salt-encrusted lake bed. Principle species on islands
and dunes surrounding the lake are spinifex Plectrachne schinzii and Triodia pungens with scattered
shrubs, mainly Acacia and Grevillea. The eastern side of the lake is characterised by scattered shrubs
of Acacia coriacea and Hakea over an open-hummock grassland of another Spinifex Triodia basedowii.
There are large areas of Desert Oak Casuarina decaisneana on the western side (DotE, 2012a).
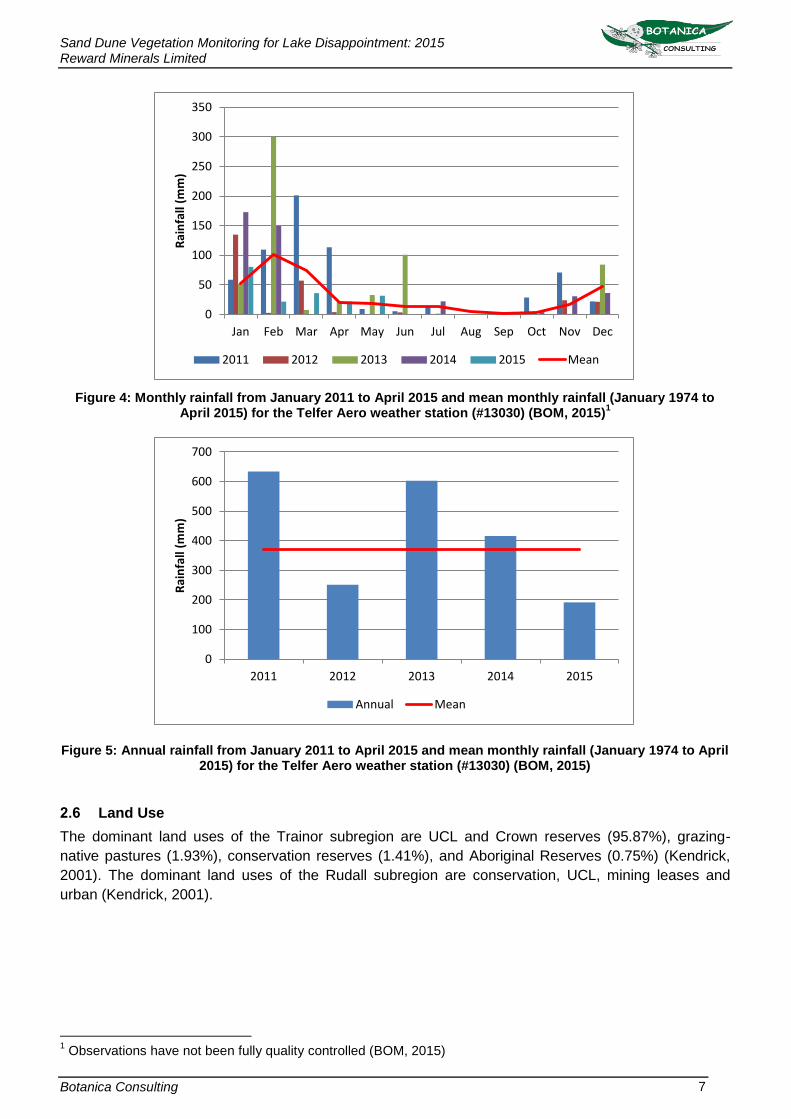
2.5 Climate
The climate of both the Rudall and Trainor subregions is characterised arid with summer rainfall in the
Rudall subregion and episodic summer rainfall in the Trainor subregion (Kendrick, 2001) Monthly
rainfall data for the Telfer Aero weather station (#13030) located approximately 133km north-west of
the LDP Project is provided in Figure 4 and annual rainfall information is provided in Figure 5 (Bureau
of Meteorology, BOM, 2015). Annual rainfall in 2014 recorded above average results; 416mm
compared to a mean annual rainfall of 369.8mm. Monthly rainfall data to date in 2015 has been above
average in three months (January, April and May) and below average in the remaining months
(February, March, June and July).
Sand Dune Vegetation Monitoring for Lake Disappointment: 2015 Reward Minerals Limited
Botanica Consulting 7
Figure 4: Monthly rainfall from January 2011 to April 2015 and mean monthly rainfall (January 1974 to April 2015) for the Telfer Aero weather station (#13030) (BOM, 2015)
1
Figure 5: Annual rainfall from January 2011 to April 2015 and mean monthly rainfall (January 1974 to April 2015) for the Telfer Aero weather station (#13030) (BOM, 2015)
2.6 Land Use
The dominant land uses of the Trainor subregion are UCL and Crown reserves (95.87%), grazing-
native pastures (1.93%), conservation reserves (1.41%), and Aboriginal Reserves (0.75%) (Kendrick,
2001). The dominant land uses of the Rudall subregion are conservation, UCL, mining leases and
urban (Kendrick, 2001).
1 Observations have not been fully quality controlled (BOM, 2015)
0
50
100
150
200
250
300
350
Jan Feb Mar Apr May Jun Jul Aug Sep Oct Nov Dec
Rai
nfa
ll (m
m)
2011 2012 2013 2014 2015 Mean
0
100
200
300
400
500
600
700
2011 2012 2013 2014 2015
Rai
nfa
ll (m
m)
Annual Mean
Sand Dune Vegetation Monitoring for Lake Disappointment: 2015 Reward Minerals Limited
Botanica Consulting 8
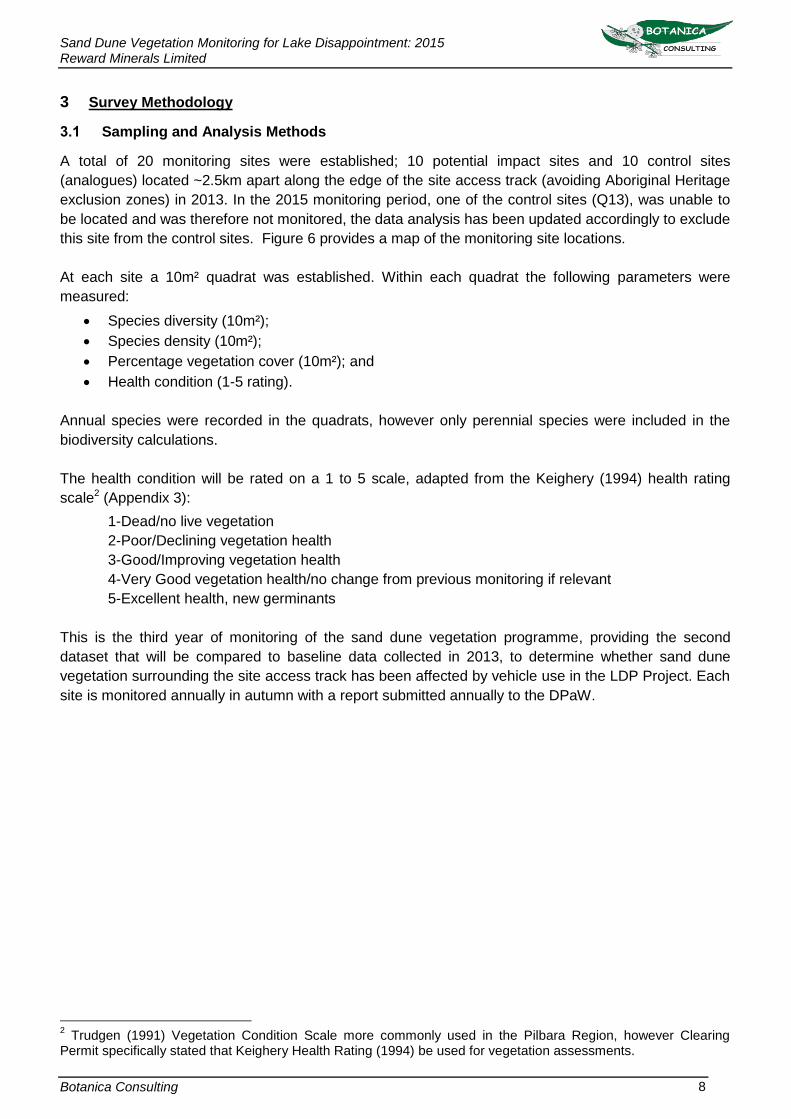
3 Survey Methodology
3.1 Sampling and Analysis Methods
A total of 20 monitoring sites were established; 10 potential impact sites and 10 control sites
(analogues) located ~2.5km apart along the edge of the site access track (avoiding Aboriginal Heritage
exclusion zones) in 2013. In the 2015 monitoring period, one of the control sites (Q13), was unable to
be located and was therefore not monitored, the data analysis has been updated accordingly to exclude
this site from the control sites. Figure 6 provides a map of the monitoring site locations.
At each site a 10m² quadrat was established. Within each quadrat the following parameters were
measured:
Species diversity (10m²);
Species density (10m²);
Percentage vegetation cover (10m²); and
Health condition (1-5 rating).
Annual species were recorded in the quadrats, however only perennial species were included in the
biodiversity calculations.
The health condition will be rated on a 1 to 5 scale, adapted from the Keighery (1994) health rating
scale2 (Appendix 3):
1-Dead/no live vegetation
2-Poor/Declining vegetation health
3-Good/Improving vegetation health
4-Very Good vegetation health/no change from previous monitoring if relevant
5-Excellent health, new germinants
This is the third year of monitoring of the sand dune vegetation programme, providing the second
dataset that will be compared to baseline data collected in 2013, to determine whether sand dune
vegetation surrounding the site access track has been affected by vehicle use in the LDP Project. Each
site is monitored annually in autumn with a report submitted annually to the DPaW.
2 Trudgen (1991) Vegetation Condition Scale more commonly used in the Pilbara Region, however Clearing
Permit specifically stated that Keighery Health Rating (1994) be used for vegetation assessments.

Sand Dune Vegetation Monitoring for Lake Disappointment: 2015 Reward Minerals Limited
Botanica Consulting 9
Figure 6: Map of sand dune vegetation monitoring sites Lake Disappointment

Sand Dune Vegetation Monitoring for Lake Disappointment: 2015 Reward Minerals Limited
Botanica Consulting
10
Table 2: Sand Dune Vegetation Monitoring Locations (GDA94, Zone 51K)
Vegetation Monitoring
Quadrat Easting Northing
Impact Sites
Q1 484430 7448510
Q2 484370 7446314
Q3 483966 7443923
Q4 482886 7441336
Q5 482259 7438981
Q6 481617 7436505
Q7 480939 7433493
Q8 480810 7431938
Q9 481136 7427099
Q10 481182 7429774
Control Sites
Q11 482647 7448853
Q12 486429 7446265
Q133
482287 7444271
Q14 486278 7440747
Q15 480354 7438740
Q16 482827 7435666
Q17 478876 7433598
Q18 477761 7430655
Q19 484950 7428685
Q20 478664 7427329
3.2 Personnel Involved
Jim Williams - Environmental Consultant (Diploma of Horticulture)
3.3 Scientific licences
Table 3: Scientific Licences of Botanica Staff coordinating the survey
Licensed staff Permit Number Valid Until
Jim Williams SL011451 21-05-2016
3 Location of Quadrat not found during 2015 monitoring period

Sand Dune Vegetation Monitoring for Lake Disappointment: 2015 Reward Minerals Limited
Botanica Consulting
11
4 Results
Table 4 provides a summary of the monitoring results recorded at each Quadrat from 2013 to 2015.
The raw data for 2015 is provided in Appendix 4. Photographs taken at both the impact and control
sites from 2013 to 2015 are provided in Appendix 5. One vegetation community was identified in the
sand dune monitoring program; Open low woodland of Corymbia opaca over low scrub of Acacia
ligulata/Grevillea juncifolia subsp. juncifolia and mid-dense hummock grass of Triodia basedowii on
sand dunes.

Sand Dune Vegetation Monitoring for Lake Disappointment: 2015 Reward Minerals Limited
Botanica Consulting 12
Table 4: Summary results of vegetation monitoring from 2013 to 2015
Species Diversity (10m²) Species Density (10m²) Total vegetation cover (%) Health Rating
Vegetation Monitoring
Quadrat 2013 2014 2015 2013 2014 2015 2013 2014 2015 2013 2014 2015
Impact Sites
Q1 7 7 7 50 32 32 20 20 20 2 3 3
Q2 6 6 9 41 41 51 55 55 64 3 4 4
Q3 2 3 4 5 7 11 31 22 24 3 3 3
Q4 3 3 3 6 6 6 20 20 20 3 2 2
Q5 4 3 3 41 40 40 30 30 35 3 3 3
Q6 6 4 6 51 23 23 25 15 17 3 2 2
Q7 5 5 5 12 13 13 30 26 34 3 3 3
Q8 5 5 5 47 47 47 50 50 50 3 4 4
Q9 5 5 6 39 39 41 46 46 47 3 3 3
Q10 6 6 6 15 15 15 40 40 40 3 3 3
Mean 5 5 5 31 26 28 35 32 35 3 3 3
Control Sites
Q11 2 3 4 11 11 15 7 7 9 2 3 3
Q12 4 4 6 9 9 13 20 20 22 2 3 3
Q13 3 3 N/A 8 8 N/A 25 25 N/A 3 3 N/A
Q14 3 4 4 11 12 12 10 12 12 2 3 3
Q15 3 3 3 5 5 5 22 22 22 3 3 3
Q16 3 3 4 9 6 10 15 14 18 3 2 2

Sand Dune Vegetation Monitoring for Lake Disappointment: 2015 Reward Minerals Limited
Botanica Consulting 13
Species Diversity (10m²) Species Density (10m²) Total vegetation cover (%) Health Rating
Vegetation Monitoring
Quadrat 2013 2014 2015 2013 2014 2015 2013 2014 2015 2013 2014 2015
Q17 6 7 7 22 24 24 40 41 41 4 4 4
Q18 5 7 7 16 18 18 72 74 74 4 4 4
Q19 2 3 4 19 22 29 10 15 20 2 3 3
Q20 6 6 6 16 16 16 65 65 65 3 3 3
Mean 4 4 5 13 14 16 29 30 31 3 3 3

Sand Dune Vegetation Monitoring for Lake Disappointment: 2015
Reward Minerals Limited
Botanica Consulting 14
4.1 Species Diversity
Mean species diversity for the impact sites has remained constant throughout the monitoring period at
five species per 10m2. Mean species diversity for the control sites increased from four to five species
per 10m2 in 2015. Four impact sites (Q2, Q3, Q6 and Q9) recorded an increase in species diversity
from 2014 to 2015, while the remaining quadrats maintaining a constant level of species diversity in
2015. Four control sites (Q11, Q12, Q16, and Q19) recorded an increase in species diversity from 2014
to 2015, while the remaining quadrats maintained a constant level of species diversity in 2015. Species
diversity for the impact sites ranged from three to nine species per 10m2, whereas species diversity for
the control sites ranged from three to seven species per 10m2. A list of all species recorded during
monitoring is provided in Appendix 3.
4.2 Species Density
Mean species density for the impact sites has decreased over the monitoring period, reducing from 31
plants per 10m² in 2013 to 28 plants per 10m² in 2015. Mean species density however did increase
from 26 to 27 plants per 10m² in 2015. Mean species density of the control sites has increased over the
monitoring period, increasing from 13 to 16 plants per 10m2 in 2015. Three impact sites (Q2, Q3 and
Q9) recorded an increase in species density between 2014 and 2015, while the remaining quadrats
maintained a constant level of species density. Four control sites (Q11, Q12, Q16 and Q19) recorded
an increase in species density since 2014, while the remaining quadrats maintained a constant level of
species density in 2015. Species density for the impact sites ranged from 6 to 47 plants per 10m2,
whilst species density for the control sites ranged from 5 to 29 plants per 10m2.
4.3 Total Vegetation Cover
Mean total vegetation cover for the impact sites has fluctuated over the monitoring period initially
decreasing in 2014 before increasing in 2015 to equal the baseline survey result of 35%. The control
sites have shown a gradual increase in mean vegetation cover (1% per year) over the monitoring
period, increasing from 29% in 2013 to 31% in 2015. Six of the impact sites (Q2, Q3, Q5, Q6, Q7 and
Q9) have recorded an increase in total vegetation cover from 2014 to 2015; with the remaining
quadrats maintaining a constant vegetation cover in 2015. Four of the control sites (Q11, Q12, Q16 and
Q19) have also recorded an increase in total vegetation cover from 2014 to 2015, with the remaining
sites maintaining a constant level of total vegetation cover in 2015. Total vegetation cover for the
impact sites ranged from 17% to 64%, whereas total vegetation cover for the control sites ranged from
9% to 65%.
4.4 Health Condition
Mean health rating for both the impact and control sites has maintained a ‘Good’ health rating across
the monitoring period. There has been no variation in the health rating of any of the control or impact
quadrats in the 2015 monitoring period. Since monitoring began three of the impact sites (Q1, Q2 and
Q8) have shown an increase in health rating, two sites (Q4 and Q6) have decreased and the remaining
sites have maintained a constant health rating. Since monitoring began, four control sites (Q11, Q12,
Q14 and Q19) have shown an increase, one site (Q16) has decreased and the remaining sites have
maintained a constant health rating. A description of the current health condition for each monitoring
site is provided below in Table 5.
Fire is a natural and common occurrence within the Little Sandy Desert and the greater LDP Project
area; both the impact and control sites have been affected by fire with vegetation in various stages of
regrowth. One impact site (Q1) and four control sites (Q11, Q12, Q14 and Q19) were effected by fire in
2012; Impact sites (Q2 and Q6) and control site (Q16) were effected by a fire event in 2014 (Figure 7).
Sand Dune Vegetation Monitoring for Lake Disappointment: 2015
Reward Minerals Limited
Botanica Consulting 15
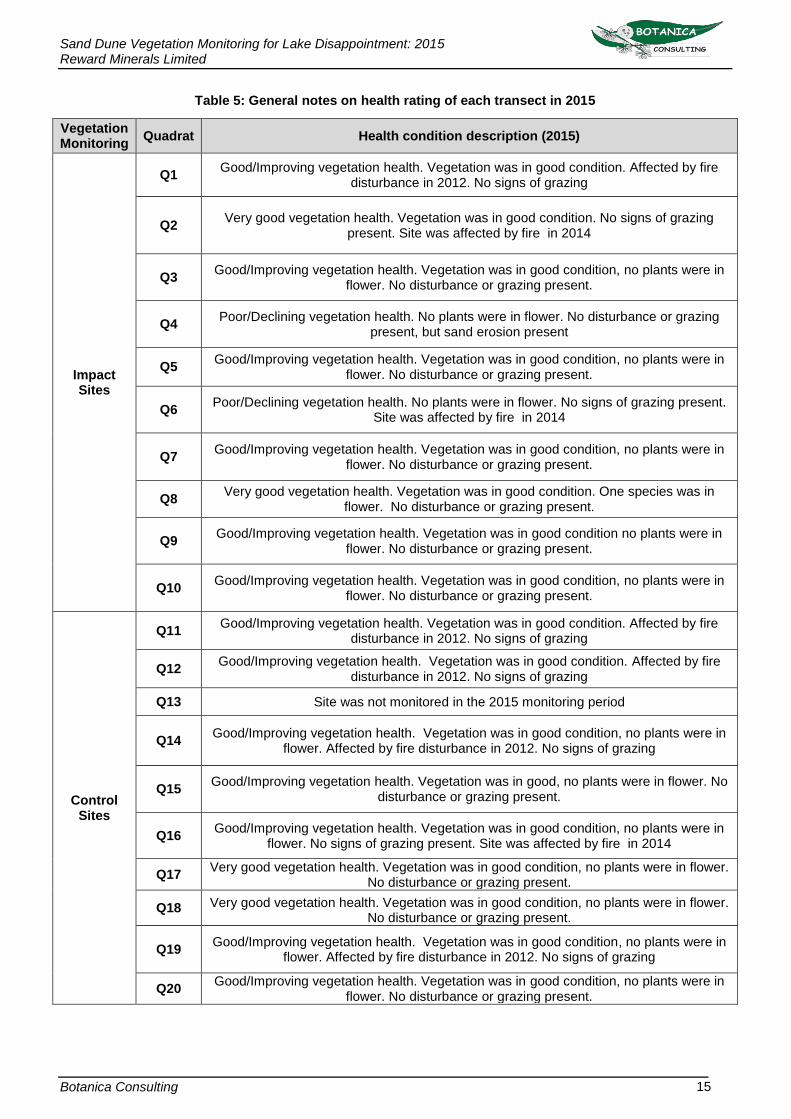
Table 5: General notes on health rating of each transect in 2015
Vegetation Monitoring
Quadrat Health condition description (2015)
Impact Sites
Q1 Good/Improving vegetation health. Vegetation was in good condition. Affected by fire
disturbance in 2012. No signs of grazing
Q2 Very good vegetation health. Vegetation was in good condition. No signs of grazing
present. Site was affected by fire in 2014
Q3 Good/Improving vegetation health. Vegetation was in good condition, no plants were in
flower. No disturbance or grazing present.
Q4 Poor/Declining vegetation health. No plants were in flower. No disturbance or grazing
present, but sand erosion present
Q5 Good/Improving vegetation health. Vegetation was in good condition, no plants were in
flower. No disturbance or grazing present.
Q6 Poor/Declining vegetation health. No plants were in flower. No signs of grazing present.
Site was affected by fire in 2014
Q7 Good/Improving vegetation health. Vegetation was in good condition, no plants were in
flower. No disturbance or grazing present.
Q8 Very good vegetation health. Vegetation was in good condition. One species was in
flower. No disturbance or grazing present.
Q9 Good/Improving vegetation health. Vegetation was in good condition no plants were in
flower. No disturbance or grazing present.
Q10 Good/Improving vegetation health. Vegetation was in good condition, no plants were in
flower. No disturbance or grazing present.
Control Sites
Q11 Good/Improving vegetation health. Vegetation was in good condition. Affected by fire
disturbance in 2012. No signs of grazing
Q12 Good/Improving vegetation health. Vegetation was in good condition. Affected by fire
disturbance in 2012. No signs of grazing
Q13 Site was not monitored in the 2015 monitoring period
Q14 Good/Improving vegetation health. Vegetation was in good condition, no plants were in
flower. Affected by fire disturbance in 2012. No signs of grazing
Q15 Good/Improving vegetation health. Vegetation was in good, no plants were in flower. No
disturbance or grazing present.
Q16 Good/Improving vegetation health. Vegetation was in good condition, no plants were in
flower. No signs of grazing present. Site was affected by fire in 2014
Q17 Very good vegetation health. Vegetation was in good condition, no plants were in flower.
No disturbance or grazing present.
Q18 Very good vegetation health. Vegetation was in good condition, no plants were in flower. No disturbance or grazing present.
Q19 Good/Improving vegetation health. Vegetation was in good condition, no plants were in
flower. Affected by fire disturbance in 2012. No signs of grazing
Q20 Good/Improving vegetation health. Vegetation was in good condition, no plants were in
flower. No disturbance or grazing present.

Sand Dune Vegetation Monitoring for Lake Disappointment: 2015
Reward Minerals Limited
Botanica Consulting 16
Figure 7: Map of fire history along the extent of the area obtained from Landgate fire watch database (Landgate, 2015)

Sand Dune Vegetation Monitoring for Lake Disappointment: 2015
Reward Minerals Limited
Botanica Consulting 17
4.5 Flora of Conservation Significance
No Threatened Flora taxa pursuant to subsection (2) of section 23F of the Wildlife Conservation Act
1950, the EPBC Act 1999 and as listed by the DPaW were identified within the Open low woodland of
Corymbia opaca over low scrub of Acacia ligulata/Grevillea juncifolia subsp. juncifolia and mid-dense
hummock grass of Triodia basedowii on sand dunes vegetation community.
4.6 Introduced Species
No introduced species were identified within the 20 sites of the monitoring program.
Sand Dune Vegetation Monitoring for Lake Disappointment: 2015
Reward Minerals Limited
Botanica Consulting 18
5 Conclusions and Recommendations
Mean species diversity, species density and vegetation cover of the control sites have all increased
since 2013. The impact sites have shown a varied trend, recording a decrease in species density since
2013. Despite the decrease since 2013, species density has increased since the previous monitoring
period and the impact sites have maintained a constant level of species diversity. Mean vegetation
cover of the impact sites is currently equal to levels recorded in 2013, recording an increase from 2014
to 2015. Mean health rating of both the impact and control sites has maintained a constant level since
monitoring began in 2013.
Fire has affected both the impact and control sites, with vegetation in various stages of regrowth. One
impact site (Q1) and four control sites (Q11, Q12, Q14 and Q19) were effected by fire in 2012, impact
sites (Q2 and Q6) and control site (Q16) were effected by a fire event in 2014.
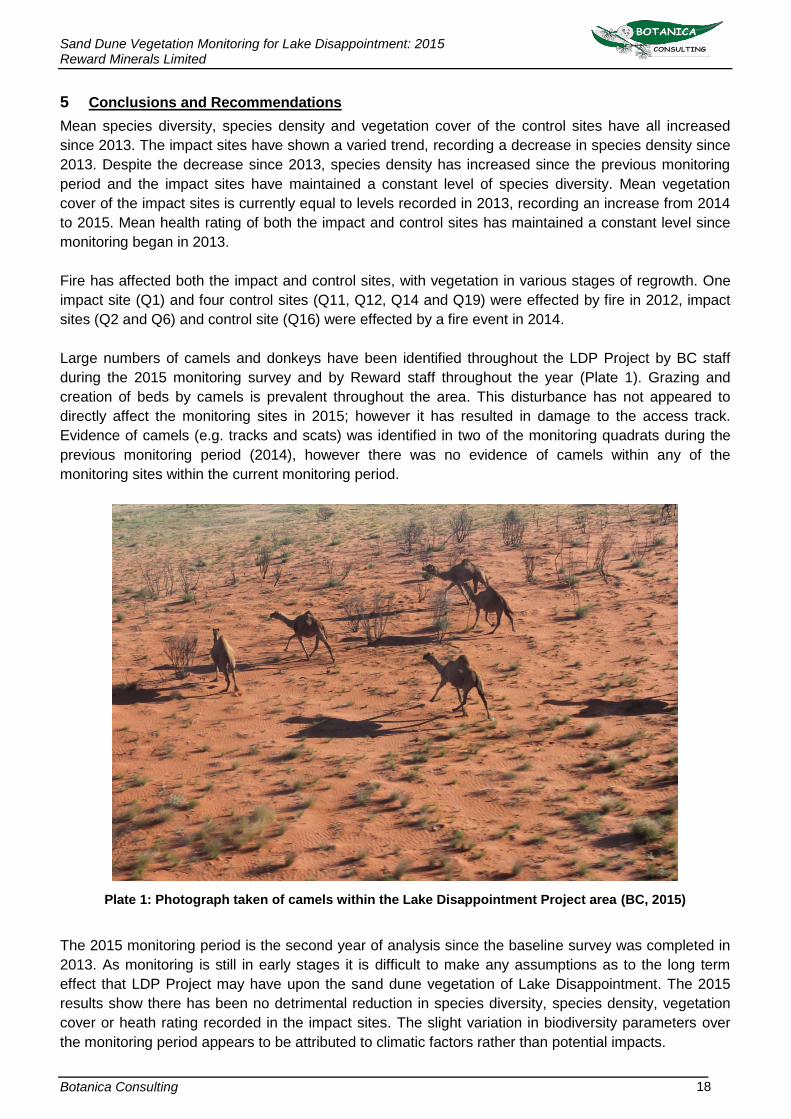
Large numbers of camels and donkeys have been identified throughout the LDP Project by BC staff
during the 2015 monitoring survey and by Reward staff throughout the year (Plate 1). Grazing and
creation of beds by camels is prevalent throughout the area. This disturbance has not appeared to
directly affect the monitoring sites in 2015; however it has resulted in damage to the access track.
Evidence of camels (e.g. tracks and scats) was identified in two of the monitoring quadrats during the
previous monitoring period (2014), however there was no evidence of camels within any of the
monitoring sites within the current monitoring period.
Plate 1: Photograph taken of camels within the Lake Disappointment Project area (BC, 2015)
The 2015 monitoring period is the second year of analysis since the baseline survey was completed in
2013. As monitoring is still in early stages it is difficult to make any assumptions as to the long term
effect that LDP Project may have upon the sand dune vegetation of Lake Disappointment. The 2015
results show there has been no detrimental reduction in species diversity, species density, vegetation
cover or heath rating recorded in the impact sites. The slight variation in biodiversity parameters over
the monitoring period appears to be attributed to climatic factors rather than potential impacts.

Sand Dune Vegetation Monitoring for Lake Disappointment: 2015
Reward Minerals Limited
Botanica Consulting 19
It is important to note that vegetation destruction caused by fire events and camels is also prevalent
within the LDP Project area; the impacts from such natural occurrences outside of Reward’s control (i.e.
Camels and fire) are recorded during monitoring to distinguish the impacts of these events from the
potential impacts of the LDP Project.
It is recommended that monitoring be conducted annually in autumn to document and track any future
changes in vegetation condition and recommendations made if there are any signs of adverse effects
on the vegetation of the sand dunes adjacent to the access track.

Sand Dune Vegetation Monitoring for Lake Disappointment: 2015
Reward Minerals Limited
Botanica Consulting 20
6 References
Beard, J.S., (1990), Plant Life of Western Australia, Kangaroo Press Pty Ltd, NSW
BOM, (2009), Kambalda 2007 - 2009, Bureau of Meteorology
BOM, (2015), Telfer Aero rainfall station (#13030) 1974-2015, Bureau of Meteorology
http://www.bom.gov.au/jsp/ncc/cdio/weatherData/av?p_nccObsCode=136&p_display_type=dailyDataFil
e&p_startYear=&p_c=&p_stn_num=13030
DAFWA, (2011), Pre-European Vegetation - Western Australia (NVIS Compliant Version GIS file),
Department of Agriculture and Food Western Australia
DotE, (2012a), Directory of Important Wetlands in Australia - Information sheet Lake Disappointment
(Savory Creek) System - WA052. Department of the Environment
http://www.environment.gov.au/cgi-bin/wetlands/report.pl?smode=DOIW;doiw_refcodelist=WA052
Accessed: 04/12/12
EA (2001). A Directory of Important Wetlands in Australia, Third Edition. Environment Australia,
Canberra.
IBRA, (2015), Interim Biogeographic Regionalisation for Australia (IBRA), Version 6.1, Department of
the Environment
http://www.environment.gov.au/metadataexplorer/explorer.jsp
Accessed: 12/04/15
Jacob, A., (2014), Threatened Flora-Declared Rare Flora Notice for Western Australia, Minister for
Environment.
Keighery, B.J. (1994) Bushland plant survey. A guide to plant community survey for the community.
Wildflower Society of WA (Inc.), Nedlands, Western Australia
Kendrick, P., (2001), A Biodiversity Audit of Western Australia’s 53 Biogeographical Region in 2001-
Little Sandy Desert 1 (LSD1 –Rudall subregion), Department of Conservation and Land Management
Landgate, (2015), Landgate fire watch database. Landgate Western Australian Government
http://firewatch.landgate.wa.gov.au/landgate_firewatch_public.asp
Accessed: 27/08/2015
WAHERB, (2015), Florabase – Information on the Western Australian Flora, Department of Parks and
Wildlife
http://florabase.dpaw.wa.gov.au
Accessed 27/08/2015

Appendix 1: Regional Map of Lake Disappointment Potash Project and areas of Conservation Significance
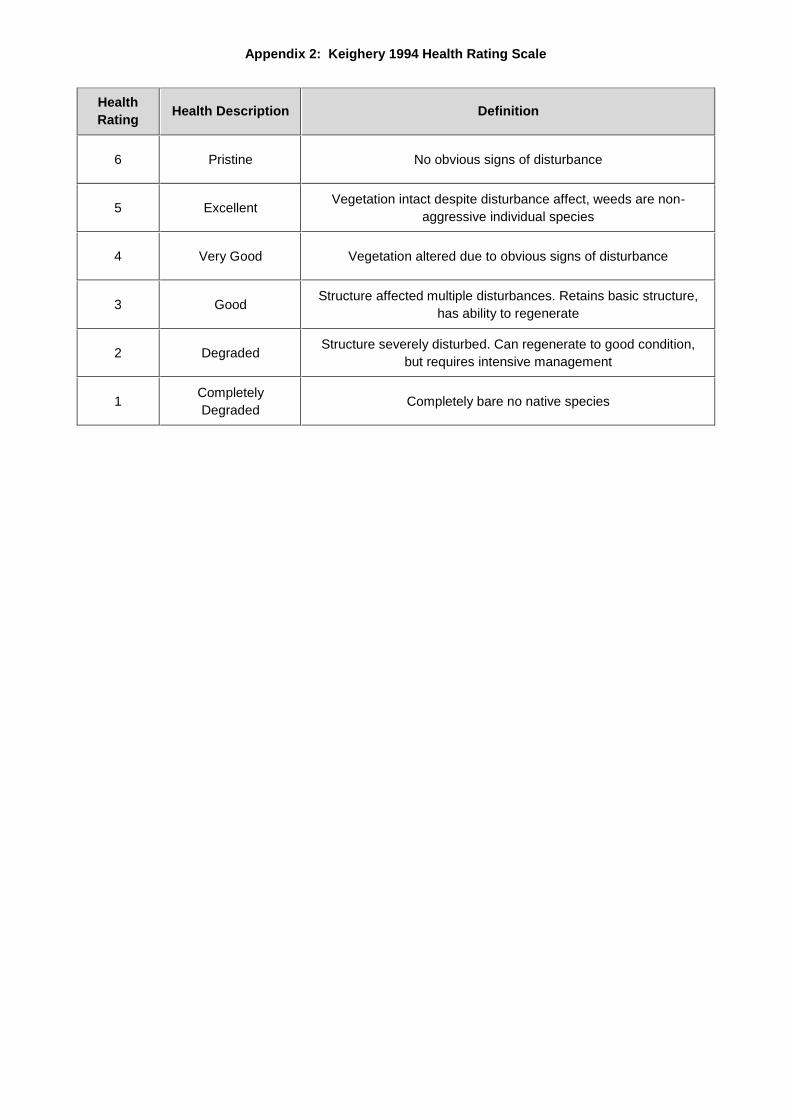
Appendix 2: Keighery 1994 Health Rating Scale
Health
Rating Health Description Definition
6 Pristine No obvious signs of disturbance
5 Excellent Vegetation intact despite disturbance affect, weeds are non-
aggressive individual species
4 Very Good Vegetation altered due to obvious signs of disturbance
3 Good Structure affected multiple disturbances. Retains basic structure,
has ability to regenerate
2 Degraded Structure severely disturbed. Can regenerate to good condition,
but requires intensive management
1 Completely
Degraded Completely bare no native species

Appendix 3: List of all species identified in Sand Dune vegetation monitoring program 2015
(A) Denotes annual species Family Genus Taxon
Amaranthaceae Gomphrena cunninghamii (A)
Amaranthaceae Ptilotus arthrolasius
Asteraceae Chrysocephalum eremaeum
Boraginaceae Trichodesma zeylanicum (A)
Cleomaceae Cleome uncifera subsp. microphylla
Cucurbitaceae Cucumis argenteus
Euphorbiaceae Euphorbia drummondii (A)
Fabaceae Acacia bivenosa
Fabaceae Acacia prainii
Fabaceae Acacia sabulosa
Fabaceae Petalostylis cassioides
Fabaceae Thinicola incana
Goodeniaceae Dampiera cinerea
Goodeniaceae Scaevola collaris
Goodeniaceae Scaevola parvifolia subsp. parvifolia
Goodeniaceae Scaevola sericophylla
Goodeniaceae Scaevola sp. (sterile)
Hemerocallidaceae Corynotheca micrantha var. micrantha
Lamiaceae Dicrastylis beveridgei
Lamiaceae Quoya loxocarpa
Malvaceae Abutilon sp. (sterile)
Malvaceae Corchorus walcottii
Malvaceae Hibiscus ?burtonii
Malvaceae Hibiscus sturtii var. platychlamys
Malvaceae Sida calyxhymenia
Myrtaceae Aluta maisonneuvei subsp. maisonneuvei
Myrtaceae Calytrix sp. (sterile)
Myrtaceae Corymbia opaca
Poaceae Aristida holathera var. holathera (A)
Poaceae Eragrostis cumingii (A)
Poaceae Eragrostis eriopoda
Poaceae Eragrostis sp. (sterile) (A)
Poaceae Eriachne aristidea (A)
Poaceae Paractaenum refractum (A)
Poaceae Triodia basedowii
Poaceae Yakirra australiensis (A)
Proteaceae Grevillea juncifolia subsp. juncifolia
Rubiaceae Oldenlandia pterospora
Solanaceae Anthotroche pannosa
Solanaceae Solanum chippendalei

Appendix 4: Raw Results of the Sand Dune Vegetation Monitoring 2015
(A) and blue text denotes an annual species which were not included in the calculations
Quadrat 1
Species
Species Diversity
(10m²)
Species Density
(10m²)
Species cover (%)
Total Vegetation Cover (%)
Health Rating
Aristida holathera var. holathera (A) 1 38 10 GC - 20
Dicrastylis beveridgei 1 4 5 MC - 6
Eragrostis cumingii (A) 0 0 0 CC - 0
Euphorbia drummondii (A) 0 0 0
Petalostylis cassioides 1 2 2
Scaevola parvifolia subsp. parvifolia
1 1 1
Scaevola sericophylla 1 7 1
Solanum chippendalei 1 7 1
Thinicola incana 1 2 5
Trichodesma zeylanicum (A) 0 0 0
Triodia basedowii 1 9 5
Yakirra australiensis (A) 0 0 0
Total (Perennial Species) 7 32 20 20 3
Quadrat 2
Species
Species Diversity
(10m²)
Species Density
(10m²)
Species cover (%)
Total Vegetation Cover (%)
Health Rating
Acacia bivenosa 1 1 1 GC - 30
Aluta maisonneuvei subsp. maisonneuvei
1 13 10 MC - 35
Aristida holathera var. holathera (A) 1 4 2 CC - 0
Dampiera cinerea 1 5 5
Dicrastylis beveridgei 1 3 1
Eragrostis eriopoda 1 4 1
Grevillea juncifolia subsp. juncifolia 1 2 10
Petalostylis cassioides 1 2 2
Scaevola parvifolia subsp. parvifolia 1 3 1
Triodia basedowii 1 18 30
Total (Perennial Species) 9 51 64 64 4
Quadrat 3
Species Species Diversity
(10m²)
Species Density (10m²)
Species cover (%)
Total Vegetation Cover (%)
Health Rating
Acacia sabulosa 1 3 20 GC - 4
Aristida holathera var. holathera (A) 1 2 4 MC - 20
Corynotheca micrantha var. micrantha
1 2 1 CC - 0
Eragrostis cumingii (A) 1 7 2
Quoya loxocarpa 1 2 1
Triodia basedowii 1 4 2
Total (Perennial Species) 4 11 24 24 3
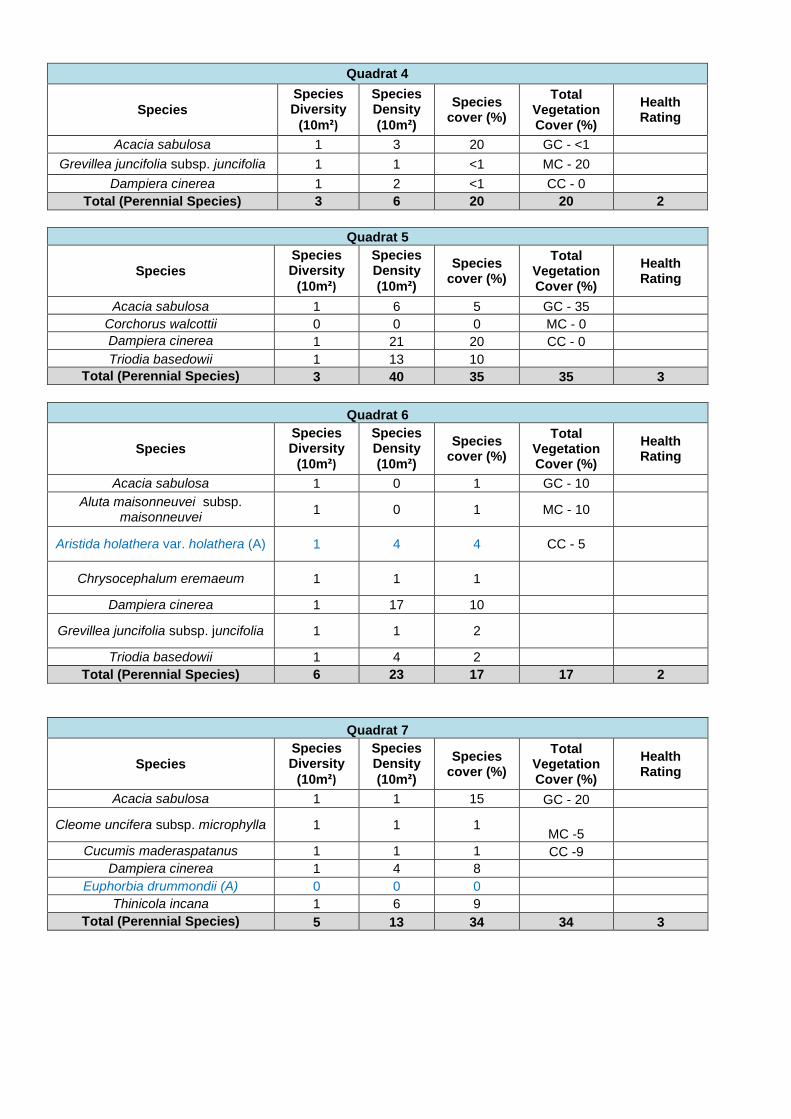
Quadrat 4
Species
Species Diversity
(10m²)
Species Density
(10m²)
Species cover (%)
Total Vegetation Cover (%)
Health Rating
Acacia sabulosa 1 3 20 GC - <1
Grevillea juncifolia subsp. juncifolia 1 1 <1 MC - 20
Dampiera cinerea 1 2 <1 CC - 0
Total (Perennial Species) 3 6 20 20 2
Quadrat 5
Species
Species Diversity
(10m²)
Species Density
(10m²)
Species cover (%)
Total Vegetation Cover (%)
Health Rating
Acacia sabulosa 1 6 5 GC - 35
Corchorus walcottii 0 0 0 MC - 0
Dampiera cinerea 1 21 20 CC - 0
Triodia basedowii 1 13 10
Total (Perennial Species) 3 40 35 35 3
Quadrat 6
Species
Species Diversity
(10m²)
Species Density
(10m²)
Species cover (%)
Total Vegetation Cover (%)
Health Rating
Acacia sabulosa 1 0 1 GC - 10
Aluta maisonneuvei subsp. maisonneuvei
1 0 1 MC - 10
Aristida holathera var. holathera (A) 1 4 4 CC - 5
Chrysocephalum eremaeum 1 1 1
Dampiera cinerea 1 17 10
Grevillea juncifolia subsp. juncifolia 1 1 2
Triodia basedowii 1 4 2
Total (Perennial Species) 6 23 17 17 2
Quadrat 7
Species
Species Diversity
(10m²)
Species Density
(10m²)
Species cover (%)
Total Vegetation Cover (%)
Health Rating
Acacia sabulosa 1 1 15 GC - 20
Cleome uncifera subsp. microphylla 1 1 1 MC -5
Cucumis maderaspatanus 1 1 1 CC -9
Dampiera cinerea 1 4 8
Euphorbia drummondii (A) 0 0 0
Thinicola incana 1 6 9
Total (Perennial Species) 5 13 34 34 3

Quadrat 8
Species
Species Diversity
(10m²)
Species Density
(10m²)
Species cover (%)
Total Vegetation Cover (%)
Health Rating
Aluta maisonneuvei subsp. maisonneuvei
1 4 2 GC - 40
Dampiera cinerea 1 8 5 MC - 15
Grevillea juncifolia subsp. juncifolia 1 1 1 CC - 2
Scaevola sericophylla 1 3 2
Triodia basedowii 1 31 40
Total (Perennial Species) 5 47 50 50 4
Quadrat 9
Species
Species Diversity
(10m²)
Species Density
(10m²)
Species cover (%)
Total Vegetation Cover (%)
Health Rating
Aluta maisonneuvei subsp. maisonneuvei
1 15 5 GC - 45
Aristida holathera var. holathera (A) 1 12 2 MC - 5
Dicrastylis beveridgei 1 12 5 CC - 0
Eragrostis cumingii (A) 1 4 2
Grevillea juncifolia subsp. juncifolia 1 3 5
Oldenlandia pterospora 1 1 1
Scaevola sp. (sterile) 1 2 1
Triodia basedowii 1 8 30
Total (Perennial Species) 6 41 47 47 3
Quadrat 10
Species
Species Diversity
(10m²)
Species Density
(10m²)
Species cover (%)
Total Vegetation Cover (%)
Health Rating
Chrysocephalum eremaeum 1 1 1 GC - 40
Dicrastylis beveridgei 1 2 2 MC - 5
Eragrostis cumingii (A) 1 7 5 CC - 0
Eragrostis eriopoda 1 1 1
Grevillea juncifolia subsp. juncifolia 1 2 5
Oldenlandia pterospora 1 1 1
Triodia basedowii 1 8 30
Total (Perennial Species) 6 15 40 40 3
Quadrat 11
Species
Species Diversity
(10m²)
Species Density
(10m²)
Species cover (%)
Total Vegetation Cover (%)
Health Rating
Aristida holathera var. holathera (A) 1 1 3 GC - 4
Calytrix sp. (sterile) 1 1 1 MC - 8
Dampiera cinerea 1 5 5 CC-0
Eragrostis eriopoda 1 6 2
Grevillea juncifolia subsp. juncifolia 1 3 1
Total (Perennial Species) 4 15 9 9 3
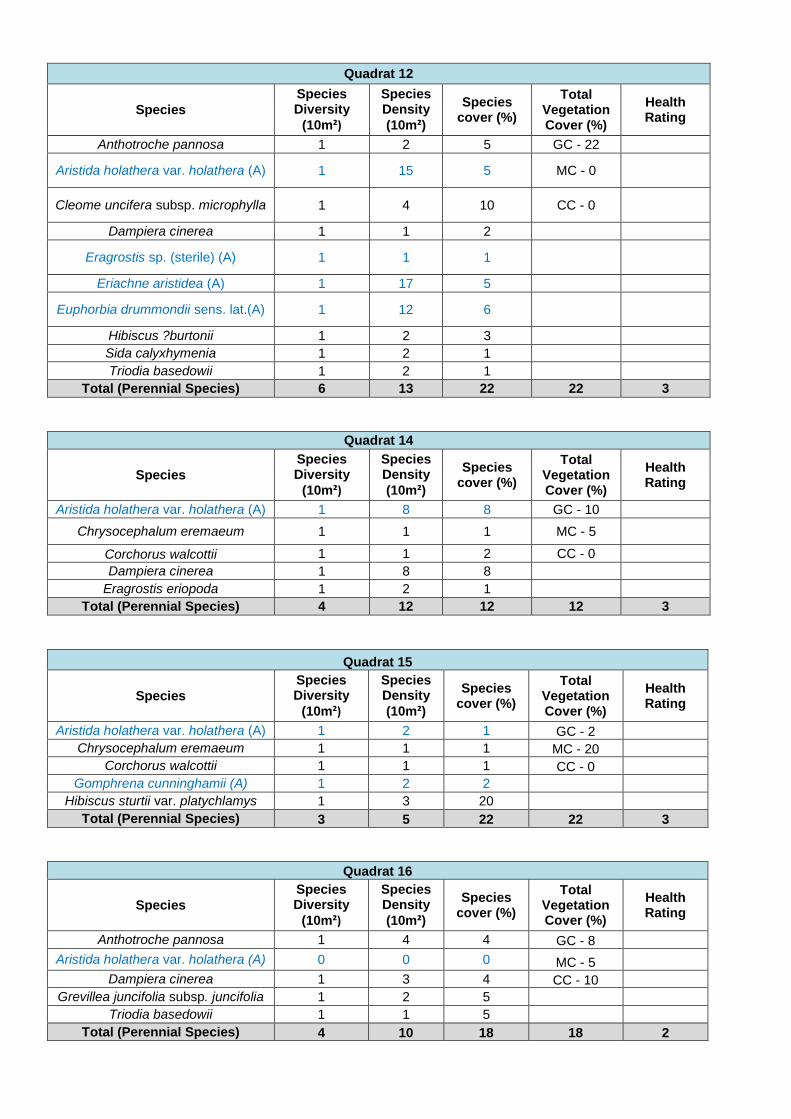
Quadrat 12
Species
Species Diversity
(10m²)
Species Density
(10m²)
Species cover (%)
Total Vegetation Cover (%)
Health Rating
Anthotroche pannosa 1 2 5 GC - 22
Aristida holathera var. holathera (A) 1 15 5 MC - 0
Cleome uncifera subsp. microphylla 1 4 10 CC - 0
Dampiera cinerea 1 1 2
Eragrostis sp. (sterile) (A) 1 1 1
Eriachne aristidea (A) 1 17 5
Euphorbia drummondii sens. lat.(A) 1 12 6
Hibiscus ?burtonii 1 2 3
Sida calyxhymenia 1 2 1
Triodia basedowii 1 2 1
Total (Perennial Species) 6 13 22 22 3
Quadrat 14
Species
Species Diversity
(10m²)
Species Density
(10m²)
Species cover (%)
Total Vegetation Cover (%)
Health Rating
Aristida holathera var. holathera (A) 1 8 8 GC - 10
Chrysocephalum eremaeum 1 1 1 MC - 5
Corchorus walcottii 1 1 2 CC - 0
Dampiera cinerea 1 8 8
Eragrostis eriopoda 1 2 1
Total (Perennial Species) 4 12 12 12 3
Quadrat 15
Species
Species Diversity
(10m²)
Species Density
(10m²)
Species cover (%)
Total Vegetation Cover (%)
Health Rating
Aristida holathera var. holathera (A) 1 2 1 GC - 2
Chrysocephalum eremaeum 1 1 1 MC - 20
Corchorus walcottii 1 1 1 CC - 0
Gomphrena cunninghamii (A) 1 2 2
Hibiscus sturtii var. platychlamys 1 3 20
Total (Perennial Species) 3 5 22 22 3
Quadrat 16
Species
Species Diversity
(10m²)
Species Density
(10m²)
Species cover (%)
Total Vegetation Cover (%)
Health Rating
Anthotroche pannosa 1 4 4 GC - 8
Aristida holathera var. holathera (A) 0 0 0 MC - 5
Dampiera cinerea 1 3 4 CC - 10
Grevillea juncifolia subsp. juncifolia 1 2 5
Triodia basedowii 1 1 5
Total (Perennial Species) 4 10 18 18 2

Quadrat 17
Species
Species Diversity
(10m²)
Species Density
(10m²)
Species cover (%)
Total Vegetation Cover (%)
Health Rating
Abutilon sp. (sterile) 1 10 10 GC - 40
Aristida holathera var. holathera (A) 1 31 15 MC - 30
Cleome uncifera subsp. microphylla 1 2 5 CC - 10
Dampiera cinerea 1 2 1
Grevillea juncifolia subsp. juncifolia 1 1 5
Ptilotus arthrolasius 1 3 5
Scaevola sericophylla 1 2 5
Triodia basedowii 1 4 10
Total (Perennial Species) 7 24 41 41 4
Quadrat 18
Species
Species Diversity
(10m²)
Species Density
(10m²)
Species cover (%)
Total Vegetation Cover (%)
Health Rating
Chrysocephalum eremaeum 1 1 1 GC - 55
Cleome uncifera subsp. microphylla
1 1 1 MC - 10
Corymbia opaca 1 2 20 CC - 40
Corynotheca micrantha var. micrantha
1 1 1
Cucumis argenteus 1 1 1
Eragrostis cumingii (A) 1 1 1
Euphorbia drummondii (A) 1 10 1
Gomphrena cunninghamii (A) 1 2 2
Grevillea juncifolia subsp. juncifolia 1 2 10
Paractaenum refractum (A) 1 10 5
Triodia basedowii 1 10 40
Total (Perennial Species) 7 18 74 74 4
Quadrat 19
Species
Species Diversity
(10m²)
Species Density
(10m²)
Species cover (%)
Total Vegetation Cover (%)
Health Rating
Anthotroche pannosa 1 7 5 GC - 20
Aristida holathera var. holathera (A) 1 22 10 MC - 0
Euphorbia drummondii (A) 1 3 5 CC - 0
Gomphrena cunninghamii (A) 1 3 5
Grevillea juncifolia subsp. juncifolia 1 3 5
Scaevola collaris 1 18 10
Triodia basedowii 1 1 <1
Total (Perennial Species) 4 29 20 20 3

Quadrat 20
Species
Species Diversity
(10m²)
Species Density
(10m²)
Species cover (%)
Total Vegetation Cover (%)
Health Rating
Acacia ligulata 0 0 0 GC - 65
Aluta maisonneuvei subsp. maisonneuvei
1 1 2 MC - 5
Aristida holathera var. holathera (A) 1 4 1 CC - 10
Corchorus walcottii 1 1 1
Corymbia opaca 1 1 10
Eragrostis eriopoda 1 2 2
Grevillea juncifolia subsp. juncifolia 1 1 5
Triodia basedowii 1 10 45
Total (Perennial Species) 6 16 65 65 3
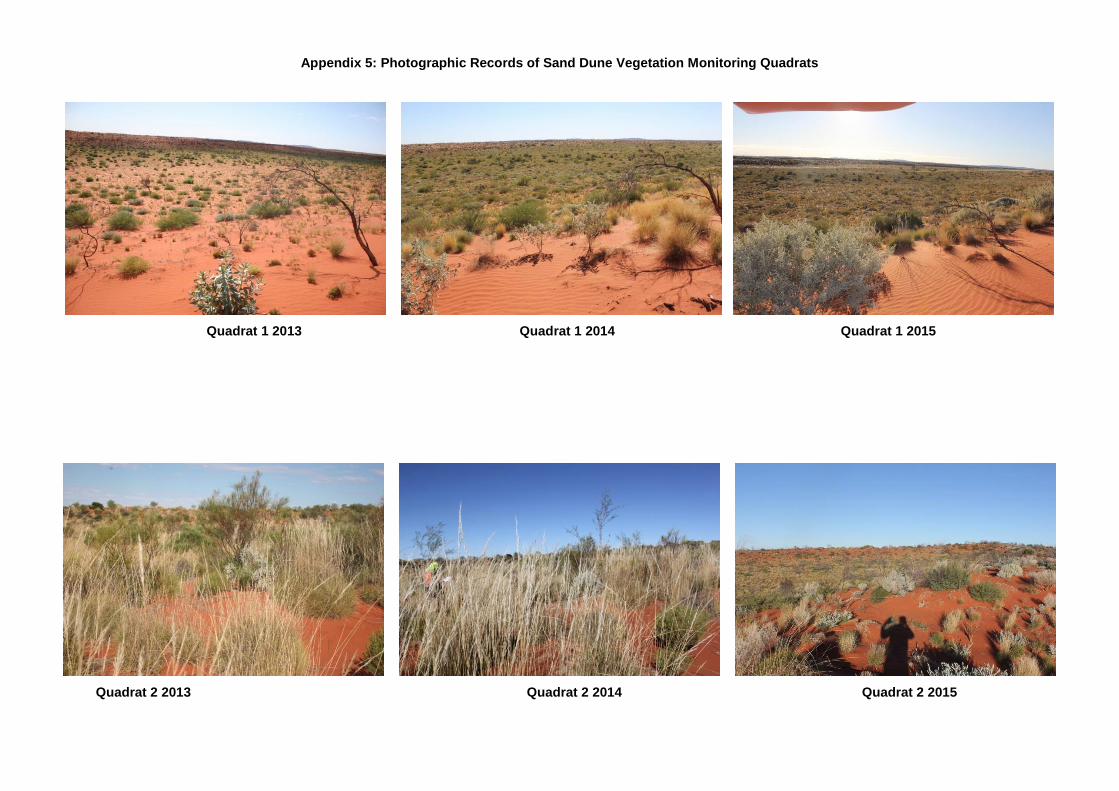
Appendix 5: Photographic Records of Sand Dune Vegetation Monitoring Quadrats
Quadrat 1 2013 Quadrat 1 2014 Quadrat 1 2015
Quadrat 2 2013 Quadrat 2 2014 Quadrat 2 2015

Quadrat 3 2013 Quadrat 3 2014 Quadrat 3 2015
Quadrat 4 2013 Quadrat 4 2014 Quadrat 4 2015
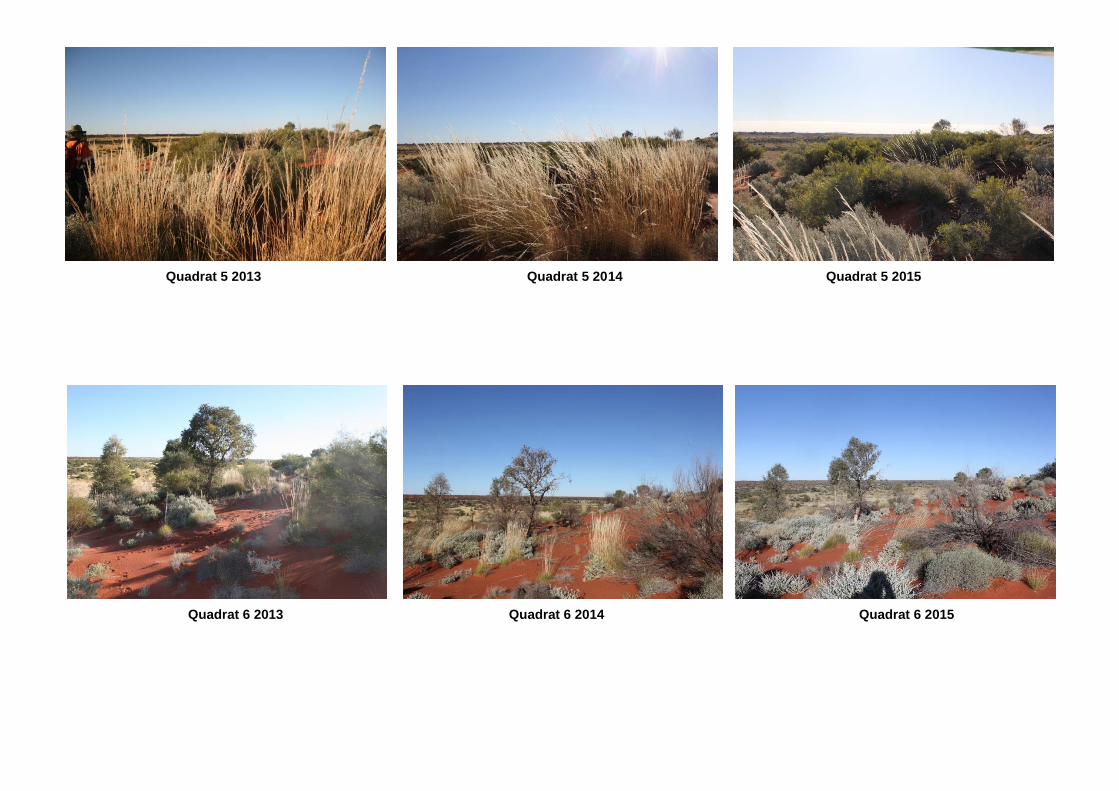
Quadrat 5 2013 Quadrat 5 2014 Quadrat 5 2015
Quadrat 6 2013 Quadrat 6 2014 Quadrat 6 2015
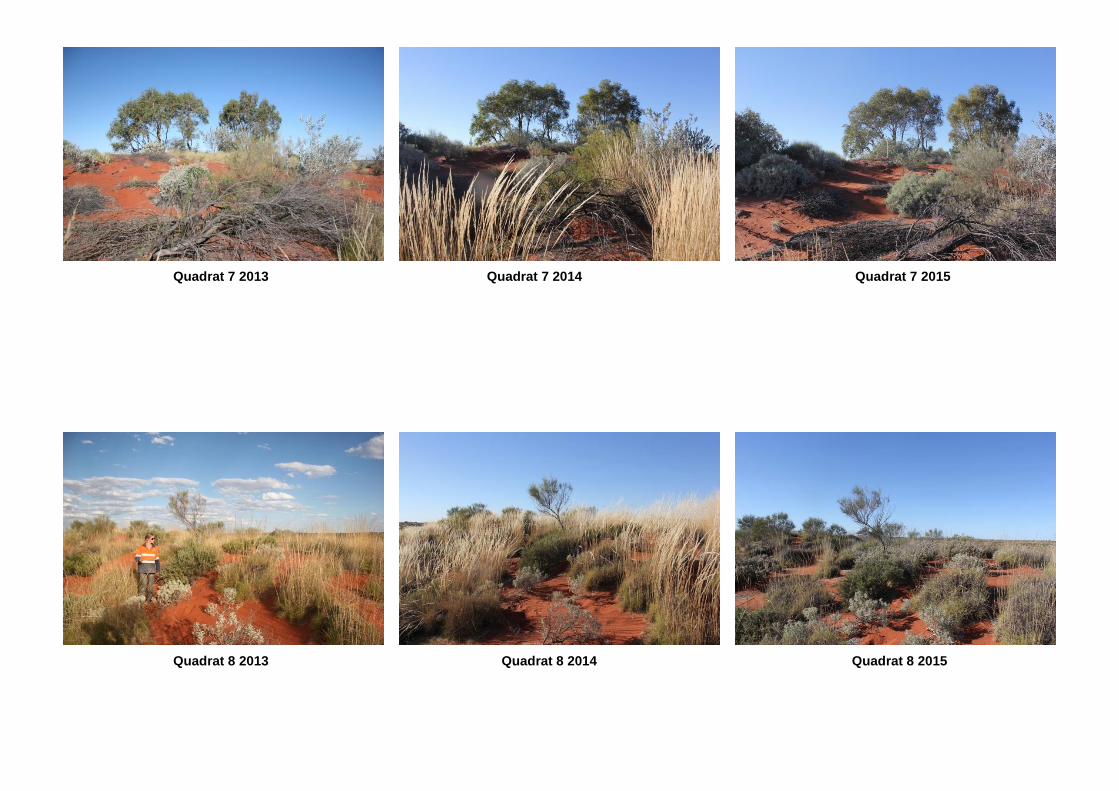
Quadrat 7 2013 Quadrat 7 2014 Quadrat 7 2015
Quadrat 8 2013 Quadrat 8 2014 Quadrat 8 2015
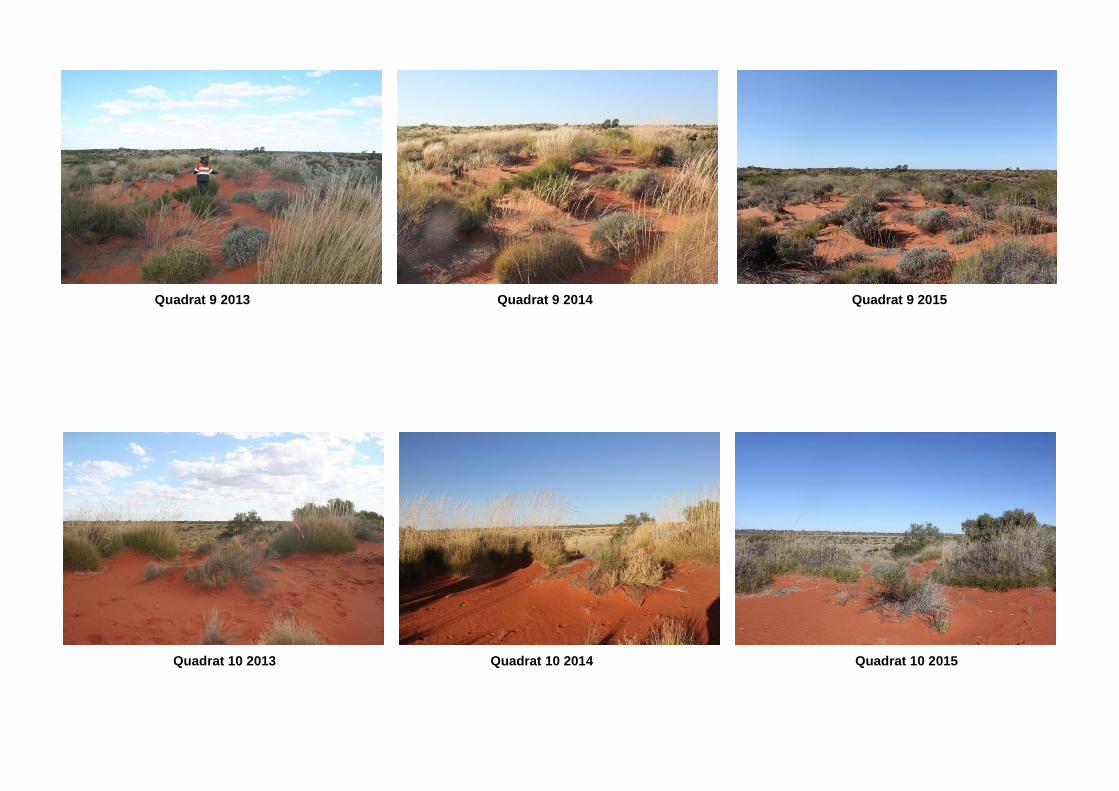
Quadrat 9 2013 Quadrat 9 2014 Quadrat 9 2015
Quadrat 10 2013 Quadrat 10 2014 Quadrat 10 2015
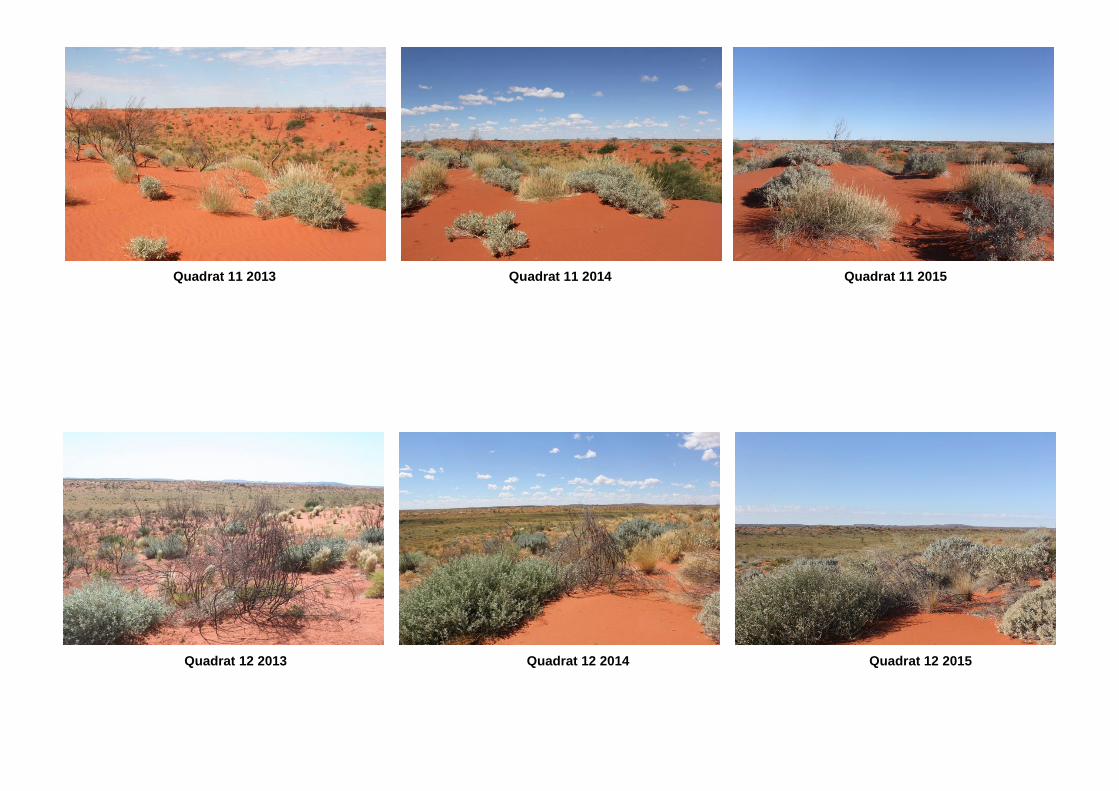
Quadrat 11 2013 Quadrat 11 2014 Quadrat 11 2015
Quadrat 12 2013 Quadrat 12 2014 Quadrat 12 2015

Quadrat 13 2013 Quadrat 13 2014 Quadrat 13 2015 (Not Monitored)
Quadrat 14 2013 Quadrat 14 2014 Quadrat 14 2015

Quadrat 15 2013 Quadrat 15 2014 Quadrat 15 2015
Quadrat 16 2013 Quadrat 16 2014 Quadrat 16 2015
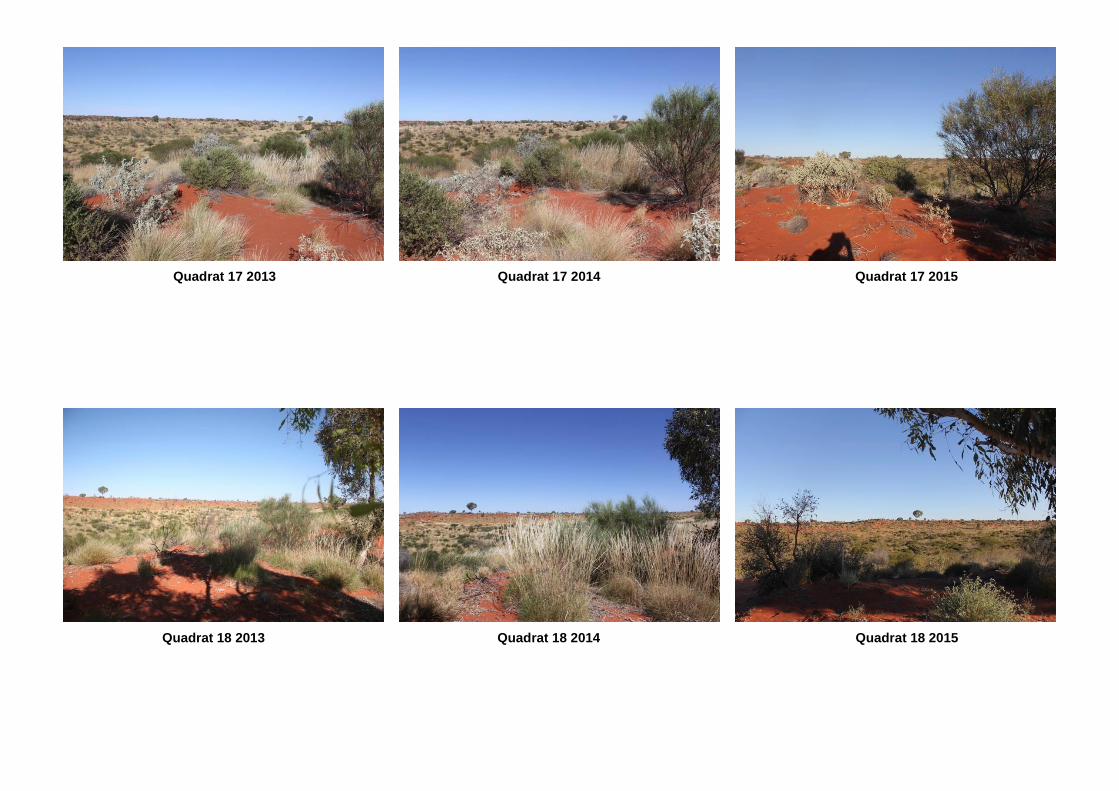
Quadrat 17 2013 Quadrat 17 2014 Quadrat 17 2015
Quadrat 18 2013 Quadrat 18 2014 Quadrat 18 2015
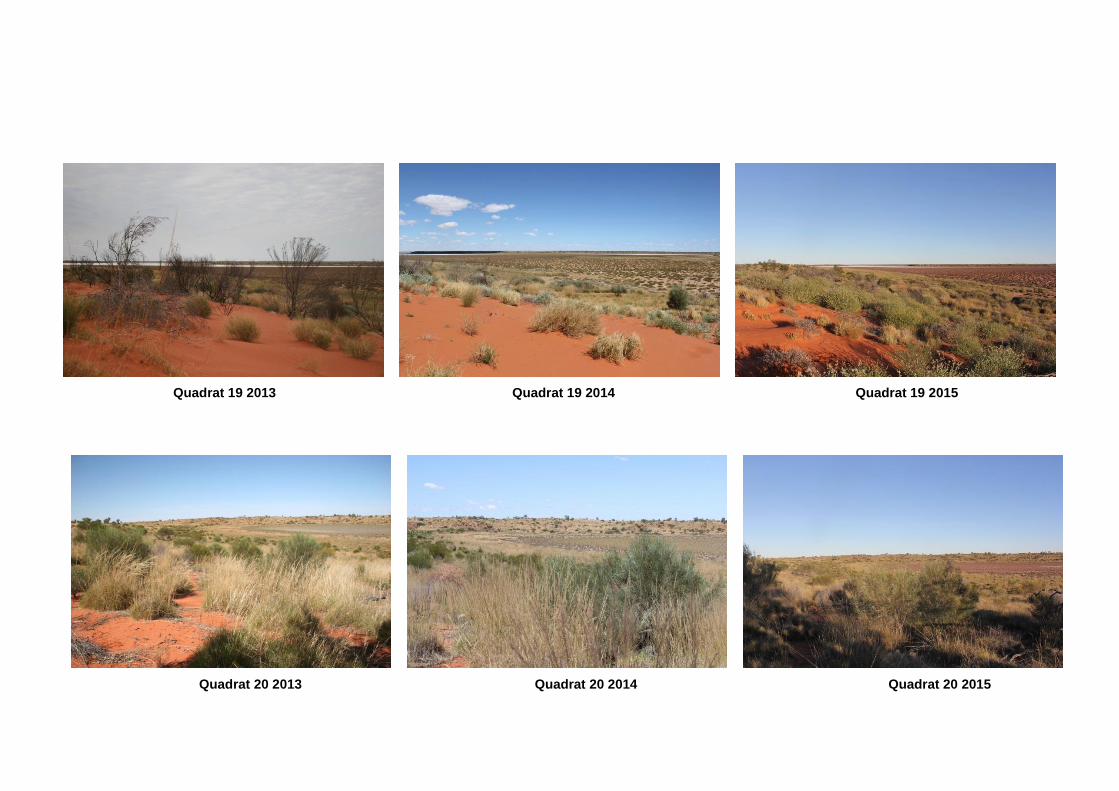
Quadrat 19 2013 Quadrat 19 2014 Quadrat 19 2015
Quadrat 20 2013 Quadrat 20 2014 Quadrat 20 2015