SAND DISTRIBUTION MODELING OF MIDDLE MIOCENE …
16
119 BULLETIN OF THE MARINE GEOLOGY Volume 26 No. 2, December 2011 SAND DISTRIBUTION MODELING OF MIDDLE MIOCENE RESERVOIR OF “EAST TARAKAN A FIELD” IN EASTERN PART OF TARAKAN ISLAND, EAST KALIMANTAN By : P. Hadi Wijaya 1 , D. Noeradi 2 , A.K. Permadi 2 , E. Usman 1 , S. Rusli 3 (Manuscript received 7 February 2011) ABSTRACT The discovery well with initial name “East Tarakan A-1” was drilled in February 2007 to a total vertical depth of 10,000 feet and encountered gas reservoir in Middle Miocene-age sands with deltaic sediment facies. The Field is structurally high, faulted to the Mengatal producing zones. This sandstone is hydrocarbon producer in most of onshore fields of Tarakan Island. “East Tarakan A” Field has been suppported with 19 (nineteen) 2D Seismic data. There are three wells i.e: East Tarakan A-1, A2b and A3 with several logs data, mud log and biostratigraphic data. The study aims are firstly to built 3D structural model from time and depth structural maps based on seismic interpretation and well log analysis, secondly to create 3D properties model especially volume shale (V-shale) to get sand distribution. The sand distribution model is supported by 3D structural model, petrophysical analysis and seismic attributes as well as geo- statistic method. Based on petrophysical analysis and wells correlation, sand reservoir interval of Middle Miocene (Meliat Fm) can be devided into two zones respectively top to bottom; zone-1 dan zone-2. RMS Amplitude analysis has been used to help constrain the sand distribution. Sand distribution with two zones indicates that sand distribution of zone-1 and zone-2 are generally located in distributary channel delta. NTG Distribution model of zone-1 and zone-2 indicates that reservoir zone distributed in distributary sand with trend of west to east. NTG of zone-1 is relatively better reservoir than the zone-2. Keywords: Tarakan, Middle Miocene, V-shale, sand distribution, 3D model, NTG SARI Sumur penemuan dengan nama inisial “East Tarakan A” telah dibor pada Februari 2007 dengan total kedalaman 10.000 kaki dan dijumpai reservoir gas pada lapisan pasir berumur Miosen Tengah dengan fasies sedimen delta. Lapangan gas ini berupa struktur tinggian dan patahan bersebelahan dengan zona produksi Lapangan Mengatal. Batupasir sebagai batuan reservoir merupakan lapisan utama penghasil hidrokarbon di lapangan onshore di Pulau Tarakan. Lapangan “East Tarakan A” didukung oleh data 19 penampang seismik 2D. Terdapat pula tiga 1. Marine Geological Institute of Indonesia 2. Institute Technology of Bandung 3. South Bengara-2 Pte., Ltd as a subsidiary of Samudera Energy Ltd.
Transcript of SAND DISTRIBUTION MODELING OF MIDDLE MIOCENE …

119BULLETIN OF THE MARINE GEOLOGYVolume 26 No. 2, December 2011
SAND DISTRIBUTION MODELING OF MIDDLE MIOCENE RESERVOIR OF “EAST TARAKAN A FIELD” IN EASTERN
PART OF TARAKAN ISL AND, EAST KALIMANTAN
By :
P. Hadi Wijaya1, D. Noeradi2, A.K. Permadi2, E. Usman1, S. Rusli3
(Manuscript received 7 February 2011)
A B S T R A C T
The discovery well with initial name “East Tarakan A-1” was drilled in February 2007 to atotal vertical depth of 10,000 feet and encountered gas reservoir in Middle Miocene-age sandswith deltaic sediment facies. The Field is structurally high, faulted to the Mengatal producingzones. This sandstone is hydrocarbon producer in most of onshore fields of Tarakan Island. “EastTarakan A” Field has been suppported with 19 (nineteen) 2D Seismic data. There are three wellsi.e: East Tarakan A-1, A2b and A3 with several logs data, mud log and biostratigraphic data.
The study aims are firstly to built 3D structural model from time and depth structural mapsbased on seismic interpretation and well log analysis, secondly to create 3D properties modelespecially volume shale (V-shale) to get sand distribution. The sand distribution model issupported by 3D structural model, petrophysical analysis and seismic attributes as well as geo-statistic method.
Based on petrophysical analysis and wells correlation, sand reservoir interval of MiddleMiocene (Meliat Fm) can be devided into two zones respectively top to bottom; zone-1 danzone-2. RMS Amplitude analysis has been used to help constrain the sand distribution. Sanddistribution with two zones indicates that sand distribution of zone-1 and zone-2 are generallylocated in distributary channel delta. NTG Distribution model of zone-1 and zone-2 indicatesthat reservoir zone distributed in distributary sand with trend of west to east. NTG of zone-1 isrelatively better reservoir than the zone-2.
Keywords: Tarakan, Middle Miocene, V-shale, sand distribution, 3D model, NTG
S A R I
Sumur penemuan dengan nama inisial “East Tarakan A” telah dibor pada Februari 2007dengan total kedalaman 10.000 kaki dan dijumpai reservoir gas pada lapisan pasir berumurMiosen Tengah dengan fasies sedimen delta. Lapangan gas ini berupa struktur tinggian danpatahan bersebelahan dengan zona produksi Lapangan Mengatal. Batupasir sebagai batuanreservoir merupakan lapisan utama penghasil hidrokarbon di lapangan onshore di Pulau Tarakan.Lapangan “East Tarakan A” didukung oleh data 19 penampang seismik 2D. Terdapat pula tiga
1. Marine Geological Institute of Indonesia2. Institute Technology of Bandung3. South Bengara-2 Pte., Ltd as a subsidiary of Samudera Energy Ltd.

120 BULLETIN OF THE MARINE GEOLOGYVolume 26 No. 2, December 2011
sumur pemboran yaitu Tarakan A-1, A-2b dan A3 dengan beberapa data log sumur, mud log danbiostratigrafi.
Studi ini dilakukan dengan maksud dan tujuan, pertama, membuat model stuktur geologi 3-dimensi dari peta struktur waktu dan kedalaman berdasarkan interpretasi seismic, analisis logsumur. Kedua, menghasilkan property model khususnya volume serpih (V-sh) untuk akhirnyamemperoleh distribusi pasir. Model sebaran pasir didukung dengan model struktur 3D, analisispetrofisika dan atribut seismik serta metode geo-statistik.
Based on petrophysical analysis and wells correlation, sand reservoir interval of MiddleMiocene (Meliat Fm) can be devided into two zones respectively top to bottom; zone-1 dan zone-2.RMS Amplitude analysis has been used to help constrain the sand distribution. Sand distributionwith two zones indicates that sand distribution of zone-1 and zone-2 are generally located indistributary channel delta. NTG Distribution model of zone-1 and zone-2 indicates that reservoirzone distributed in distributary sand with trend of west to east. NTG of zone-1 is relatively betterreservoir than the zone-2.
Berdasarkan pada analisis petrofisika dan korelasi antar sumur pemboran, lapisan reservoirpasir Miosen Tengah (Formasi Meliat) dibagi menjadi dua zona yaitu Zona-1 di bagian atas danzona-2 di bawahnya. Analisis amplituda RMS pada data seismik digunakan untuk membantupenyebaran sedimen pasir. Sebaran pasir dengan dua zona menunjukkan secara umumketerdapatan pasir di area distributary channel delta. Model distribusi NTG (net to gross) padazona-1 dan zona-2 memperlihatkan area reservoir berada di bagian pasir pada distributarychannel dengan arah barat ke timur. NTG pada zona-1 relatif lebih baik daripada zona-2.
Kata kunci: Tarakan, Miosen Tengah, V-serpih, sebaran pasir, NTG
INTRODUCTIONThe discovery well with initial name “East
Tarakan A-1” was drilled in February 2007 toa total vertical depth of 10,000 feet (3,274meters) and encountered gas reservoir inMiddle Miocene-age sands with deltaicsediment facies. The discovery well is locatedapproximately 6 kms east of Mengatal OilField and in easter part of Tarakan Island(Figure 1). The prospect is structurally high,faulted to the Mengatal producing zones. Thissandstone is hydrocarbon producer in most ofonshore fields of Tarakan Island.
Objectives of this research are firstly tobuilt 3D structural model from time and depthstructural maps based on seismic interpretationand well log analysis, secondly to create 3Dproperties model especially volume shale (V-shale) to get sand distribution. The sanddistribution model is supported by 3Dstructural model, petrophysical analysis andseismic attributes.
REGIONAL GEOLOGYEast Tarakan Field is located in the
Tarakan Basin especially of SuikerboardRidge. Tarakan Basin is bounded by theuplifted pre-Tertiary core of Kalimantan on theWest and opens Eastwards and Southeastwardsinto the Straits of Makassar. To the North, it isbounded by the Semporna Fault and theSemporna Volcanic Ridge. The later definesthe Southwestern most termination of the Suluvolcanic arc. To the South, the MangkalihatPeninsula and Mangkalihat Fault define theboundary between the Tarakan Basin and theKutai Basin.
East Tarakan Field is situated on theNorth-Easternmost part of the Tarakan Island.The structure is located on the up-thrown sideof the reverse fault, approximately six km Eastof Mengatal Oil Field. It is structurally high,faulted to the Mengatal producing zones. Thestructure is formed as thrusted anticlinalstructure along the North-South oriented EastTarakan Fault. Seismic interpretation indicatesthat the structure is formed by an Easternly

121BULLETIN OF THE MARINE GEOLOGYVolume 26 No. 2, December 2011
dipping of North-South trending high anglethrust fault situated on the Western margin ofthe North-South trending anticlinal structure
In general, the existing or proven oil andgas fields are formed by a combination ofstructural and stratigraphic trapping along theaxis of Southeasterly plunging Tarakan archinto Plio-Pleistocene reservoirs deposited in avery proximal to delta plain depositionalsetting.
Tarakan sub-Basin that will be a researchlocation was located in the middle of themouth of the Sajau River (Figure 2.a). Basedon the results of structural analysis and
sedimentation processes, Tarakan sub-basincan be divided into five geological regions,namely: Exposure-Sebuku Daino, Graben/sub-Deposenter Sembakung-Bangkudulis, Dasin-Fanny ridge, slope-Tibi and Mintut primarilyBunyu Deposenter - Tarakan (Figure 2.b).
Tectonostratigraphy in Tarakan Sub-basincan be divided into three phases; pre-Rift, syn-Rift and Post-Rift. In the post-Rift phase, theTarakan Sub-basin as a passive margin wasdivided into transgresion and regressionphases (Ellen, et al., 2008). In the regressionphase, the post-rift sediments are deltaicdeposits respectively Tabul, Santul, Tarakan
Figure 1. Study area of "East Tarakan" Field as a gas field in Eastern Part of Tarakan Island, EastKalimantan

122 BULLETIN OF THE MARINE GEOLOGYVolume 26 No. 2, December 2011
and Bunyu Formation. Rapid subsidencestarted Santul Formation resulting growthfaults that continues until Tarakan Formationin Pliocene age as a cycle-4 deposition.Tectonic activities during Late Pliocene toPleistocene change with produce compressiontectonic that encountered in some mono-anticline and thrust faults. This process occursduring Bunyu Formation deposition (Figure3).
METHODOLOGYGeological and Geophysical Availability
Data“East Tarakan A” Field has been
suppported with 19 (nineteen) 2D Seismic datai.e. 11 (eleven) crossline 2D seismic and 8(eight) inline seismic. Generally, the quality of2D seismic data is poor to middle quality ofseismic reflector. This 2D seismic quality givedifficulties impact in seismic interpretationespecially on seismic horizon of Top Sand
Reservoir of Middle Miocene that become abasis data of each top reservoirs from 1 to 4There are three wells i.e: East Tarakan A-1,A2b and A3 with several logs data, mud logand biostratigraphic data. As supporting dataVSP of Mengatal-1 will be used.
To determine reservoir characteristicsespecially sand distribution, 3D geologicalmodeling include structural and stratigraphicmodel are carried out based on integratedwells and seismics data through petrophysicalanalysis, seismic interpretations and seismicattributes, as well as considering regionalgeology to be input of geological concept inpetroleum system. For a reservoir with limitedinformation it is clearly impossible toconstruct a model that fulfils this condition.But, it is possible to build models that aredesigned with different specifications. So wecan build models which would respond thesame as the real reservoir for a very narrow
Figure 2 - a) Structure map of the Tarakan Sub-Basin (Hidayati, et al., 2007), b) Tarakan Basin can bedivided into four sub-basins namely Tidung, Tarakan, Berau, and Muara Sub-Basin(Achmad and Samuel, 1984)

123BULLETIN OF THE MARINE GEOLOGYVolume 26 No. 2, December 2011
Figure 3 - Regional tectonostratigraphy includes litostratigraphy and chronostratigraphy in the TarakanBasin (Ellen, et al., 2008)

124 BULLETIN OF THE MARINE GEOLOGYVolume 26 No. 2, December 2011
Figure 4. Base map of "East Tarakan A" Field with 19 seismiclines and 3 wells location
Figure 5. Seismic Interpretation of line L-111 that across the East Tarakan Field

125BULLETIN OF THE MARINE GEOLOGYVolume 26 No. 2, December 2011
subset of possible interrogations (Tyson andMath, 2009)
Building 3D static geological models for“East Tarakan A” Field incorporating 2Dinterpretation both horizons and faults,petrophysical interpretation of A1, A2b andA3 wells and well to well correlation to divideinto two zone reservoirs. A new geologicalmodel will be built based on interpretationsand analyses of all the available geological,geophysical and 2D Seismic data in around of“East Tarakan A” Field.
In determining reservoir properties, theintegrated process between well logs and DSTanalysis should be done to calibrate thevalidity of log derived reservoir properties iscarried out. Using standard formulas, reservoirproperties i.e. V-shale and net porosity wereobtained from gamma ray log, density –velocity combined logs respectively. Then, theanalysis using cut-off values of V-sh willproduce net to gross reservoir (NTG).
The upscaling process imports the welldata into those cells of the model penetrated bythe wells. Each cell has a single value for eachproperty and it is derived from averaging thelog values within each cell. The well data arethe key input data for the property modelling,i.e. for defining the range of property valuesfor each of the electrofacies within the model.The 1-Vsh log of well data are upscaled.
RESULT AND DISCUSSION
Seismic InterpretationThe structure was formed as trusted
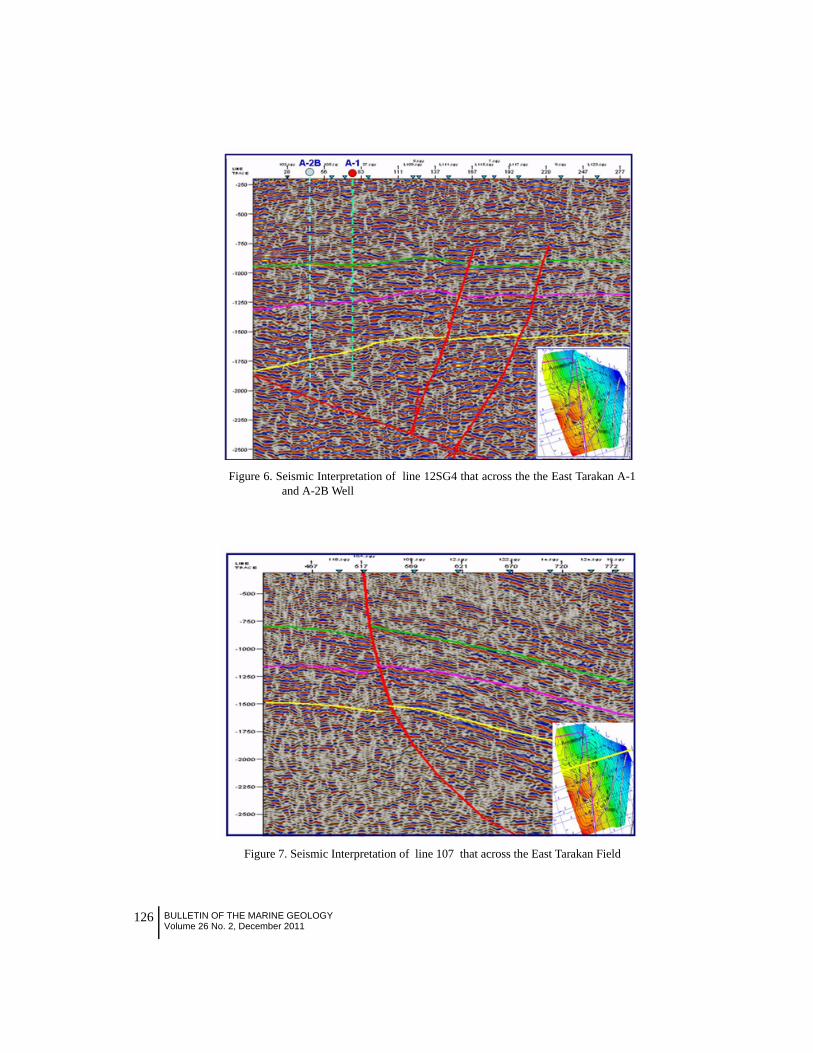
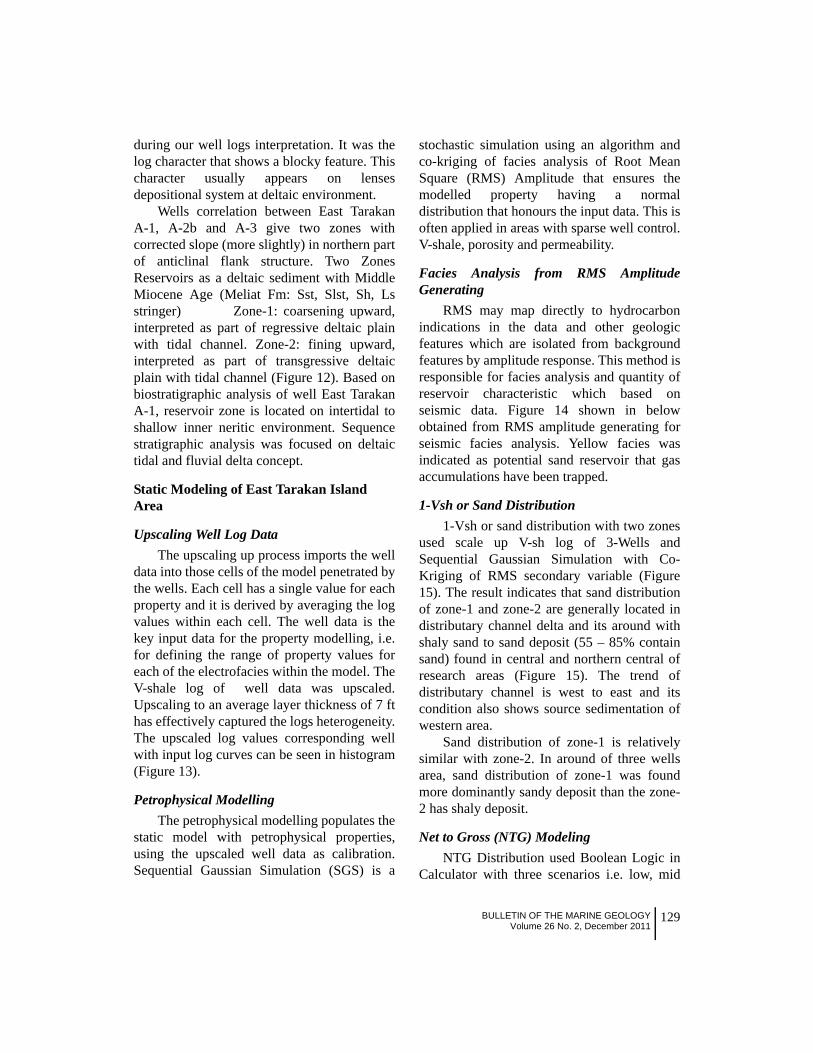
anticlinal structure along the N-S oriented EastTarakan Fault. Seismic interpretation indicatesthat the structure is formed by an Easterlydipping of N-S trending high angle thrust faultsituated on the Western margin of the N-Strending anticlinal structure. Because the payzone lays only on one wiggle, it is difficult tointerpret the internal structure of the pay zone.Seismic sections of this structure are shown in
Figures 5 through 7 show structure mapsalong with the gas interval found as gasreservoirs.
Depth Structural Maps of Top Sand Reser-voir of Middle Miocene
The depth structure maps for top horizonof top sand reservoir of Middle Miocene wasobtained by conversion from the time structuremap using velocity model of Mengatal-1.Velocity model of time to depth conversionfrom Mengatal-1 well was used to change timestructural maps become depth structural mapsof East Tarakan A Field .
The depth structural map (Figure 8) and3D model of depth structural (Figure 9) showthat subsurface geological setting of top sandreservoir is situated on the north easternmostpart of the Tarakan Island. This field is locatedon the up-thrown side of the reverse fault. Thefield is is structurally high, faulted to theMengatal producing zones. Seismicinterpretation indicates that the prospect isformed by an easterly dipping of N-S trendinghigh angle thrust fault situated on the westernmargin of the N-S trending anticlinal structure.
Well logs AnalysisNet to gross each sand reservoir was
obtained from V-Shale analysis with threescenarios i.e. 49%, 51% and 54% cut off basedon Gas Flow Location (DST Zones) usingVolume-shale (V-sh) log obtained from GR log(Figure 10). Porosity and water saturation foreach of the four sub-zones reservoirs wereestimated by petrophysical analysis of welllogs. Cut Off porosity and water saturationbases on Gas Flow Location (DST Zones) canbe seen in figure 2. Porosity was selected fromfive scenarios and the final resut is the densityand sonic logs; water saturations were alsotaken from log and calculated using theModified Indonesia equation. The results ofwell logs analysis are shown in the following(Figure 11). There is strong evidence found
126 BULLETIN OF THE MARINE GEOLOGYVolume 26 No. 2, December 2011
Figure 6. Seismic Interpretation of line 12SG4 that across the the East Tarakan A-1and A-2B Well
Figure 7. Seismic Interpretation of line 107 that across the East Tarakan Field

127BULLETIN OF THE MARINE GEOLOGYVolume 26 No. 2, December 2011
Figure 8. Depth map of Top Sand Reservoir of Middle Miocene
Figure 9. 3D Model of depth structural of Top Sand Reservoirof Middle Miocene

128 BULLETIN OF THE MARINE GEOLOGYVolume 26 No. 2, December 2011
Figure 10: Cut-off Vsh and Porosity based on Gas Flow Location (DST Zones)
Figure 11: Petrophysical analysis to get V-sh and porosity logs
129BULLETIN OF THE MARINE GEOLOGYVolume 26 No. 2, December 2011
during our well logs interpretation. It was thelog character that shows a blocky feature. Thischaracter usually appears on lensesdepositional system at deltaic environment.
Wells correlation between East TarakanA-1, A-2b and A-3 give two zones withcorrected slope (more slightly) in northern partof anticlinal flank structure. Two ZonesReservoirs as a deltaic sediment with MiddleMiocene Age (Meliat Fm: Sst, Slst, Sh, Lsstringer) Zone-1: coarsening upward,interpreted as part of regressive deltaic plainwith tidal channel. Zone-2: fining upward,interpreted as part of transgressive deltaicplain with tidal channel (Figure 12). Based onbiostratigraphic analysis of well East TarakanA-1, reservoir zone is located on intertidal toshallow inner neritic environment. Sequencestratigraphic analysis was focused on deltaictidal and fluvial delta concept.
Static Modeling of East Tarakan Island Area
Upscaling Well Log DataThe upscaling up process imports the well
data into those cells of the model penetrated bythe wells. Each cell has a single value for eachproperty and it is derived by averaging the logvalues within each cell. The well data is thekey input data for the property modelling, i.e.for defining the range of property values foreach of the electrofacies within the model. TheV-shale log of well data was upscaled.Upscaling to an average layer thickness of 7 fthas effectively captured the logs heterogeneity.The upscaled log values corresponding wellwith input log curves can be seen in histogram(Figure 13).
Petrophysical ModellingThe petrophysical modelling populates the
static model with petrophysical properties,using the upscaled well data as calibration.Sequential Gaussian Simulation (SGS) is a
stochastic simulation using an algorithm andco-kriging of facies analysis of Root MeanSquare (RMS) Amplitude that ensures themodelled property having a normaldistribution that honours the input data. This isoften applied in areas with sparse well control.V-shale, porosity and permeability.
Facies Analysis from RMS AmplitudeGenerating
RMS may map directly to hydrocarbonindications in the data and other geologicfeatures which are isolated from backgroundfeatures by amplitude response. This method isresponsible for facies analysis and quantity ofreservoir characteristic which based onseismic data. Figure 14 shown in belowobtained from RMS amplitude generating forseismic facies analysis. Yellow facies wasindicated as potential sand reservoir that gasaccumulations have been trapped.
1-Vsh or Sand Distribution1-Vsh or sand distribution with two zones
used scale up V-sh log of 3-Wells andSequential Gaussian Simulation with Co-Kriging of RMS secondary variable (Figure15). The result indicates that sand distributionof zone-1 and zone-2 are generally located indistributary channel delta and its around withshaly sand to sand deposit (55 – 85% containsand) found in central and northern central ofresearch areas (Figure 15). The trend ofdistributary channel is west to east and itscondition also shows source sedimentation ofwestern area.
Sand distribution of zone-1 is relativelysimilar with zone-2. In around of three wellsarea, sand distribution of zone-1 was foundmore dominantly sandy deposit than the zone-2 has shaly deposit.
Net to Gross (NTG) ModelingNTG Distribution used Boolean Logic in
Calculator with three scenarios i.e. low, mid

130 BULLETIN OF THE MARINE GEOLOGYVolume 26 No. 2, December 2011
Figure 12: Well to well correlation of East Tarakan A-1, A-2b and A-3
Figure 13. Upscalling Bayan A1, A2b and A3 well-logs data of V-shale

131BULLETIN OF THE MARINE GEOLOGYVolume 26 No. 2, December 2011
Figure 14. Facies seismic based on RMS Amplitude with 20ms below Top Sand 7000
Figure 15. Two zones of 1-Vsh or sand distribution after upscalling well

132 BULLETIN OF THE MARINE GEOLOGYVolume 26 No. 2, December 2011
and high (Figure 10). Low scenario is cut-offVsh = 49% and Porosity = 9.0%. Mid scenariois Cut-off Vs=51 and porosity = 8.5%. Highscenario is cut-off Vs = 54% , Porosity = 8.0%.
The result shows that green colour area isreservoir zone but the red area is non-reservoirzone. NTG model of zone-1 and zone-2indicates that reservoir zone distributed indistributary sand with trend of west to east.NTG of zone-1 is relatively better reservoirthan the zone-2.
CONCLUSIONThe depth structural map of top sand
based on seismic interpretation and well loganalysis show that subsurface geologicalsetting of top sand reservoir of MiddleMiocene is situated on the north easternmostpart of the Tarakan Island. “East Tarakan A”field is located on the up-thrown side of thereverse anticlinal fault.
Based on petrophysical analysis and wellscorrelation, sand reservoir interval of MiddleMiocene (Meliat Fm) can be devided into twozones respectively top to bottom; zone-1 danzone-2.
RMS may map directly to hydrocarbonindications in the data and supporting toconsideration of sand laterally distribution.RMS Amplitude analysis has been used usedto help constrain the sand distribution.
1-Vsh or sand distribution with two zonesindicates that sand distribution of zone-1 andzone-2 are generally located in distributarychannel delta and its around with shaly sand tosand deposit found in central and northerncentral of research areas.
NTG Distribution model of zone-1 andzone-2 indicates that reservoir zone distributedin distributary sand with trend of west to east.NTG of zone-1 is relatively better reservoirthan the zone-2.
Figure 16. NTG distribution based on Vsh cut-off using mid-scenario in two zones of reservoir

133BULLETIN OF THE MARINE GEOLOGYVolume 26 No. 2, December 2011
ACKNOWLEDGMENTS We would like to thanks a lot for
management of BP-Migas, DirectorateGeneral of Oil and Gas, as well as Agency ofResearch and Development Energy andMineral Resources, especially Mr. SubaktianLubis M.Sc as a Head of Marine GeologicalInstitute.
Also, we wish to thanks LAPI-ITB andmanagement of Provident Energy Resourcesthat have fully suported to this research. Aswell as, we wish to thank you so much, ourcolleagues in MGI especially Kris Budiono,M.Sc. and editor team of Bulletin of MarineGeology, Lili Sarmili, M.Sc., Ir. Dida Kusnida,M.Sc., Dr. Susilohadi, and Mustaba AriSuryoko,ST who give continuously support,discussion and correction to publish the paper.
ReferencesAchmad, Z., Samuel, L. (1984), Stratigraphy
and depositional cycles in the N.E.Kalimantan Basin. Proceedings ofIndonesian Petroleum Association 13th
Annual Convention, Jakarta, Vol. 1,109-120.
Biantoro, E., Kusuma, M.I., dan Rotinsulu,L.F. (1996), Tarakan sub-basin growthfaults, North-East Kalimantan: Theirroles hydrocarbon entrapment,Proceedings of Indonesian PetroleumAssociation 25th Annual Convention,Jakarta, Vol. 1, 175-189.
Darman, H. (2001), Turbidite plays ofIndonesia: An Overview, BeritaSedimentologi, 15, 2-21.
Ellen, H., Husni, M.N, Sukanta, U.,Abimanyu, R., Feriyanto, Herdiyan, T.(2008), Middle Miocene MeliatFormation in the Tarakan Islan, regionalimplications for deep explorationopportunity, Proceedings of Indonesian
Petroleum Association 32nd AnnualConvention, Jakarta, Vol.1
Hidayati, S., Guritno, E., Argenton, A., Ziza,W., Campana, I.D. (2007), Re-visitedstructural framework of the TarakanSub-Basin, Proceedings of IndonesianPetroleum Association 31st AnnualConvention, Jakarta, Vol.1
Kendall, Christopher., 2005, Hand-outStratigraphy & Sedimentary Basin,Sequence Stratigraphy – Basics,unpublished
Koesoemadinata, R.P. (1980), Geologi Minyakdan Gas Bumi, Jilid 1 dan 2, PenerbitITB Bandung, Jilid 1-2.
Lentini, M. R., Darman, H. (1996), Aspects ofthe Neogen tectonic history andhydrocarbon geology of the TarakanBasin, Proceedings of IndonesianPetroleum Association 25th AnnualConvention, Jakarta, Vol.1, 241-251.
Noon, S., Harrington, J., dan Darman, H.(2003), The Tarakan Basin, EastKalimantan: Proven neogen fluvio-deltaic, prospective deep-water andpaleogen plays in a regionalstratigraphic context, Proceedings ofIndonesian Petroleum Association 29th
Annual Convention, Jakarta, Vol.1,425-440
North, F.K. (1985), Petroleum geology, Allen& Unwin Inc., 115-126.
Subroto, E.A., Muritno, B.P., Sukowitono,Noeradi, D., Djuhaeni (2005),Petroluem geochemistry study in aSequence stratigraphic framework inthe Simenggaris Block, Tarakan Basin,East Kalimantan, Indonesia,Proceedings of Indonesian PetroleumAssociation 30th Annual Convention,Jakarta, Vol.1

134 BULLETIN OF THE MARINE GEOLOGYVolume 26 No. 2, December 2011
Vail, P. R., Mitchum, R. M., Todd, J.R.,Widmer J.M., Thomson III, S., Sangree,J.B., Bubb, J.N. (1977), Seismicstratigraphy and global changes of sealevel, Part 1-11, AAPG Memoir 26th,p.49-212
Vail P.R., and Wornardt, W., Jr., (1991) AnIntegrated approach to exploration anddevelopment in the 90; Well-logseismic sequence stratigraphy analysis,Transaction – Gulf Coast Association ofGeology Societies, Vol. XLI, 630-650
Van Wagoner, J.C., Posamentier, H.W.,Mitchum, R.M., Vail, P.R., Sarg, Loutit,T.S., and Handenbol, J. (1988), AnOverview of the fundamental ofsequence stratigraphy and keydefinition; in Wilgus C.K. et.al (eds);Sea-Level Changes; An IntegradeApproach; SEPM, Spec.Publ., Vol.42,39-69