San Diego State University 5500 Campanile Drive Subject ... · Proposed Tula Pavilion: The proposed...
40
N:\2682\Report\Letter Report.2682_Revised_Clean.doc December 19, 2016 Ms. Laura Shinn San Diego State University 5500 Campanile Drive San Diego, CA 92182 LLG Reference: 3-16-2682 Subject: San Diego State University Tula / Tenochca Project – Transportation Impact Analysis Linscott, Law & Greenspan, Engineers (LLG) has prepared this technical memorandum to document an analysis of potential traffic-related impacts associated with the proposed San Diego State University Tula/Tenochca project. Included in this analysis are the following: Project Description Study Area Description/Existing Conditions Trip Generation/Route Assumption/Distribution Summary Analysis Methodology and Results Conclusion PROJECT DESCRIPTION SDSU proposes to demolish the existing two-story Tula/Tenochca Community Center (approximately 20,000 gross square feet (gsf) in size) and construct in its place the Tenochca Community Space and the nearby Tula Pavilion. The total gsf to be demolished is approximately 20,000 gsf, and the total gsf to be constructed is approximately 25,000 gsf of interior space. Because the new buildings would replace an existing building and its associated uses, upon completion the project would not generate new or additional students, staff, or visitors to the SDSU campus and, therefore, would not generate any additional vehicle trips beyond the existing condition. Demolition of the existing building would result in generating approximately 4,000 cubic yards (cy) of debris. Each of the project components are separately described below. Proposed Tenochca Community Space: The proposed Tenochca Community Space (TCS) would be two-stories in height and approximately 13,000 gsf in size, with approximately 9,000 square feet (sf) allocated to the first floor and 4,000 sf allocated to the second floor. The proposed TCS would be constructed on the site of the
Transcript of San Diego State University 5500 Campanile Drive Subject ... · Proposed Tula Pavilion: The proposed...

N:\2682\Report\Letter Report.2682_Revised_Clean.doc
December 19, 2016 Ms. Laura Shinn San Diego State University 5500 Campanile Drive San Diego, CA 92182
LLG Reference: 3-16-2682 Subject: San Diego State University Tula / Tenochca Project –
Transportation Impact Analysis
Linscott, Law & Greenspan, Engineers (LLG) has prepared this technical memorandum to document an analysis of potential traffic-related impacts associated with the proposed San Diego State University Tula/Tenochca project. Included in this analysis are the following:
Project Description Study Area Description/Existing Conditions Trip Generation/Route Assumption/Distribution Summary Analysis Methodology and Results Conclusion
PROJECT DESCRIPTION SDSU proposes to demolish the existing two-story Tula/Tenochca Community Center (approximately 20,000 gross square feet (gsf) in size) and construct in its place the Tenochca Community Space and the nearby Tula Pavilion. The total gsf to be demolished is approximately 20,000 gsf, and the total gsf to be constructed is approximately 25,000 gsf of interior space. Because the new buildings would replace an existing building and its associated uses, upon completion the project would not generate new or additional students, staff, or visitors to the SDSU campus and, therefore, would not generate any additional vehicle trips beyond the existing condition. Demolition of the existing building would result in generating approximately 4,000 cubic yards (cy) of debris. Each of the project components are separately described below. Proposed Tenochca Community Space: The proposed Tenochca Community Space (TCS) would be two-stories in height and approximately 13,000 gsf in size, with approximately 9,000 square feet (sf) allocated to the first floor and 4,000 sf allocated to the second floor. The proposed TCS would be constructed on the site of the

Ms. Laura Shinn December 19, 2016 Page 2
demolished Tula/Tenochca Community Center, which is located on the corner of Montezuma Road and East Campus Drive, in the south-southeast portion of the main campus, in the area west of Parking Structures 3 and 4. Construction of the proposed Tenochca Community Space would require approximately 8,700 sf of concrete and approximately 850 cy of structural fill. Proposed Tula Pavilion: The proposed Tula Pavilion would be a one-story building approximately 12,000 gsf in size constructed to the northwest of the TCS on the site of a paved walking path at the north end of a service vehicle parking lot. Construction would require approximately 10,000 sf of concrete and approximately 2,000 cy of backfill. Proposed Schedule: The anticipated start date for demolition of the existing Tula/Tenochca Community Center and construction of the proposed Tenochca Community Space and Tula Pavilion is June 2017, with an anticipated duration for construction of 15 months. Because the new TCS and Tula Pavilion would be used by SDSU staff, students, and others already on campus for classes or other events, operation of the proposed project would not generate any additional vehicle trips, and would not require, or include, parking facilities. However, construction of the proposed project would generate construction-related vehicle trips since approximately 4,000 cy of debris will be hauled from the site. As a result, this memorandum analyzes the potential traffic impacts from these truck trips. Based on the project description outlined above, the demolition phase of the project would be the most intensive traffic generating portion of the project. Thus, the analysis in this memorandum focuses on the demolition phase.
STUDY AREA DESCRIPTION/EXISTING CONDITIONS As previously explained, because operation of the proposed project would not generate new vehicle trips, there would be no traffic-related operational impacts. However, construction of the proposed project would generate vehicle trips and, therefore, the construction phase of the project is the focus of this analysis. The study area for the analysis was determined based on the traffic routes expected to be utilized by construction-related vehicles. Heavy vehicles hauling debris from the site would principally utilize Montezuma Road to Fairmount Avenue to access Interstate 8 (I-8). This route is generally a less-congested route than College Avenue to I-8, and also better accommodates truck traffic. Construction workers commuting to the worksite, as well as other miscellaneous trips in passenger cars and light trucks, would also utilize these roadways, as well as College Avenue. Figure 1 shows the Project Location and Study Area.

Ms. Laura Shinn December 19, 2016 Page 3
The following is a description of the study area Circulation Element Roadways: Interstate 8 is an interstate freeway operated by CALTRANS. I-8 is an east-west facility spanning San Diego and Imperial Counties. This facility provides access to the Fairmount Avenue, Waring Road, College Avenue and Lake Murray / 70th Street interchanges within the project vicinity. Montezuma Road is classified as a Major Arterial according to the College Area Community Plan. It is a four-lane, divided roadway located south of the SDSU Main campus. The posted speed limit ranges between 40-50 mph, bus stops are provided, and curbside parking is permitted along the roadway. College Avenue is classified as a Major Arterial according to the College Area Community Plan. It is a four-lane intermittently divided roadway within the project vicinity. The speed limit is generally 35 mph, parking is prohibited and intermittent bus stops are provided. Collwood Boulevard is classified as a Major Arterial according to the College Area Community Plan. It is a three lane undivided roadway located south of Montezuma Road with two northbound lanes and one southbound lane. Parking is permitted and bike lanes are provided at frequent locations. The posted speed limit is 35 mph. Figure 2 depicts the existing study area road configuration. LLG recently conducted counts in the SDSU area while SDSU and other local schools were in session. These counts were used as the basis of this analysis and were deemed adequate since no new development had occurred within the area in the past year and therefore reflect current conditions. Appendix A contains the intersection and segment counts sheets. Figure 3 shows the Existing Traffic Volumes. TRIP GENERATION Construction of the proposed project would occur in several different phases with the demolition phase generating the most traffic based on the project description outlined above. This determination was based on several factors including utilization of heavy vehicles, duration of demolition and intensity of construction traffic (trucks and employee’s) during this time period. A more detailed description is provided below. The total amount of debris (e.g., asphalt) to be removed from the site during demolition is calculated to be approximately 3,361 cy. Based on information provided by campus staff, the demolition phase would take place over an approximate 1 month period (i.e., approximately 20 work days, excluding weekends) and require 20 on-site workers. Based on a capacity of approximately 10 cy of debris per truck, a total of approximately

Ms. Laura Shinn December 19, 2016 Page 4
337 truckloads would be required to haul the asphalt waste from the site. This averages out to approximately 17 truckloads per day (i.e., 337 truckloads/20 work days). Truck Trips As noted, the demolition phase would take place over an approximate 1 month (20 working days) period. Given that the construction of the proposed project would require the removal of a total of 3,361 cy of debris and assuming approximately 10 cy per truck, each work day would require 17 truck loads. A Passenger Car Equivalence (PCE) factor of 3.0 was applied to these trips to account for the diminished performance characteristics of trucks in traffic flow (as compared to passenger vehicles) based on data contained in the Highway Capacity Manual (HCM). Therefore, it is calculated that the trucks would generate 102 average daily trips (ADT) [17 truckloads x 2 x 3.0 PCE = 102 ADT]. As previously explained, it is expected that the trucks would utilize Montezuma Road to access the I-8/Fairmount Avenue interchange. Based on typical practice, it is expected that the construction truck trips would be evenly distributed throughout the day. Figure 4 shows the Truck Traffic Distribution and Figure 6 shows the Truck Traffic Volumes based on this distribution. Construction Worker and Vendor Trips In addition to the haul truck trips, traffic to/from the site during the demolition phase would be generated by construction workers using passenger vehicles and light trucks commuting to the work site. A total of 20 employees and 2 miscellaneous/vendors are expected to access the project site on a typical day. To estimate the employee trips, LLG conservatively assumed 100% of the employees would enter the work area during the AM peak hour and 100% would leave the work area during the PM peak hour. For the purpose of the traffic analysis, employees and vendor trips were combined together, for a total trip generation of 44 ADT [22 employees/vendors x 2 trips]. Because it is the most direct route, it is expected that the non-truck trips (workers and vendors) would utilize Montezuma Road and College Avenue to and from the I-8 corridor, and College Avenue. Montezuma Road also provides access to El Cajon Boulevard east of the project site. Figure 5 shows the Employee/ Vendor Traffic Distribution and Figure 7 shows the Employee/ Vendor Traffic Volumes based on this distribution. Table 1 summarizes the Proposed Project trip generation based on the discussion above.

Ms. Laura Shinn December 19, 2016 Page 5
TABLE 1 PROPOSED PROJECT TRIP GENERATION
Number and Type of Trips
Daily Trips AM Peak Hour
(w/PCE) PM Peak Hour
(w/PCE)
ADT PCE PCE
Adjusted ADTIn Out Total In Out Total
17 Truck Tripsa 34 3.0b 102 6 6 12 6 6 12
20 Employeesc 40 1.0 40 20 0 20 0 20 20
2 Misc Tripsc 4 1.0 4 1 0 1 0 1 1
Total Construction Trips Analyzed: 146 27 6 33 6 27 33
Footnotes: a. The AM/PM peak hour trips are assumed to be the ADT divided by an 8-hour work day (average distribution) with AM splits as
50:50 (In:Out) and PM splits as 50:50 (In:Out). b. Passenger-Car Equivalent of 3.0 represents tractor-trailers on “rolling” terrain. c. Miscellaneous trips represent vendor trips and or deliveries assumed to occur during peak periods.

Ms. Laura Shinn December 19, 2016 Page 6
ANALYSIS METHODOLOGY & SIGNIFICANCE CRITERIA The following scenarios are addressed in this analysis. The addition of cumulative projects is not necessary since construction would occur in the near-term over a relatively short 15-month timeframe, with the demolition phase lasting approximately one month.
Existing Existing + Project (Construction Traffic Trips)
Level of service (LOS) is the term used to denote the different operating conditions which occur on a given roadway segment under various traffic volume loads. It is a qualitative measure used to describe a quantitative analysis taking into account factors such as roadway geometries, signal phasing, speed, travel delay, freedom to maneuver, and safety. Level of service provides an index to the operational qualities of an intersection. Level of service designations range from A to F, with LOS A representing the best operating conditions and LOS F representing the worst operating conditions. Level of service designation is reported differently for signalized and unsignalized intersections. In this analysis, signalized intersections were analyzed under AM and PM peak hour conditions. Average vehicle delay was determined utilizing the methodology found in Chapter 18 of the 2010 Highway Capacity Manual (HCM), with the assistance of the Synchro (version 9) computer software. The delay values (represented in seconds) were qualified with a corresponding intersection LOS. Signalized intersection calculation worksheets are attached in Appendix B. Street segments were analyzed based on a comparison of ADT volumes to the City of San Diego’s published Roadway Classification, Level of Service, and ADT Table. This table provides segment capacities for different street classifications, based on traffic volumes and roadway characteristics. Although California State University/SDSU is a state agency and, therefore, not subject to local regulation, for the limited purpose of this analysis, the City of San Diego’s Significance Determination Thresholds document, dated July 2016, was used as guidance to measure the Proposed Project’s potential impacts within the study area. Under these thresholds, LOS D is considered an acceptable LOS; a resulting LOS of E or F would signal a significant impact if the vehicle capacity (V/C) ratio or intersection delay exceeds the specified amount. Table 2 defines the thresholds for study area intersections and street segments.

Ms. Laura Shinn December 19, 2016 Page 7
TABLE 2 CITY OF SAN DIEGO
TRAFFIC IMPACT SIGNIFICANT THRESHOLDS
Level of Service with Project b
Allowable Increase Due to Project Impacts a
Roadway Segments Intersections
V/C Delay (sec.)
E 0.02 2.0
F 0.01 1.0
Footnotes:
a. If a proposed project’s traffic causes the values shown in the table to be exceeded, the impacts are determined to be significant. The project applicant shall then identify feasible improvements (within the Traffic Impact Study) that will restore/and maintain the traffic facility at an acceptable LOS. If the LOS with the proposed project becomes unacceptable (see note b), or if the project adds a significant amount of peak-hour trips to cause any traffic queues to exceed on- or off-ramp storage capacities, the project applicant shall be responsible for mitigating the project’s direct significant and/or cumulatively considerable traffic impacts.
b. All LOS measurements are based upon Highway Capacity Manual procedures for peak-hour conditions. However, V/C ratios for roadway segments are estimated on an ADT/24-hour traffic volume basis (using Table 2 of the City’s Traffic Impact Study Manual). The acceptable LOS for freeways, roadways, and intersections is generally “D” (“C” for undeveloped locations). For metered freeway ramps, LOS does not apply. However, ramp meter delays above 15 minutes are considered excessive.
If the addition of project construction-related traffic exceeds the thresholds in Table 2, then the project may be considered to have a temporary significant impact. A significant impact can also occur if project traffic causes the LOS to degrade from D to E, even if the allowable increases in Table 2 are not exceeded. If the addition of project-related traffic were to cause the Table 2 thresholds to be exceeded, feasible mitigation would need to be identified to return the impact within the City thresholds, or the impact would be considered significant and unmitigated.

Ms. Laura Shinn December 19, 2016 Page 8
ANALYSIS RESULTS As shown in the tables provided below, under the Existing and Existing plus Project scenarios, each of the study area intersections are calculated to operate at acceptable LOS D or better operations. As to segment operations, the study area street segments are calculated to operate at acceptable LOS C, with the exception of the following:
Montezuma Road: Fairmount Avenue to Collwood Boulevard (LOS F)
This street segment presently operates at LOS F and would continue to operate at LOS F with the addition of the Proposed Project construction traffic. However, the project V/C contribution on this street segment would not exceed the allowable 0.01 increase (as shown in Table 2); therefore, the proposed project would not cause or result in significant impacts at this study area street segment. It should also be noted that these same project trips would add a nominal amount of temporary vehicle trips to I-8. These trips would be less than the day-to-day fluctuation of traffic on I-8 and therefore would not adversely affect operations. Table 3 and Table 4 show the intersection and street segment analysis results, respectively. Figure 8 shows the Total Project Traffic Volumes. Figure 9 shows the Existing + Project Traffic Volumes. Appendix B contains copies of the Synchro LOS worksheets.

Ms. Laura Shinn December 19, 2016 Page 9
SIGNALIZED
DELAY/LOS THRESHOLDS
Delay LOS
0.0 ≤ 10.0 A
10.1 to 20.0 B
20.1 to 35.0 C
35.1 to 55.0 D
55.1 to 80.0 E
≥ 80.1 F
TABLE 3
EXISTING + PROJECT INTERSECTION OPERATIONS
Intersection Traffic Control
Peak Hour
Existing Existing + Project ∆ c
Impact Type Delay a LOS b Delay LOS
1. Montezuma Rd / Collwood Blvd
Signal AM 23.0 C 23.3 C 0.3 None
PM 26.8 C 27.1 C 0.3 None
2. Montezuma Rd / 55th St
Signal AM 32.8 C 33.5 C 0.7 None
PM 35.5 D 35.6 D 0.1 None
3. Montezuma Rd / College Ave
Signal AM 50.5 D 51.5 D 1.0 None
PM 54.5 D 54.8 D 0.3 None
Footnotes: a. Average delay expressed in seconds per vehicle. b. Level of Service. c. Δ denotes an increase in delay due to project.
General Notes: 1. Existing volumes reflect SDSU classes in session

Ms. Laura Shinn December 19, 2016 Page 10
N:\2682\Report\Letter Report.2682_Revised_Clean.doc
TABLE 4 EXISTING + PROJECT STREET SEGMENT OPERATIONS
Segment LOS E
Capacitya
Existing Existing + Project Impact Type Volume LOSb V/Cc Volume LOS V/C ∆d
Montezuma Road
Fairmount Ave to Collwood Blvd 40,000 52,330 F 1.308 52,456 F 1.311 0.003 None
Collwood Blvd to 55th St 40,000 28,950 C 0.724 29,078 C 0.727 0.003 None
55th St to College Ave 40,000 32,570 C 0.814 32,698 C 0.817 0.003 None
Footnotes: a. Capacities based on City of San Diego’s Roadway Classification & LOS table. b. Level of Service c. Volume to Capacity ratio
d. Δ denotes a project-induced increase in the Volume to Capacity ratio
General Notes: 1. Existing volumes reflect SDSU classes in session

Ms. Laura Shinn December 19, 2016 Page 11
CONCLUSION At peak construction activity levels, construction of the proposed project is expected to generate 102 truck, 40 worker, and 4 vendor trips per day for an approximately one month period. The number of ADT produced by the haul truck operations (34 daily truckloads) was tripled using a PCE adjustment factor of 3.0 to account for the additional impacts trucks impose upon the roadway system as compared to passenger cars with respect to acceleration, deceleration and handling characteristics. With the inclusion of PCE adjusted truck trips per day and the expected amount of employee and vendor trips, construction of the proposed project is expected to generate 146 short-term (i.e., temporary), construction-related ADT with 33 trips occurring during the AM peak hour and 33 trips during the PM peak hour. Based on City of San Diego criteria, the Proposed Project would not cause or result in significant impacts at any of the study area intersections or segments. Mitigation measures would not be necessary. Sincerely,
Linscott, Law & Greenspan, Engineers
John Boarman, P.E. Amelia Giacalone Principal Transportation Planner III cc: File Attachments: Figure 1: Project Location Figure 2: Existing Conditions Diagram Figure 3: Existing Traffic Volumes Figure 4: Truck Traffic Distribution Figure 5: Employee/ Vendor Traffic Distribution Figure 6: Truck Traffic Volumes Figure 7: Employee/ Vendor Traffic Volumes Figure 8: Total Project Traffic Volumes Figure 9: Existing + Project Traffic Volumes Appendix A: Existing Traffic Counts Appendix B: Synchro Analysis Sheets

Montezuma Rd55
thSt
Collwood Bl
Montezuma Rd
S a n D i e g o
S t a t e U n i v e r s i t y
Project Site
[_
§̈8
!(1!(2 !(3
Coll ege
Ave
E.Ca
mpus
Dr
SDSU Tula / Tenochca Facility
Project Location
N:\2682\FiguresDate: 11/08/16 Figure 1
1
2 3

Montezuma Rd55
thSt
Collwood Bl
Montezuma Rd
S a n D i e g o
S t a t e U n i v e r s i t y
Project Site
[_
§̈8
!(1!(2 !(3
Coll ege
Ave
E.Ca
mpus
Dr
!(
!(
!(
Montezuma Rd
Montezuma Rd
Montezuma Rd55
th St
Collw
ood B
lCo
llege
Ave
3
2
1
SDSU Tula / Tenochca Facility
Existing Conditions Diagram
N:\2682\FiguresDate: 11/08/16 Figure 2
4D 40
4D 35
4D
4U
4U 35
4D35
4U25
2U2U
Intersection Control
Posted Speed LimitXXTwo-Way Left Turn Lane
D / U Divided / Undivided Roadway# Number of Travel Lanes
Turn Lane Configurations
Study Intersections
Bike Lanes

Montezuma Rd55
th S
t
Collwood Bl
Montezuma Rd
S a n D i e g o
S t a t e U n i v e r s i t y
Project Site
[_
§̈8
Existing Traffic VolumesSDSU Tula / Tenochca Facility
N:\2682\FiguresDate: 11/08/16
Figure 3
[
!(1!(2 !(3
Coll
ege A
ve
E. C
amp u
s D
r
!(
!(
!(
4 / 24
1 / 2
3
19 /
11
13 / 74 45 /
49
51 /
4754
/ 60
64 / 11990
/ 19
1
21 / 176
75 /
257
83 / 436289 / 905
286
/ 274
183 / 165
163 / 290
122
/ 406
292 / 184
330 / 808
431
/ 707
439 / 955
503 / 314
571
/ 315
682 / 381
829 / 551
885
/ 562
913
/ 559
911 / 1,818
1,060 / 1,349
19 /
11
Montezuma Rd
Montezuma Rd
Montezuma Rd55
th S
tC
ollw
ood
BlC
olle
ge A
ve
3
2
1
28,950
32,570
52,330
AM / PM IntersectionPeak Hour Volumes
AM / PM
Study Intersections!!#
Average DailyTraffic VolumesX,XXX

Montezuma Rd55
thSt
Collwood Bl
Montezuma Rd
S a n D i e g o
S t a t e U n i v e r s i t y
Project Site
[_
§̈8
!(1!(2 !(3
Coll ege
Ave
E.Ca
mpus
Dr
SDSU Tuna / Tenochca Facility
Truck Traffic Distribution
N:\2682\FiguresDate: 11/08/16 Figure 4
100%
100%
100% 100%
Local Traffic DistributionXX%

Montezuma Rd55
thSt
Collwood Bl
Montezuma Rd
S a n D i e g o
S t a t e U n i v e r s i t y
Project Site
[_
§̈8
!(1!(2 !(3
Coll ege
Ave
E.Ca
mpus
Dr
SDSU Tula / Tenochca Facility
Employee / Vendor Traffic Distribution
N:\2682\FiguresDate: 11/08/16 Figure 5
55%
60%
60% 95%
Local Traffic DistributionXX%
5%
5%
5%
30%

Montezuma Rd55
th S
t
Collwood Bl
Montezuma Rd
S a n D i e g o
S t a t e U n i v e r s i t y
Project Site
[_
§̈8
Truck Traffic VolumesSDSU Tula / Tenochca Facility
N:\2682\FiguresDate: 11/08/16
Figure 6
[
!(1!(2 !(3
Coll
ege A
ve
E. C
amp u
s D
r
!(
!(
!(
6 / 6
6 / 6
6 / 6
6 / 6
6 / 6
6 / 6
Montezuma Rd
Montezuma Rd
Montezuma Rd
55th
St
Col
lwoo
d Bl
Col
lege
Ave
3
2
1
102
102
102
AM / PM IntersectionPeak Hour Volumes
AM / PM
Study Intersections!!#
Average DailyTraffic VolumesX,XXX

Montezuma Rd55
th S
t
Collwood Bl
Montezuma Rd
S a n D i e g o
S t a t e U n i v e r s i t y
Project Site
[_
§̈8
Employee / Vendor Traffic VolumesSDSU Tula / Tenochca Facility
N:\2682\FiguresDate: 11/08/16
Figure 7
[
!(1!(2 !(3
Coll
ege A
ve
E. C
amp u
s D
r
!(
!(
!(
0 / 1
0 / 6
1 / 0
6 / 0
13 / 0
0 / 12
0 / 13
12 / 01
/ 0
13 / 0
0 / 1
0 / 13
Montezuma Rd
Montezuma Rd
Montezuma Rd55
th S
tC
ollw
ood
BlC
olle
ge A
ve
3
2
1
26
26
24
AM / PM IntersectionPeak Hour Volumes
AM / PM
Study Intersections!!#
Average DailyTraffic VolumesX,XXX
2
2
2
14

Montezuma Rd55
th S
t
Collwood Bl
Montezuma Rd
S a n D i e g o
S t a t e U n i v e r s i t y
Project Site
[_
§̈8
Total Project Traffic VolumesSDSU Tula / Tenochca Facility
N:\2682\FiguresDate: 11/08/16
Figure 8
[
!(1!(2 !(3
Coll
ege A
ve
E. C
amp u
s D
r
!(
!(
!(
0 / 1
0 / 6
1 / 0
6 / 0 6 / 19
18 / 6
19 / 6
6 / 18
1 / 0
6 / 19
0 / 1
19 / 6
Montezuma Rd
Montezuma Rd
Montezuma Rd55
th S
tC
ollw
ood
BlC
olle
ge A
ve
3
2
1
128
128
126
AM / PM IntersectionPeak Hour Volumes
AM / PM
Study Intersections!!#
Average DailyTraffic VolumesX,XXX

Montezuma Rd55
th S
t
Collwood Bl
Montezuma Rd
S a n D i e g o
S t a t e U n i v e r s i t y
Project Site
[_
§̈8
Existing + Project Traffic VolumesSDSU Tula / Tenochca Facility
N:\2682\FiguresDate: 11/08/16
Figure 9
[
!(1!(2 !(3
Coll
ege A
ve
E. C
amp u
s D
r
!(
!(
!(
4 / 24
1 / 2
3
19 /
11
13 / 74 45 /
49
52 /
4755
/ 60
96 /
191
21 / 177
64 / 12075
/ 25
7
83 / 436308 / 911
286
/ 274
183 / 171
163 / 290
122
/ 406
292 / 184
349 / 814
431
/ 707
439 / 955
503 / 314
571
/ 315
688 / 400
835 / 570
885
/ 562
913
/ 559
929 / 1,824
1,066 / 1,367
19 /
11
Montezuma Rd
Montezuma Rd
Montezuma Rd55
th S
tC
ollw
ood
BlC
olle
ge A
ve
3
2
1
29,078
32,698
52,456
AM / PM IntersectionPeak Hour Volumes
AM / PM
Study Intersections!!#
Average DailyTraffic VolumesX,XXX

LINSCOTT, LAW & GREENSPAN, engineers LLG Ref. 3-16-2682 SDSU Tula/Tenochca Project
N:\2682\Report\2682.Appendices.doc
APPENDIX A
EXISTING COUNT SHEETS

Turn Count SummaryAccurate Video Counts Inc
[email protected](619) 987-5136
@
/ / / /
/
2 / 9
0 / 01,039 / 1,323
63 / 117
/ /
0 / 0893 / 1,782430 / 936
0 / 10
/
/ / / /
Montezuma Rd
Montezuma Rd
Col
lwoo
d Bl
vd
Col
lwoo
d Bl
vd
Location:
Date of Count:
Analysts:
Weather:
AVC Proj No:
04
Time Period
7:45 AM - 8:45 AM
4:30 PM - 5:30 PM
0 1
54PHF
0.90
0.95
00
1 5
548
0 59
895 0 53
00 0
0
0 0
0 0
Montezuma Rd Collwood Blvd
Wednesday, February 12, 2014
LV/CD
Sunny
14-0162
www.accuratevideocounts.com P.O. Box 261425 San Diego CA 92196 2/25/2014

Turn Count SummaryAccurate Video Counts Inc
[email protected](619) 987-5136
@
/ / / /
/
1 / 2
292 / 184829 / 551
4 / 24
/ /
503 / 314330 / 808
13 / 74
0 / 4
/
/ / / /
11 40
612
2
23 257
1 75
Montezuma Road 55th Street
Tuesday, April 19, 2016
LV/CD
Sunny
16-0506
11
5 4
49 11 11
45 19 19
9520
5
PHF
0.86
0.97
Montezuma Road
Montezuma Road
55th
Stre
et
55th
Stre
et
Location:
Date of Count:
Analysts:
Weather:
AVC Proj No:
01
Time Period
7:15 AM - 8:15 AM
4:45 PM - 5:45 PM
10 34
www.accuratevideocounts.com P.O. Box 261425 San Diego CA 92196

Turn Count SummaryAccurate Video Counts Inc
[email protected](619) 987-5136
@
/ / / /
/
0 / 6
183 / 165682 / 381
21 / 176
/ /
163 / 290289 / 905
83 / 436
17 / 3
/
/ / / /
36 27
428
6
707
191
431 90
Montezuma Road College Avenue
Tuesday, April 19, 2016
LV/CD
Sunny
16-0506
43
13 16
315
562
47
571
885 51
6883PHF
0.89
0.97
Montezuma Road
Montezuma Road
Col
lege
Ave
nue
Col
lege
Ave
nue
Location:
Date of Count:
Analysts:
Weather:
AVC Proj No:
1916
Time Period
7:15 AM - 8:15 AM
4:45 PM - 5:45 PM
1 7
www.accuratevideocounts.com P.O. Box 261425 San Diego CA 92196

24 Hour Segment Count Accurate Video Counts Inc
(619) 987-5136
EB WB Total EB WB Total
12:00 AM - 1:00 AM 249 167 416 12:00 PM - 1:00 PM 1,397 1,439 2,836
1:00 AM - 2:00 AM 143 95 238 1:00 PM - 2:00 PM 1,448 1,499 2,947
2:00 AM - 3:00 AM 93 67 160 2:00 PM - 3:00 PM 1,621 1,725 3,346
3:00 AM - 4:00 AM 50 96 146 3:00 PM - 4:00 PM 2,232 1,862 4,094
4:00 AM - 5:00 AM 63 189 252 4:00 PM - 5:00 PM 2,465 1,589 4,054
5:00 AM - 6:00 AM 181 711 892 5:00 PM - 6:00 PM 2,537 1,595 4,132
6:00 AM - 7:00 AM 469 1,887 2,356 6:00 PM - 7:00 PM 2,078 1,521 3,599
7:00 AM - 8:00 AM 1,129 2,366 3,495 7:00 PM - 8:00 PM 1,395 1,158 2,553
8:00 AM - 9:00 AM 1,236 2,050 3,286 8:00 PM - 9:00 PM 1,196 901 2,097
9:00 AM - 10:00 AM 1,240 1,450 2,690 9:00 PM - 10:00 PM 1,056 788 1,844
10:00 AM - 11:00 AM 1,237 1,275 2,512 10:00 PM - 11:00 PM 718 489 1,207
11:00 AM - 12:00 PM 1,143 1,258 2401 11:00 PM - 12:00 AM 482 294 776
7,233 11,611 18,844 18,625 14,860 33,485
EB Volume 25,858 WB Volume 26,47124-Hour 24-Hour
Weather: Sunny
AVC Proj. No: 16-0506
24 Hour Segment Volume 52,329
Total
Time Hourly Volume
Total
Time Hourly Volume
Analysts: DASH
Orientation: East-West
Location:
Date of Count: Tuesday, April 19, 2016
g. Montezuma Road btw Fairmount Avenue to Collwood Boulevard
0
500
1,000
1,500
2,000
2,500
3,000
3,500
4,000
4,500
12:00 AM 2:00 AM 4:00 AM 6:00 AM 8:00 AM 10:00 AM 12:00 PM 2:00 PM 4:00 PM 6:00 PM 8:00 PM 10:00 PM
EB WB Total
7:00 - 9:00 4:00 - 6:00
www.accuratevideocounts.com P.O. Box 261425 San Diego CA 92196 5/17/2016

24 Hour Segment Count Accurate Video Counts Inc
(619) 987-5136
EB WB Total EB WB Total
12:00 AM - 1:00 AM 98 119 217 12:00 PM - 1:00 PM 799 930 1,729
1:00 AM - 2:00 AM 66 54 120 1:00 PM - 2:00 PM 833 854 1,687
2:00 AM - 3:00 AM 31 36 67 2:00 PM - 3:00 PM 798 1,081 1,879
3:00 AM - 4:00 AM 18 33 51 3:00 PM - 4:00 PM 1,130 1,184 2,314
4:00 AM - 5:00 AM 36 52 88 4:00 PM - 5:00 PM 1,260 997 2,257
5:00 AM - 6:00 AM 100 185 285 5:00 PM - 6:00 PM 1,285 1,059 2,344
6:00 AM - 7:00 AM 244 790 1,034 6:00 PM - 7:00 PM 1,015 1,044 2,059
7:00 AM - 8:00 AM 786 1,263 2,049 7:00 PM - 8:00 PM 639 740 1,379
8:00 AM - 9:00 AM 777 979 1,756 8:00 PM - 9:00 PM 536 611 1,147
9:00 AM - 10:00 AM 845 709 1,554 9:00 PM - 10:00 PM 488 588 1,076
10:00 AM - 11:00 AM 886 659 1,545 10:00 PM - 11:00 PM 303 330 633
11:00 AM - 12:00 PM 634 655 1289 11:00 PM - 12:00 AM 192 195 387
4,521 5,534 10,055 9,278 9,613 18,891
EB Volume 13,799 WB Volume 15,147
Time Hourly Volume
Analysts: DASH
Orientation: East-West
Location:
Date of Count: Tuesday, April 19, 2016
h. Montezuma Road btw Collwood Boulevard to 55th Street
24-Hour 24-Hour
Weather: Sunny
AVC Proj. No: 16-0506
24 Hour Segment Volume 28,946
Total
Time Hourly Volume
Total
0
500
1,000
1,500
2,000
2,500
12:00 AM 2:00 AM 4:00 AM 6:00 AM 8:00 AM 10:00 AM 12:00 PM 2:00 PM 4:00 PM 6:00 PM 8:00 PM 10:00 PM
EB WB Total
7:00 - 9:00 4:00 - 6:00
www.accuratevideocounts.com P.O. Box 261425 San Diego CA 92196 5/17/2016

24 Hour Segment Count Accurate Video Counts Inc
(619) 987-5136
EB WB Total EB WB Total
12:00 AM - 1:00 AM 204 168 372 12:00 PM - 1:00 PM 984 950 1,934
1:00 AM - 2:00 AM 101 88 189 1:00 PM - 2:00 PM 893 918 1,811
2:00 AM - 3:00 AM 43 50 93 2:00 PM - 3:00 PM 1,010 1,059 2,069
3:00 AM - 4:00 AM 41 43 84 3:00 PM - 4:00 PM 1,401 1,094 2,495
4:00 AM - 5:00 AM 35 72 107 4:00 PM - 5:00 PM 1,583 958 2,541
5:00 AM - 6:00 AM 49 202 251 5:00 PM - 6:00 PM 1,556 971 2,527
6:00 AM - 7:00 AM 182 843 1,025 6:00 PM - 7:00 PM 1,297 918 2,215
7:00 AM - 8:00 AM 476 1,609 2,085 7:00 PM - 8:00 PM 944 716 1,660
8:00 AM - 9:00 AM 580 1,247 1,827 8:00 PM - 9:00 PM 929 693 1,622
9:00 AM - 10:00 AM 674 911 1,585 9:00 PM - 10:00 PM 850 609 1,459
10:00 AM - 11:00 AM 758 797 1,555 10:00 PM - 11:00 PM 511 495 1,006
11:00 AM - 12:00 PM 739 704 1443 11:00 PM - 12:00 AM 337 278 615
3,882 6,734 10,616 12,295 9,659 21,954
EB Volume 16,177 WB Volume 16,393
Time Hourly Volume
Analysts: DASH
Orientation: East-West
Location:
Date of Count: Tuesday, April 19, 2016
i. Montezuma Road btw 55th Street to College Avenue
24-Hour 24-Hour
Weather: Sunny
AVC Proj. No: 16-0506
24 Hour Segment Volume 32,570
Total
Time Hourly Volume
Total
0
500
1,000
1,500
2,000
2,500
3,000
12:00 AM 2:00 AM 4:00 AM 6:00 AM 8:00 AM 10:00 AM 12:00 PM 2:00 PM 4:00 PM 6:00 PM 8:00 PM 10:00 PM
EB WB Total
7:00 - 9:00 4:00 - 6:00
www.accuratevideocounts.com P.O. Box 261425 San Diego CA 92196 5/17/2016

LINSCOTT, LAW & GREENSPAN, engineers LLG Ref. 3-16-2682 SDSU Tula/Tenochca Project
N:\2682\Report\2682.Appendices.doc
APPENDIX B
SYNCHRO ANALYSIS WORKSHEETS

HCM Signalized Intersection Capacity Analysis Ex AM1: Collwood Bl & Montezuma Rd 11/18/2016
SDSU Tula/Tenochca Project Synchro 9 ReportJN Page 1
Movement EBT EBR WBL WBT NBL NBRLane ConfigurationsTraffic Volume (vph) 911 439 64 1060 913 54Future Volume (vph) 911 439 64 1060 913 54Ideal Flow (vphpl) 1900 1900 1900 1900 1900 1900Total Lost time (s) 4.0 4.0 4.0 4.0 4.0 4.0Lane Util. Factor 0.95 1.00 1.00 0.95 0.97 1.00Frt 1.00 0.85 1.00 1.00 1.00 0.85Flt Protected 1.00 1.00 0.95 1.00 0.95 1.00Satd. Flow (prot) 3539 1583 1770 3539 3433 1583Flt Permitted 1.00 1.00 0.95 1.00 0.95 1.00Satd. Flow (perm) 3539 1583 1770 3539 3433 1583Peak-hour factor, PHF 0.92 0.92 0.92 0.92 0.92 0.92Adj. Flow (vph) 990 477 70 1152 992 59RTOR Reduction (vph) 0 70 0 0 0 32Lane Group Flow (vph) 990 407 70 1152 992 27Turn Type NA pt+ov Prot NA Prot PermProtected Phases 4 4 2 3 8 2Permitted Phases 2Actuated Green, G (s) 32.6 81.0 7.1 43.7 44.4 44.4Effective Green, g (s) 32.6 81.0 7.1 43.7 44.4 44.4Actuated g/C Ratio 0.34 0.84 0.07 0.45 0.46 0.46Clearance Time (s) 4.0 4.0 4.0 4.0 4.0Vehicle Extension (s) 3.0 3.0 3.0 3.0 3.0Lane Grp Cap (vph) 1200 1334 130 1609 1586 731v/s Ratio Prot c0.28 0.26 0.04 c0.33 c0.29v/s Ratio Perm 0.02v/c Ratio 0.82 0.31 0.54 0.72 0.63 0.04Uniform Delay, d1 29.1 1.6 42.9 21.2 19.6 14.2Progression Factor 1.00 1.00 1.00 1.00 1.00 1.00Incremental Delay, d2 4.7 0.1 4.2 1.5 1.9 0.1Delay (s) 33.9 1.7 47.2 22.7 21.4 14.2Level of Service C A D C C BApproach Delay (s) 23.4 24.1 21.0Approach LOS C C C
Intersection SummaryHCM 2000 Control Delay 23.0 HCM 2000 Level of Service CHCM 2000 Volume to Capacity ratio 0.72Actuated Cycle Length (s) 96.1 Sum of lost time (s) 12.0Intersection Capacity Utilization 64.8% ICU Level of Service CAnalysis Period (min) 15c Critical Lane Group

HCM Signalized Intersection Capacity Analysis Ex AM2: 55th St & Montezuma Rd 11/18/2016
SDSU Tula/Tenochca Project Synchro 9 ReportJN Page 2
Movement EBL EBT EBR WBL WBT WBR NBL NBT NBR SBL SBT SBRLane ConfigurationsTraffic Volume (vph) 503 330 13 4 829 292 45 19 19 75 1 122Future Volume (vph) 503 330 13 4 829 292 45 19 19 75 1 122Ideal Flow (vphpl) 1900 1900 1900 1900 1900 1900 1900 1900 1900 1900 1900 1900Total Lost time (s) 4.4 5.6 4.4 4.9 4.9 4.9 4.9 4.9 4.9Lane Util. Factor 0.97 0.95 1.00 0.95 1.00 1.00 0.95 0.95 1.00Frpb, ped/bikes 1.00 1.00 1.00 1.00 0.94 0.99 1.00 1.00 0.83Flpb, ped/bikes 1.00 1.00 0.95 1.00 1.00 1.00 1.00 1.00 1.00Frt 1.00 0.99 1.00 1.00 0.85 0.97 1.00 1.00 0.85Flt Protected 0.95 1.00 0.95 1.00 1.00 0.97 0.95 0.95 1.00Satd. Flow (prot) 3433 3504 1675 3539 1490 1731 1681 1687 1314Flt Permitted 0.95 1.00 0.95 1.00 1.00 0.97 0.95 0.95 1.00Satd. Flow (perm) 3433 3504 1675 3539 1490 1731 1681 1687 1314Peak-hour factor, PHF 0.92 0.92 0.92 0.92 0.92 0.92 0.92 0.92 0.92 0.92 0.92 0.92Adj. Flow (vph) 547 359 14 4 901 317 49 21 21 82 1 133RTOR Reduction (vph) 0 1 0 0 0 170 0 10 0 0 0 124Lane Group Flow (vph) 547 372 0 4 901 147 0 81 0 43 40 9Confl. Peds. (#/hr) 30 30 30 30 30 30 30 30Confl. Bikes (#/hr) 10 10 10 10Turn Type Prot NA Prot NA Perm Split NA Split NA PermProtected Phases 5 2 1 6 8 8 4 4Permitted Phases 6 4Actuated Green, G (s) 23.2 80.2 0.8 58.5 58.5 16.8 8.4 8.4 8.4Effective Green, g (s) 23.2 80.2 0.8 58.5 58.5 16.8 8.4 8.4 8.4Actuated g/C Ratio 0.18 0.64 0.01 0.46 0.46 0.13 0.07 0.07 0.07Clearance Time (s) 4.4 5.6 4.4 4.9 4.9 4.9 4.9 4.9 4.9Vehicle Extension (s) 2.0 4.9 2.0 4.1 4.1 2.0 3.1 3.1 3.1Lane Grp Cap (vph) 632 2230 10 1643 691 230 112 112 87v/s Ratio Prot c0.16 0.11 0.00 c0.25 c0.05 c0.03 0.02v/s Ratio Perm 0.10 0.01v/c Ratio 0.87 0.17 0.40 0.55 0.21 0.35 0.38 0.36 0.10Uniform Delay, d1 49.9 9.3 62.4 24.3 20.1 49.7 56.3 56.2 55.3Progression Factor 1.00 1.00 1.01 0.73 1.44 1.00 1.00 1.00 1.00Incremental Delay, d2 11.5 0.2 6.6 0.9 0.5 0.3 2.3 2.0 0.5Delay (s) 61.4 9.5 69.7 18.7 29.4 50.0 58.6 58.2 55.8Level of Service E A E B C D E E EApproach Delay (s) 40.3 21.6 50.0 56.8Approach LOS D C D E
Intersection SummaryHCM 2000 Control Delay 32.8 HCM 2000 Level of Service CHCM 2000 Volume to Capacity ratio 0.58Actuated Cycle Length (s) 126.0 Sum of lost time (s) 19.8Intersection Capacity Utilization 69.3% ICU Level of Service CAnalysis Period (min) 15c Critical Lane Group

HCM Signalized Intersection Capacity Analysis Ex AM3: College Ave & Montezuma Rd 11/18/2016
SDSU Tula/Tenochca Project Synchro 9 ReportJN Page 3
Movement EBL EBT EBR WBL WBT WBR NBL NBT NBR SBL SBT SBRLane ConfigurationsTraffic Volume (vph) 163 289 83 21 682 183 571 885 51 90 431 286Future Volume (vph) 163 289 83 21 682 183 571 885 51 90 431 286Ideal Flow (vphpl) 1900 1900 1900 1900 1900 1900 1900 1900 1900 1900 1900 1900Total Lost time (s) 4.4 4.9 4.9 4.4 4.9 4.9 4.4 5.1 4.4 5.1 5.1Lane Util. Factor 1.00 0.95 1.00 1.00 0.95 1.00 0.97 0.95 1.00 0.95 1.00Frpb, ped/bikes 1.00 1.00 0.95 1.00 1.00 0.94 1.00 1.00 1.00 1.00 0.94Flpb, ped/bikes 1.00 1.00 1.00 1.00 1.00 1.00 1.00 1.00 1.00 1.00 1.00Frt 1.00 1.00 0.85 1.00 1.00 0.85 1.00 0.99 1.00 1.00 0.85Flt Protected 0.95 1.00 1.00 0.95 1.00 1.00 0.95 1.00 0.95 1.00 1.00Satd. Flow (prot) 1770 3539 1499 1770 3539 1495 3433 3500 1770 3539 1482Flt Permitted 0.95 1.00 1.00 0.95 1.00 1.00 0.95 1.00 0.95 1.00 1.00Satd. Flow (perm) 1770 3539 1499 1770 3539 1495 3433 3500 1770 3539 1482Peak-hour factor, PHF 0.92 0.92 0.92 0.92 0.92 0.92 0.92 0.92 0.92 0.92 0.92 0.92Adj. Flow (vph) 177 314 90 23 741 199 621 962 55 98 468 311RTOR Reduction (vph) 0 0 53 0 0 121 0 3 0 0 0 164Lane Group Flow (vph) 177 314 37 23 741 78 621 1014 0 98 468 147Confl. Peds. (#/hr) 30 30 30 30 30 30 30 30Confl. Bikes (#/hr) 15 15 15 15Turn Type Prot NA Perm Prot NA Perm Prot NA Prot NA PermProtected Phases 7 4 3 8 5 2 1 6Permitted Phases 4 8 6Actuated Green, G (s) 15.2 51.3 51.3 3.6 39.7 39.7 29.0 42.1 10.2 23.3 23.3Effective Green, g (s) 15.2 51.3 51.3 3.6 39.7 39.7 29.0 42.1 10.2 23.3 23.3Actuated g/C Ratio 0.12 0.41 0.41 0.03 0.32 0.32 0.23 0.33 0.08 0.18 0.18Clearance Time (s) 4.4 4.9 4.9 4.4 4.9 4.9 4.4 5.1 4.4 5.1 5.1Vehicle Extension (s) 2.0 5.5 5.5 2.0 5.9 5.9 2.0 3.9 2.0 3.5 3.5Lane Grp Cap (vph) 213 1440 610 50 1115 471 790 1169 143 654 274v/s Ratio Prot c0.10 0.09 0.01 c0.21 c0.18 c0.29 0.06 0.13v/s Ratio Perm 0.02 0.05 0.10v/c Ratio 0.83 0.22 0.06 0.46 0.66 0.17 0.79 0.87 0.69 0.72 0.54Uniform Delay, d1 54.1 24.3 22.7 60.2 37.4 31.2 45.6 39.3 56.3 48.2 46.5Progression Factor 0.94 1.22 9.83 1.00 1.00 1.00 1.00 1.00 1.00 1.00 1.00Incremental Delay, d2 22.2 0.3 0.2 2.4 3.1 0.8 4.8 7.2 10.3 3.9 2.3Delay (s) 73.1 29.9 223.3 62.7 40.5 31.9 50.4 46.5 66.7 52.1 48.7Level of Service E C F E D C D D E D DApproach Delay (s) 73.0 39.3 48.0 52.5Approach LOS E D D D
Intersection SummaryHCM 2000 Control Delay 50.5 HCM 2000 Level of Service DHCM 2000 Volume to Capacity ratio 0.80Actuated Cycle Length (s) 126.0 Sum of lost time (s) 18.8Intersection Capacity Utilization 89.7% ICU Level of Service EAnalysis Period (min) 15c Critical Lane Group

HCM Signalized Intersection Capacity Analysis Ex PM1: Collwood Bl & Montezuma Rd 11/18/2016
SDSU Tula/Tenochca Project Synchro 9 ReportJN Page 1
Movement EBT EBR WBL WBT NBL NBRLane ConfigurationsTraffic Volume (vph) 1818 955 119 1349 559 60Future Volume (vph) 1818 955 119 1349 559 60Ideal Flow (vphpl) 1900 1900 1900 1900 1900 1900Total Lost time (s) 4.0 4.0 4.0 4.0 4.0 4.0Lane Util. Factor 0.95 1.00 1.00 0.95 0.97 1.00Frt 1.00 0.85 1.00 1.00 1.00 0.85Flt Protected 1.00 1.00 0.95 1.00 0.95 1.00Satd. Flow (prot) 3539 1583 1770 3539 3433 1583Flt Permitted 1.00 1.00 0.95 1.00 0.95 1.00Satd. Flow (perm) 3539 1583 1770 3539 3433 1583Peak-hour factor, PHF 0.92 0.92 0.92 0.92 0.92 0.92Adj. Flow (vph) 1976 1038 129 1466 608 65RTOR Reduction (vph) 0 51 0 0 0 51Lane Group Flow (vph) 1976 987 129 1466 608 14Turn Type NA pt+ov Prot NA Prot PermProtected Phases 4 4 2 3 8 2Permitted Phases 2Actuated Green, G (s) 55.0 80.0 10.8 69.8 21.0 21.0Effective Green, g (s) 55.0 80.0 10.8 69.8 21.0 21.0Actuated g/C Ratio 0.56 0.81 0.11 0.71 0.21 0.21Clearance Time (s) 4.0 4.0 4.0 4.0 4.0Vehicle Extension (s) 3.0 3.0 3.0 3.0 3.0Lane Grp Cap (vph) 1970 1281 193 2500 729 336v/s Ratio Prot c0.56 c0.62 0.07 c0.41 0.18v/s Ratio Perm 0.01v/c Ratio 1.00 0.77 0.67 0.59 0.83 0.04Uniform Delay, d1 21.9 4.8 42.3 7.3 37.2 30.9Progression Factor 1.00 1.00 1.00 1.00 1.00 1.00Incremental Delay, d2 21.0 2.9 8.5 0.4 10.8 0.2Delay (s) 42.9 7.7 50.7 7.6 48.1 31.1Level of Service D A D A D CApproach Delay (s) 30.8 11.1 46.4Approach LOS C B D
Intersection SummaryHCM 2000 Control Delay 26.8 HCM 2000 Level of Service CHCM 2000 Volume to Capacity ratio 0.93Actuated Cycle Length (s) 98.8 Sum of lost time (s) 12.0Intersection Capacity Utilization 82.8% ICU Level of Service EAnalysis Period (min) 15c Critical Lane Group

HCM Signalized Intersection Capacity Analysis Ex PM2: 55th St & Montezuma Rd 11/18/2016
SDSU Tula/Tenochca Project Synchro 9 ReportJN Page 2
Movement EBL EBT EBR WBL WBT WBR NBL NBT NBR SBL SBT SBRLane ConfigurationsTraffic Volume (vph) 314 808 74 24 551 184 49 11 11 257 23 406Future Volume (vph) 314 808 74 24 551 184 49 11 11 257 23 406Ideal Flow (vphpl) 1900 1900 1900 1900 1900 1900 1900 1900 1900 1900 1900 1900Total Lost time (s) 4.4 5.6 4.4 4.9 4.9 4.9 4.9 4.9 4.9Lane Util. Factor 0.97 0.95 1.00 0.95 1.00 1.00 0.95 0.95 1.00Frpb, ped/bikes 1.00 0.99 1.00 1.00 0.94 0.99 1.00 1.00 0.91Flpb, ped/bikes 1.00 1.00 1.00 1.00 1.00 1.00 1.00 1.00 1.00Frt 1.00 0.99 1.00 1.00 0.85 0.98 1.00 1.00 0.85Flt Protected 0.95 1.00 0.95 1.00 1.00 0.97 0.95 0.96 1.00Satd. Flow (prot) 3433 3459 1770 3539 1486 1744 1681 1698 1438Flt Permitted 0.95 1.00 0.95 1.00 1.00 0.97 0.95 0.96 1.00Satd. Flow (perm) 3433 3459 1770 3539 1486 1744 1681 1698 1438Peak-hour factor, PHF 0.92 0.92 0.92 0.92 0.92 0.92 0.92 0.92 0.92 0.92 0.92 0.92Adj. Flow (vph) 341 878 80 26 599 200 53 12 12 279 25 441RTOR Reduction (vph) 0 3 0 0 0 106 0 5 0 0 0 381Lane Group Flow (vph) 341 955 0 26 599 94 0 72 0 145 159 60Confl. Peds. (#/hr) 30 30 30 30 30 30 30 30Confl. Bikes (#/hr) 10 10 10 10Turn Type Prot NA Prot NA Perm Split NA Split NA PermProtected Phases 5 2 1 6 8 8 4 4Permitted Phases 6 4Actuated Green, G (s) 17.5 75.1 4.5 62.8 62.8 15.6 18.0 18.0 18.0Effective Green, g (s) 17.5 75.1 4.5 62.8 62.8 15.6 18.0 18.0 18.0Actuated g/C Ratio 0.13 0.56 0.03 0.47 0.47 0.12 0.14 0.14 0.14Clearance Time (s) 4.4 5.6 4.4 4.9 4.9 4.9 4.9 4.9 4.9Vehicle Extension (s) 2.0 4.9 2.0 4.1 4.1 2.0 3.1 3.1 3.1Lane Grp Cap (vph) 451 1953 59 1671 701 204 227 229 194v/s Ratio Prot c0.10 c0.28 0.01 0.17 c0.04 0.09 c0.09v/s Ratio Perm 0.06 0.04v/c Ratio 0.76 0.49 0.44 0.36 0.13 0.35 0.64 0.69 0.31Uniform Delay, d1 55.7 17.4 63.0 22.3 19.8 54.0 54.4 54.9 51.9Progression Factor 1.00 1.00 1.00 1.00 1.00 1.00 1.00 1.00 1.00Incremental Delay, d2 6.3 0.9 1.9 0.6 0.4 0.4 5.8 8.9 0.9Delay (s) 62.0 18.3 64.9 22.9 20.2 54.4 60.3 63.7 52.8Level of Service E B E C C D E E DApproach Delay (s) 29.8 23.6 54.4 56.6Approach LOS C C D E
Intersection SummaryHCM 2000 Control Delay 35.5 HCM 2000 Level of Service DHCM 2000 Volume to Capacity ratio 0.55Actuated Cycle Length (s) 133.0 Sum of lost time (s) 19.8Intersection Capacity Utilization 79.2% ICU Level of Service DAnalysis Period (min) 15c Critical Lane Group

HCM Signalized Intersection Capacity Analysis Ex PM3: College Ave & Montezuma Rd 11/18/2016
SDSU Tula/Tenochca Project Synchro 9 ReportJN Page 3
Movement EBL EBT EBR WBL WBT WBR NBL NBT NBR SBL SBT SBRLane ConfigurationsTraffic Volume (vph) 290 905 436 176 381 165 315 562 47 191 707 274Future Volume (vph) 290 905 436 176 381 165 315 562 47 191 707 274Ideal Flow (vphpl) 1900 1900 1900 1900 1900 1900 1900 1900 1900 1900 1900 1900Total Lost time (s) 4.4 4.9 4.9 4.4 4.9 4.9 4.4 5.1 4.4 5.1 5.1Lane Util. Factor 1.00 0.95 1.00 1.00 0.95 1.00 0.97 0.95 1.00 0.95 1.00Frpb, ped/bikes 1.00 1.00 0.94 1.00 1.00 0.94 1.00 1.00 1.00 1.00 0.94Flpb, ped/bikes 1.00 1.00 1.00 1.00 1.00 1.00 1.00 1.00 1.00 1.00 1.00Frt 1.00 1.00 0.85 1.00 1.00 0.85 1.00 0.99 1.00 1.00 0.85Flt Protected 0.95 1.00 1.00 0.95 1.00 1.00 0.95 1.00 0.95 1.00 1.00Satd. Flow (prot) 1770 3539 1491 1770 3539 1487 3433 3481 1770 3539 1483Flt Permitted 0.95 1.00 1.00 0.95 1.00 1.00 0.95 1.00 0.95 1.00 1.00Satd. Flow (perm) 1770 3539 1491 1770 3539 1487 3433 3481 1770 3539 1483Peak-hour factor, PHF 0.92 0.92 0.92 0.92 0.92 0.92 0.92 0.92 0.92 0.92 0.92 0.92Adj. Flow (vph) 315 984 474 191 414 179 342 611 51 208 768 298RTOR Reduction (vph) 0 0 183 0 0 86 0 5 0 0 0 129Lane Group Flow (vph) 315 984 291 191 414 93 342 657 0 208 768 169Confl. Peds. (#/hr) 30 30 30 30 30 30 30 30Confl. Bikes (#/hr) 15 15 15 15Turn Type Prot NA Perm Prot NA Perm Prot NA Prot NA PermProtected Phases 7 4 3 8 5 2 1 6Permitted Phases 4 8 6Actuated Green, G (s) 28.0 48.9 48.9 17.8 38.7 38.7 20.0 32.4 22.1 34.5 34.5Effective Green, g (s) 28.0 48.9 48.9 17.8 38.7 38.7 20.0 32.4 22.1 34.5 34.5Actuated g/C Ratio 0.20 0.35 0.35 0.13 0.28 0.28 0.14 0.23 0.16 0.25 0.25Clearance Time (s) 4.4 4.9 4.9 4.4 4.9 4.9 4.4 5.1 4.4 5.1 5.1Vehicle Extension (s) 2.0 5.5 5.5 2.0 5.9 5.9 2.0 3.9 2.0 3.5 3.5Lane Grp Cap (vph) 354 1236 520 225 978 411 490 805 279 872 365v/s Ratio Prot c0.18 c0.28 0.11 0.12 0.10 0.19 c0.12 c0.22v/s Ratio Perm 0.20 0.06 0.11v/c Ratio 0.89 0.80 0.56 0.85 0.42 0.23 0.70 0.82 0.75 0.88 0.46Uniform Delay, d1 54.5 41.1 36.8 59.8 41.5 39.1 57.1 51.0 56.3 50.8 44.9Progression Factor 1.00 1.00 1.00 1.00 1.00 1.00 1.00 1.00 1.00 1.00 1.00Incremental Delay, d2 22.2 5.4 4.3 23.7 1.3 1.3 3.5 6.7 9.1 10.5 1.1Delay (s) 76.7 46.4 41.2 83.5 42.8 40.4 60.6 57.7 65.4 61.3 46.0Level of Service E D D F D D E E E E DApproach Delay (s) 50.4 52.2 58.7 58.4Approach LOS D D E E
Intersection SummaryHCM 2000 Control Delay 54.5 HCM 2000 Level of Service DHCM 2000 Volume to Capacity ratio 0.86Actuated Cycle Length (s) 140.0 Sum of lost time (s) 18.8Intersection Capacity Utilization 93.5% ICU Level of Service FAnalysis Period (min) 15c Critical Lane Group

HCM Signalized Intersection Capacity Analysis Ex+Project AM1: Collwood Bl & Montezuma Rd 11/18/2016
SDSU Tula/Tenochca Project Synchro 9 ReportJN Page 1
Movement EBT EBR WBL WBT NBL NBRLane ConfigurationsTraffic Volume (vph) 929 439 64 1066 913 55Future Volume (vph) 929 439 64 1066 913 55Ideal Flow (vphpl) 1900 1900 1900 1900 1900 1900Total Lost time (s) 4.0 4.0 4.0 4.0 4.0 4.0Lane Util. Factor 0.95 1.00 1.00 0.95 0.97 1.00Frt 1.00 0.85 1.00 1.00 1.00 0.85Flt Protected 1.00 1.00 0.95 1.00 0.95 1.00Satd. Flow (prot) 3539 1583 1770 3539 3433 1583Flt Permitted 1.00 1.00 0.95 1.00 0.95 1.00Satd. Flow (perm) 3539 1583 1770 3539 3433 1583Peak-hour factor, PHF 0.92 0.92 0.92 0.92 0.92 0.92Adj. Flow (vph) 1010 477 70 1159 992 60RTOR Reduction (vph) 0 70 0 0 0 32Lane Group Flow (vph) 1010 407 70 1159 992 28Turn Type NA pt+ov Prot NA Prot PermProtected Phases 4 4 2 3 8 2Permitted Phases 2Actuated Green, G (s) 32.6 81.0 7.1 43.7 44.4 44.4Effective Green, g (s) 32.6 81.0 7.1 43.7 44.4 44.4Actuated g/C Ratio 0.34 0.84 0.07 0.45 0.46 0.46Clearance Time (s) 4.0 4.0 4.0 4.0 4.0Vehicle Extension (s) 3.0 3.0 3.0 3.0 3.0Lane Grp Cap (vph) 1200 1334 130 1609 1586 731v/s Ratio Prot c0.29 0.26 0.04 c0.33 c0.29v/s Ratio Perm 0.02v/c Ratio 0.84 0.31 0.54 0.72 0.63 0.04Uniform Delay, d1 29.4 1.6 42.9 21.2 19.6 14.2Progression Factor 1.00 1.00 1.00 1.00 1.00 1.00Incremental Delay, d2 5.5 0.1 4.2 1.6 1.9 0.1Delay (s) 34.9 1.7 47.2 22.9 21.4 14.3Level of Service C A D C C BApproach Delay (s) 24.2 24.2 21.0Approach LOS C C C
Intersection SummaryHCM 2000 Control Delay 23.3 HCM 2000 Level of Service CHCM 2000 Volume to Capacity ratio 0.73Actuated Cycle Length (s) 96.1 Sum of lost time (s) 12.0Intersection Capacity Utilization 65.3% ICU Level of Service CAnalysis Period (min) 15c Critical Lane Group

HCM Signalized Intersection Capacity Analysis Ex+Project AM2: 55th St & Montezuma Rd 11/18/2016
SDSU Tula/Tenochca Project Synchro 9 ReportJN Page 2
Movement EBL EBT EBR WBL WBT WBR NBL NBT NBR SBL SBT SBRLane ConfigurationsTraffic Volume (vph) 503 349 13 4 835 292 45 19 19 75 1 122Future Volume (vph) 503 349 13 4 835 292 45 19 19 75 1 122Ideal Flow (vphpl) 1900 1900 1900 1900 1900 1900 1900 1900 1900 1900 1900 1900Total Lost time (s) 4.4 5.6 4.4 4.9 4.9 4.9 4.9 4.9 4.9Lane Util. Factor 0.97 0.95 1.00 0.95 1.00 1.00 0.95 0.95 1.00Frpb, ped/bikes 1.00 1.00 1.00 1.00 0.94 0.99 1.00 1.00 0.83Flpb, ped/bikes 1.00 1.00 0.95 1.00 1.00 1.00 1.00 1.00 1.00Frt 1.00 0.99 1.00 1.00 0.85 0.97 1.00 1.00 0.85Flt Protected 0.95 1.00 0.95 1.00 1.00 0.97 0.95 0.95 1.00Satd. Flow (prot) 3433 3506 1678 3539 1490 1731 1681 1687 1314Flt Permitted 0.95 1.00 0.95 1.00 1.00 0.97 0.95 0.95 1.00Satd. Flow (perm) 3433 3506 1678 3539 1490 1731 1681 1687 1314Peak-hour factor, PHF 0.92 0.92 0.92 0.92 0.92 0.92 0.92 0.92 0.92 0.92 0.92 0.92Adj. Flow (vph) 547 379 14 4 908 317 49 21 21 82 1 133RTOR Reduction (vph) 0 1 0 0 0 168 0 10 0 0 0 124Lane Group Flow (vph) 547 392 0 4 908 149 0 81 0 43 40 9Confl. Peds. (#/hr) 30 30 30 30 30 30 30 30Confl. Bikes (#/hr) 10 10 10 10Turn Type Prot NA Prot NA Perm Split NA Split NA PermProtected Phases 5 2 1 6 8 8 4 4Permitted Phases 6 4Actuated Green, G (s) 22.6 80.5 0.5 59.1 59.1 16.8 8.4 8.4 8.4Effective Green, g (s) 22.6 80.5 0.5 59.1 59.1 16.8 8.4 8.4 8.4Actuated g/C Ratio 0.18 0.64 0.00 0.47 0.47 0.13 0.07 0.07 0.07Clearance Time (s) 4.4 5.6 4.4 4.9 4.9 4.9 4.9 4.9 4.9Vehicle Extension (s) 2.0 4.9 2.0 4.1 4.1 2.0 3.1 3.1 3.1Lane Grp Cap (vph) 615 2239 6 1659 698 230 112 112 87v/s Ratio Prot c0.16 0.11 0.00 c0.26 c0.05 c0.03 0.02v/s Ratio Perm 0.10 0.01v/c Ratio 0.89 0.17 0.67 0.55 0.21 0.35 0.38 0.36 0.10Uniform Delay, d1 50.5 9.2 62.7 23.9 19.7 49.7 56.3 56.2 55.3Progression Factor 1.00 1.00 1.04 0.75 1.45 1.00 1.00 1.00 1.00Incremental Delay, d2 14.3 0.2 95.7 0.9 0.5 0.3 2.3 2.0 0.5Delay (s) 64.8 9.4 160.7 18.9 29.1 50.0 58.6 58.2 55.8Level of Service E A F B C D E E EApproach Delay (s) 41.7 22.0 50.0 56.8Approach LOS D C D E
Intersection SummaryHCM 2000 Control Delay 33.5 HCM 2000 Level of Service CHCM 2000 Volume to Capacity ratio 0.58Actuated Cycle Length (s) 126.0 Sum of lost time (s) 19.8Intersection Capacity Utilization 69.5% ICU Level of Service CAnalysis Period (min) 15c Critical Lane Group
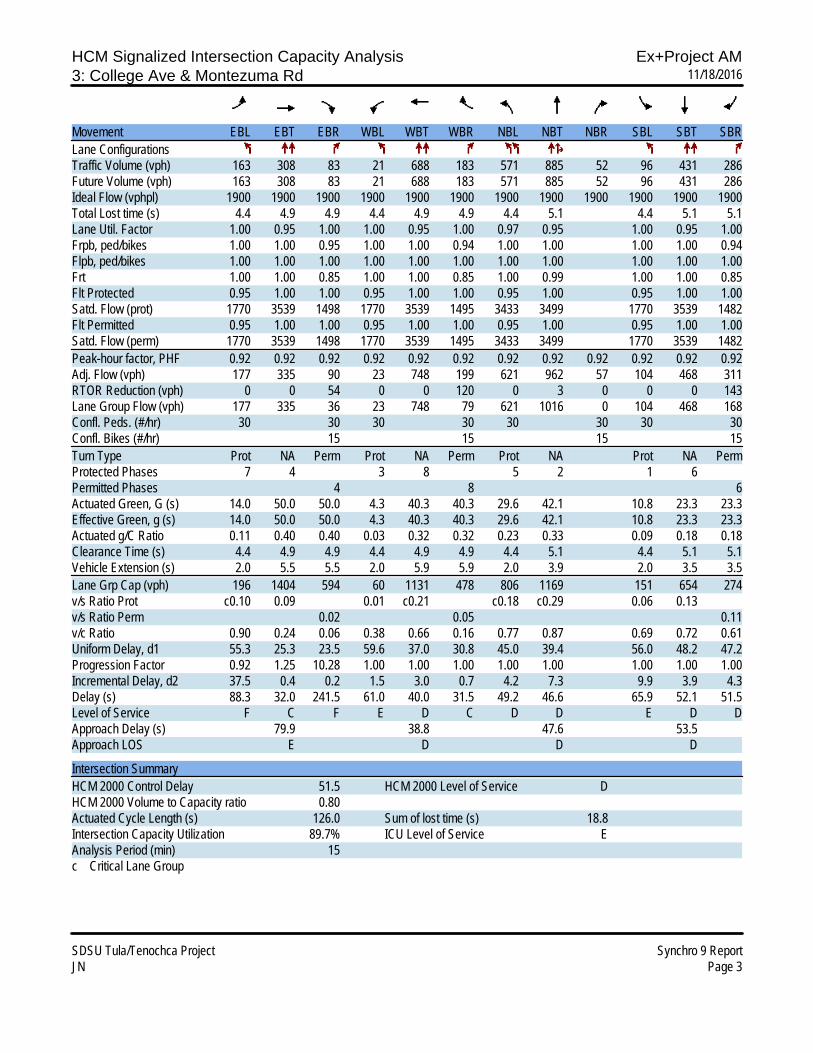
HCM Signalized Intersection Capacity Analysis Ex+Project AM3: College Ave & Montezuma Rd 11/18/2016
SDSU Tula/Tenochca Project Synchro 9 ReportJN Page 3
Movement EBL EBT EBR WBL WBT WBR NBL NBT NBR SBL SBT SBRLane ConfigurationsTraffic Volume (vph) 163 308 83 21 688 183 571 885 52 96 431 286Future Volume (vph) 163 308 83 21 688 183 571 885 52 96 431 286Ideal Flow (vphpl) 1900 1900 1900 1900 1900 1900 1900 1900 1900 1900 1900 1900Total Lost time (s) 4.4 4.9 4.9 4.4 4.9 4.9 4.4 5.1 4.4 5.1 5.1Lane Util. Factor 1.00 0.95 1.00 1.00 0.95 1.00 0.97 0.95 1.00 0.95 1.00Frpb, ped/bikes 1.00 1.00 0.95 1.00 1.00 0.94 1.00 1.00 1.00 1.00 0.94Flpb, ped/bikes 1.00 1.00 1.00 1.00 1.00 1.00 1.00 1.00 1.00 1.00 1.00Frt 1.00 1.00 0.85 1.00 1.00 0.85 1.00 0.99 1.00 1.00 0.85Flt Protected 0.95 1.00 1.00 0.95 1.00 1.00 0.95 1.00 0.95 1.00 1.00Satd. Flow (prot) 1770 3539 1498 1770 3539 1495 3433 3499 1770 3539 1482Flt Permitted 0.95 1.00 1.00 0.95 1.00 1.00 0.95 1.00 0.95 1.00 1.00Satd. Flow (perm) 1770 3539 1498 1770 3539 1495 3433 3499 1770 3539 1482Peak-hour factor, PHF 0.92 0.92 0.92 0.92 0.92 0.92 0.92 0.92 0.92 0.92 0.92 0.92Adj. Flow (vph) 177 335 90 23 748 199 621 962 57 104 468 311RTOR Reduction (vph) 0 0 54 0 0 120 0 3 0 0 0 143Lane Group Flow (vph) 177 335 36 23 748 79 621 1016 0 104 468 168Confl. Peds. (#/hr) 30 30 30 30 30 30 30 30Confl. Bikes (#/hr) 15 15 15 15Turn Type Prot NA Perm Prot NA Perm Prot NA Prot NA PermProtected Phases 7 4 3 8 5 2 1 6Permitted Phases 4 8 6Actuated Green, G (s) 14.0 50.0 50.0 4.3 40.3 40.3 29.6 42.1 10.8 23.3 23.3Effective Green, g (s) 14.0 50.0 50.0 4.3 40.3 40.3 29.6 42.1 10.8 23.3 23.3Actuated g/C Ratio 0.11 0.40 0.40 0.03 0.32 0.32 0.23 0.33 0.09 0.18 0.18Clearance Time (s) 4.4 4.9 4.9 4.4 4.9 4.9 4.4 5.1 4.4 5.1 5.1Vehicle Extension (s) 2.0 5.5 5.5 2.0 5.9 5.9 2.0 3.9 2.0 3.5 3.5Lane Grp Cap (vph) 196 1404 594 60 1131 478 806 1169 151 654 274v/s Ratio Prot c0.10 0.09 0.01 c0.21 c0.18 c0.29 0.06 0.13v/s Ratio Perm 0.02 0.05 0.11v/c Ratio 0.90 0.24 0.06 0.38 0.66 0.16 0.77 0.87 0.69 0.72 0.61Uniform Delay, d1 55.3 25.3 23.5 59.6 37.0 30.8 45.0 39.4 56.0 48.2 47.2Progression Factor 0.92 1.25 10.28 1.00 1.00 1.00 1.00 1.00 1.00 1.00 1.00Incremental Delay, d2 37.5 0.4 0.2 1.5 3.0 0.7 4.2 7.3 9.9 3.9 4.3Delay (s) 88.3 32.0 241.5 61.0 40.0 31.5 49.2 46.6 65.9 52.1 51.5Level of Service F C F E D C D D E D DApproach Delay (s) 79.9 38.8 47.6 53.5Approach LOS E D D D
Intersection SummaryHCM 2000 Control Delay 51.5 HCM 2000 Level of Service DHCM 2000 Volume to Capacity ratio 0.80Actuated Cycle Length (s) 126.0 Sum of lost time (s) 18.8Intersection Capacity Utilization 89.7% ICU Level of Service EAnalysis Period (min) 15c Critical Lane Group

HCM Signalized Intersection Capacity Analysis Ex+Project PM1: Collwood Bl & Montezuma Rd 11/18/2016
SDSU Tula/Tenochca Project Synchro 9 ReportJN Page 1
Movement EBT EBR WBL WBT NBL NBRLane ConfigurationsTraffic Volume (vph) 1824 955 120 1367 559 60Future Volume (vph) 1824 955 120 1367 559 60Ideal Flow (vphpl) 1900 1900 1900 1900 1900 1900Total Lost time (s) 4.0 4.0 4.0 4.0 4.0 4.0Lane Util. Factor 0.95 1.00 1.00 0.95 0.97 1.00Frt 1.00 0.85 1.00 1.00 1.00 0.85Flt Protected 1.00 1.00 0.95 1.00 0.95 1.00Satd. Flow (prot) 3539 1583 1770 3539 3433 1583Flt Permitted 1.00 1.00 0.95 1.00 0.95 1.00Satd. Flow (perm) 3539 1583 1770 3539 3433 1583Peak-hour factor, PHF 0.92 0.92 0.92 0.92 0.92 0.92Adj. Flow (vph) 1983 1038 130 1486 608 65RTOR Reduction (vph) 0 51 0 0 0 51Lane Group Flow (vph) 1983 987 130 1486 608 14Turn Type NA pt+ov Prot NA Prot PermProtected Phases 4 4 2 3 8 2Permitted Phases 2Actuated Green, G (s) 55.1 80.1 10.8 69.9 21.0 21.0Effective Green, g (s) 55.1 80.1 10.8 69.9 21.0 21.0Actuated g/C Ratio 0.56 0.81 0.11 0.71 0.21 0.21Clearance Time (s) 4.0 4.0 4.0 4.0 4.0Vehicle Extension (s) 3.0 3.0 3.0 3.0 3.0Lane Grp Cap (vph) 1971 1282 193 2501 728 336v/s Ratio Prot c0.56 c0.62 0.07 c0.42 0.18v/s Ratio Perm 0.01v/c Ratio 1.01 0.77 0.67 0.59 0.84 0.04Uniform Delay, d1 21.9 4.7 42.4 7.3 37.3 30.9Progression Factor 1.00 1.00 1.00 1.00 1.00 1.00Incremental Delay, d2 21.7 2.9 8.9 0.4 10.9 0.2Delay (s) 43.6 7.7 51.3 7.7 48.2 31.2Level of Service D A D A D CApproach Delay (s) 31.3 11.2 46.6Approach LOS C B D
Intersection SummaryHCM 2000 Control Delay 27.1 HCM 2000 Level of Service CHCM 2000 Volume to Capacity ratio 0.93Actuated Cycle Length (s) 98.9 Sum of lost time (s) 12.0Intersection Capacity Utilization 83.0% ICU Level of Service EAnalysis Period (min) 15c Critical Lane Group

HCM Signalized Intersection Capacity Analysis Ex+Project PM2: 55th St & Montezuma Rd 11/18/2016
SDSU Tula/Tenochca Project Synchro 9 ReportJN Page 2
Movement EBL EBT EBR WBL WBT WBR NBL NBT NBR SBL SBT SBRLane ConfigurationsTraffic Volume (vph) 314 814 74 24 570 184 49 11 11 257 23 406Future Volume (vph) 314 814 74 24 570 184 49 11 11 257 23 406Ideal Flow (vphpl) 1900 1900 1900 1900 1900 1900 1900 1900 1900 1900 1900 1900Total Lost time (s) 4.4 5.6 4.4 4.9 4.9 4.9 4.9 4.9 4.9Lane Util. Factor 0.97 0.95 1.00 0.95 1.00 1.00 0.95 0.95 1.00Frpb, ped/bikes 1.00 0.99 1.00 1.00 0.94 0.99 1.00 1.00 0.91Flpb, ped/bikes 1.00 1.00 1.00 1.00 1.00 1.00 1.00 1.00 1.00Frt 1.00 0.99 1.00 1.00 0.85 0.98 1.00 1.00 0.85Flt Protected 0.95 1.00 0.95 1.00 1.00 0.97 0.95 0.96 1.00Satd. Flow (prot) 3433 3459 1770 3539 1486 1744 1681 1698 1436Flt Permitted 0.95 1.00 0.95 1.00 1.00 0.97 0.95 0.96 1.00Satd. Flow (perm) 3433 3459 1770 3539 1486 1744 1681 1698 1436Peak-hour factor, PHF 0.92 0.92 0.92 0.92 0.92 0.92 0.92 0.92 0.92 0.92 0.92 0.92Adj. Flow (vph) 341 885 80 26 620 200 53 12 12 279 25 441RTOR Reduction (vph) 0 3 0 0 0 105 0 5 0 0 0 382Lane Group Flow (vph) 341 962 0 26 620 95 0 72 0 145 159 59Confl. Peds. (#/hr) 30 30 30 30 30 30 30 30Confl. Bikes (#/hr) 10 10 10 10Turn Type Prot NA Prot NA Perm Split NA Split NA PermProtected Phases 5 2 1 6 8 8 4 4Permitted Phases 6 4Actuated Green, G (s) 17.6 76.2 4.5 63.8 63.8 15.6 17.9 17.9 17.9Effective Green, g (s) 17.6 76.2 4.5 63.8 63.8 15.6 17.9 17.9 17.9Actuated g/C Ratio 0.13 0.57 0.03 0.48 0.48 0.12 0.13 0.13 0.13Clearance Time (s) 4.4 5.6 4.4 4.9 4.9 4.9 4.9 4.9 4.9Vehicle Extension (s) 2.0 4.9 2.0 4.1 4.1 2.0 3.1 3.1 3.1Lane Grp Cap (vph) 450 1966 59 1684 707 203 224 226 191v/s Ratio Prot c0.10 c0.28 0.01 0.18 c0.04 0.09 c0.09v/s Ratio Perm 0.06 0.04v/c Ratio 0.76 0.49 0.44 0.37 0.13 0.35 0.65 0.70 0.31Uniform Delay, d1 56.1 17.3 63.5 22.3 19.6 54.6 55.1 55.5 52.5Progression Factor 1.00 1.00 1.00 1.00 1.00 1.00 1.00 1.00 1.00Incremental Delay, d2 6.4 0.9 1.9 0.6 0.4 0.4 6.4 9.6 1.0Delay (s) 62.5 18.1 65.4 22.9 20.0 54.9 61.4 65.1 53.4Level of Service E B E C C D E E DApproach Delay (s) 29.7 23.5 54.9 57.5Approach LOS C C D E
Intersection SummaryHCM 2000 Control Delay 35.6 HCM 2000 Level of Service DHCM 2000 Volume to Capacity ratio 0.56Actuated Cycle Length (s) 134.0 Sum of lost time (s) 19.8Intersection Capacity Utilization 79.2% ICU Level of Service DAnalysis Period (min) 15c Critical Lane Group

HCM Signalized Intersection Capacity Analysis Ex+Project PM3: College Ave & Montezuma Rd 11/18/2016
SDSU Tula/Tenochca Project Synchro 9 ReportJN Page 3
Movement EBL EBT EBR WBL WBT WBR NBL NBT NBR SBL SBT SBRLane ConfigurationsTraffic Volume (vph) 290 911 436 177 400 171 315 562 47 191 707 274Future Volume (vph) 290 911 436 177 400 171 315 562 47 191 707 274Ideal Flow (vphpl) 1900 1900 1900 1900 1900 1900 1900 1900 1900 1900 1900 1900Total Lost time (s) 4.4 4.9 4.9 4.4 4.9 4.9 4.4 5.1 4.4 5.1 5.1Lane Util. Factor 1.00 0.95 1.00 1.00 0.95 1.00 0.97 0.95 1.00 0.95 1.00Frpb, ped/bikes 1.00 1.00 0.94 1.00 1.00 0.94 1.00 1.00 1.00 1.00 0.94Flpb, ped/bikes 1.00 1.00 1.00 1.00 1.00 1.00 1.00 1.00 1.00 1.00 1.00Frt 1.00 1.00 0.85 1.00 1.00 0.85 1.00 0.99 1.00 1.00 0.85Flt Protected 0.95 1.00 1.00 0.95 1.00 1.00 0.95 1.00 0.95 1.00 1.00Satd. Flow (prot) 1770 3539 1492 1770 3539 1489 3433 3481 1770 3539 1483Flt Permitted 0.95 1.00 1.00 0.95 1.00 1.00 0.95 1.00 0.95 1.00 1.00Satd. Flow (perm) 1770 3539 1492 1770 3539 1489 3433 3481 1770 3539 1483Peak-hour factor, PHF 0.92 0.92 0.92 0.92 0.92 0.92 0.92 0.92 0.92 0.92 0.92 0.92Adj. Flow (vph) 315 990 474 192 435 186 342 611 51 208 768 298RTOR Reduction (vph) 0 0 207 0 0 111 0 5 0 0 0 129Lane Group Flow (vph) 315 990 267 192 435 75 342 657 0 208 768 169Confl. Peds. (#/hr) 30 30 30 30 30 30 30 30Confl. Bikes (#/hr) 15 15 15 15Turn Type Prot NA Perm Prot NA Perm Prot NA Prot NA PermProtected Phases 7 4 3 8 5 2 1 6Permitted Phases 4 8 6Actuated Green, G (s) 28.0 52.1 52.1 17.9 42.0 42.0 16.7 30.3 20.9 34.5 34.5Effective Green, g (s) 28.0 52.1 52.1 17.9 42.0 42.0 16.7 30.3 20.9 34.5 34.5Actuated g/C Ratio 0.20 0.37 0.37 0.13 0.30 0.30 0.12 0.22 0.15 0.25 0.25Clearance Time (s) 4.4 4.9 4.9 4.4 4.9 4.9 4.4 5.1 4.4 5.1 5.1Vehicle Extension (s) 2.0 5.5 5.5 2.0 5.9 5.9 2.0 3.9 2.0 3.5 3.5Lane Grp Cap (vph) 354 1317 555 226 1061 446 409 753 264 872 365v/s Ratio Prot c0.18 c0.28 0.11 0.12 0.10 0.19 c0.12 c0.22v/s Ratio Perm 0.18 0.05 0.11v/c Ratio 0.89 0.75 0.48 0.85 0.41 0.17 0.84 0.87 0.79 0.88 0.46Uniform Delay, d1 54.5 38.3 33.6 59.7 39.1 36.1 60.3 53.0 57.4 50.8 44.9Progression Factor 1.00 1.00 1.00 1.00 1.00 1.00 1.00 1.00 1.00 1.00 1.00Incremental Delay, d2 22.2 4.0 3.0 23.7 1.2 0.8 13.2 11.2 13.3 10.5 1.1Delay (s) 76.7 42.3 36.6 83.4 40.3 36.9 73.5 64.2 70.7 61.3 46.0Level of Service E D D F D D E E E E DApproach Delay (s) 46.9 49.7 67.4 59.3Approach LOS D D E E
Intersection SummaryHCM 2000 Control Delay 54.8 HCM 2000 Level of Service DHCM 2000 Volume to Capacity ratio 0.86Actuated Cycle Length (s) 140.0 Sum of lost time (s) 18.8Intersection Capacity Utilization 93.5% ICU Level of Service FAnalysis Period (min) 15c Critical Lane Group