SAMPLING SOCIAL MOVEMENT ORGANIZATIONS · 2016-09-28 · Sampling Social Movement Organizations 233...
16
SAMPLING SOCIAL MOVEMENT ORGANIZATIONS * Kenneth T. Andrews, Bob Edwards, Akram Al-Turk, and Anne Kristen Hunter † Scholars of nonprofits, interest groups, civic associations, and social movement organizations employ samples of organizations derived from directories or other available listings. In most cases, we are unable to evaluate the representativeness of these samples. Using data on the population of environmental organizations in North Carolina, we assess the methodological strengths and weaknesses of widely used strategies. We find that reliance on any single source yields bias on theoretically important characteristics of organizations. We show that scholars can reduce bias significantly by combining sources, creating what we call a “peak list” com- piled from different types of sources. Compared to any single source, our peak list differed less from the population on the thirty-one organizational characteristics including geo- graphical coverage, issues, discursive frames, targets, and organizational demographics such as age, organizational form, and resources. From these analyses, we offer methodological recommendations for making better-informed decisions for constructing representative organ- izational samples. How well do samples of nonprofits, interest groups, civic associations, and social movement organizations represent the organizational populations from which they are drawn? This is a crucial methodological issue for scholars in political science, sociology, organizational and nonprofit studies. 1 In these fields, among others, studies based on the enumeration and sam- pling of organizations have provided central theoretical and empirical contributions (Andrews and Edwards 2004, Baumgartner and Leech 1998, Clemens and Minkoff 2004, Minkoff and McCarthy 2005). This paper compares common strategies for constructing sampling frames to examine populations of social movement organizations and assesses them for both sampling bias and cost-effectiveness. Studies that identify all organizations in a population are particularly valuable but quite rare. However, the most common practice among scholars of nonprofit organizations has been to identify a single source of organizational listings, and to justify that list as the best sam- pling frame available for the purposes of the study. For example, Minkoff’s (1995b) scholar- ship on women’s and racial and ethnic minority groups uses the Encyclopedia of Associations to examine rates of founding, survival, and strategic change over three decades (for other studies using this source, see Archibald 2007; Bail 2012; Johnson 2008; Meyer and Minkoff 2004; Minkoff 1999; Olzak and Ryo 2007; Walker, McCarthy and Baumgartner 2011). 2 Nonprofit scholars have a long tradition of using lists of organizations with 501(c)(3) tax status (Best 2012; Galaskiewicz and Bielefeld 1998; Leroux 2012; McVeigh, Welch and Bjarnason 2003) and there has been extensive debate about this data source in recent years (Boris and Mosher-Williams 1998; Gronbjerg 2002). Studies that attempt to compile national data over long time periods have tended to rely on single sources (Brulle, Turner, Carmichael, and Jenkins 2007, Carmichael, Jenkins and Brulle 2012, Gamson 1990). * This research was supported by grants from the Research/Creative Activity Grants Committee of the East Carolina University Faculty Senate, the American Sociological Association Fund for the Advancement of the Discipline (FAD), and the Milton Fund at Harvard University. We benefited from comments by Lyndi Hewitt. † Kenneth T. Andrews is a Professor of Sociology at the University of North Carolina, Chapel Hill. Bob Edwards is a Professor of Sociology at East Carolina University. Akram Al-Turk is a Ph.D. student in Sociology at the University of North Carolina, Chapel Hill. Anne Kristen Hunter is an Instructor at University of West Georgia. Direct correspond- dence to Kenneth T. Andrews, Department of Sociology, CB 3210, University of North Carolina, Chapel Hill 27599, [email protected] © 2016 Mobilization: An International Quarterly 21(2): 231-246 DOI 10.17813/1086-671X-21-2-231
Transcript of SAMPLING SOCIAL MOVEMENT ORGANIZATIONS · 2016-09-28 · Sampling Social Movement Organizations 233...

SAMPLING SOCIAL MOVEMENT ORGANIZATIONS*
Kenneth T. Andrews, Bob Edwards, Akram Al-Turk, and Anne Kristen Hunter†
Scholars of nonprofits, interest groups, civic associations, and social movement organizations employ samples of organizations derived from directories or other available listings. In most cases, we are unable to evaluate the representativeness of these samples. Using data on the population of environmental organizations in North Carolina, we assess the methodological strengths and weaknesses of widely used strategies. We find that reliance on any single source yields bias on theoretically important characteristics of organizations. We show that scholars can reduce bias significantly by combining sources, creating what we call a “peak list” com-piled from different types of sources. Compared to any single source, our peak list differed less from the population on the thirty-one organizational characteristics including geo-graphical coverage, issues, discursive frames, targets, and organizational demographics such as age, organizational form, and resources. From these analyses, we offer methodological recommendations for making better-informed decisions for constructing representative organ-izational samples.
How well do samples of nonprofits, interest groups, civic associations, and social movement organizations represent the organizational populations from which they are drawn? This is a crucial methodological issue for scholars in political science, sociology, organizational and nonprofit studies.1 In these fields, among others, studies based on the enumeration and sam-pling of organizations have provided central theoretical and empirical contributions (Andrews and Edwards 2004, Baumgartner and Leech 1998, Clemens and Minkoff 2004, Minkoff and McCarthy 2005). This paper compares common strategies for constructing sampling frames to examine populations of social movement organizations and assesses them for both sampling bias and cost-effectiveness.
Studies that identify all organizations in a population are particularly valuable but quite rare. However, the most common practice among scholars of nonprofit organizations has been to identify a single source of organizational listings, and to justify that list as the best sam-pling frame available for the purposes of the study. For example, Minkoff’s (1995b) scholar-ship on women’s and racial and ethnic minority groups uses the Encyclopedia of Associations to examine rates of founding, survival, and strategic change over three decades (for other studies using this source, see Archibald 2007; Bail 2012; Johnson 2008; Meyer and Minkoff 2004; Minkoff 1999; Olzak and Ryo 2007; Walker, McCarthy and Baumgartner 2011).2 Nonprofit scholars have a long tradition of using lists of organizations with 501(c)(3) tax status (Best 2012; Galaskiewicz and Bielefeld 1998; Leroux 2012; McVeigh, Welch and Bjarnason 2003) and there has been extensive debate about this data source in recent years (Boris and Mosher-Williams 1998; Gronbjerg 2002). Studies that attempt to compile national data over long time periods have tended to rely on single sources (Brulle, Turner, Carmichael, and Jenkins 2007, Carmichael, Jenkins and Brulle 2012, Gamson 1990).
* This research was supported by grants from the Research/Creative Activity Grants Committee of the East CarolinaUniversity Faculty Senate, the American Sociological Association Fund for the Advancement of the Discipline (FAD), and the Milton Fund at Harvard University. We benefited from comments by Lyndi Hewitt. † Kenneth T. Andrews is a Professor of Sociology at the University of North Carolina, Chapel Hill. Bob Edwards is a Professor of Sociology at East Carolina University. Akram Al-Turk is a Ph.D. student in Sociology at the University of North Carolina, Chapel Hill. Anne Kristen Hunter is an Instructor at University of West Georgia. Direct correspond-dence to Kenneth T. Andrews, Department of Sociology, CB 3210, University of North Carolina, Chapel Hill 27599, [email protected]
© 2016 Mobilization: An International Quarterly 21(2): 231-246 DOI 10.17813/1086-671X-21-2-231

Mobilization 232
Other studies rely on issue-specific sources. For example, Edwards and Marullo (1995) used a comprehensive directory internal to the peace movement to study the survival and mortality of local and national peace groups (Edwards 1994; Edwards and Foley 2003). In a similar approach, McCarthy and Wolfson (1996) used local chapter listings from national organizations opposed to drunken driving to examine how local organizations mobilize re-sources. Other recent examples include Kane’s (2007) and Negro, Perretti, and Carroll’s (2013) studies using The Gayellow Pages to estimate the number of gay and lesbian move-ment organizations in U.S. states and counties, McLaughlin and Khawaja’s (2000) use of the National Wildlife Federation’s Conservation Directory, and Kempton and his colleagues’ use of two local directories to compile a list of local environmental organizations on the Delmarva Peninsula and in North Carolina (2001).
Researchers focusing on smaller or geographically delimited populations have been more likely to employ multiple sources. Knoke and Wood’s (1981) study of voluntary associations in Indianapolis relied on an exhaustive search of phone books and the lists or directories of several government agencies and community organizations. Armstrong (2002) used a com-prehensive set of listings and directories to compile data on lesbian and gay organizations in San Francisco from 1950 to 1994. Some scholars supplement available lists and directories with informant interviews to identify lesser known organizations (Baldassarri and Diani 2007).
In recent years, potential sources and organizational listings have grown dramatically, and current practices vary widely with respect to the strategies used to identify and document units within a larger organizational population. Some of the new sources are being produced from within the organizational populations of interest, while others are produced by outsiders like government agencies, marketing firms, or other businesses specializing in the construction and sale of sampling frames. All studies tend to argue that they employ the best available sources. However, the notion of “availability” in such claims leaves room for two implicit issues pertinent to the research. First, a source may be substantially biased and still be the best one available (McCarthy and Walker 2004). Second, such claims contain an often-unstated concession to resource limitations.
We argue that scholars should identify available sources, specify the kinds of sources that are missing from their study, and develop strategies for combining the types of sources that are available to minimize bias. After showing the range of current practice, we introduce the contours of our study, which includes a comprehensive set of sources. We leverage this data to evaluate the limitations of conventional strategies, and we demonstrate the improvement that scholars can make by combining different types of sources.
BIAS IN ORGANIZATIONAL SAMPLING FRAMES
What are the relative strengths and weaknesses of current practices? Most often, scholars are unable to assess the coverage error or potential biases associated with different sampling frames, so we do not know. Some lists may overrepresent formal, professionalized, and older organizations. Similarly, lists may over-represent more moderate issues, strategic profiles, or ideologies, and thus fail to portray the diversity of a given social movement industry or non-profit sector (Edwards and Foley 2003). Other sources explicitly select on criteria such as nonprofit incorporation or tax status. Lists compiled by actors within a field of organizations may be shaped by organizational and leader networks, as well as preferred issues or goals, thus under-representing spatially, socially, or ideologically isolated organizations.
A handful of studies have examined these questions with mixed results. Aldrich, Kalleberg, and colleagues compared three kinds of sampling strategies for counting new businesses: a list produced by the state government, a list produced by the business com-munity, and direct enumeration of businesses by observers (Aldrich, Kalleberg, Marsden, and Cassell 1989; Kalleberg, Marsden, Aldrich, and Cassell 1990). They found that the business-produced list offered both the smallest number of businesses, and would be the most ex-

Sampling Social Movement Organizations 233
pensive to acquire. Yet, it offered high-quality data on the limited number of businesses listed. The state list improved on both these problems, but was more likely to exclude the newest businesses. Thus, a direct enumeration strategy leads to comprehensive coverage with little bias, but is particularly labor-intensive—probably prohibitively so when extended beyond a single city or other narrowly defined population.
More recently, Gronbjerg and Clerkin (2005) used a comprehensive national database of nonprofit organizations to evaluate how a variety of original sources and definitions of the nonprofit sector differ in their coverage, bias, and response rates. They found that more for-malized groups are more likely to appear on multiple listings and to respond to surveys. They also find evidence that different sampling sources contain different biases that yield samples with significantly different characteristics. Gronbjerg and Clerkin ultimately recommend using the Indiana Secretary of State’s listing of incorporated nonprofits as a sampling frame because of greater efficiency and minimal bias.
Martin, Baumgartner, and McCarthy (2006) examined the Encyclopedia of Associations (EA) listings of national labor unions for bias in terms of geographic location, membership size, and financial resources. They find that coverage of larger unions is nearly complete, with minimal geographic bias. The EA does under-represent groups with smaller membership and fewer financial resources. Martin et al.’s findings apply to national organizations in a stable organizational field. However, they may be less generalizable to state or local populations or ones that are experiencing substantial change.
Brulle and his colleagues have examined selectivity in listings for national environmental organizations, using data compiled from 155 sources (2007). They find that major sources over-represent organizations based in Washington DC. Founding effects vary by source, with some sources favoring older, and others favoring newer, organizations. Perhaps most impor-tantly, they find that the most conventional sources over-represent “mainstream” discursive orientations, such as conservationism, and under-represent alternative discourses like environ-mental justice. We extend this work by examining local environmentalism and investigating the viability of strategies that combine different types of sources to overcome known biases.
Although the findings across these studies are somewhat inconsistent, they point to several key ideas. First, most lists contain bias, meaning that samples drawn from those lists will systematically misrepresent the population on potentially important organizational char-acteristics. Second, lists are compiled for a wide range of purposes and seldom, if ever, specifically to facilitate systematic research. Thus, lists complied for different purposes likely contain different kinds of bias, as well as varying degrees and directions of bias. This means that studies drawing on different types of sources will result in samples that are not directly comparable because they are unrepresentative in differing and unspecified ways. However, some lists, or strategies of combing lists may be less biased than others. Thus, researchers may be able to overcome major sources of bias by drawing strategically on multiple lists.
Overall, the lack of consistent practices of inclusion and exclusion across lists undermines our ability to make systematic comparisons across studies in different locations or at different points in time. In the following section we describe the data we have collected. Then, we use this data to (1) assess the biases in major sources of organizational data and (2) evaluate optimal strategies that balance concerns regarding representativeness and the costs of constructing sampling frames.
DESCRIPTION OF DATA
We employ data from our study of North Carolina environmental organizations. Our initial goal was to identify all currently active environmental organizations in order to draw a random sample for in-depth leader interviews. Using twenty-seven sources—shown in table 1 and described in greater detail below—we identified 475 distinct nonstudent environmental organizations operating in North Carolina in 2002. In our broader analyses from this project,

Mobilization 234
we have focused on questions concerning organizational structure, social networks, tactics and strategy, and the differential media attention that these organizations received in the local press.
We define environmental organizations in terms of (1) location, (2) organizational form, (3) claims, (4) noncampus, (5) and non-state affiliation. All groups have a North Carolina mailing address. Multiple chapters of a national or state organization were counted as separate groups; for example, each Sierra Club affiliate was counted as a unique organization. All groups make public interest claims in contrast to private interest claims, such as those made by industry groups. We excluded student groups based on high school or college campuses on the assumption that these would be less stable over time and more focused on their institution rather than the broader community. This exclusion also applied to campus-based entities like environmental studies programs or environmental research centers. We exclude local, state and federal government agencies.
Table 1. Lists and Organizational Listings by List Type National Environmental Lists
Environmental Research Foundation 44 Land Trust Alliance 28 National Environmental Directory 60 National Wildlife Directory Conservation Directory 25 People of Color Environmental Groups Directory 20 Prairie List 75 Riverkeeper Alliance 2 River and Watershed Directory 52 National Nonprofit Lists Associations Unlimited 18 Guidestar Directory 178
State Environmental Lists Citizen’s Guide to North Carolina Environmental Information Sources 56 EPA Guide to Environmental Advocacy Groups of North Carolina 26 Guide to Environmental Education Centers in North Carolina 36 Guide to North Carolina Environmental Groups 182 Mountain Area Information Network 29
State Nonprofit Lists North Carolina Center for Nonprofits 88
State Movement Lists Blue Ridge Environmental Defense League 17 Conservation Council of North Carolina 23 Dogwood Alliance 9 Earth First Directory 19 Earth Share 29 Hog Roundtable 22 North Carolina Conservation Network 116 North Carolina Watershed Alliance 17 Smart Growth Alliance 35 Smart Growth Partners of Western North Carolina 20 Western North Carolina Conservation Groups and Organizations 49
Total Listings 1275 Total Organizations 475

Sampling Social Movement Organizations 235
We compiled our list over several years beginning in 1997 when one author began atten-ding environmental movement workshops, organizing summits, conferences, rallies and dem-onstrations. These materials include phone and e-mail lists of individual and organizational participants. We also collected directories produced within the North Carolina environmental movement as well as those compiled by national environmental organizations. These included national and North Carolina lists of nonprofit organizations listed as either environmental or conservation groups. We also reviewed websites of North Carolina environmental groups to locate previously unidentified groups. For ease of description, we refer to our list as the pop-ulation although we recognize that we could have missed a small number of organizations.
Next, we turned our attention to coding measures for each organization in the population using information from organizational webpages, directories, and printed materials. The vari-ables we coded can be grouped into five major categories: (1) geographic location and scope, (2) issues, (3) discursive frames, (4) targets, and (5) organizational demographics. Thus, we are able to determine whether organizations identified from specific lists differ in fundamental ways from the population as a whole on these characteristics. We selected these charac-teristics because they are central to many analyses of contemporary movements and ongoing theoretical debates. Thus, bias could present significant problems for scholars.
To code organizational characteristics, we assembled materials on each organization inclu-ding printed text from organizational webpages and from directories (many of which included information such as founding dates, mission statements, issue focus, and staff). For the 475 active organizations, we obtained information from webpages for 324 organizations, and from at least one printed source, such as a mission statement or profile in a directory, for 329 organ-izations. In total, we were able to code relevant information for 410 organizations. Selected variables, however, were more difficult to obtain. Specifically, we were only able to gather estimates for membership, income, staff, and age for approximately forty percent of the total population. As a result, we treat these data with particular caution in our analyses below.
Table 1 lists the number of organizations from each source list. Two points merit attention. First, lists vary widely in the number of organizations included, ranging from fewer than ten to almost 200, in the cases of the Guidestar Directory and Guide to North Carolina Environmental Groups. Second, even the most comprehensive list includes less than forty percent of all environmental organizations identified through our more cost-intensive enumeration process.
We have grouped these sources into five categories: (1) national environmental move-ment lists, (2) national nonprofit organization lists, (3) state environmental movement lists, (4) state nonprofit organization lists, and (5) state movement lists. These five source types are typical of those commonly used in current scholarship. For example, researchers seeking to bound their population of interest by issue domain, in this case environmentalism, would likely use the national, state or local movement lists to construct a sampling frame depending on the scale of the study. By contrast, the national and state nonprofit lists correspond to a sampling strategy that defined the population of interest by an attribute of organizational form, whether it had obtained nonprofit status, instead of a specific issue focus. Each type of list corresponds to a different possible sampling strategy a researcher could have chosen to study North Carolina environmental organizations. By systematically estimating population parameters based on different sampling strategies and comparing them to estimations based upon the more extensive enumeration of all active environmental organizations, we can iden-tify the extent to which single types of sources under or overrepresent particular SMO attributes. Further, the analysis presented below enables the assessment of sampling error associated with each type of sampling strategy.
Utilizing a single source offers a clear advantage in terms of time and expense needed to construct a sampling frame. Yet, unacceptable levels of sampling bias stemming from a single- source strategy may more than offset any cost advantage. Nevertheless, more comprehensive strategies may not be feasible or even necessary. Thus, we expect single sources will lead to un-acceptable sampling bias. Yet, we also recognize that exhausting extant sources may be pro-hibitively expensive.
Mobilization 236
Creating a Peak List
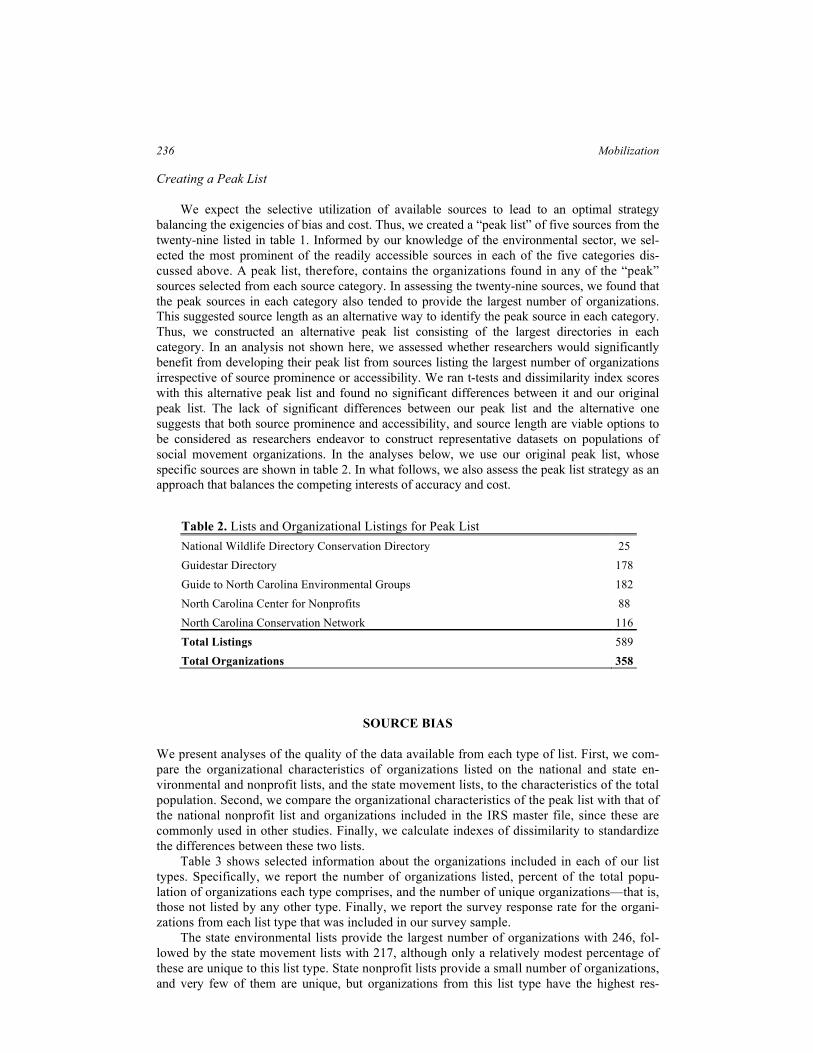
We expect the selective utilization of available sources to lead to an optimal strategy balancing the exigencies of bias and cost. Thus, we created a “peak list” of five sources from the twenty-nine listed in table 1. Informed by our knowledge of the environmental sector, we sel-ected the most prominent of the readily accessible sources in each of the five categories dis-cussed above. A peak list, therefore, contains the organizations found in any of the “peak” sources selected from each source category. In assessing the twenty-nine sources, we found that the peak sources in each category also tended to provide the largest number of organizations. This suggested source length as an alternative way to identify the peak source in each category. Thus, we constructed an alternative peak list consisting of the largest directories in each category. In an analysis not shown here, we assessed whether researchers would significantly benefit from developing their peak list from sources listing the largest number of organizations irrespective of source prominence or accessibility. We ran t-tests and dissimilarity index scores with this alternative peak list and found no significant differences between it and our original peak list. The lack of significant differences between our peak list and the alternative one suggests that both source prominence and accessibility, and source length are viable options to be considered as researchers endeavor to construct representative datasets on populations of social movement organizations. In the analyses below, we use our original peak list, whose specific sources are shown in table 2. In what follows, we also assess the peak list strategy as an approach that balances the competing interests of accuracy and cost.
SOURCE BIAS
We present analyses of the quality of the data available from each type of list. First, we com-pare the organizational characteristics of organizations listed on the national and state en-vironmental and nonprofit lists, and the state movement lists, to the characteristics of the total population. Second, we compare the organizational characteristics of the peak list with that of the national nonprofit list and organizations included in the IRS master file, since these are commonly used in other studies. Finally, we calculate indexes of dissimilarity to standardize the differences between these two lists.
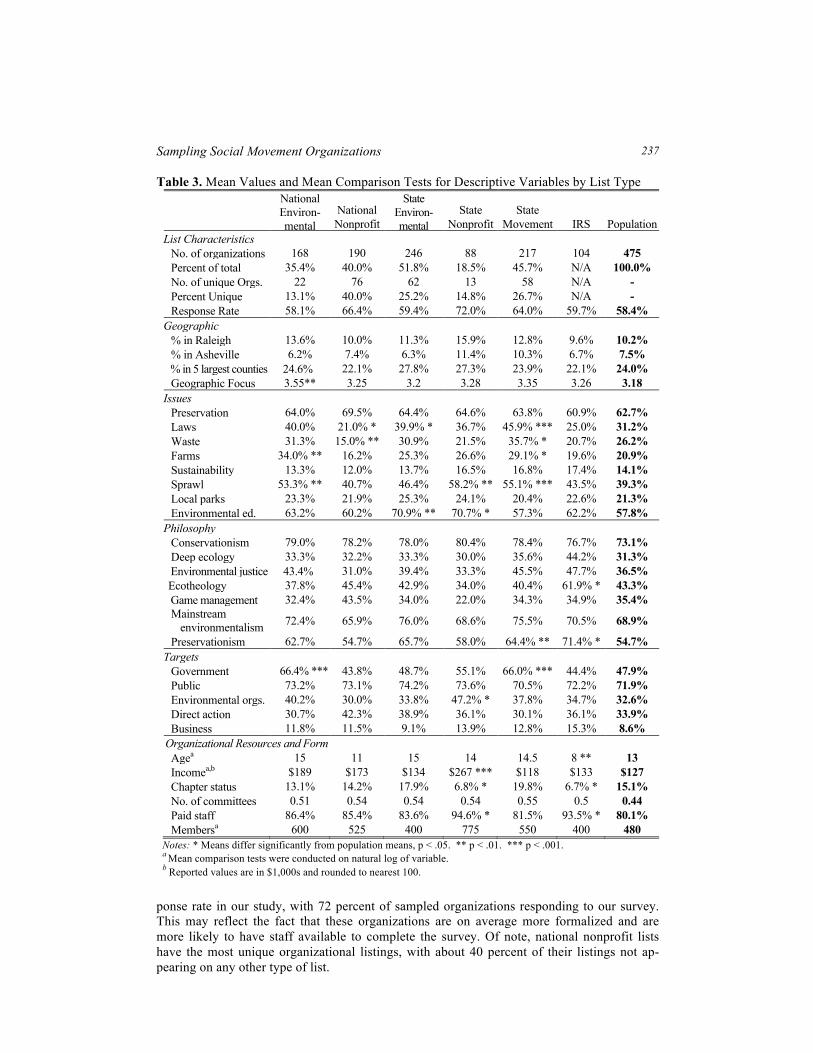
Table 3 shows selected information about the organizations included in each of our list types. Specifically, we report the number of organizations listed, percent of the total popu-lation of organizations each type comprises, and the number of unique organizations—that is, those not listed by any other type. Finally, we report the survey response rate for the organi-zations from each list type that was included in our survey sample.
The state environmental lists provide the largest number of organizations with 246, fol-lowed by the state movement lists with 217, although only a relatively modest percentage of these are unique to this list type. State nonprofit lists provide a small number of organizations, and very few of them are unique, but organizations from this list type have the highest res-
Table 2. Lists and Organizational Listings for Peak List National Wildlife Directory Conservation Directory 25 Guidestar Directory 178 Guide to North Carolina Environmental Groups 182 North Carolina Center for Nonprofits 88 North Carolina Conservation Network 116 Total Listings 589 Total Organizations 358
Sampling Social Movement Organizations 237
Table 3. Mean Values and Mean Comparison Tests for Descriptive Variables by List Type National Environ-mental
National Nonprofit
State Environ-mental
State Nonprofit
State Movement IRS Population
List Characteristics No. of organizations 168 190 246 88 217 104 475 Percent of total 35.4% 40.0% 51.8% 18.5% 45.7% N/A 100.0% No. of unique Orgs. 22 76 62 13 58 N/A - Percent Unique 13.1% 40.0% 25.2% 14.8% 26.7% N/A - Response Rate 58.1% 66.4% 59.4% 72.0% 64.0% 59.7% 58.4%
Geographic % in Raleigh 13.6% 10.0% 11.3% 15.9% 12.8% 9.6% 10.2% % in Asheville 6.2% 7.4% 6.3% 11.4% 10.3% 6.7% 7.5% % in 5 largest counties 24.6% 22.1% 27.8% 27.3% 23.9% 22.1% 24.0% Geographic Focus 3.55** 3.25 3.2 3.28 3.35 3.26 3.18
Issues Preservation 64.0% 69.5% 64.4% 64.6% 63.8% 60.9% 62.7% Laws 40.0% 21.0% * 39.9% * 36.7% 45.9% *** 25.0% 31.2% Waste 31.3% 15.0% ** 30.9% 21.5% 35.7% * 20.7% 26.2% Farms 34.0% ** 16.2% 25.3% 26.6% 29.1% * 19.6% 20.9% Sustainability 13.3% 12.0% 13.7% 16.5% 16.8% 17.4% 14.1% Sprawl 53.3% ** 40.7% 46.4% 58.2% ** 55.1% *** 43.5% 39.3% Local parks 23.3% 21.9% 25.3% 24.1% 20.4% 22.6% 21.3% Environmental ed. 63.2% 60.2% 70.9% ** 70.7% * 57.3% 62.2% 57.8%
Philosophy Conservationism 79.0% 78.2% 78.0% 80.4% 78.4% 76.7% 73.1% Deep ecology 33.3% 32.2% 33.3% 30.0% 35.6% 44.2% 31.3% Environmental justice 43.4% 31.0% 39.4% 33.3% 45.5% 47.7% 36.5% Ecotheology 37.8% 45.4% 42.9% 34.0% 40.4% 61.9% * 43.3% Game management 32.4% 43.5% 34.0% 22.0% 34.3% 34.9% 35.4% Mainstream
environmentalism 72.4% 65.9% 76.0% 68.6% 75.5% 70.5% 68.9%
Preservationism 62.7% 54.7% 65.7% 58.0% 64.4% ** 71.4% * 54.7% Targets Government 66.4% *** 43.8% 48.7% 55.1% 66.0% *** 44.4% 47.9% Public 73.2% 73.1% 74.2% 73.6% 70.5% 72.2% 71.9% Environmental orgs. 40.2% 30.0% 33.8% 47.2% * 37.8% 34.7% 32.6% Direct action 30.7% 42.3% 38.9% 36.1% 30.1% 36.1% 33.9% Business 11.8% 11.5% 9.1% 13.9% 12.8% 15.3% 8.6% Organizational Resources and Form Agea 15 11 15 14 14.5 8 ** 13 Incomea,b $189 $173 $134 $267 *** $118 $133 $127 Chapter status 13.1% 14.2% 17.9% 6.8% * 19.8% 6.7% * 15.1% No. of committees 0.51 0.54 0.54 0.54 0.55 0.5 0.44 Paid staff 86.4% 85.4% 83.6% 94.6% * 81.5% 93.5% * 80.1% Membersa 600 525 400 775 550 400 480
Notes: * Means differ significantly from population means, p < .05. ** p < .01. *** p < .001. a Mean comparison tests were conducted on natural log of variable. b Reported values are in $1,000s and rounded to nearest 100.
ponse rate in our study, with 72 percent of sampled organizations responding to our survey. This may reflect the fact that these organizations are on average more formalized and are more likely to have staff available to complete the survey. Of note, national nonprofit lists have the most unique organizational listings, with about 40 percent of their listings not ap-pearing on any other type of list.

Mobilization 238
We divide organizational attributes into five categories: (1) geographic, (2) issue, (3) dis-cursive frame, (4) strategic, and (5) demographic. We compare organizations on these issues because they represent characteristics of theoretical interest—thus, bias with respect to these issues would have important implications for current scholarship. Data on these characteristics were drawn from the websites of all the organizations in our population, not only those that were included in our survey sample or that responded to our survey. This coding work took place in 2002 and 2003. We use independent sample t-tests to determine if the mean values for each list type differ significantly from the mean values for the entire population of 475 groups.
Geographic characteristics include the percentage of listed organizations the state capital, Raleigh, the percent of organizations in Asheville (the second largest center of environmentalist activity in the state), the percent of organizations in the state’s five most populous counties, and the average scope of the geographic focus of the organizations’ activities. The scope of the geo-graphic focus was measured as an ordinal variable ranging from one, for organizations focused on neighborhoods within cities, to six, for organizations with an international or global scope.
Eight issue areas are examined: (1) preservation, (2) legislative, (3) waste, (4) farms, (5) sustainability, (6) sprawl, (7) local parks, and (8) environmental education. Each issue area is measured as an indicator variable showing whether or not the organization mentions one of several component issues on its website, and displayed as the percent of organizations on each list type that include that issue position. Preservation includes habitat, species, endangered species, conservation, sustainable forestry, game management, logging, and preservation issues. Laws include issues of law enforcement, better laws, environmental justice, and air quality. Waste issues include of recycling, garbage, toxic waste, and nuclear power. Farm issues include agricultural runoff, pesticides, livestock, and sustainable agriculture. Sustainability includes sustainable lifestyles and sustainable technology issues. Sprawl includes issues of sprawl, sustainable development, and zoning. Local park issues include parks and litter. Environmental education is a single issue.
While social movement organizations may focus on similar issues, they often approach them using varying discursive frames. We examine seven that are central to environmental discourse: (1) conservation, (2) deep ecology, (3) environmental justice, (4) ecotheology, (5) game management, (6) mainstream environmental, and (7) preservation. We followed the descriptions of each discursive frame developed by Brulle (2000). We use our survey questions asking organizational leaders to assess how well descriptions of each approach “fit” the approach of their organization. The measures used are the percentage of organizations in each source type whose philosophy of action aligns “very well” with that particular discursive frame.
Social movement organizations employ varying social change strategies, and, as a result, often target their efforts towards different constituencies. The indicators used here measure the percentage of organizations listed in each source type that direct their public claims toward the following targets: local, state or national governmental bodies (whether legislative or executive agency); general public; other environmental organizations; businesses; or engage in direct action tactics.
Several aspects of organizational demography are examined. These include mean age in years, annual revenues, number of internal organizational task committees, and number of indi-vidual members for each organization. Organizational age is crucial because scholars often use this kind of data to study temporal dynamics such as founding and mortality (Archibald 2008; Archibald 2007; Edwards and Marullo 1995; Minkoff 1995a; Minkoff 1995b). Although our data is cross-sectional, source bias related to organizational age may indicate problems for panel data. Scholars have also been concerned about the potential for sources to favor wealthier and more formalized organizations. We also report the percent of organizations of each list type that are chapters of larger organizations, and the percent that have paid staff. We calculated the significance tests for age, income, and membership based on a comparison of means of the logged values, and we report the median values for these variables in table 3.
Compared to the population, organizations on national environmental lists have a signifi-cantly broader geographic focus and are more likely to include agricultural and sprawl issues in

Sampling Social Movement Organizations 239
their issue agenda. Groups on national environmental lists are also more likely to target govern-ment. National nonprofit listings, by contrast, are less likely to pursue legislative change or waste issues in their agendas than are organizations from the total population.
Organizations listed on state environmental directories are more likely to pursue legislative change and undertake environmental education than the broader population of groups. Organi-zations on state nonprofit lists are more likely to work on sprawl issues and engage in environ-mental education. State nonprofit list organizations are also more likely to focus on other envi-ronmental movement organizations, have higher mean annual revenues, are more likely to have paid employees, and less likely to be state or local chapters of larger organizations.
Organizations on state movement lists differ considerably from the population in their issue profile. State movement list organizations are more likely to pursue legislative changes, work on waste issues, agriculture, and sprawl compared to the total population of environmental or-ganizations in North Carolina. Organizations listed by state movement sources are also more likely to target government at some level and to use preservation as a discursive frame than are organizations in the population as a whole.
In all, 155 separate tests were performed with only twenty (13 percent) evidencing sig-nificant deviation from the broader population. Of the thirty-one variables used to test the five sources, no single source had more than six (19 percent) and as few as two (6 percent) variables differ significantly from the broader population. All sources represent the geographic dispersion within the state rather well with only one significant deviation. Results for environmental organ-ization targets were similar with three significant differences across the five source types. The sampling sources were the most unrepresentative for the issue focus with twelve (60 percent) of all significant deviations related to issues. Importantly, of the thirty-five tests used on discursive frames, only one (preservationism in the state movement list) was significantly different from the population average. The three deviations in organizational demography may be related, in part, to the higher proportion of missing cases on demographic variables.3 Based on our t-tests, the organizations listed on the national nonprofit lists appear to differ least from the total population of organizations, though it lists only 76 unique organizations which would yield a rather small sample size.
Supplementary Analysis of Independent Data from the IRS
We conducted supplementary analysis using data from the Internal Revenue Service (IRS). The IRS regularly updates a master file of nonprofit organizations in the United States that apply for tax exemption. The master file contains information such as an organization’s income, date it received recognition of tax-exempt status, and a National Taxonomy of Exempt Entities (NTEE) classification code. Data for this analysis came from the National Center for Charitable Statistics (NCCS), which regularly compiles IRS master files. To narrow in on environmental groups, we identified organizations in the NCCS data that have NTEE codes from C01 to C99. The “C” NTEE classification includes nonprofit organizations involved with environmental quality, protection, and beautification.
Previous studies have used the IRS master file as the main source for organizational data (Leroux 2012; McVeigh, Welch and Bjarnason 2003). This is a potentially fruitful strategy, since previous research on environmental groups has found that the IRS master file provides a high level of coverage and includes both older and newly founded organizations (Brulle et al. 2007).4 We test whether the organizations from our original population that were also classified as “C” organizations in the IRS master file (104 out of 475) differed significantly in their characteristics from the population as a whole. Of the thirty-one tests we ran to compare the IRS data with our original population data, we found five statistically significant deviations. Organi-zations in the IRS data are more likely to use eco-theology and preservationism as discursive frames. These organizations are also more likely to be younger, less likely to be state or local chapters of larger organizations, and more likely to have paid staff. We compare characteristics of organizations in the IRS data to those of the whole population (and to our Peak List) in table 4.

Mobilization
240
OPTIMIZING SAMPLING STRATEGIES
Although the specific findings are important and, in some cases, have considerable sub-stantive significance, our second goal is to develop a summary indicator for the overall bias associated with different types of sampling frames. We compare the representativeness of data derived by the single list and “peak list” approaches to characteristics of the broader pop-ulation derived from all twenty-seven sources listed in table 1. Table 4 gives t-tests results com-paring the characteristics of organizations on the peak list to the population, and reproduces Table 4. Mean Values and Mean Comparison Tests for Descriptive Variables for Peak List
Peak List National Nonprofit IRS Population List Characteristics
Number of organizations listed 358 190 104 475 Percent of Total Population 75.4% 40.0% N/A 100% Survey Response Rate 62.2% 66.4% 59.7% 58.4%
Geographic Percent in Raleigh 11.6% 10.0% 9.6% 10.2% Percent in Asheville 7.1% 7.4% 6.7% 7.5% Percent in 5 Largest Counties 25.4% 22.1% 22.1% 24.0% Geographic Focus 3.15 3.25 3.26 3.18
Issues Preservation 67.2% 69.5% 60.9% 62.7% Laws 32.2% 21.0% * 25.0% 31.2% Waste 25.7% 15.0% ** 20.7% 26.2% Farms 19.6% 16.2% 19.6% 20.9% Sustainability 14.5% 12.0% 17.4% 14.1% Sprawl 43.7% 40.7% 43.5% 39.3% Local parks 23.3% 21.9% 22.6% 21.3% Environmental Education 63.7% 60.2% 62.2% 57.8%
Philosophy Conservationism 73.0% 78.2% 76.7% 73.1% Deep Ecology 30.3% 32.2% 44.2% 31.3% Environmental Justice 33.8% 31.0% 47.7% 36.5% Eco-theology 40.3% 45.4% 61.9% * 43.3% Game Management 35.1% 43.5% 34.9% 35.4% Mainstream Environmentalism 67.3% 65.9% 70.5% 68.9% Preservationism 55.6% 54.7% 71.4% * 54.7%
Targets Government 48.8% 43.8% 44.4% 47.9% Public 71.8% 73.1% 72.2% 71.9% Environmental organizations 31.0% 30.0% 34.7% 32.6% Direct Action 38.9% 42.3% 36.1% 33.9% Business 9.1% 11.5% 15.3% 8.6%
Organizational Resources and Form Agea 12 11 8 ** 13 Incomea,b $137,200 $173,000 $133,000 $127,000 Chapter Status 16.5% 14.2% 6.7% * 15.1% Number of committees 0.53 0.54 0.5 0.44 Paid Staff 81.5% 85.4% 93.5% * 80.1% Membersa 500 525 400 480
Notes: * Means differ significantly from population means, p < .05. ** p < .01. *** p < .001. a Mean comparison tests were conducted on natural log of variable. b Reported values are rounded to nearest 100.

Sampling Social Movement Organizations
241
Table 5. Dissimilarity Indexes for Descriptive Variables for Peak List
Peak List National Nonprofit Geographic Percent in Raleigh 0.065 0.053
Percent in Asheville 0.021 0.021 Percent in 5 Largest Counties 0.059 0.008 Geographic Focus 0.126 0.288
Issues Preservation 0.207 0.020 Laws 0.042 0.143 Waste 0.022 0.081 Farms 0.060 0.213 Sustainability 0.017 0.010 Sprawl 0.205 0.223 Local parks 0.094 0.031 Environmental Education 0.265 0.081
Philosophy Conservationism 0.013 0.015 Deep Ecology 0.064 0.031 Environmental Justice 0.162 0.117 Eco-theology 0.178 0.098 Game Management 0.015 0.045 Mainstream Environmentalism 0.093 0.054 Preservationism 0.056 0.131
Targets Government 0.049 0.323 Public 0.003 0.020 Environmental organizations 0.084 0.124 Direct Action 0.258 0.057 Business 0.026 0.053
Organizational Resources and Form Age 0.207 0.214 Income 0.167 0.175 Chapter Status 0.056 0.032 Number of committees 0.163 0.058 Paid Staff 0.115 0.133 Members 0.394 0.232
Summary Measures Geography Average 0.068 0.093 Issue Average 0.114 0.100 Philosophy Average 0.083 0.070 Target Average 0.084 0.115 Organizational Average 0.184 0.141 Total Average Dissimilarity 0.106 0.104 Total without Organizational 0.087 0.095
the results of the national nonprofit lists and the IRS data from Table 3 for easier reference. The peak list organizations differ significantly from the population on none of the thirty-one organizational characteristics. While the national nonprofit list does not deviate from the population very much, organizations on this list do differ in their pursuit of legislative change and waste issues. In short, our analyses underscore the value of combining sources of dif-ferent types and not relying on any single source.
To refine this analysis (table 5), we follow a strategy used by Gronbjerg and Clerkin (2005), who used a dissimilarity index (D) to compare different sampling frames to one

Mobilization
242
another. The index of dissimilarity is most often used as a measure of racial or gender segregation (Massey and Denton 1988). In this tradition, researchers estimate the extent of segregation across a set of ecological units by analyzing dissimilarities in the estimated proportions of qualitative categories (race, sex) or means on quantitative measures of interest (income). For example, to what extent is the proportion of African-Americans, females, or low-income individuals similar or dissimilar in different neighborhoods, occupations, or schools? In this case, our measure captures the divergence on a range of organizational attributes of a sample of organizations listed in a particular source type from the attributes of our broader population derived from 27 different source types. Dissimilarity measures range between 0 and 1, with higher values indicating greater divergence in the composition of the organizations listed in one list to those not included (James and Taueber 1985). A score of 0 would indicate that there was no difference in the composition of the organizations in the subset on a selected characteristic (e.g., presence of staff) and in the larger population.
We calculated dissimilarity measures for each organizational characteristic (e.g., whether an organization is located in Raleigh or considers sprawl to be one of its issues). We also cal-culate an average dissimilarity score within each conceptual category—geographic, issues, targets, and organizational demography.5 Finally, we calculated the average dissimilarity among all four conceptual categories to estimate an overall dissimilarity between the peak list (and the national nonprofit list) and the population as a whole. Because organizational demography has the highest average dissimilarity—and because these data are less reliable than the others, due to a lower N for these variables—we also calculate an average across the other four domains.6
Table 5 reports the results of our dissimilarity calculations for the peak list, and repro-duces the results of our calculations for the national nonprofit lists, because this list is likely to be used in other studies and it performed well in our t-tests. The peak list’s total average dis-similarity is .106 compared to 104 for the national nonprofit lists. Total average dissimilarity excluding organizational demographics, however, indicates a lower dissimilarity score for peak list organizations (.087) than for national nonprofit lists (.095). This difference is the result of high dissimilarity index scores (.394 and .163) in the peak list of the membership size and the number of internal committee variables, respectively.
CONCLUSION In this article, we examined the strategies scholars use to compile data on populations of non-profits, social movement organizations, and interest groups. Using a unique and comprehend-sive dataset on state and local environmental organizations, we evaluated the possibilities and limitations of alternative strategies for constructing organizational sampling frames. We also considered whether an optimal strategy was feasible that balanced the twin goals of repre-sentativeness and research costs.
Our study considers available strategies for scholars seeking to construct a representative sample of a population of nonprofits, interest groups, civic associations, and/or social move-ment organizations. Our primary focus is on coverage bias, as this design presents significant challenges to scholars. Researchers will have other methodological concerns at this stage including sample size, whether lists are updated regularly (allowing for longitudinal designs), and the inclusion of other measures in the list or directory. Thus, we expect scholars will need to balance our recommendations alongside these other considerations.
Our first set of findings regarding the representativeness of different source types indicates that all types do relatively well in representing the geographic distribution and the targets of organizations. We find greater reason for concern with respect to the issue focus of organizations and their demographic characteristics such as age, organizational form, and resources. Comparing across the different types of lists, we find that, somewhat to our sur-prise, the two most widely used and available sources—Associations Unlimited and

Sampling Social Movement Organizations
243
Guidestar—provide the least biased sampling frames in terms of the dimensions measured here. However, these sources yield a relatively small number of cases, and, therefore, they contain significant limitations.
Turning to our second set of analyses, we examined whether scholars could strengthen their sampling frames by utilizing the “peak list” strategy described herein. This strategy targets the most prominent and widely available lists of various types including those gener-ated locally and nationally and those with issue-specific and broader orientations. As ex-pected, the peak list strategy offers a sampling frame with minimal bias and a large pool of organizations. To our knowledge, this strategy has not been employed widely in the field, but it could easily be adopted by scholars studying various populations of organizations. The “peak list” strategy approximates a more exhaustive enumeration of the entire population without requiring the same investment of resources. Thus, one advantage is generating a much larger sample size. This is promising for scholars seeking to document or compare across organizations of specific types such as environmental, racial and ethnic, and women’s organi-zations. More fundamentally, this paper points to the need for greater attention to substantive and often underexamined components of the research process that can buttress theoretically motivated research on organizations.
Our study does entail important limitations—most notably by relying on a cross-sectional dataset and by focusing on environmentalism, which may differ from other domains. While many scholars construct cross-sectional datasets for populations of movement organizations, many others employ longitudinal datasets to test dynamic arguments. This presents additional challenges because multiple sources may have uneven production cycles with some updated annually and others less frequently. Nevertheless, scholars may be able to implement key recommendations of this study. For example, researchers could combine sources for selected time points to investigate possible bias sources that are updated regularly like IRS records and sources that are produced on less frequent schedules or only once. The environmental domain is highly stable relative to some social movements, and this stability likely is associated with greater levels of resources, professionalization, and formal structure in the aggregate. Thus, our recommendations may well be more difficult to implement for populations, which are, on the whole, more fleeting, volatile or radical. For example, populations of SMOs actively par-ticipating in or providing support for global justice protests (Gillham 2003) or local Occupy Wall Street groups (Caren and Gaby 2011) pose a different sort of challenge because the lists themselves can be fleeting, posted for organizing purposes, and taken down or altered after an event has occurred (Gillham and Edwards 2011). However, despite such challenges, we should emphasize that our comprehensive review of sources allowed us to detect the rather significant diversity of local and state environmentalism including SMOs as small, non-formally organized, and prone to engage in disruptive or confrontational tactics (Andrews and Edwards 2005; Edwards and Foley 2003).
Despite these limitations, our findings suggest that scholars researching social movement organizations may benefit from creating a peak list. Based on a scholar’s knowledge of a sector, he or she should consider the following issues before constructing such a list. First, how well-established or stable is the sector? If the sector is relatively well-established, it is likely that a number of prominent directories are available that the researcher can draw on. On the other hand, if a sector is relatively new or less stable, the researcher should proceed more cautiously when constructing the peak list or it may simply be impossible to create one. Second, some sectors, especially well-established ones, are likely to have more sublists (e.g., national, state, local, movement), such as the ones we used in this study. If the sub-lists represent different movement actors, then the construction of a peak list is ideal. However, if particular sub-lists (e.g., a local listing) are not available, then again the researcher must proceed with caution and at least acknowledge that his or her constructed list is incomplete.

Mobilization
244
NOTES 1 Scholars must also address other design issues that influence the overall data quality including nonresponse bias (Smith 1997; Tomaskovic-Devey, Leiter, and Thompson 1994; Weisberg 2005). 2 Research on cross-national or transnational organizations relies on similar directories, such as the Yearbook of International Organization published by the Union of International Associations (Frank, Hironaka, and Schofer 2000; Smith and Wiest 2005). 3 We do not directly gauge whether sources include relevant measures or the quality of those measures because the indicators included in our analyses come from multiple sources including organizational websites. However, some researchers utilize source listing as a primary data source rather than as a sampling frame for interviews, surveys, or other data collection. For such purposes, national and state nonprofit listings tend to have less missing data (typically ten to fifteen percent difference) on indicators like income and founding date than do other sources. 4 The usefulness of the IRS master file depends upon the proportion of organizations in a given movement that have formally obtained a tax status. Indications are that this varies substantially across movements. For example, Edwards and Foley (2003) estimated that approximately forty percent of groups working for peace in the late 1980s operated without any formal tax status and thus would be unrepresented in samples constructed from the IRS master file. 5 Because of how skewed three of our organizational demographic measures—age, income, and membership—are, we collapsed these continuous variables into categories that intuitively and empirically made sense. For example, for the income variable, we categorized the organizations as those that reported no income, had income of less than $100,000, had income between $100,000 and $500,000, and had an income above $500,000. 6 Benn Jann’s “DUNCAN” program for Stata was used to calculate the dissimilarity index D (2004).
REFERENCES
Aldrich, Howard E., Arne L. Kalleberg, Peter V. Marsden, and James E. Cassell. 1989. “In Pursuit of Evidence: Five Sampling Procedures for Locating New Businesses.” Journal of Business Venturing 4(6): 367-86.
Andrews, Kenneth T., and Bob Edwards. 2004. “Advocacy Organizations in the U.S. Political Process.” Annual Review of Sociology 30: 479-506.
———. 2005. “The Organizational Structure of Local Environmentalism.” Mobilization 10(2): 213-34. Archibald, Matthew. 2008. The Evolution of Self-Help: How a Health Movement Became an Institution:
New York: Palgrave Macmillan. ———. 2007. “An Organizational Ecology of National Self-Help/Mutual-Aid Organizations.” Nonprofit
and Voluntary Sector Quarterly. Armstrong, Elizabeth A. 2002. Forging Gay Identities: Organizing Sexuality in San Francisco, 1950-
1994. Chicago: University of Chicago Press. Bail, Christopher A. 2012. “The Fringe Effect Civil Society Organizations and the Evolution of Media
Discourse About Islam since the September 11th Attacks.” American Sociological Review 77(6): 855-79.
Baldassarri, Delia, and Mario Diani. 2007. “The Integrative Power of Civic Networks.” American Journal of Sociology 113(3): 735-80.
Baumgartner, Frank R., and Beth L. Leech. 1998. Basic Interests: The Importance of Groups in Politics and in Political Science. Princeton, NJ: Princeton University Press.
Best, Rachel Kahn. 2012. “Disease Politics and Medical Research Funding: Three Ways Advocacy Shapes Policy.” American Sociological Review 77(5): 780-803.
Boris, Elizabeth, and Rachel Mosher-Williams. 1998. “Nonprofit Advocacy Organizations: Assessing the Definitions, Classifications, and Data.” Nonprofit and Voluntary Sector Quarterly 27(4): 488-506.
Brulle, Robert, Liesel Hall Turner, Jason Carmichael, and J. Craig Jenkins. 2007. “Measuring Social Movement Organization Populations: A Comprehensive Census of U.S. Environmental Organi-zations.” Mobilization 12(3): 255-70.
Brulle, Robert J. 2000. Agency, Democracy, and Nature: The U.S. Environmental Movement from a Critical Theory Perspective. Cambridge, MA: The MIT Press.
Caren, Neal, and Sarah Gaby. 2011. “Occupy Online: Facebook and the Spread of Occupy Wall Street.” Available at SSRN 1943168.
Carmichael, Jason T, J. Craig Jenkins, and Robert J Brulle. 2012. “Building Environmentalism: The Founding of Environmental Movement Organizations in the United States, 1900–2000.” The Sociological Quarterly 53(3): 422-53.

Sampling Social Movement Organizations
245
Clemens, Elizabeth S., and Debra C. Minkoff. 2004. “Beyond the Iron Law: Rethinking the Place of Organizations in Social Movement Research.” Pp. 155-70 in The Blackwell Companion to Social Movements, edited by D. A. Snow, S. A. Soule and H. Kriesi. Malden, MA: Blackwell Publishing.
Edwards, Bob. 1994. “Semiformal Organizational Structure among Social Movement Organizations.” Nonprofit and Voluntary Sector Quarterly 23(4): 309-33.
Edwards, Bob, and Sam Marullo. 1995. “Organizational Mortality in a Declining Social Movement: The Demise of Peace Movement Organizations in the End of the Cold War Era.” American Sociological Review 60(6): 908-27.
Edwards, Bob, and Michael W. Foley. 2003. “Social Movements Beyond the Beltway: Understanding the Diversity of One Social Movement Industry.” Mobilization 8(1): 85-105.
Frank, David, Ann Hironaka, and Evan Schofer. 2000. “The Nation State and the Natural Environment over the Twentieth Century.” American Sociological Review 65(1): 96-116.
Galaskiewicz, Joseph, and Wolfgang Bielefeld. 1998. Nonprofit Organizations in an Age of Uncertainty: A Study of Organizational Change. Hawthorne, NY: Aldine De Gruyter.
Gamson, William. 1990. The Strategy of Social Protest. Belmont: Wadswoth. Gillham, Patrick F. 2003. “Mobilizing for Global Justice: Social Movement Organization Involvement
in Three Contentious Episodes, 1999-2001.” Ph.D. dissertation, Department of Sociology, University of Colorado, Boulder, CO.
Gillham, Patrick F., and Bob Edwards. 2011. “Legitimacy Management, Preservation of Exchange Relationships, and the Dissolution of the Mobilization for Global Justice Coalition.” Social Problems 58(3): 433-60.
Gronbjerg, Kirsten. 2002. “Evaluating Nonprofit Databases.” American Behavioral Scientist 45(11): 1741-77.
Gronbjerg, Kirsten A., and Richard M. Clerkin. 2005. “Explaining the Landscape of Indiana's Nonprofit Sector: Does What You Know Depend on Where You Look?” Nonprofit and Voluntary Sector Quarterly 34(2): 232-59.
James, David R., and Karl E. Taueber. 1985. “Measures of Segregation.” Sociological Methodology 15: 1-32.
Jann, Ben. 2004, "Duncan: Stata Module to Calculate Dissimilarity Index": Boston College Department of Economics, revised 16 Feb 2005.
Johnson, Erik W. 2008. “Social Movement Size, Organizational Diversity and the Making of Federal Law.” Social Forces 86(3): 967-94.
Kalleberg, Arne L., Peter V. Marsden, Howard E. Aldrich, and James E. Cassell. 1990. “Comparing Organizational Sampling Frames.” Administrative Science Quarterly 35(4): 658-88.
Kane, M. D. 2007. “Timing Matters: Shifts in the Causal Determinants of Sodomy Law Decriminal-ization, 1961-1998.” Social Problems 54(2): 211-39.
Kempton, Willett, Dorothy C. Holland, Katherine Bunting-Howarth, Erin Hannan, and Christopher Payne. 2001. “Local Environmental Groups: A Systematic Enumeration in Two Geographical Areas.” Rural Sociology 66(4): 557-78.
Knoke, David, and James R. Woods. 1981. Organized for Action: Commitment in Voluntary Associations. New Brunswick, NJ: Rutgers University Press.
Leroux, Kelly. 2012. “Who Benefits from Nonprofit Economic Development? Examining the Revenue Distribution of Tax-Exempt Development Organizations among U.S. Cities.” Journal of Urban Affairs 34(1): 65-80.
Martin, Andrew W., Frank Baumgartner, and John D. McCarthy. 2006. “Measuring Association Populations Using the Encyclopedia of Associations: Evidence from the Field of Labor Unions.” Social Science Research 35(3): 771-78.
Massey, Douglas S., and Nancy A. Denton. 1988. “The Dimensions of Residential Segregation.” Social Forces 67(2): 281-315.
McCarthy, John D., and Mark Wolfson. 1996. “Resource Mobilization by Local Social Movement Organizations: Agency, Strategy, and Organization in the Movement against Drinking and Driving.” American Sociological Review 61(6): 1070-88.
McCarthy, John D., and Edward T. Walker. 2004. “Alternative Organizational Repertoires of Poor People’s Social Movement Organizations.” Nonprofit and Voluntary Sector Quarterly 33(3): 97-119.
McLaughlin, Paul, and Marwan Khawaja. 2000. “The Organizational Dynamics of the U.S. Environ-mental Movement: Legitimation, Resource Mobilization, and Political Opportunity.” Rural Sociology 65(3): 422-39.

Mobilization
246
McVeigh, Rory, Michael R. Welch, and Thoroddur Bjarnason. 2003. “Hate Crime Reporting as a Suc-cessful Social Movement Outcome.” American Sociological Review 68(6): 843-67.
Meyer, David S., and Debra C. Minkoff. 2004. “Conceptualizing Political Opportunity.” Social Forces 82(4): 1457-92.
Minkoff, Debra C. 1995a. “Interorganizational Influences on the Founding of African American Organizations, 1955-1985.” Sociological Forum 10(1): 51-79.
———. 1995b. Organizing for Equality: The Evolution of Women's and Racial-Ethnic Organizations in America, 1955-1985. New Brunswick, NJ: Rutgers University Press.
———. 1999. “Bending with the Wind: Strategic Change and Adaptation by Women's and Racial Minority Organizations.” American Journal of Sociology 104(6): 1666-703.
Minkoff, Debra C., and John D. McCarthy. 2005. “Reinvigirating the Study of Organizational Processes in Social Movements.” Mobilization 10(2): 289-308.
Negro, Giacomo, Fabrizio Perretti, and Glenn R Carroll. 2013. “Challenger Groups, Commercial Organizations, and Policy Enactment: Local Lesbian/Gay Rights Ordinances in the United States from 1972 to 2008.” American Journal of Sociology 119(3): 790-832.
Olzak, Susan, and Emily Ryo. 2007. “Organizational Diversity, Vitality and Outcomes in the Civil Rights Movement.” Social Forces 85(4): 1561-91.
Smith, Jackie. 1997. “Nonresponse Bias in Organizational Surveys: Evidence from a Survey of Groups Working for Peace. ” Nonprofit and Voluntary Sector Quarterly 26(3):359-68.
Smith, Jackie, and Dawn Wiest. 2005. “The Uneven Geography of Global Civil Society: National and Global Influences on Transnational Association.” Social Forces 84(2): 621-52.
Tomaskovic-Devey, Donald, Jeffrey Leiter, and Shealey Thompson. 1994. "Organizational Survey Nonresponse." Administrative Science Quarterly 39(3):439-57.
Walker, Edward T., John D. McCarthy, and Frank Baumgartner. 2011. “Replacing Members with Managers? Mutualism among Membership and Nonmembership Advocacy Organizations in the United States.” American Journal of Sociology 116(4): 1284-337.
Weisberg, Herbert F. 2005. The Total Survey Error Approach: A Guide to the New Science of Survey Research. Chicago: University of Chicago Press.