Arterial Thoracic Outlet Syndrome: An Overlooked Cause of ...
Upload
eli-bressertCategory
view
2.658download
0
SamplingAn often overlooked art in exploratory data analysis
Eli Bressert @astrobiased Stitch Fix

exploratory data analysis
what to optimize
1
2

What we [data scientists]
do

1. obtain data 2. explore 3. do research/create data product 4. fine tune project and release 5. rinse and repeat
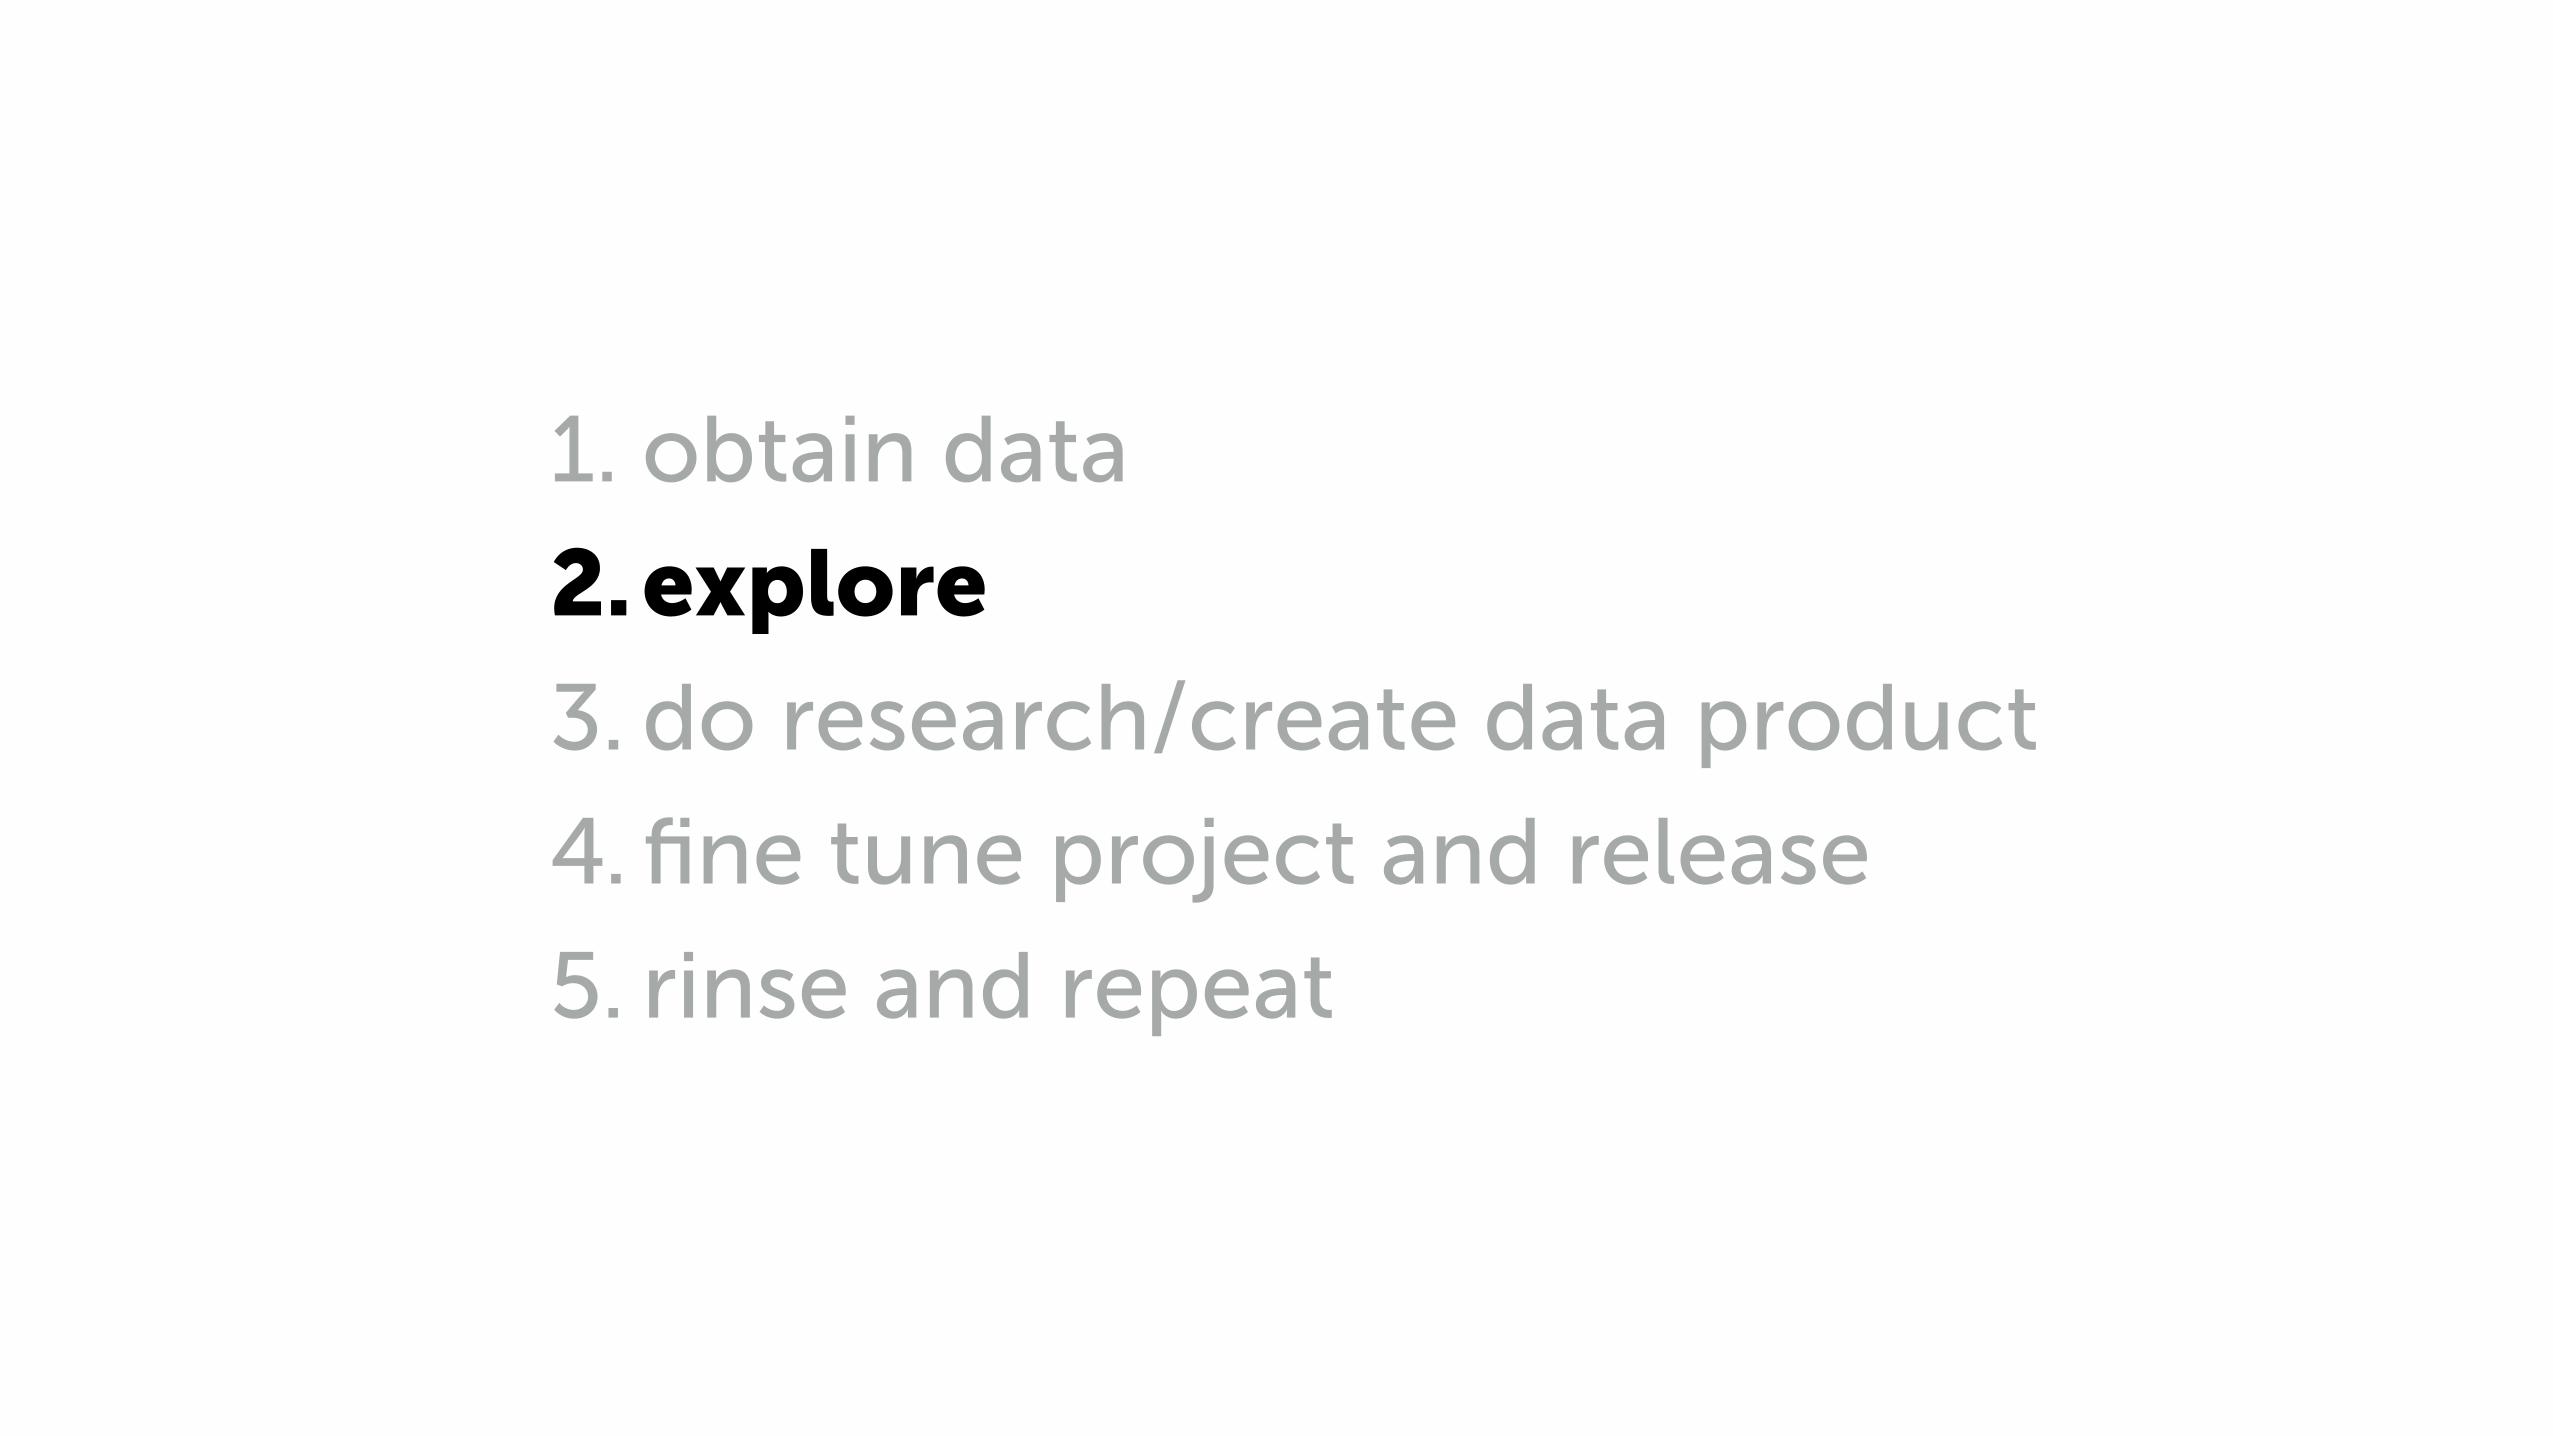
1. obtain data 2.explore 3. do research/create data product 4. fine tune project and release 5. rinse and repeat
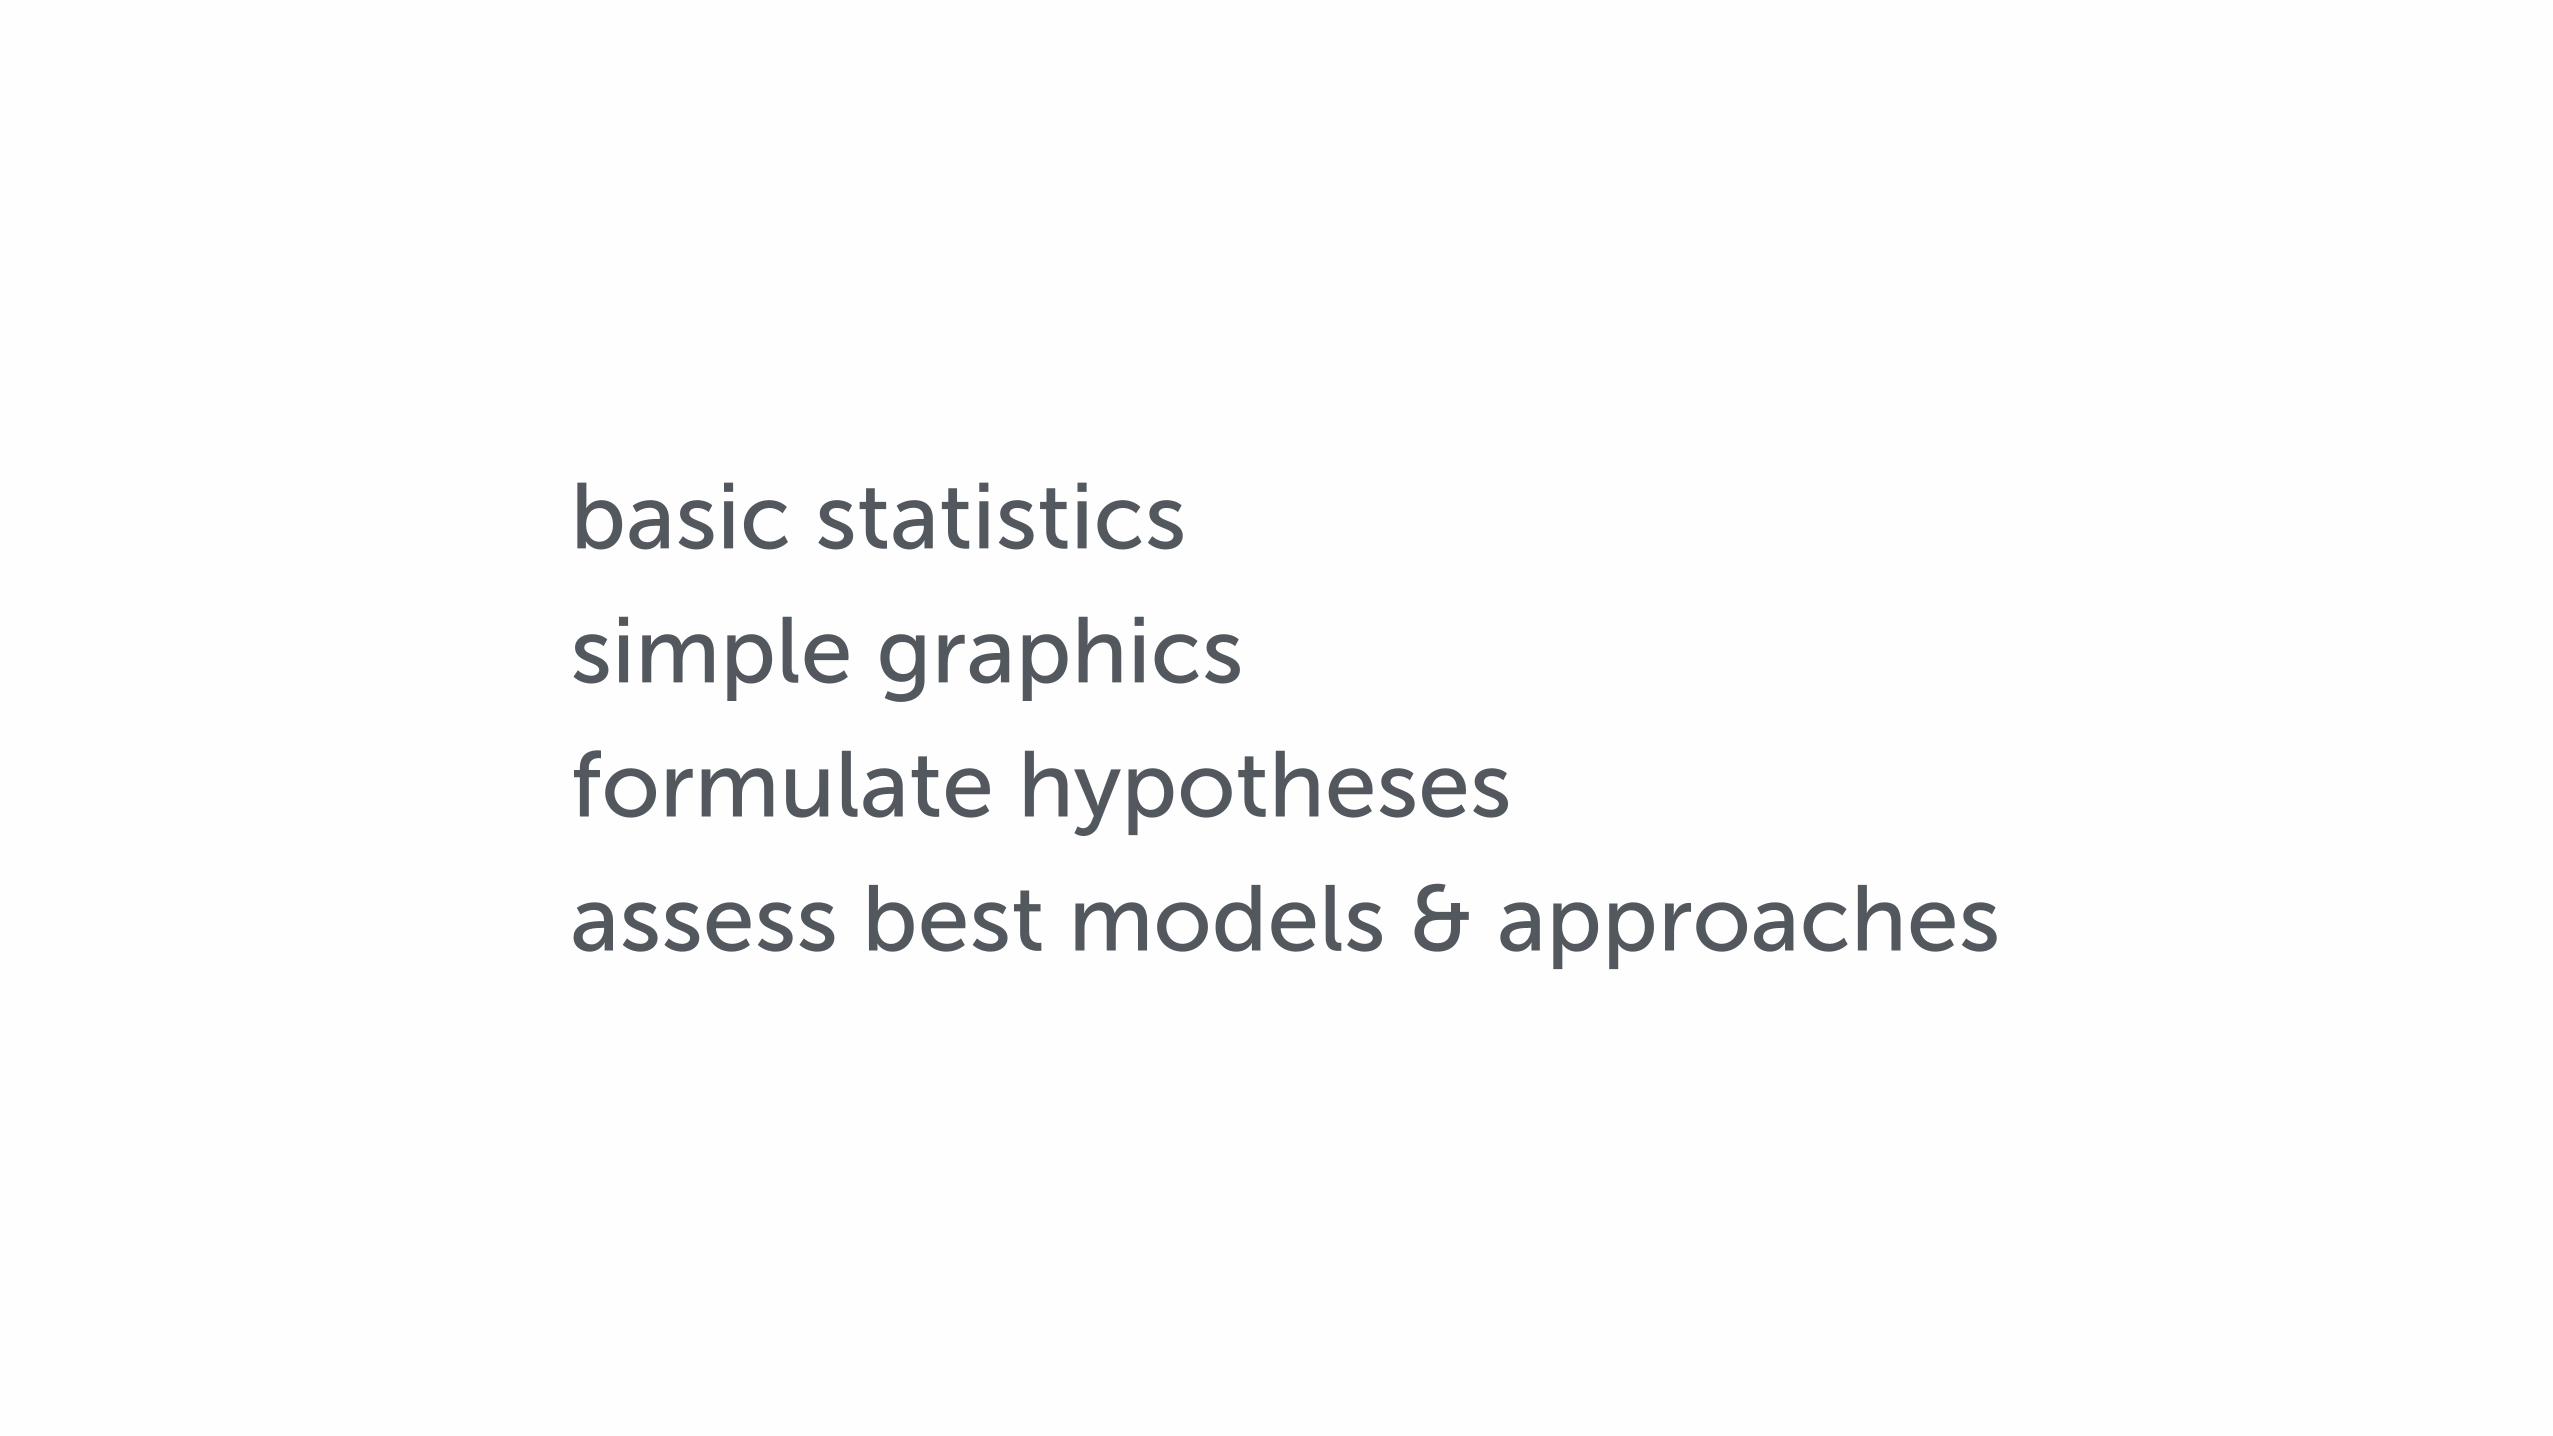
basic statistics simple graphics formulate hypotheses assess best models & approaches

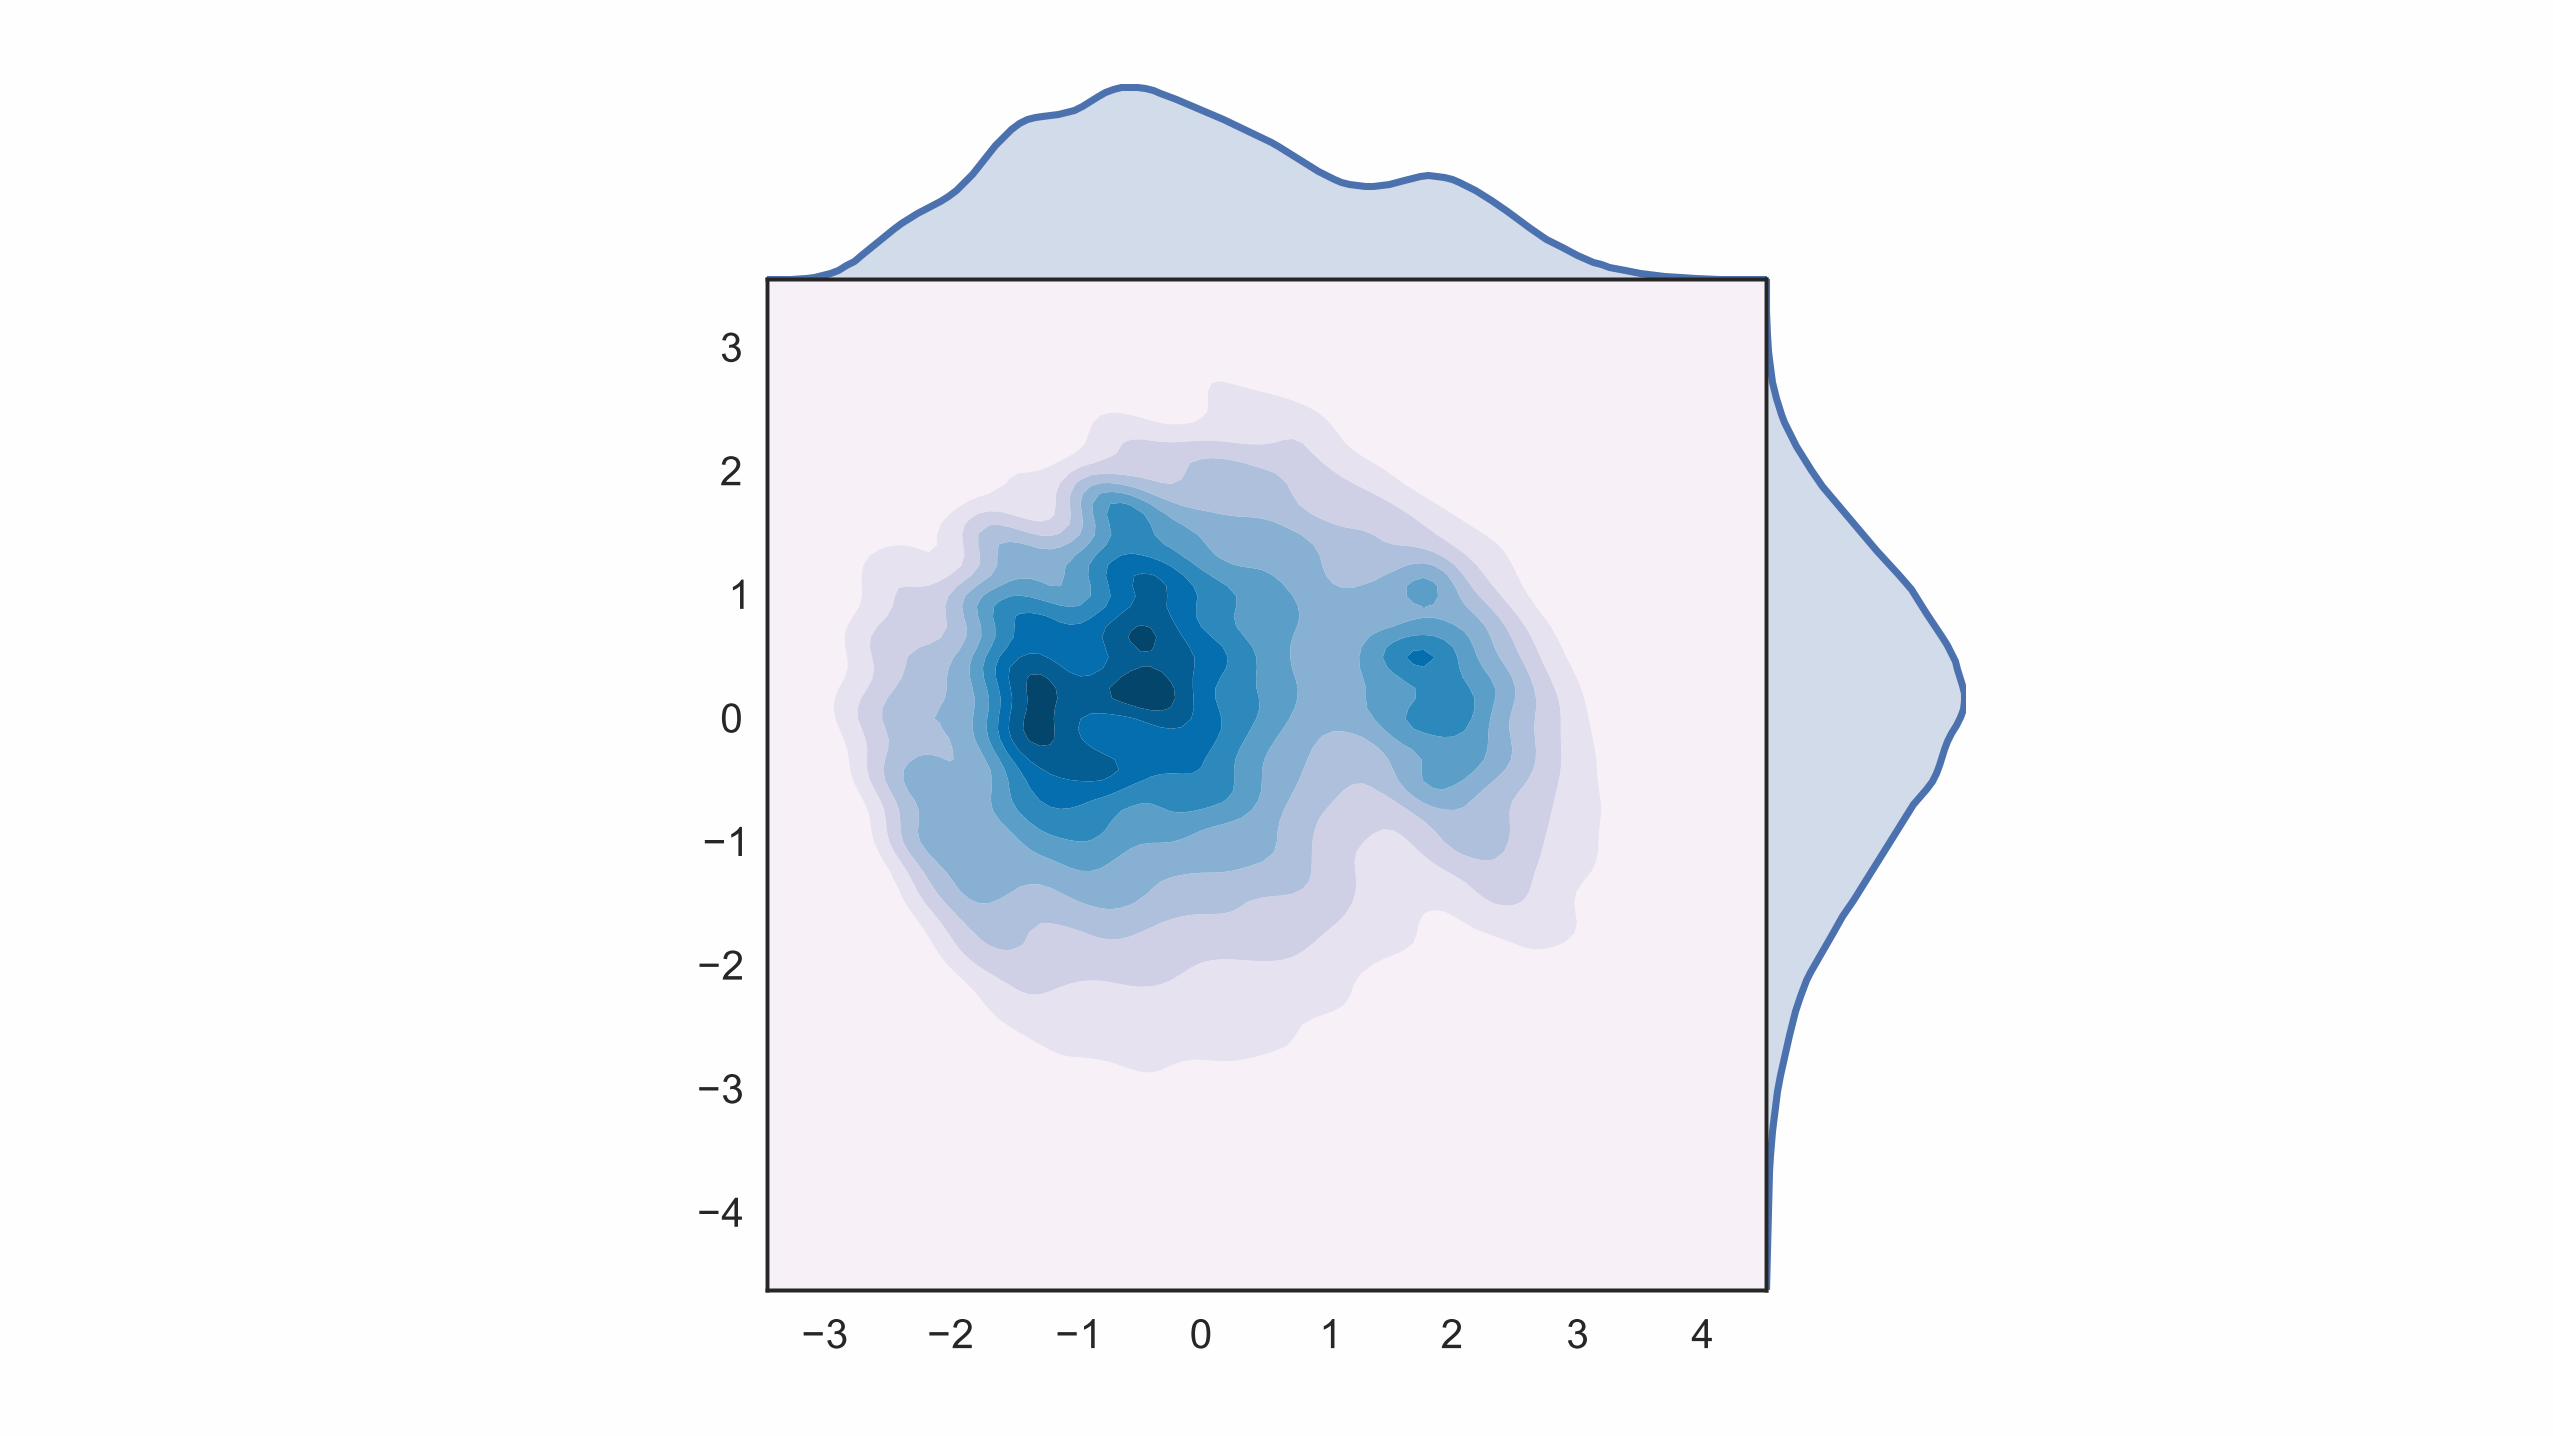
graphic simplicity

0etric 00 0etric 01 0etric 02 0etric 03
0etric 04 0etric 05 0etric 06 0etric 07
0etric 08 0etric 09 0etric 10 0etric 11
0etric 12 0etric 13 0etric 14 0etric 15
0etric 16 0etric 17 0etric 18 0etric 19
0etric 20 0etric 21 0etric 22 0etric 23
0etric 24 0etric 25 0etric 26 0etric 27
0etric 28 0etric 29 0etric 30 0etric 31
0etric 32 0etric 33 0etric 34 0etric 35
0etric 36 0etric 37 0etric 38

met
ric 0
0
met
ric 0
1
met
ric 0
2
met
ric 0
3
met
ric 0
4
met
ric 0
5
metric 01
metric 02
metric 03
metric 04
metric 05
metric 06
−0.4
−0.3
−0.2
−0.1
0.0
0.1
0.2
0.3
0.4
−3 −2 −1 0 1 2 3 4
−4
−3
−2
−1
0
1
2
3

Anscombe’s Quartet

10 8.048 6.95
13 7.589 8.81
11 8.3314 9.966 7.244 4.26
12 10.847 4.825 5.68
10 9.148 8.1413 8.749 8.7711 9.2614 8.16 6.134 3.112 9.137 7.265 4.74
10 7.468 6.7713 12.749 7.1111 7.8114 8.846 6.084 5.3912 8.157 6.425 5.73
8 6.588 5.768 7.718 8.848 8.478 7.048 5.2519 12.58 5.568 7.918 6.89
I II III IV
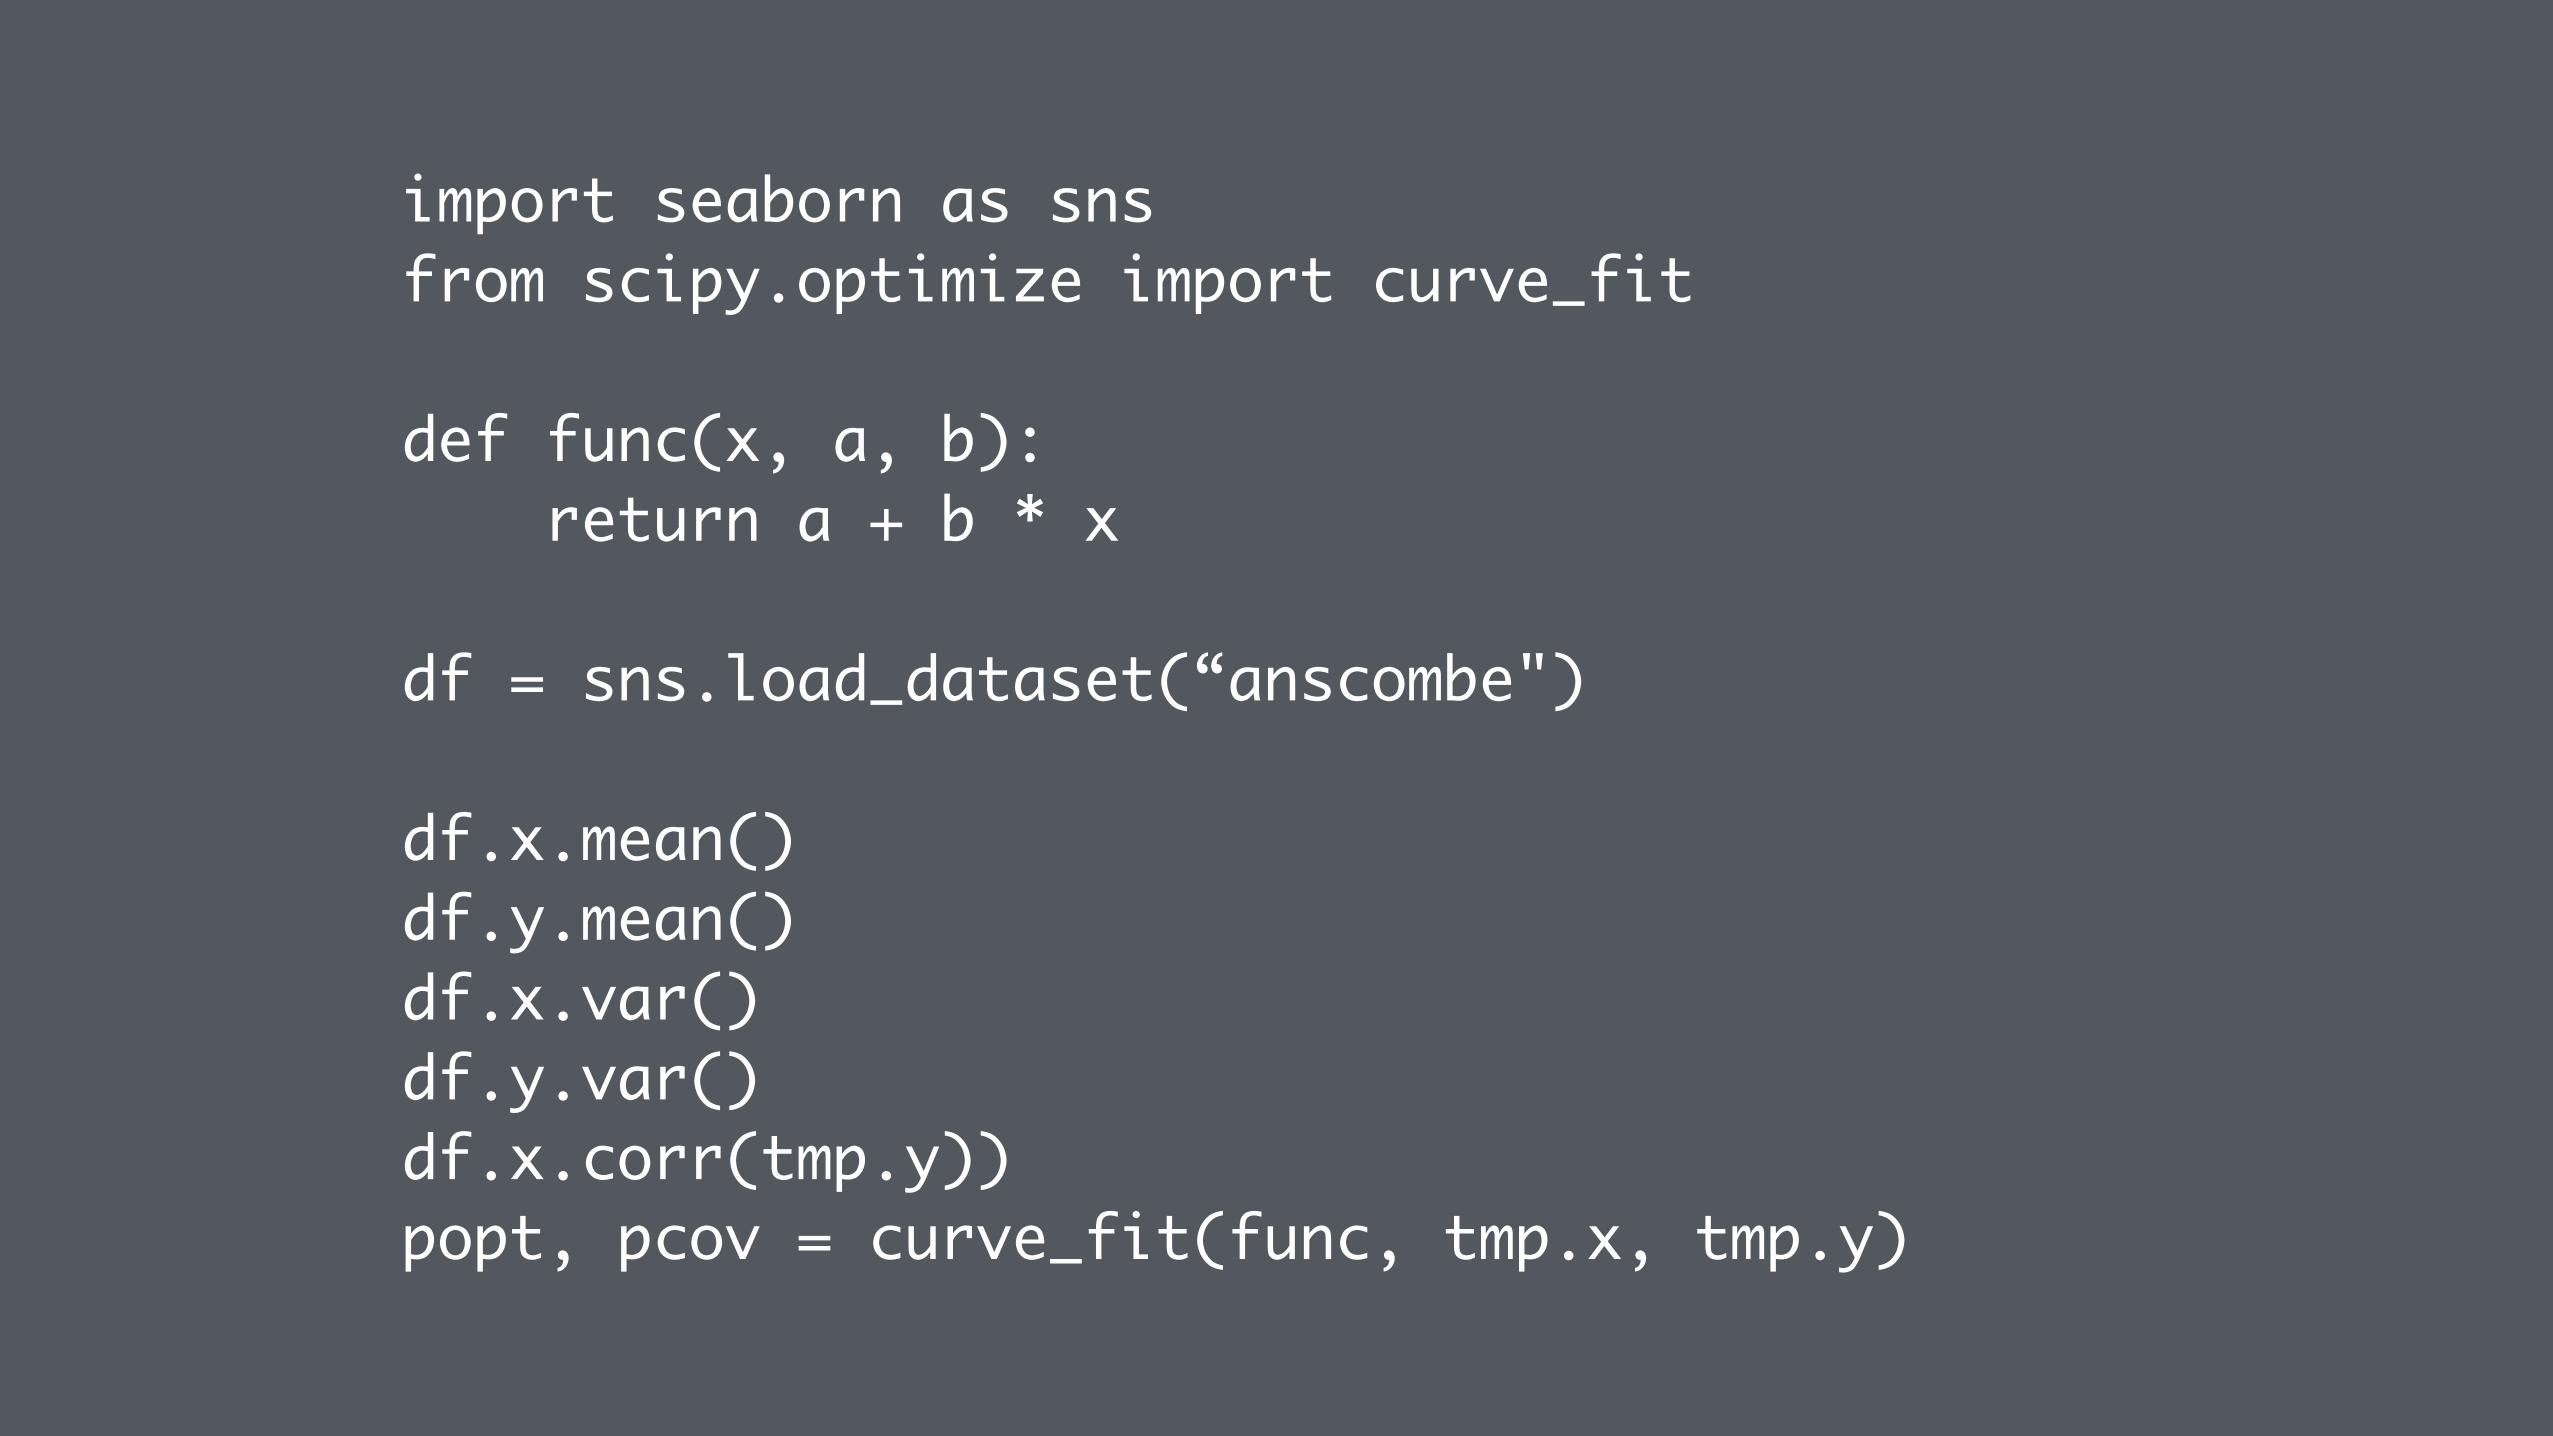
import seaborn as snsfrom scipy.optimize import curve_fit
def func(x, a, b): return a + b * x
df = sns.load_dataset(“anscombe")
df.x.mean()df.y.mean()df.x.var()df.y.var()df.x.corr(tmp.y))popt, pcov = curve_fit(func, tmp.x, tmp.y)

Mean x: 9.0Mean y: 7.5Variance x: 11.00Variance y: 4.13Correlation between x and y: 0.816Linear regression coefficients: y = 3.00 + 0.50x
http://goo.gl/Zuw4Qe

2
4
6
8
10
12
14
y
dataVet I dataVet II
2 4 6 8 10 12 14 16 18 20x
2
4
6
8
10
12
14
y
dataVet III
2 4 6 8 10 12 14 16 18 20x
dataVet IV
dataVetIIIIIIIV

EDA results will affect all that follows

processing speed

faster technology

bigger data

Boundaries
Pushing

You have two options

design your data sample
plan and execute
hit the big red button and wait for the process
to finish


attention span

?

time cost
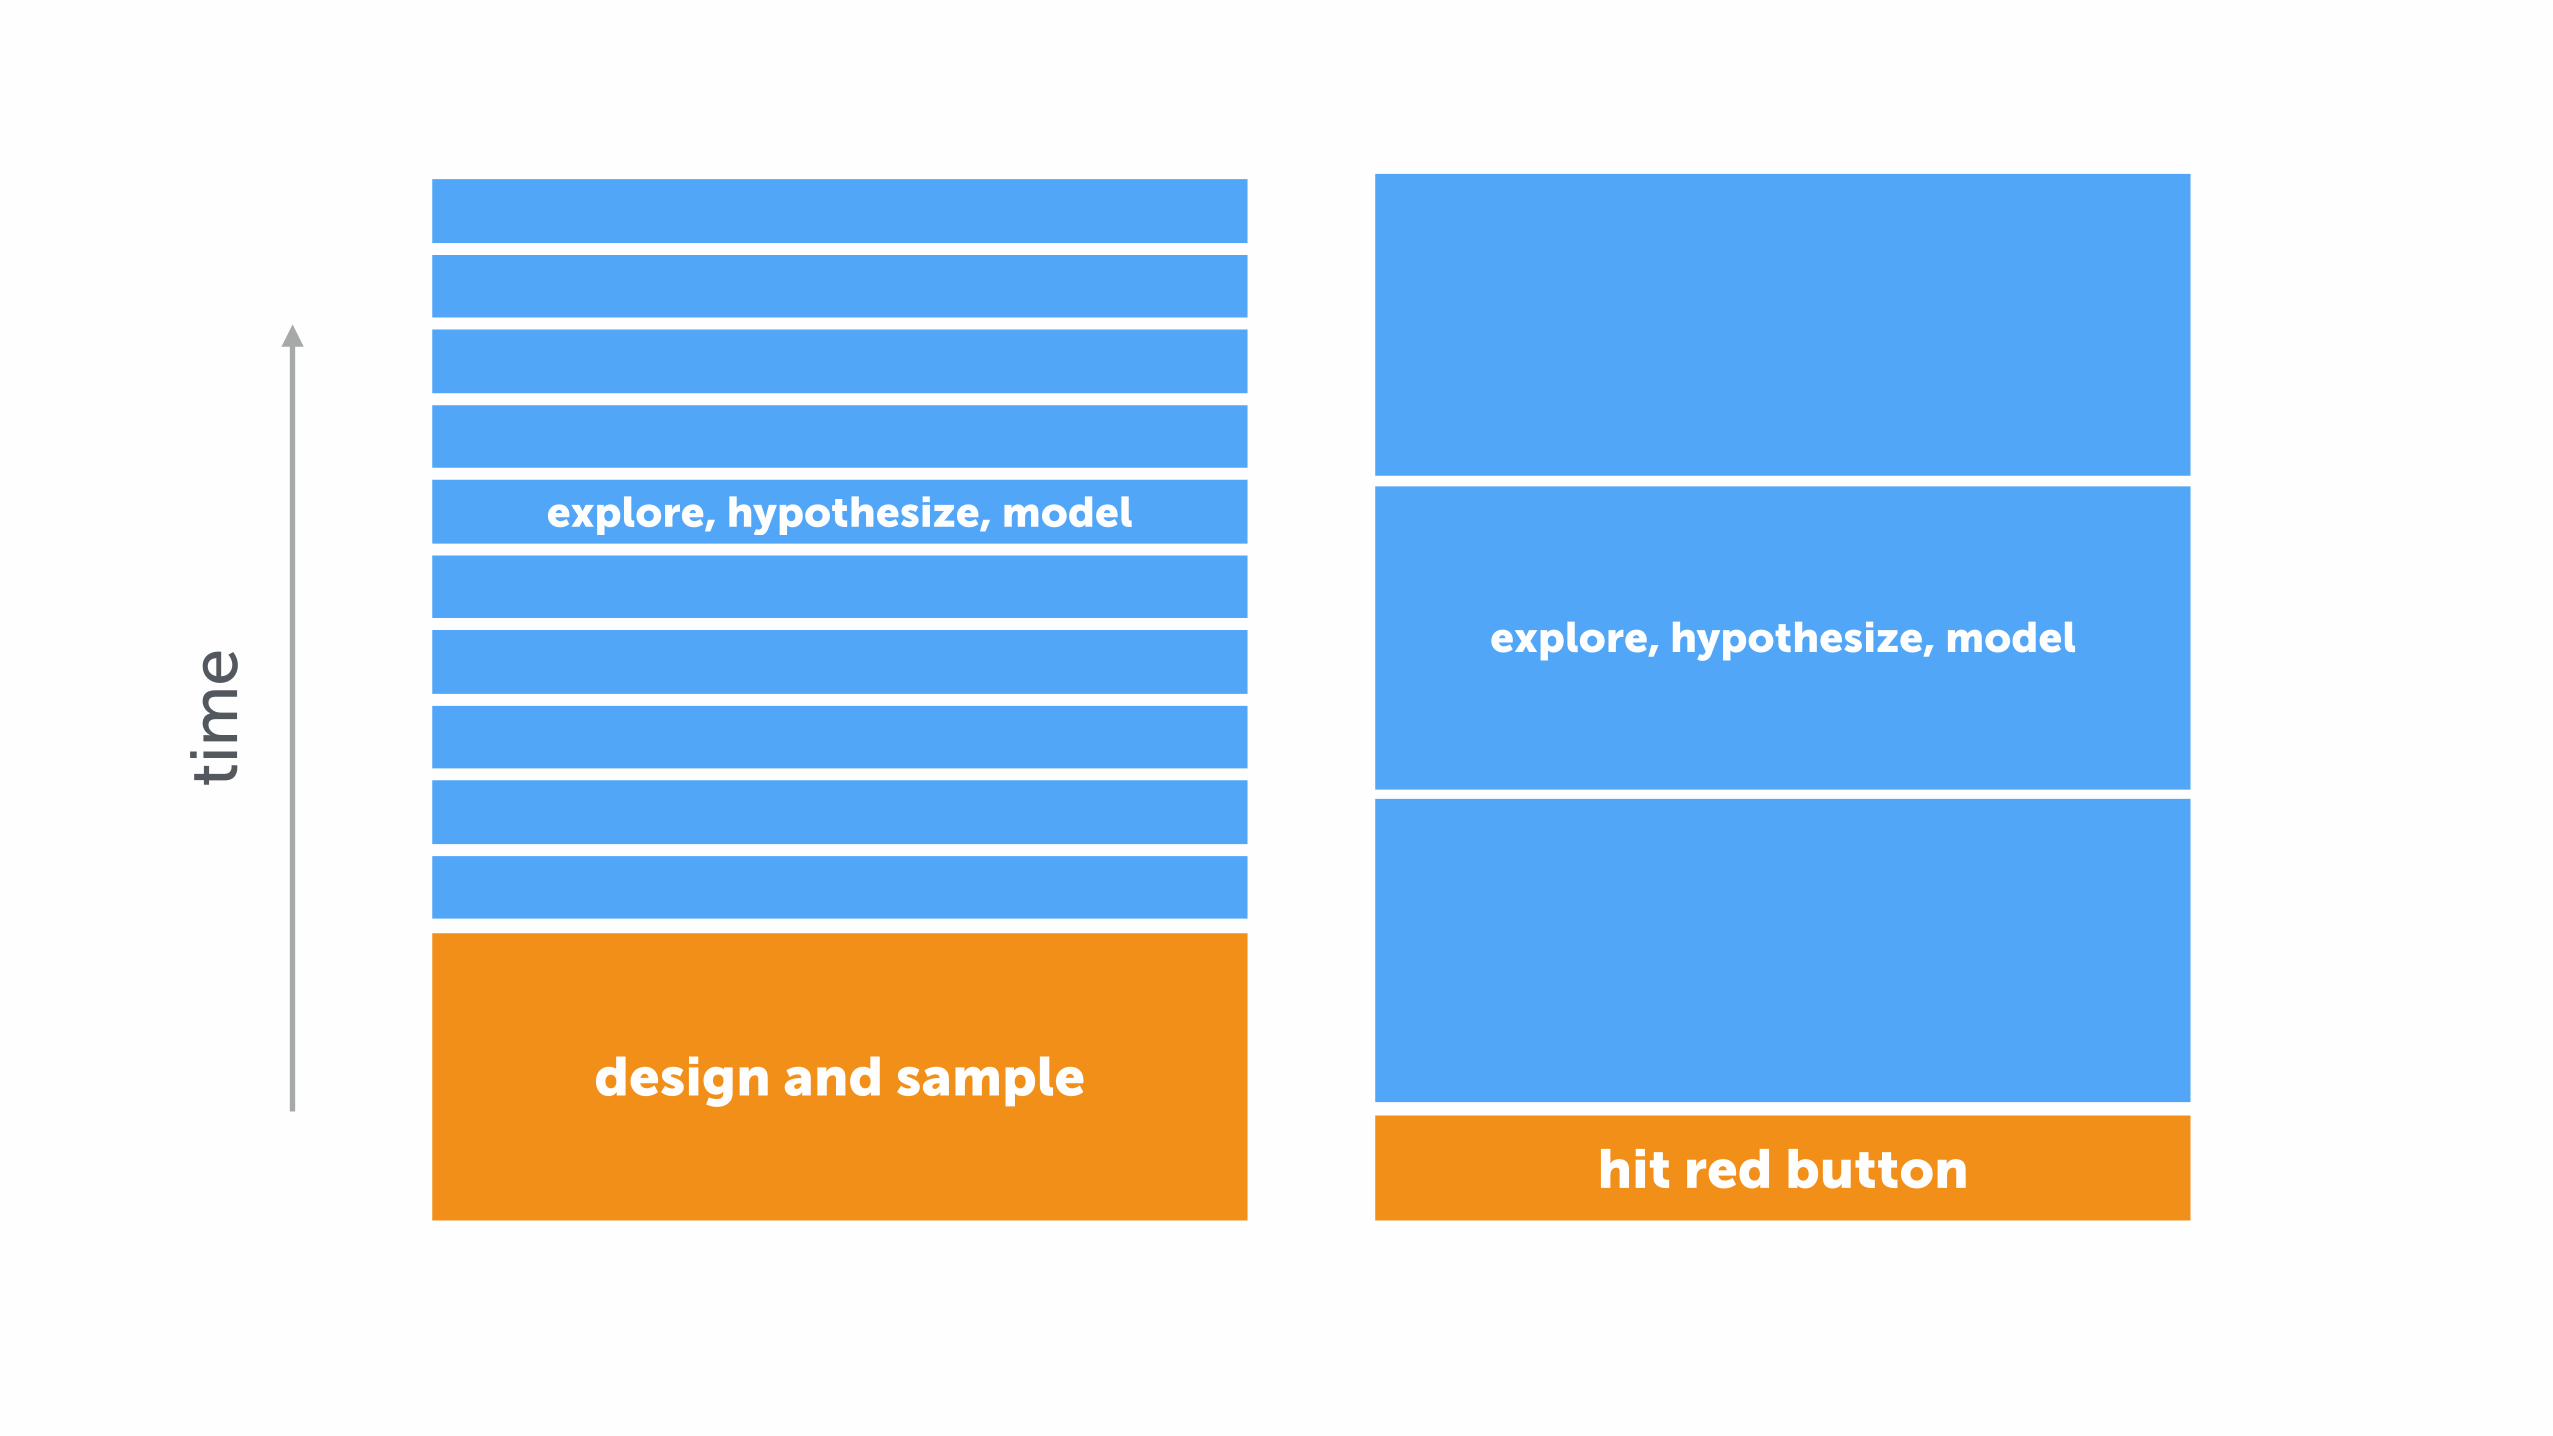
hit red button
design and sample
explore, hypothesize, model
explore, hypothesize, model
tim
e

hit red button
design and sample
explore, hypothesize, model
explore, hypothesize, model
tim
e

fail frequently
learn fast

tried and truemodels and methods

sampling considerations
what you’re sampling priors that you can assume what operations you will run


?