Sample size requirements for testing the …Sample size requirements for testing the effectiveness...
35
Sample size requirements for testing the effectiveness of pulse gear for reducing discards in shrimp fisheries - a power analysis Eelke Folmer and Jaap van der Meer Texel, december 2016 NIOZ Koninklijk Nederlands Instituut voor Onderzoek der Zee
Transcript of Sample size requirements for testing the …Sample size requirements for testing the effectiveness...

Sample size requirements for testing the effectiveness of pulse gear for reducing discards in shrimp fisheries- a power analysis Eelke Folmer and Jaap van der Meer
Texel, december 2016 NIOZ Koninklijk Nederlands Instituut voor Onderzoek der Zee

Sample size requirements for testing the effectivenessof pulse gear for reducing discards in shrimp fisheries
- a power analysisEelke Folmer and Jaap van der Meer
1

Power analysis electric pulse shrimp fishery (09-11-2016)
Contents1 Introduction 3
2 Materials and methods 42.1 Data . . . . . . . . . . . . . . . . . . . . . . . . . . . . . . . . . . . . . 42.2 Exploratory data analysis and transformation . . . . . . . . . . . . . . 52.3 Power analysis . . . . . . . . . . . . . . . . . . . . . . . . . . . . . . . 5
3 Results 83.1 Exploratory Data Analysis . . . . . . . . . . . . . . . . . . . . . . . . 8
3.1.1 Volumes consumption shrimp, undersized shrimp and discards . 83.1.2 Fish discards . . . . . . . . . . . . . . . . . . . . . . . . . . . . 123.1.3 Benthos discards . . . . . . . . . . . . . . . . . . . . . . . . . . 14
3.2 Power analyses . . . . . . . . . . . . . . . . . . . . . . . . . . . . . . . 203.2.1 Volume consumption shrimp . . . . . . . . . . . . . . . . . . . . 203.2.2 Volume undersized shrimp . . . . . . . . . . . . . . . . . . . . . 223.2.3 Volume discards . . . . . . . . . . . . . . . . . . . . . . . . . . . 223.2.4 Fish discards - numbers per species . . . . . . . . . . . . . . . . 223.2.5 Benthos discards - numbers per species . . . . . . . . . . . . . . 25
3.3 Advice for interpretation and use of the power analyses . . . . . . . . . 27
4 Discussion, Conclusion and Recommendations 304.1 Hierarchical design and power analysis . . . . . . . . . . . . . . . . . . 314.2 Recommendations . . . . . . . . . . . . . . . . . . . . . . . . . . . . . . 31
2

Power analysis electric pulse shrimp fishery (09-11-2016)
1 IntroductionIn the Netherlands, most of the brown shrimp fishery takes place at the North Seacoast and in the Wadden Sea. Most of the vessels use conventional fishing methodswith beam trawls and bobbin ropes. The conventional fishing methods are consideredproblematic because of the large quantities of discards of undersized shrimp, fish andbenthos and because of the disturbance of the seafloor.
The Dutch ministry of Economic Affairs and the sector strive for a shrimp fisheriessector which is economically viable and has reduced its ecological impact. Particularly,the selectivity for consumption shrimp should be improved so that seafloor disturbanceand discards may be reduced. Pulse fishing with electro-trawls is considered a promisingmeans to reach these goals (Verschueren et al., 2014; Goldsborough et al., 2014).
The Ministry of Economic Affairs, IMARES and ILVO are in the process of develop-ing a long-term research agenda for the Dutch shrimp fishery industry to resolve severalconcerns and questions regarding electric pulse fishing (Van Marlen et al. 2016, Re-search Agenda). The research agenda includes questions of ecological, socio-economic,technological and management nature. The long-term ecological research questionsconcern selectivity of fishing gear, discards and seafloor disturbance. The ministry ofEconomic Affairs has consulted NIOZ for support with the design of the ecological sur-vey. The main question concerns the number of observations (hauls) that is required tohave sufficient data to draw conclusions about the volume catch of consumption shrimpand the quantities of discards with different fishing gears, i.e. pulse- vs conventionalgear. The number of hauls provides a basis on which the Ministry of Economic Affairscan decide upon the number of vessels and the duration of the ecological survey.
This report provides analyses for the underpinning of the design of the ecologicalsurvey to quantify the effectiveness of electric pulse fishing. Particularly, this reportpresents the results of power analyses on the basis of a pilot study performed by ILVOin collaboration with shrimp fishery vessel HA 31 (Verschueren et al., 2014). The poweranalyses can be used to determine the required number of observations (i.e. hauls) inthe long-term research program. In the following sections we briefly describe the dataset from the pilot study (2), provide a description of statistical methods including abrief theoretical background of power analysis 2.3, perform exploratory data analysis(3.1), give the outcomes of the power analyses (3.2) and discuss the results and providerecommendations (4).
3

Power analysis electric pulse shrimp fishery (09-11-2016)
2 Materials and methods2.1 DataWe obtained data from ILVO who investigated the effectiveness of pulse gear on vesselHA 31 in 2013 (Verschueren et al., 2014). The research of ILVO consisted of surveysof catches and discards with pulse gear and traditional beam-trawl. Surveys of catchestook place on the basis of four fishing trips between 17-19 June 2013 (28 hauls), 2-4September 2013 (27 hauls), 29-31 October 2013 (22 hauls) and 9-10 December 2013 (13hauls). For some of the hauls there is missing data which were excluded from analysis;23, 24, 14 and 10 hauls remained for analysis. Fishing took place in the western DutchWadden Sea in the gullies between Harlingen and Terschelling and Vlieland (mainlyBlauwe slenk and Vliestroom) (Figure 1).
HA 31 fished with an electro-trawl on one beam and a conventional trawl on theother beam. In this way the observations in catches of pulse and conventional gear werepaired which allows for pairwise statistical analyses. We only provide a brief descriptionof the data used in this report. A detailed description of the background, fishing gear,survey setup data collection and results can be found in Verschueren et al. (2014).
The catches of each haul and each gear-type were sorted into three fractions: 1. con-sumption shrimp + small amounts of juvenile flatfish and juvenile round fish, 2. under-sized shrimp + very small fishes, 3. discards: large fishes and larger benthos (amongstothers gudgeons, crabs, bivalves and starfish)1. Measurements followed standard pro-tocols for selectivity research (ICES Selectivity Manual). The following variables weremeasured and derived (Verschueren et al., 2014):
1. Volumes of the three fractions
2. Samples of the fractions consumption and undersized shrimp are taken. Fromthese samples, the shrimps are separated from other animals and possible garbage.Then the volumes of consumption and undersized shrimp are measured. The com-mercial species are counted and the lengths are measured. The non-commercialfish species and invertebrates are counted (but not measured). The total volumesof catch of consumption and undersized shrimp are determined on the basis ofvolume ratios.
3. Sample of discards fraction. From the discards sample, the commercial speciesare measured and non-commercial fish species and invertebrates are counted. Onthe basis of volume ratios the total number of individuals per species (and lengthdistributions in the case of commercial species) are determined.
1The denomination in this report follows from the sorting process. For example, if shrimp ends up inthe discards fraction, it is called discard.
4

Power analysis electric pulse shrimp fishery (09-11-2016)
Because the durations of the hauls varied (between 35 and 125 minutes) we standardizedthe volumes by dividing by the duration of the hauls. Catch rates are measured in literper hour and number per hour.
2.2 Exploratory data analysis and transformationWe first performed exploratory data analysis (EDA) to summarize the main character-istics of the data. Particularly, we visualized the main variance components by meansof box-plots and used pair-wise scatter plots to visualize differences between the catchesand discards with standard and pulse gear. On the basis of measured lengths (cm) andspecies specific parameters obtained from fishbase (www.fishbase.org), we also deter-mined the biomass (g) per species on the basis of the empirical relationship W = a×Lb.For the five most abundant species (plaice, whiting, sole, tad, cod) we used species spe-cific parameters to compute the mass. For the other species, which make up only afraction of the total fish biomass, we assumed a=0.0075 and b=3.0. After providing in-sight into the data we construct the response variables that are used for power analysis.Because the observations in catches of pulse and conventional gear are paired by surveydesign, the ln-ratio transformation (ln( Vpulse
Vstandard)) of volumes and number of specimens
(ln( Npulse
Nstandard)) can be used for power analysis. This transformation simplifies the power
analyses in that the transformed data are consistent with normality while the volumemeasurements are not. Ln-ratio transformation was not applied when both the numberof individuals under the pulse and under the standard beams were zero.
2.3 Power analysisStatistical power is the probability that a test detects an effect, given that the ef-fect exists (e.g. Cohen, 1977; Quinn and Keough, 2002). Statistical power analysis ismethodology used to increase efficiency of research efforts. Power analyses are usedin the design phases of research and are used to estimate the sample size necessary toachieve a high probability of detecting biologically significant effects. Power analysesare also useful in that they help to consider various critical aspects of the study andstatistical analysis.
There are four inter-related parameters: power, effect size, sample size and alpha.These parameters are related such that each is a function of the other three. For in-stance, a large effect is easier to detect than a small effect and thus requires a smallersample size. While an effect may exist, it is not necessarily relevant from an ecologicalor management perspective. For example, a discard reduction of 2% may be detectedwith a large sample size, but such a small effect may not be sufficient to justify re-quired investments. Hence, the power analyses to determine sample size should also beassessed at effect size levels that the commissioner considers relevant. For the presentresearch project, the assessment of relevant effect size was done by the researchers in
5

Power analysis electric pulse shrimp fishery (09-11-2016)
collaboration with the Ministry of Economic Affairs. Particularly, a change in catchof consumption shrimp of 10% and 30% reduction of discards are considered relevanteffect sizes.
Because the ln-ratios appeared to be Normally distributed and because the samplesize of the planned research will be relatively large, for convenience a z-test rather thana t-test is used (and the power analysis is adopted to this). The null hypothesis is thatthe expected ln-ratio μ equals zero (no difference between the two types of trawl, hencea mean ratio of one and a ln of that ratio of zero). So H0: μ = μ0 = 0. The test-statistic, which is the difference between the mean ln-ratio and its expectation dividedby its standard error,
z = x − μ0√σ2/n
(1)
will be standard Normally distributed (that is, the mean of z is zero and its varianceis 1) if the null hypothesis is true. Note that x is the sample mean ln-ratio. If thealternative hypothesis H1: μ = μ1 is true, the test statistic will no longer be standardNormally distributed, but will follow a Normal distribution with a mean of μ1/
√σ2/n
(but still a variance of 1). The power of the one-sided z-test then equals the probabilitythat the test statistic is larger than zα (or smaller than −zα). For a two-sided test α/2is used instead of α. The power thus depends upon the effect size μ1 and the samplesize n; the larger the effect size or the larger the sample size, the larger the power. Itcan (easily) be shown that the sample size required to obtain a power of 1 − β for theone-sided z-test equals n =
( (zα+zβ)σμ1
)2.
The sample size requirements to detect potential differences between pulse andstandard gear (i.e. the ln-ratios) were determined for:
• Volume catch of consumption shrimp
• Volume catch of undersized shrimp
• Total volume of discards (fish and benthos species together)
• Number of individuals of the discard fish species
• Number of individuals of the 24 most caught discard benthos species
6

Power analysis electric pulse shrimp fishery (09-11-2016)
Figure 1: Overview of the four fishing trips of HA 31 in June, September, October andDecember 2013. The arrows represent the starting and end-points of the hauls; the haulswere not necessarily straight.
7

Power analysis electric pulse shrimp fishery (09-11-2016)
3 Results3.1 Exploratory Data Analysis3.1.1 Volumes consumption shrimp, undersized shrimp and discards
Figure 2a shows the basic statistics of catch rates (C in l/h) of consumption shrimp,undersized shrimp and discards with standard and pulse gear for the months June,September, October and December. The catch rates of consumption shrimp are highestin September and October. Catch rates of consumption shrimp are not obviouslydifferent between pulse and standard gear. The catch rates of undersized shrimp followthe same seasonal pattern as consumption shrimp. There is a slight reduction in thecatch rates of undersized shrimp with pulse gear. There is no obvious seasonal patternin the discard catch rates other than that the rates are lowest in December. Figure 2bshows the pair-wise catch rates of consumption, and undersized shrimp and discard. Thecatch rates of consumption shrimp with standard and pulse gear during the same haulsare relatively similar. The catch rates of undersized shrimp and discards are clearlylower with pulse gear; these effects are strongest when the catch rates of undersizedshrimp and discards are high.
As an aside we present the effectiveness of the pulse gear in relation to the con-ventional gear for the different months (Figure 3). Effectiveness is described as thecatch rate of consumption shrimp in relation to the catch rate of undersized shrimpand discards. As also illustrated in Figure 2b, overall, there is reduction in the catchrate of undersized shrimp relative to the catch rate of consumption shrimp (the greendots are mostly below the red dots). Although there are clear differences between themonthly catch rates of consumption shrimp and undersized shrimp, there are no obviousseasonal patterns in the effectiveness of reducing the catch rates of undersized shrimp.The effectiveness of the electric pulse gear in reducing the catch rates of discard arehigh in all months. October is a particularly interesting month in that the catch ratesof discard were low while the catch rates of consumption shrimp were high (Figure 2b,lower panel).
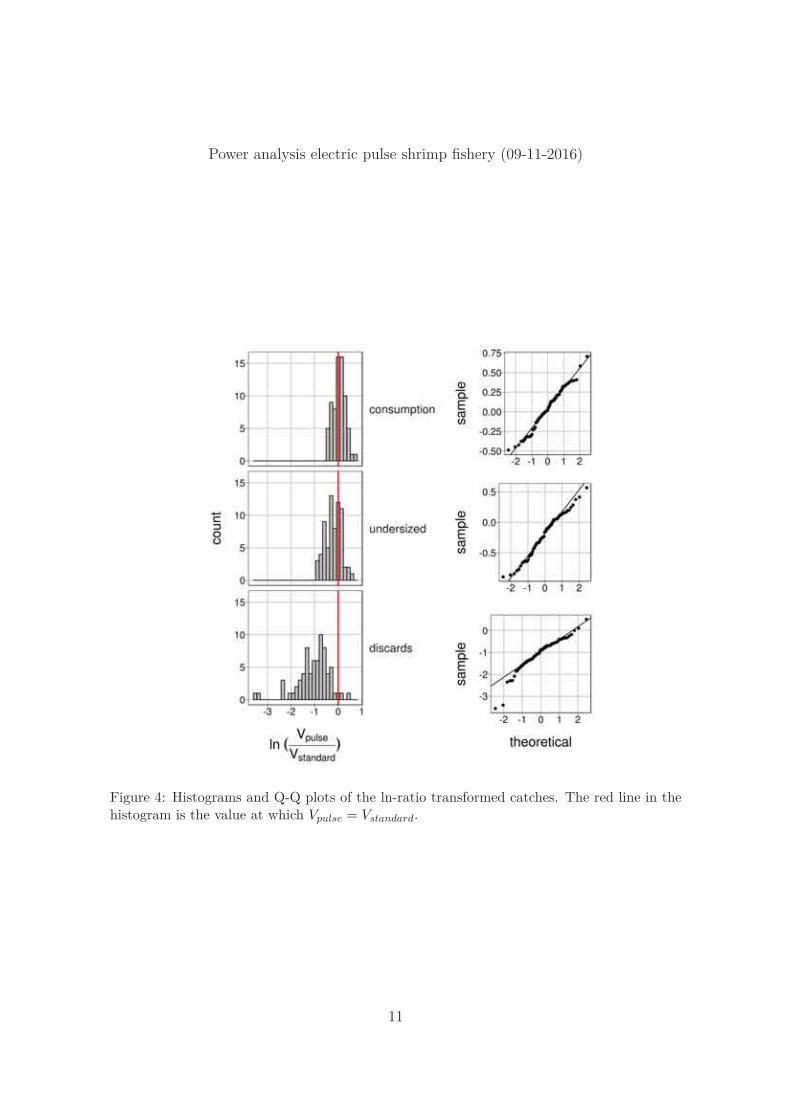
Although the original catch data are highly skewed, the histograms and Q-Q plotsshow that the ln-ratio transformed data are reasonably consistent with normality (Fig-ure 4). In the case of discard volumes, the left tail is somewhat stretched. We thereforeperform the power analysis based on the assumption that a z-test will be used for testingfor differences with survey data.
8

Power analysis electric pulse shrimp fishery (09-11-2016)
(a) (b)
Figure 2: Catch rates of consumption shrimp, undersized shrimp and discards per haul withstandard and pulse gear. (a) Boxplots of catch rates of consumption shrimp, undersizedshrimp and discards with standard and pulse gear for the months June, September, Octoberand December. (b) Scatterplot for pairwise comparison of catch rates of consumption shrimp,undersized shrimp and discards with standard and pulse gear.
9

Power analysis electric pulse shrimp fishery (09-11-2016)
Figure 3: Effectiveness of the pulse gear versus standard gear for the different months. Effec-tiveness is the catch rate (C) of consumption shrimp caught in relation to the catch rate ofundersized shrimp (top panel) and discards (bottom panel).
10
Power analysis electric pulse shrimp fishery (09-11-2016)
Figure 4: Histograms and Q-Q plots of the ln-ratio transformed catches. The red line in thehistogram is the value at which Vpulse = Vstandard.
11
Power analysis electric pulse shrimp fishery (09-11-2016)
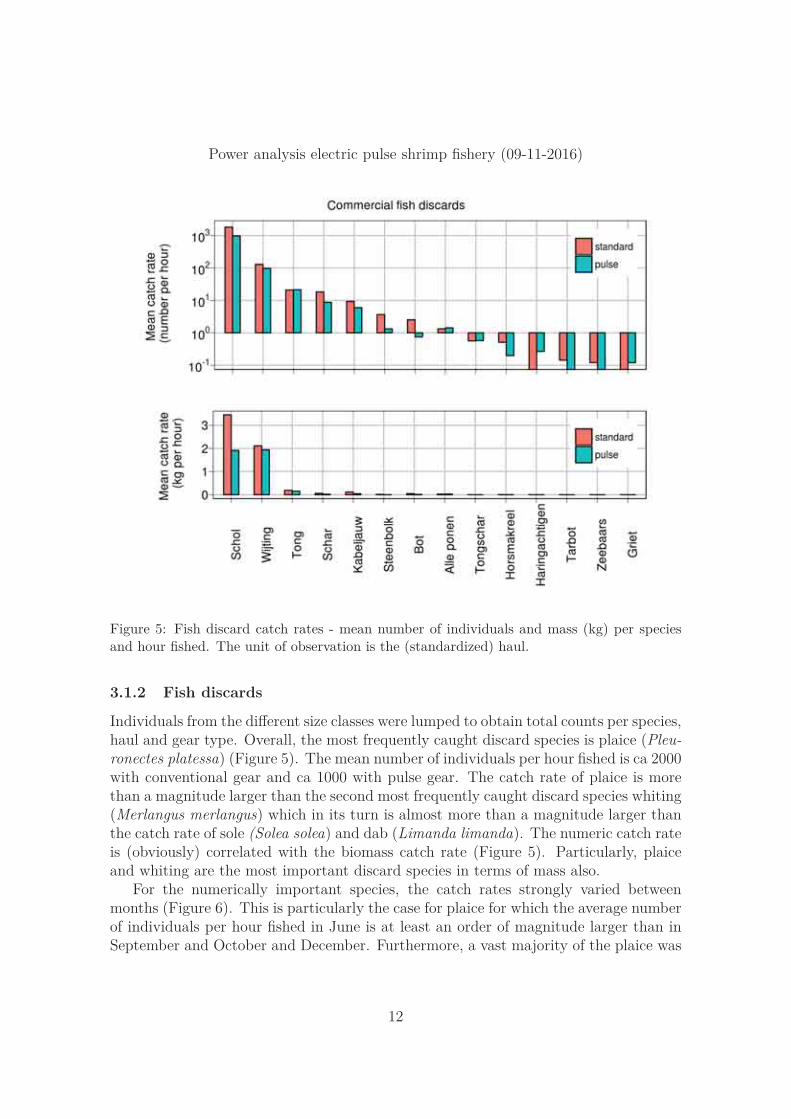
Figure 5: Fish discard catch rates - mean number of individuals and mass (kg) per speciesand hour fished. The unit of observation is the (standardized) haul.
3.1.2 Fish discards
Individuals from the different size classes were lumped to obtain total counts per species,haul and gear type. Overall, the most frequently caught discard species is plaice (Pleu-ronectes platessa) (Figure 5). The mean number of individuals per hour fished is ca 2000with conventional gear and ca 1000 with pulse gear. The catch rate of plaice is morethan a magnitude larger than the second most frequently caught discard species whiting(Merlangus merlangus) which in its turn is almost more than a magnitude larger thanthe catch rate of sole (Solea solea) and dab (Limanda limanda). The numeric catch rateis (obviously) correlated with the biomass catch rate (Figure 5). Particularly, plaiceand whiting are the most important discard species in terms of mass also.
For the numerically important species, the catch rates strongly varied betweenmonths (Figure 6). This is particularly the case for plaice for which the average numberof individuals per hour fished in June is at least an order of magnitude larger than inSeptember and October and December. Furthermore, a vast majority of the plaice was
12

Power analysis electric pulse shrimp fishery (09-11-2016)
Figure 6: Monthly mean catch rates of the 14 most caught discard fish species with standardand pulse gear.
caught in one of the hauls during the fishing trip in June. Whiting shows a similar,though not as pronounced pattern in that the average catch rates in June and Septem-ber are around 100 individuals per hour while in October and December only severalindividuals are caught per hour. The other less frequently caught species don’t showequally strong seasonal differences, although overall, the catch rates tended to be lowerin autumn and winter than in the summer months.
The scatterplots in Figure 7 show the pair-wise catch rates with standard versuspulse gear for each haul and species. For plaice, in nearly all cases the catch rate waslower with pulse gear than with standard gear. In the case of whiting, for most of thehauls, the catch rates were similar between pulse and standard gear. However, in a fewcases when the caught numbers of individual whitings were large, the catch rates withpulse gear were significantly lower than the catch rates with standard gear. For sole
13

Power analysis electric pulse shrimp fishery (09-11-2016)
Figure 7: Scatterplot for pairwise comparison of catch rates of individuals for the 14 mostcaught fish species with standard and pulse gear.
and dab there are no apparent differences between the catch rates with conventionaland pulse gear.
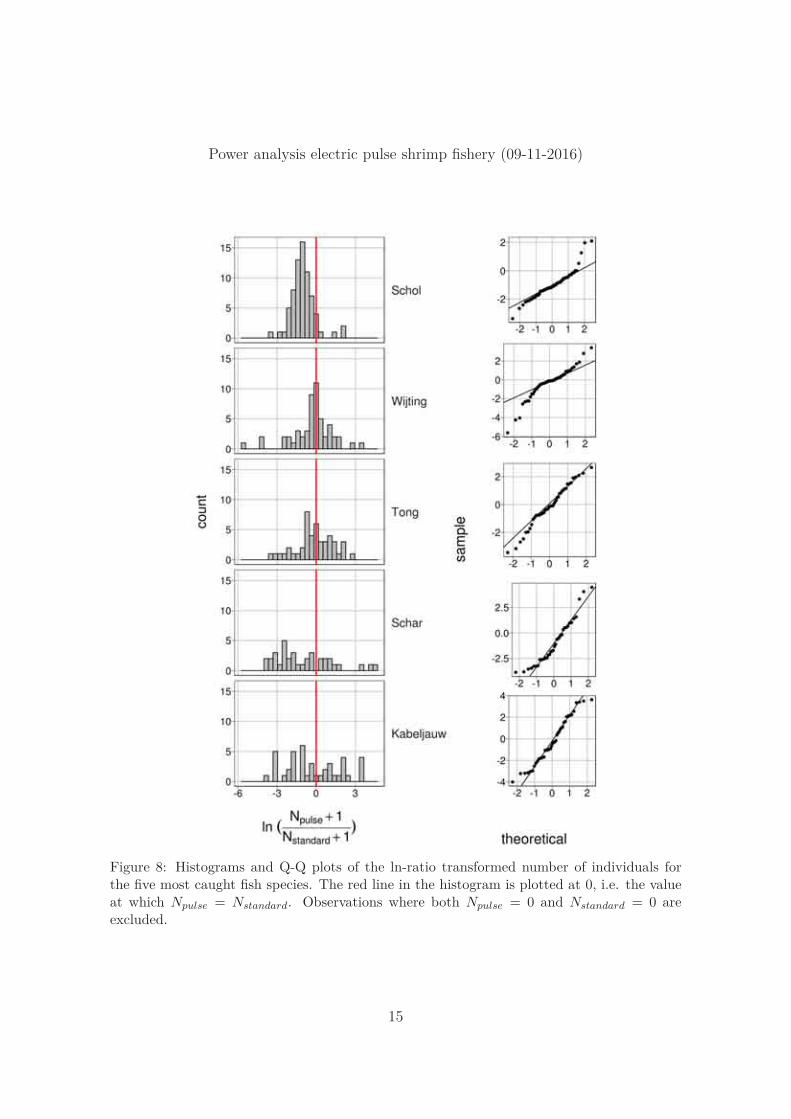
The histograms and Q-Q plots show that the ln-ratio transformed data (of the num-ber of caught individuals) are reasonably consistent with normality (Figure 8) althoughthe distribution of plaice is peaked and whiting and dab are somewhat long-tailed. Justas in the case of the volumes of consumption shrimp, undersized shrimp and discards,we do the power analysis based on the assumption that a z-test will be used for testingfor differences with survey data.
3.1.3 Benthos discards
The most frequently caught benthos species and species groups are the gudgeons (Po-matoschistus microps and Pomatoschistus minutus), shrimp (Crangon crangon)1, crabs(Liocarcinus holsatus and Carcinus maenas), herring-like species, blue mussels (Mytilus
1Shrimp probably ends up in the discard fraction due to the sorting process.
14
Power analysis electric pulse shrimp fishery (09-11-2016)
Figure 8: Histograms and Q-Q plots of the ln-ratio transformed number of individuals forthe five most caught fish species. The red line in the histogram is plotted at 0, i.e. the valueat which Npulse = Nstandard. Observations where both Npulse = 0 and Nstandard = 0 areexcluded.
15
Power analysis electric pulse shrimp fishery (09-11-2016)
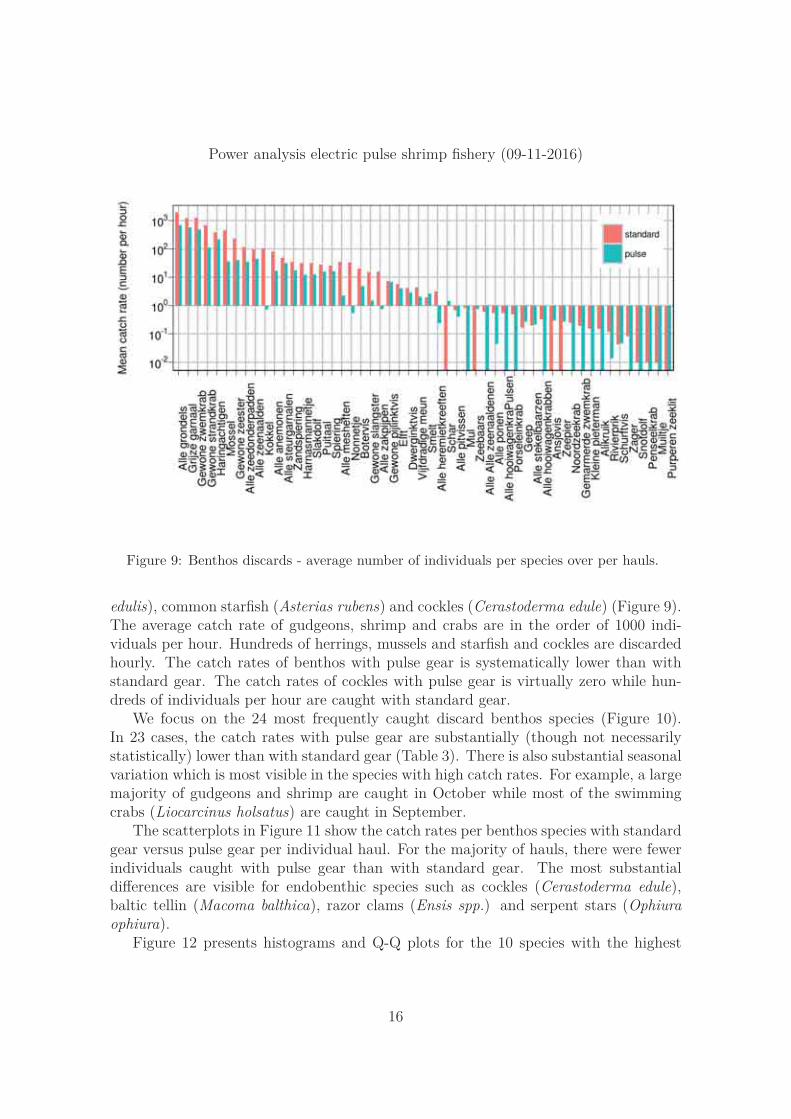
Figure 9: Benthos discards - average number of individuals per species over per hauls.
edulis), common starfish (Asterias rubens) and cockles (Cerastoderma edule) (Figure 9).The average catch rate of gudgeons, shrimp and crabs are in the order of 1000 indi-viduals per hour. Hundreds of herrings, mussels and starfish and cockles are discardedhourly. The catch rates of benthos with pulse gear is systematically lower than withstandard gear. The catch rates of cockles with pulse gear is virtually zero while hun-dreds of individuals per hour are caught with standard gear.
We focus on the 24 most frequently caught discard benthos species (Figure 10).In 23 cases, the catch rates with pulse gear are substantially (though not necessarilystatistically) lower than with standard gear (Table 3). There is also substantial seasonalvariation which is most visible in the species with high catch rates. For example, a largemajority of gudgeons and shrimp are caught in October while most of the swimmingcrabs (Liocarcinus holsatus) are caught in September.
The scatterplots in Figure 11 show the catch rates per benthos species with standardgear versus pulse gear per individual haul. For the majority of hauls, there were fewerindividuals caught with pulse gear than with standard gear. The most substantialdifferences are visible for endobenthic species such as cockles (Cerastoderma edule),baltic tellin (Macoma balthica), razor clams (Ensis spp.) and serpent stars (Ophiuraophiura).
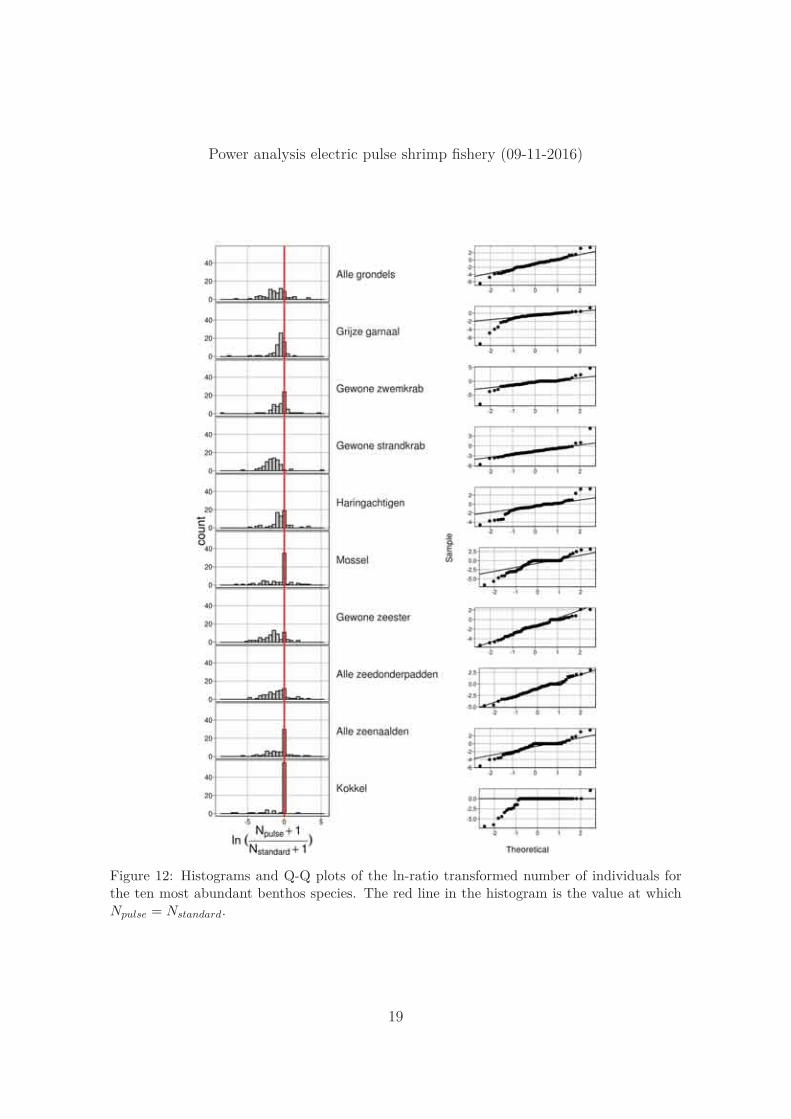
Figure 12 presents histograms and Q-Q plots for the 10 species with the highest
16

Power analysis electric pulse shrimp fishery (09-11-2016)
Figure 10: Benthos discards per month and gear type - average number individuals per haul(of the 24 most caught species).
17

Power analysis electric pulse shrimp fishery (09-11-2016)
Figure 11: Scatterplot for pairwise comparison of the catch rates with standard and pulsegear for the 24 most frequently caught benthos species.
catch rates. It shows that for most species the ln-ratio transformed data are reasonablyconsistent with normality. However, some of the species have distributions with rela-tively long tails caused by few observations. Other species such as cockle and musselare strongly peaked at 0 which is due to the fact that these species are hardly caughtwith pulse gear. In these cases the normality assumption is invalid. This is howevernot problematic for the outcome of the power analysis because of the fact that largedifferences between the discards of pulse and standard gear may be detected with highprobability. Hence, we will apply the z-distribution for the power analysis.
18
Power analysis electric pulse shrimp fishery (09-11-2016)
Figure 12: Histograms and Q-Q plots of the ln-ratio transformed number of individuals forthe ten most abundant benthos species. The red line in the histogram is the value at whichNpulse = Nstandard.
19

Power analysis electric pulse shrimp fishery (09-11-2016)
Figure 13: Statistical power curves for detecting differences in catch rates of consumptionshrimp with pulse and conventional gear. The left panel shows the power curves for Power =0.8 and the right panel for Power = 0.9. The green lines are the power curves for the measuredstandard deviation of the ln-ratio of the catches of consumption shrimp (SD = 0.26). Thered and the blue lines are plotted to provide insight into sample size requirements if the datawere more variable (blue line, SD = 0.36) or less variable (red line, SD = 0.16). The dashedlines are plotted at the effect sizes set during the meeting with Economic Affairs (10% and30% differences): ln(0.7) = −0.36, ln(0.9) = −0.11, ln(1.1) = 0.10 and ln(1.3) = 0.26.
3.2 Power analyses3.2.1 Volume consumption shrimp
The difference in catch rates of the volume of consumption shrimp between the pulseand standard gear is positive but small (ln-ratio: μ̂ = 0.04 and SD = 0.26) (Table1). This corresponds to Vpulse
Vstandard= 1.04, i.e. a 4% higher catch rate with pulse gear on
average. Because there is no good reason to presume that the catch rates of consumptionshrimp should be either higher or lower we allow for both possibilities (i.e. negativeand positive ln-ratio); hence we did a power analysis for two-sided testing (Figure 13).
20

Power analysis electric pulse shrimp fishery (09-11-2016)
catch ratio lnratio SD sided n0.5 n0.7 n0.9 n0.95 n1.05 n1.1 n1.3consumption 1.04 0.04 0.26 two 2 5 49 203 224 59 8undersized 0.82 -0.20 0.34 one 2 6 65 271 299 79 11discard 0.35 -1.04 0.71 one 7 25 278 1170 1293 339 45
Table 1: The average ratio ( Vpulse
Vstandard) and average ln-ratio ln( Vpulse
Vstandard) of the volumes catch
of consumption shrimp, undersized shrimp and discards. SD is the standard deviation of theln-ratio of the volumes. The column sided denotes whether a one-sided or two-sided z-test isanticipated. The columns with labels starting with n give the sample sizes required to detectdifferent effect sizes with 80% power and α = 0.05. For example, the column n1.3 gives therequired sample size to detect a ratio of 1.3, i.e. an increase of 30%.
21

Power analysis electric pulse shrimp fishery (09-11-2016)
Figure 14: Statistical power curves for detecting differences in the catch rates of undersizedshrimp.
3.2.2 Volume undersized shrimp
The catch rates of the volume of undersized shrimp under the electric pulse beam wason average 82% of the catch rate with standard gear (Table 1). This is a clear effect andthere is probably a reason why less undersized shrimp is caught with electric pulse gear.We therefore did power analyses for one-sided z-tests. The variability for undersizedshrimp was, however, substantially higher than for consumption shrimp (SD = 0.34).
3.2.3 Volume discards
The catch rate of the volume of discards under the pulse beam was on average a fractionof 0.35 of the catch rate under the standard beam. The standard deviation was 0.71.The catch rate reduction of discards is very large so we did power analyses for one-sidedtesting.
3.2.4 Fish discards - numbers per species
For all fish species we computed the required sample sizes to detect Npulse
Nstandardratios of
0.5, 0.7, 0.9, 1.1 and 1.3 with 80% power and α = 0.05 with two-sided z-tests (Table2). We focus on the five main fish species plaice, whiting, sole, dab and cod.
22

Power analysis electric pulse shrimp fishery (09-11-2016)
Figure 15: Statistical power curves for detecting differences in the catch rates of discards.
23

Power analysis electric pulse shrimp fishery (09-11-2016)
species ratio lnratio SD nhauls n0.5 n0.7 n0.9 n1.1 n1.3Schol 0.36 -1.01 0.92 74 14 53 599 732 97Wijting 0.70 -0.36 1.64 55 44 166 1902 2324 307Tong 0.93 -0.07 1.41 47 33 123 1406 1718 227Schar 0.37 -0.99 2.16 37 77 288 3299 4032 532Kabeljauw 0.78 -0.25 2.15 44 76 286 3269 3994 528Steenbolk 0.43 -0.85 2.44 17 98 368 4210 5145 679Bot 0.36 -1.02 1.41 24 33 123 1406 1718 227Alle ponen 1.09 0.09 1.99 17 65 245 2801 3422 452Tongschar 1.33 0.28 2.27 6 85 318 3644 4453 588Horsmakreel 0.90 -0.11 1.81 4 54 203 2317 2831 374Haringachtigen 20.00 3.00 1Tarbot 0.06 -2.89 1Zeebaars 0.10 -2.28 1Griet 13.00 2.56 1
Table 2: The discard fish species with the observed ratio ( Npulse
Nstandard), ln-ratio ln( Npulse
Nstandard),
standard deviation of the ln-ratio (SD), number of hauls during which the species was caught(nhauls) and the computed sample sizes required to detect different effect sizes with 80%power and α = 0.05 with a two-sided z-test. The standard deviation and therefore the samplesize requirements can only be computed when nhauls is greater than 1.
24

Power analysis electric pulse shrimp fishery (09-11-2016)
3.2.5 Benthos discards - numbers per species
We have computed required sample sizes to detect Npulse
Nstandardratios of 0.5, 0.7, 0.9, and
1.3 for the 24 main benthos species with 80% power and α = 0.05 with one-sided z-tests(Table 2). The reason for choosing a one-sided test is that the pulse gear is much lighterand hovers above the seafloor which especially reduces benthos discards (Verschuerenet al., 2014). The standard deviation varies widely between the different benthos speciesranging from SD=2.81 for sand eel (Ammodytes marinus) and SD=1.42 for shore crab(Carcinus maenas).
25

Power analysis electric pulse shrimp fishery (09-11-2016)
species ratio lnratio SD nhauls n0.5 n0.7 n0.9 n1.3Alle grondels 0.32 -1.15 1.69 73 37 139 1591 257Grijze garnaal 0.53 -0.64 1.44 74 27 101 1155 187Gewone zwemkrab 0.51 -0.68 1.81 53 43 160 1825 295Gewone strandkrab 0.22 -1.51 1.42 74 26 98 1124 182Haringachtigen 0.55 -0.60 1.46 66 28 104 1188 192Mossel 0.31 -1.18 2.44 42 77 290 3316 535Gewone zeester 0.22 -1.52 1.66 66 36 134 1535 248Alle zeedonderpadden 0.31 -1.16 1.73 63 39 146 1667 269Alle zeenaalden 0.29 -1.23 1.83 43 44 163 1866 301Kokkel 0.08 -2.56 2.46 16 78 295 3371 544Alle anemonen 0.17 -1.75 2.49 67 80 302 3454 557Alle steurgarnalen 1.01 0.01 1.99 33 51 193 2206 356Zandspiering 0.59 -0.53 2.81 44 102 384 4398 710Harnasmannetje 0.29 -1.22 1.61 47 34 126 1444 233Slakdolf 0.63 -0.45 1.85 49 45 167 1907 308Puitaal 0.67 -0.40 1.82 44 43 161 1845 298Spiering 0.97 -0.03 1.79 45 42 156 1785 288Alle mesheften 0.42 -0.86 2.41 19 75 283 3235 522Nonnetje 0.14 -1.99 2.11 15 58 217 2480 400Botervis 0.20 -1.59 2.50 38 81 304 3481 562Gewone slangster 0.14 -1.99 2.39 21 74 278 3182 514Alle zakpijpen 0.12 -2.14 1.92 17 48 180 2054 332Gewone pijlinktvis 1.06 0.06 2.18 17 62 231 2647 427Elft 1.33 0.29 1.52 12 30 113 1287 208
Table 3: The 24 main benthos discards species with the observed ratio ( Npulse+1Nstandard+1
), ln-ratio
ln( Npulse
Nstandard) and standard deviation of the ln-ratio (SD) and sample size requirements to
detect different effect sizes with 80% power and α = 0.05 with a one-sided z-test.
26

Power analysis electric pulse shrimp fishery (09-11-2016)
3.3 Advice for interpretation and use of the power analysesThe purpose of this section is to support the use of the tables and figures producedin the previous sections. As described in section 1, the main questions of the ministryof Economic Affairs concerns the required number of hauls to have sufficient data todraw conclusions about the differences in volume catch of consumption shrimp and thequantities of discards with different fishing gears. The number of hauls provides a basison which the Ministry of Economic Affairs can decide upon the number of vessels andthe duration of the ecological survey. In the following paragraphs we provide examplesof how to use the tables to determine the number of required hauls for a number ofspecific questions.
Consumption shrimp During the meeting with the Ministry of Economic affairs itwas decided that 10% difference (positive or negative) in catch rates is relevant andshould be detected. In other words, if the true difference between catch with electricand standard gear is greater or lesser than 10%, it should be detected at a power of80%. Table 1 provides the outcomes of the power analyses for the catch of consumptionshrimp. From table 1, column ’n0.9’ (column ’n0.9’ gives the required sample size todetect a ratio of 0.9, i.e. a decrease of 10%) it can be read that if the true effect sizeis 0.9, the required number of observations is 49; if the effect size is 1.1 (+10%), thenumber of observations is 59.
If the true difference in catch rates of consumption shrimp were +30% (i.e. 30%more catch with pulse gear, effect size ln(1.3) = 0.26), the minimum sample size toobserve it at a power of 80% is 8. If the true difference in catch rates were -30% (effectsize ln(0.7) = −0.36), the minimum sample size to observe it at a power of 80% is 5(dashed lines in the left panel of Figure 13 and Table 1). The data from the HA 31pilot suggests that the difference in the fished period is around 4%. Detection of sucha small effect requires a large number of hauls. Particularly, if the true difference incatch rates were +5%, the minimum number of hauls to observe it at a power of 80%is 224. If the true difference in catch rates were -5%, the minimum number of hauls toobserve it at a power of 80% is 203.
Undersized shrimp On the basis of economic arguments, changes in bycatch of un-dersized shrimp might not be as important as changes in catch of consumption shrimp.One might argue that an increase of +30% of undersized shrimp is relevant to detect.In that case, the minimum required sample size is 11. If on the basis of ecologicalarguments, a reduction of -30% is considered relevant, the minimum sample size toobserve it at a power of 80% is 6 (Figure 14 and Table 1). If it is assumed that thetrue reduction of catch of undersized shrimp is 10% (effect size of ln(0.9) = −0.11) anda power of 80% is required, the sample size should be 65. If 90% power is required,the sample sizes should be 90 to observe 10% true reduction and 8 to observe 30% true
27

Power analysis electric pulse shrimp fishery (09-11-2016)
reduction of catch rates of undersized shrimp.
Discards During the meeting with the Ministry of Economic affairs it was decidedthat if a 30% difference in catch rates of discard exists, it needs to be detected with apower of 80%. For this situation the sample size should be 25 (Table 1). In case 90%power is required, a sample size of at least 34 is needed. If it is assumed that the truecatch rate reduction is only 10% (effect size of ln(0.9) = −0.11) and a power of 80%is required, the sample size should be 278. If it is assumed that the true catch ratereduction is 50% (effect size of ln(0.5) = −0.69) and a power of 80% is required, thesample size only needs to be 7.
Fish discards As above, if a 30% difference in fish discard exists, the requirement ofthe ministry of Economic Affairs is that it needs to be detected with a power of 80%.We provide examples based on a couple of fish species to support the interpretation ofTable 2 for all fish species.
• Plaice: The observed difference between the catch rates with pulse and standardgear for plaice was large (ratio = 0.36) and the standard deviation relatively small(SD=0.92). It is therefore likely that relatively small sample sizes will be sufficientto observe significant differences in catch rates of plaice. For instance, if the trueratio is 0.5 (i.e. 50% catch rate reduction with pulse gear) then a sample sizeof 14 is required. If, however, the true effect of using pulse gear is only a 10%reduction, then a sample size of 599 would be required to detect it.
• Dab: The variability in the catch rates of dab is much higher than in plaice andtherefore larger sample sizes are required to detect differences. For instance, if thetrue reduction in catch rate of dab is 30% then 288 hauls are required to observethe difference. If the true reduction is only 10%, and it needs to be detected withpower of 80%, 3299 hauls are required.
• Whiting and sole: The SDs of the catch rates of whiting and sole lie between theSDs of plaice and dab. If the true reductions in catch rates of whiting and soleare 30% then 166 respectively 123 hauls are required.
Benthos discards As noted above, the standard deviation varies widely between thedifferent benthos species which influences the number of hauls required for detectingdifferences between catch rates with pulse gear and conventional gear. We provideexamples based on a couple of benthos species to support the interpretation of Table3. The example species are selected on the basis of their variability so that extremescan be compared and on the basis of how prevalent they are as bycatch species.
28

Power analysis electric pulse shrimp fishery (09-11-2016)
• Gudgeons: Gudgeons were the most-caught benthos species and the differencesin catch rates between conventional and pulse-gear are large (ratio = 0.32). Theestimated variability was moderate (SD=1.69). If the true reduction in catch is30%, then a a sample size of 139 is required.
• Sand eel: The variability in the differences in catch rates of sand eel were verylarge (SD=2.81). The estimated reduction based on the HA 31 was 41%. If thetrue reduction in catch rate is 30%, then a a sample size of 384 is required todetect the difference with 80% probability.
• Shore crab: The estimated differences in catch rates with conventional and pulse-gear are large (78% reduction) and the standard deviation is relatively small(SD=1.42). If the true reduction in catch rate is 30%, then a a sample size of 98is required to detect the difference with 80% probability.
29

Power analysis electric pulse shrimp fishery (09-11-2016)
4 Discussion, Conclusion and RecommendationsThe Ministry of Economic Affairs (in collaboration with the shrimp fishery sector) isin the process of developing a more sustainable shrimp fishery industry. Electric pulsefishing is considered a promising means to improve selectivity and reduce discards andseafloor disturbance (Verschueren et al., 2014; Goldsborough et al., 2014). The ministryis setting up a long-term research agenda for the Dutch shrimp fishery industry toresolve several concerns and questions (Van Marlen et al. 2016, Research Agenda).The purpose of our study was to support the Ministry of Economic affairs with thedesign of an ecological survey to improve insight into the effectiveness of the use ofpulse gear in relation to conventional gear. An important question concerns samplesize and the number of vessels to be included in the long-term research program so thatsufficient data are obtained to draw solid conclusions about the quantities of discardswith different fishing gears.
As a first step, we have provided insight into the quantities of discards caught by theshrimp fishery vessel HA 31 in the western Dutch Wadden Sea which simultaneouslyfished with conventional gear and pulse gear during four fishing trips in the monthsJune, September, October and December. We have focused on the effectiveness ofpulse gear in relation to traditional gear and also considered seasonal patterns andinteractions between gear and month. In the pilot study there are very clear patterns.Some of the most notable patterns are: 1. only few species make up the majority ofdiscards (plaice, whiting, gudgeons, shrimp, crabs, herring-like species, blue mussels,starfish and cockles); 2. seasonal patterns in catch, discards and effectiveness (e.g. thecatch of consumption shrimp is highest in September and October while nearly all ofthe plaice is caught in June); 3. the pulse gear is very effective in that discards arereduced in all months for nearly all species and that the catch of consumption shrimpis the same or higher with pulse gear.
The paired design of the pilot survey (simultaneously fishing with conventional andpulse gear) permitted for relatively straightforward comparison and analysis of catchand discard data and of (seasonal) the effectiveness of the pulse gear. On the basis of theprovided data we have computed the sample sizes required to detect differences betweenthe volumes shrimp, undersized shrimp and discards and the numbers of individualsof commercial fish and benthos with standard gear and pulse gear. The effect sizesand corresponding sample sizes for volume catch and individual discard species wereset in consultation with the ministry. A relatively small possible change (i.e. -10% or+10%) in catch of consumption shrimp was considered more important than a differenceof equal magnitude for individual species. Nevertheless, sample size requirements forrelatively small differences at species level are given in Tables 1-3.
We have not prioritized any of the species but presented results for all the speciesthat were caught. One might argue that vulnerable species or species with specialconservation status deserve more attention and that the survey should be designed such
30

Power analysis electric pulse shrimp fishery (09-11-2016)
that it is able to detect small differences between the numbers caught. For examplewhiting might be such a species. We have not focused on any species in particular, butwe have chosen to present our results such that they can be used for designing a surveywhich serves multiple goals.
Finally, we note that the implication of using a relatively limited data set - whichis generally the case for power analyses - is that the sample size estimates should beused with care. Particularly, in the most narrow sense, the power analyses are valid forthe rather limited conditions that HA 31 experienced. Therefore, the outcome shouldbe used as a guideline rather than a firm expectation for the entire Wadden Sea indifferent years and seasons. Below follow recommendations (Section 4.2) for additionalpower-analyses which may help to improve the generality and reliability of the currentsample size estimates.
4.1 Hierarchical design and power analysisIt should be noted that we have used haul as the unit of observation. The reason isthat we used data from one vessel only and have not been able to analyze variabilitybetween vessels. Consequently, questions regarding sample size are answered on thelevel of hauls. However, the Ministry of Economic Affairs has to select the number ofvessels to include in the survey and how they should be distributed through space andtime. If the ministry aims to involve more than a single vessel in future research, thequestion arises how large the additional among-vessel variance component is, comparedto the among-hauls within a vessel variance-component. The same holds if more areasare visited. Note that the variance of the ln-ratio of pulse over traditional catches canbe thought of as being the sum of various variance components: among hauls withina vessel and area, among areas, among vessels, etc. If the among-vessel or among-areacomponents are large, then our sample size indications are too optimistic. We onlyhad access to data from a single vessel fishing within a single area and thus could onlyestimate the among-hauls component. It seems likely that this among-hauls variancecomponent is much larger than the other components, but it partly remains a matter ofspeculation. Nevertheless, we strongly encourage that more than one vessel and morethan one area throughout the different seasons will be involved in future studies.
4.2 RecommendationsWe are aware of the fact that electric pulse fishing in shrimp fishery is controversialand that further research into the effectiveness of is important for the development ofa more sustainable shrimp fishery sector. However, an ideal survey should not only an-swer questions concerning the effectiveness of the use of pulse gear but should provideinsight into the entire scope of management options for reducing discards and seafloordisturbance. Particularly, we have observed substantial temporal variation in the catch
31

Power analysis electric pulse shrimp fishery (09-11-2016)
of consumption shrimp, undersized shrimp and discards. It is likely that there is sub-stantial spatial variability in catch, discards and the effectiveness of the pulse gear too.We therefore propose to design the ecological survey such that the resulting data allowsfor identification and testing the entire scope of possibilities to reduce discards andseafloor disturbance (while retaining sufficiently high effectiveness). Particularly, thesurvey should allow for testing of the effectiveness of the use of pulse gear in combinationwith management of the spatial and seasonal fishery efforts.
We recommend to do a preliminary investigation and a targeted power analysis toidentify possibilities to reduce discards and seafloor disturbance by analysis of catchesand discards with conventional gear across a broader spatial and temporal scale (on thebasis of the IMARES survey) in combination with the effectiveness of the pulse gear.This can provide insight into how discards and seafloor disturbance can be reduced bymeans of spatial and temporal management in isolation or in combination with pulsegear. Particularly it will help to answer questions like: “In which areas and seasons isthe effectiveness (volume of consumption shrimp caught in relation to discard) low andin which areas and during which months is electric pulse fishing most effective?” Thesetypes of preliminary analyses could (should) include co-variates such as the timing offishing in relation to tidal cycle, time of day, pelagic and benthic (muddy or sandysediments) conditions which will also be of help for the design of an effective long-termresearch program.
32

Power analysis electric pulse shrimp fishery (09-11-2016)
ReferencesCohen, J. (1977). Statistical power analysis for the behavioral sciences (revised ed.).
New York: Academic Press.
Goldsborough, D., J. Steenbergen, Z. Jager, and W. Zaalmink (2014). Toekomst van depulsvisserij in de Waddenzee - Een verkenning met relevantie voor de internationaleWaddenzee en de Noordzeekustzone. Technical report, Leeuwarden.
Quinn, G. P. and M. J. Keough (2002, March). Experimental design and data analysisfor biologists. Cambridge University Press.
Verschueren, B., H. Lenoir, L. Vandamme, and B. Vanelslander (2014). Evaluatie vaneen seizoen pulsvisserij op garnaal met HA 31. Technical Report 157, ILVO.
33

The mission of NIOZ is to gain and communicate scientific knowledge on seas and
oceans for a better understanding and sustainability of our planet, to manage the
national facilities for sea research and to support research and education in the Nether-
lands and in Europe.
NIOZ Royal Netherlands Institute for Sea Research is an Institute of the Netherlands Organization for Scientific Research (NWO).
NIOZ TexelLandsdiep 41797 SZ ’t Horntje, Texel
Postbox 59 1790 AB Den Burg, Texel NederlandTelephone: +31(0)222 - 369300Fax: +31(0)222 - 319674
NIOZ YersekeKorringaweg 74401 NT Yerseke
Postbox 1404400 AC YersekeNederlandTelephone: +31(0)113 - 577417Fax: +31(0)113 - 573616
www.nioz.nlPhotos: ILVO, Uhlmann en Tulp (Imares)
NIOZ Report 2016-2