Sample Size for Affymetrix Micrarray Experiments
22
Sample Size Selection for Microarray based Gene Expression Studies Gregory R. Warnes, Gregory R. Warnes, Pfizer Global R&D Pfizer Global R&D Fasheng Li Fasheng Li Smith Hanley Smith Hanley Consulting Group Consulting Group
Transcript of Sample Size for Affymetrix Micrarray Experiments

Sample Size Selection for Microarray based Gene
Expression Studies
Gregory R. Warnes, Gregory R. Warnes, Pfizer Global R&DPfizer Global R&D
Fasheng LiFasheng LiSmith Hanley Consulting Smith Hanley Consulting
GroupGroup
Page 3 Industry/FDA Statistics Workshop: September 18-19, 2003
Outline What is the context?What is the context? What is the problem?What is the problem? What are possible approaches?What are possible approaches? What approach was chosen and why?What approach was chosen and why? How was the approach implemented?How was the approach implemented? What do the results look like?What do the results look like? Future plans?Future plans? ReferencesReferences
Page 6 Industry/FDA Statistics Workshop: September 18-19, 2003
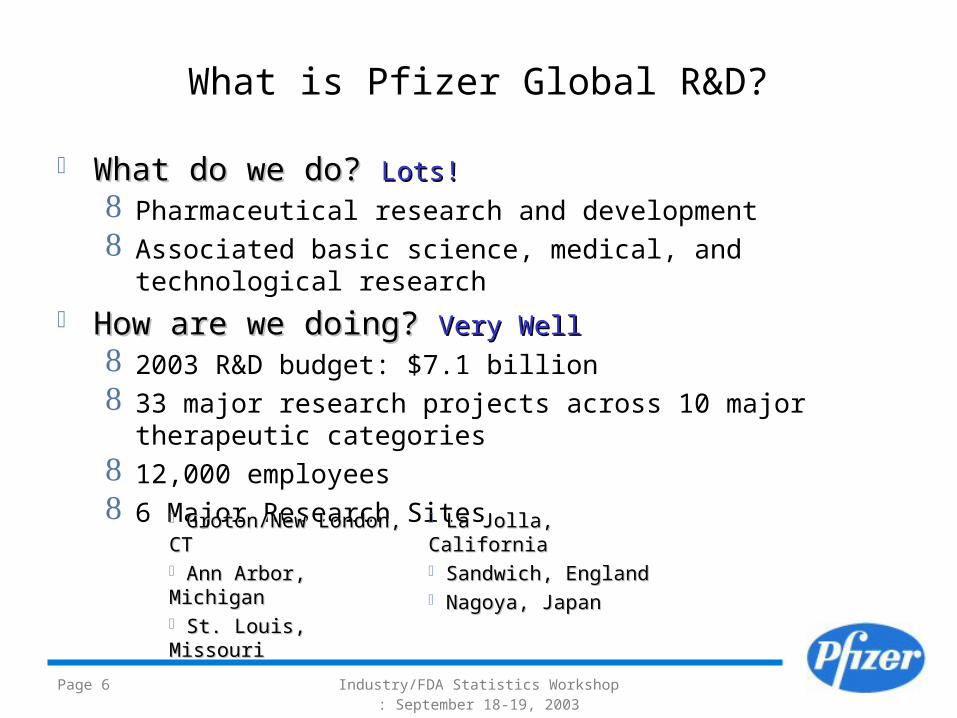
What is Pfizer Global R&D? What do we do? What do we do? Lots!Lots!
Pharmaceutical research and development Associated basic science, medical, and technological research
How are we doing? How are we doing? Very WellVery Well 2003 R&D budget: $7.1 billion 33 major research projects across 10 major therapeutic
categories 12,000 employees 6 Major Research Sites
Groton/New London, CTGroton/New London, CT Ann Arbor, MichiganAnn Arbor, Michigan St. Louis, MissouriSt. Louis, Missouri
La Jolla, CaliforniaLa Jolla, California Sandwich, EnglandSandwich, England Nagoya, JapanNagoya, Japan
Page 7 Industry/FDA Statistics Workshop: September 18-19, 2003
How are we using Gene Expression Technologies?
Determine regulatory and metabolic Determine regulatory and metabolic pathwayspathways Identify potential Identify potential biomarkersbiomarkers Identify potential Identify potential targetstargets Determine Determine mechanism of actionmechanism of action (desired and undesired) (desired and undesired) Evaluate / predict Evaluate / predict safetysafety Determine Determine mechanism of toxicitymechanism of toxicity
Page 10 Industry/FDA Statistics Workshop: September 18-19, 2003
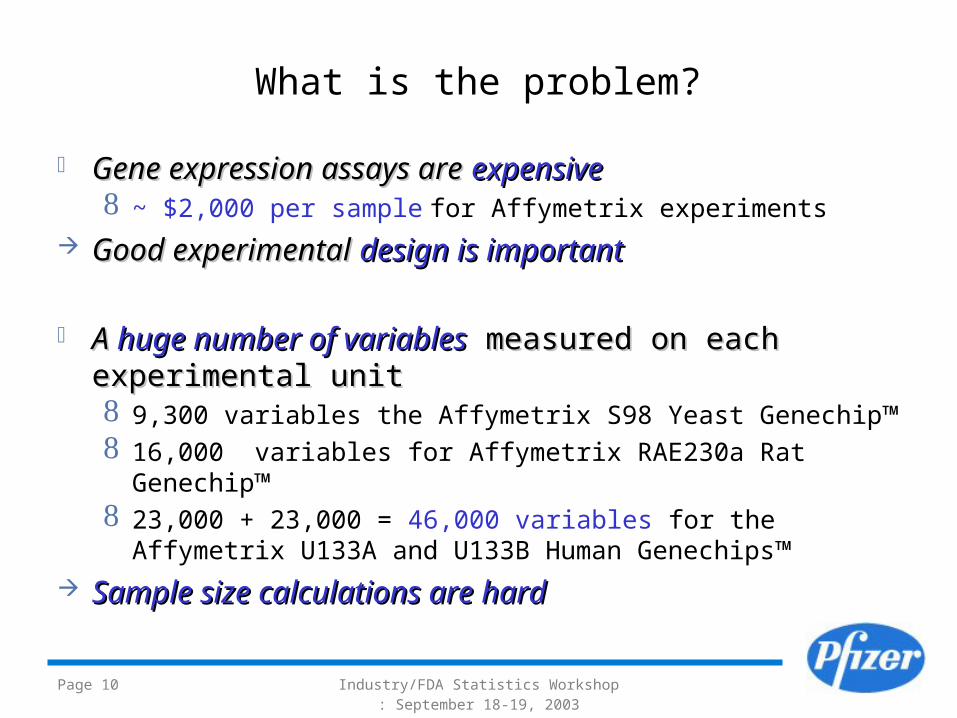
What is the problem? Gene expression assays areGene expression assays are expensive expensive
~ $2,000 per sample for Affymetrix experiments Good experimentalGood experimental design is important design is important
A A huge number of variableshuge number of variables measured on each measured on each experimental unitexperimental unit 9,300 variables the Affymetrix S98 Yeast Genechip™ 16,000 variables for Affymetrix RAE230a Rat Genechip™ 23,000 + 23,000 = 46,000 variables for the Affymetrix U133A
and U133B Human Genechips™ Sample size calculations are hardSample size calculations are hard

Page 11 Industry/FDA Statistics Workshop: September 18-19, 2003
Standard sample size calculation
For a For a singlesingle outcome variable, given outcome variable, given simple designsimple design (e.g., two-sample t-test) (e.g., two-sample t-test) effect size effect size (ideally, minimum practical significance)(ideally, minimum practical significance) population variance population variance ²²,, significance levelsignificance level (probability of a false positive when (probability of a false positive when
no true effect)no true effect) powerpower (probability of a true positive given the defined (probability of a true positive given the defined
effect size)effect size)It is It is straightforward to computestraightforward to compute the required sample size the required sample size nn
(see e.g. Cochrain & Cox (1957))(see e.g. Cochrain & Cox (1957))
Page 12 Industry/FDA Statistics Workshop: September 18-19, 2003
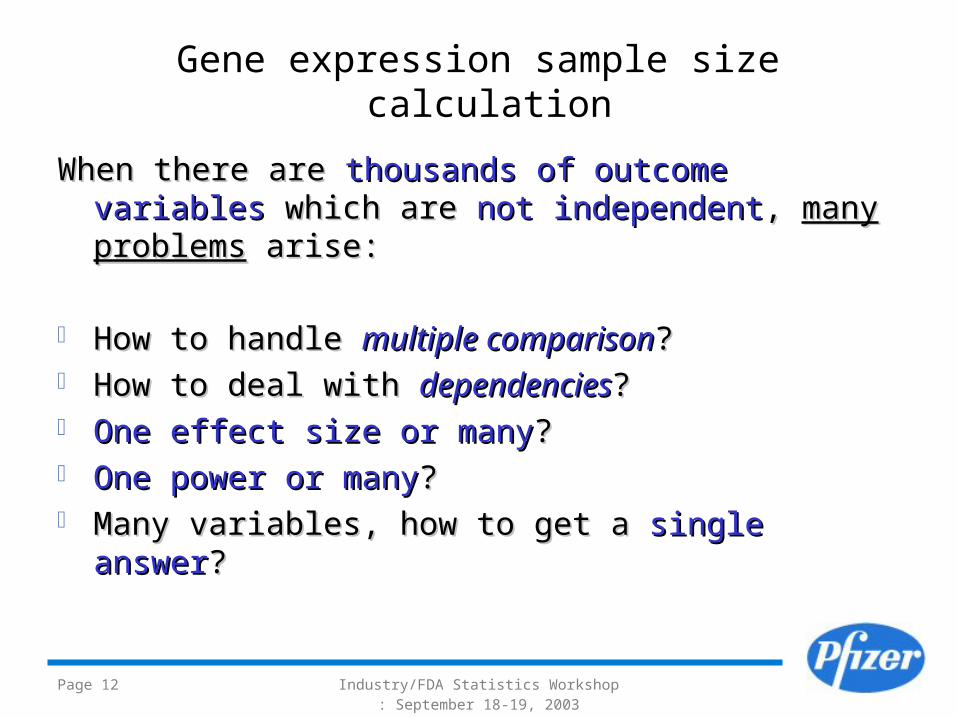
Gene expression sample size calculation
When there are When there are thousands of outcome variables thousands of outcome variables which are which are not independentnot independent, , many problemsmany problems arise: arise:
How to handle How to handle multiple comparisonmultiple comparison?? How to deal with How to deal with dependenciesdependencies?? One effect size or manyOne effect size or many?? One power or manyOne power or many?? Many variables, how to get a Many variables, how to get a single answersingle answer??
Page 14 Industry/FDA Statistics Workshop: September 18-19, 2003
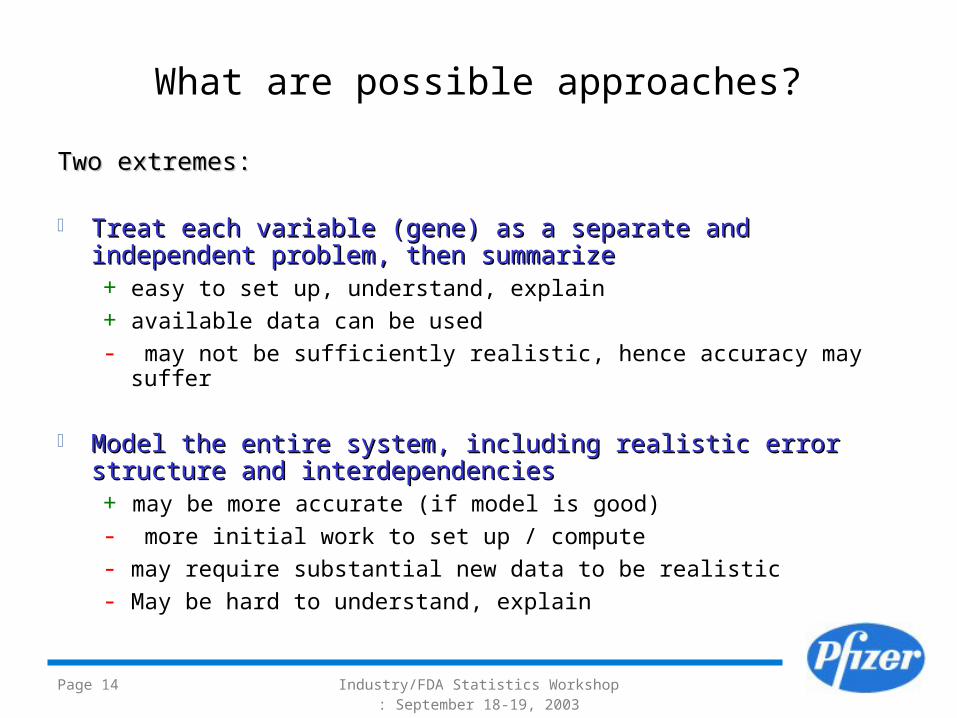
What are possible approaches?Two extremes:Two extremes:
Treat each variable (gene) as a separate and independent problem, Treat each variable (gene) as a separate and independent problem, then summarizethen summarize+ easy to set up, understand, explain + available data can be used- may not be sufficiently realistic, hence accuracy may suffer
Model the entire system, including realistic error structure and Model the entire system, including realistic error structure and interdependenciesinterdependencies+ may be more accurate (if model is good)- more initial work to set up / compute- may require substantial new data to be realistic- May be hard to understand, explain
Page 16 Industry/FDA Statistics Workshop: September 18-19, 2003
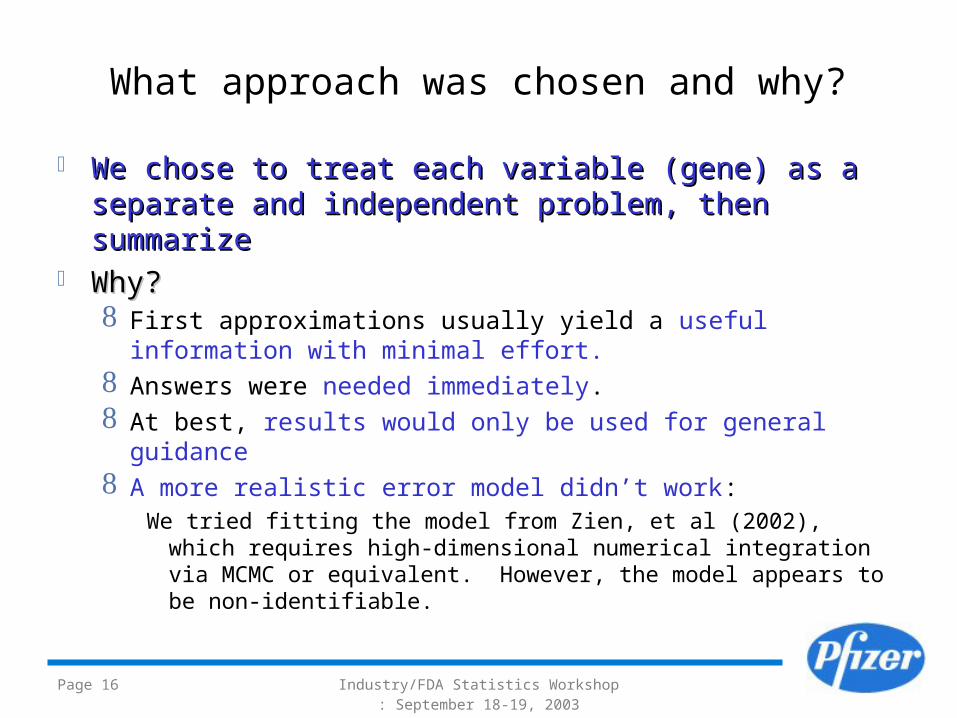
What approach was chosen and why? We chose to treat each variable (gene) as a separate We chose to treat each variable (gene) as a separate
and independent problem, then summarizeand independent problem, then summarize Why?Why?
First approximations usually yield a useful information with minimal effort.
Answers were needed immediately. At best, results would only be used for general guidance A more realistic error model didn’t work:
We tried fitting the model from Zien, et al (2002), which requires high-dimensional numerical integration via MCMC or equivalent. However, the model appears to be non-identifiable.
Page 18 Industry/FDA Statistics Workshop: September 18-19, 2003
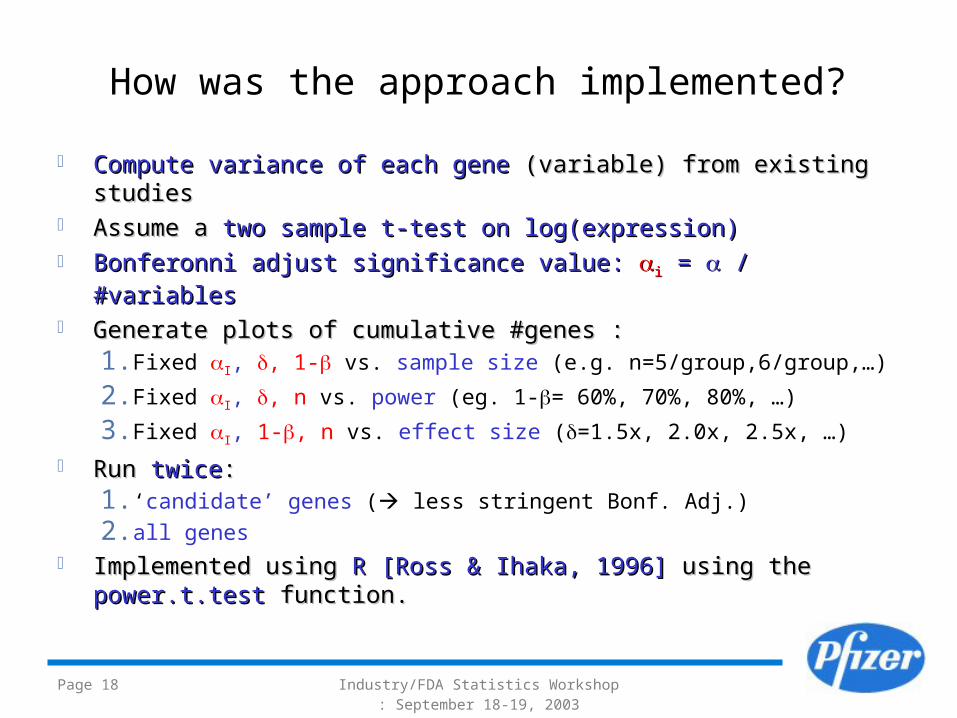
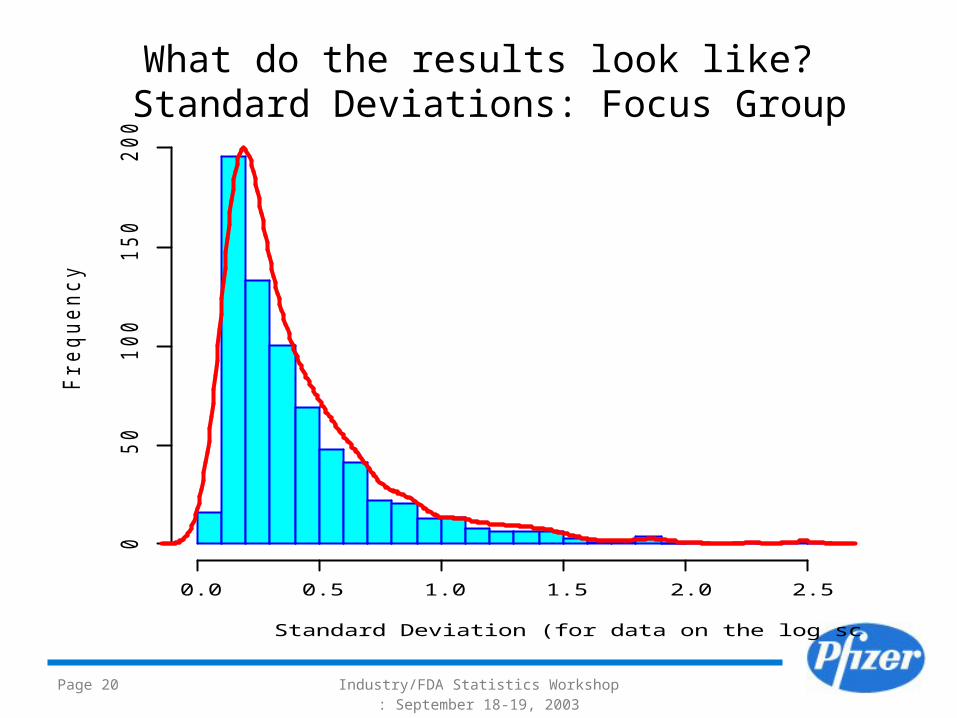
How was the approach implemented? Compute variance of each geneCompute variance of each gene (variable) from existing studies (variable) from existing studies Assume a Assume a two sample t-test on log(expression)two sample t-test on log(expression) Bonferonni adjust significance value: Bonferonni adjust significance value: ii = = / #variables / #variables Generate plots of cumulative #genes :Generate plots of cumulative #genes :
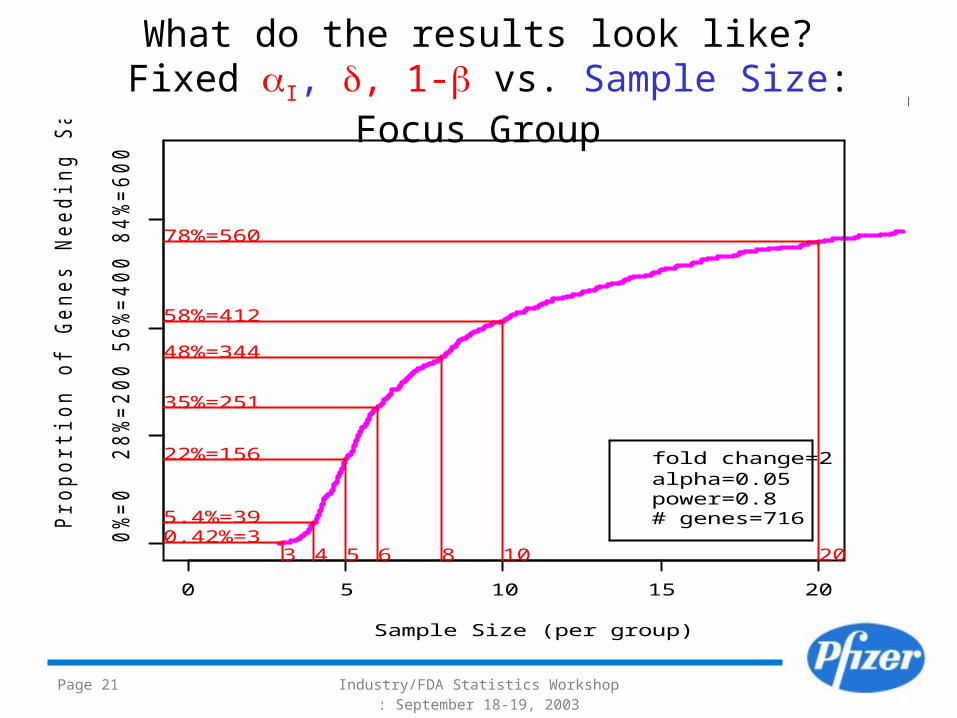
1. Fixed I, , 1- vs. sample size (e.g. n=5/group,6/group,…)
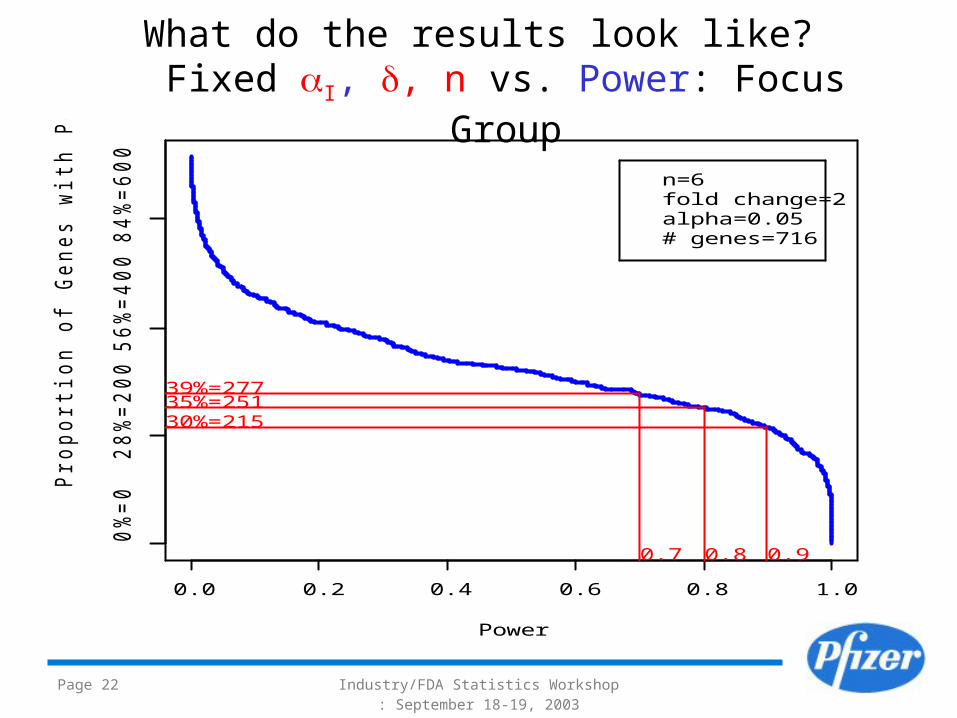
2. Fixed I, , n vs. power (eg. 1-= 60%, 70%, 80%, …)
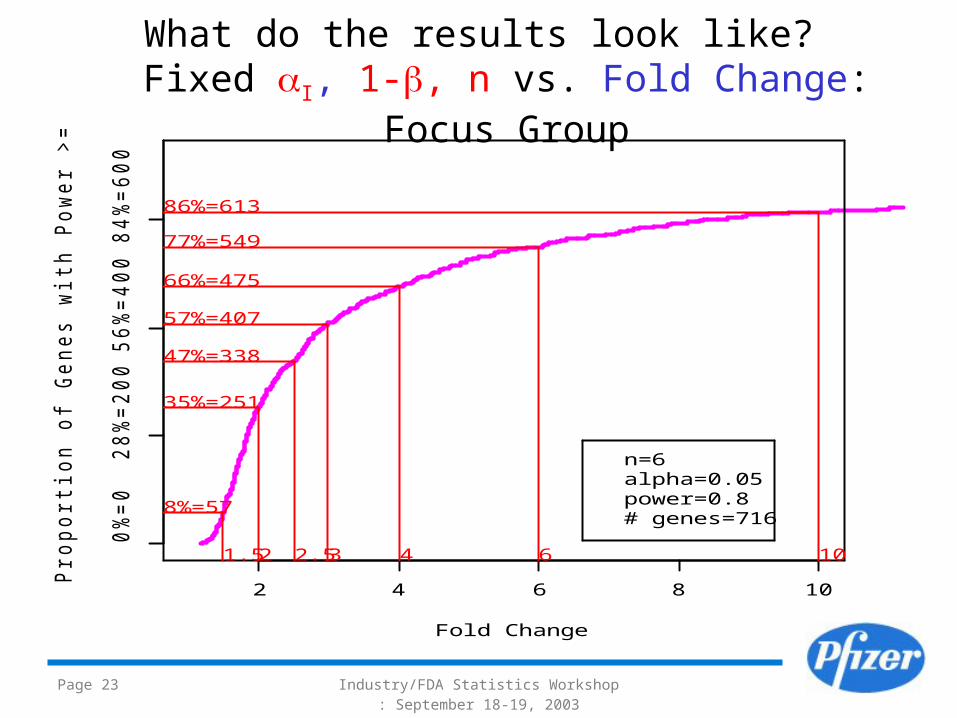
3. Fixed I, 1-, n vs. effect size (=1.5x, 2.0x, 2.5x, …) Run Run twicetwice: :
1. ‘candidate’ genes ( less stringent Bonf. Adj.)2. all genes
Implemented using Implemented using R [Ross & Ihaka, 1996] R [Ross & Ihaka, 1996] using theusing the power.t.test power.t.test function.function.
Page 20 Industry/FDA Statistics Workshop: September 18-19, 2003
Standard Deviation (for data on the log scale)
Freq
uenc
y
0.0 0.5 1.0 1.5 2.0 2.5
050
100
150
200
Histogram of Standard Devations (Focus List)
What do the results look like? Standard Deviations: Focus Group
Page 21 Industry/FDA Statistics Workshop: September 18-19, 2003
0 5 10 15 20
Sample Size (per group)
Pro
porti
on o
f Gen
es N
eedi
ng S
ampl
e S
ize
<= n
0%
=0 2
8%=2
00 5
6%=4
00 8
4%=6
00
30.42%=3
4
5.4%=39
5
22%=156
6
35%=251
8
48%=344
10
58%=412
20
78%=560
fold change=2alpha=0.05power=0.8# genes=716
Sample Size to Detect 2-Fold Change (Focus List Genes)
What do the results look like? Fixed I, , 1- vs. Sample Size: Focus Group
Page 22 Industry/FDA Statistics Workshop: September 18-19, 2003
0.0 0.2 0.4 0.6 0.8 1.0
Power
Pro
porti
on o
f Gen
es w
ith P
ower
>=
x
0%
=0 2
8%=2
00 5
6%=4
00 8
4%=6
00
0.7
39%=277
0.8
35%=251
0.9
30%=215
n=6fold change=2alpha=0.05# genes=716
Power to Detect 2-Fold Change (Focus List Genes)
What do the results look like?Fixed I, , n vs. Power: Focus Group
Page 23 Industry/FDA Statistics Workshop: September 18-19, 2003
2 4 6 8 10
Fold Change
Pro
porti
on o
f Gen
es w
ith P
ower
>=
80%
at F
old
Cha
nge=
delta
0%
=0 2
8%=2
00 5
6%=4
00 8
4%=6
00
1.5
8%=57
2
35%=251
2.5
47%=338
3
57%=407
4
66%=475
6
77%=549
10
86%=613
n=6alpha=0.05power=0.8# genes=716
Fold Change to Achieve 80% Power (Focus List)
What do the results look like?Fixed I, 1-, n vs. Fold Change: Focus
Group
Page 24 Industry/FDA Statistics Workshop: September 18-19, 2003
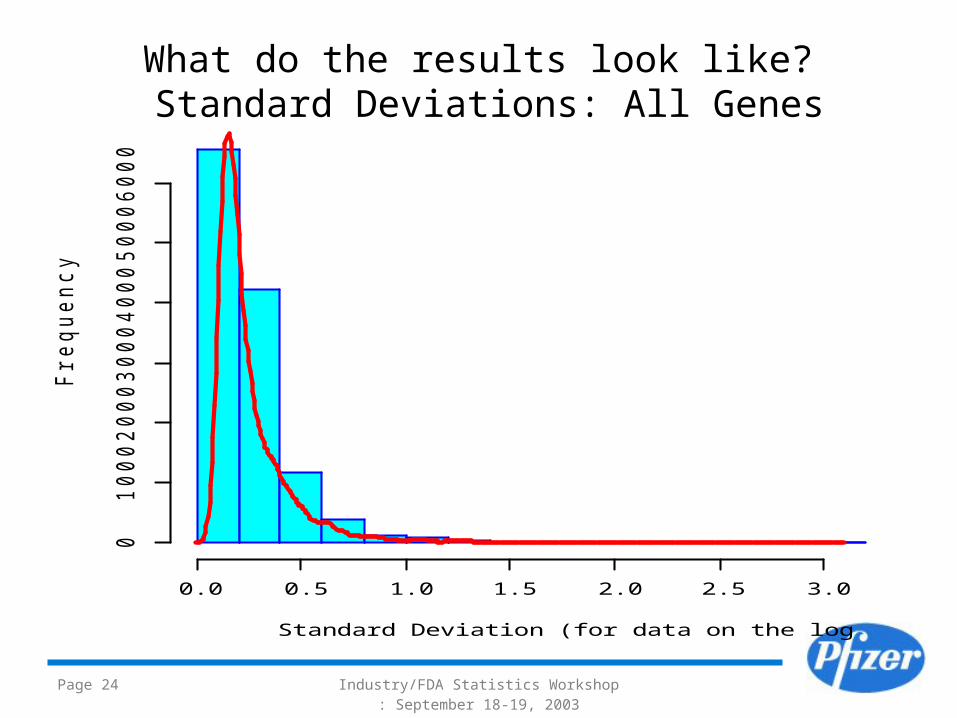
Standard Deviation (for data on the log scale)
Freq
uenc
y
0.0 0.5 1.0 1.5 2.0 2.5 3.0
010
0020
0030
0040
0050
0060
00Histogram of Standard Deviations (All Genes)What do the results look like?
Standard Deviations: All Genes
Page 25 Industry/FDA Statistics Workshop: September 18-19, 2003
5 10 15 20
Sample Size (per group)
Pro
porti
on o
f Gen
es N
eedi
ng S
ampl
e S
ize
<= n
0%
=0 3
2%=4
000 6
3%=8
000 9
5%=1
2000
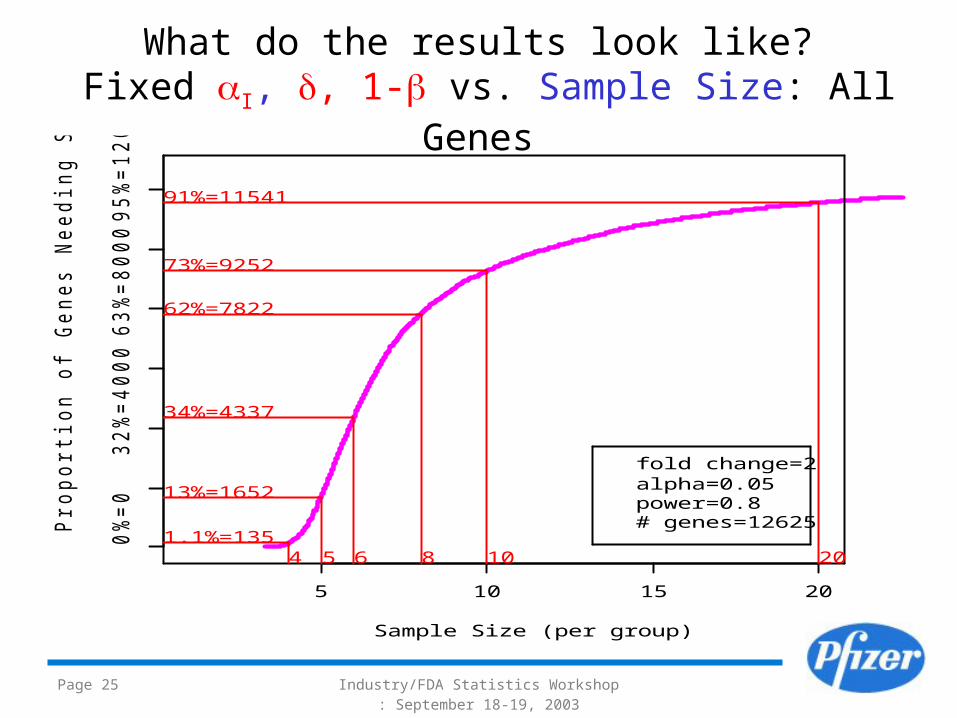
41.1%=135
5
13%=1652
6
34%=4337
8
62%=7822
10
73%=9252
20
91%=11541
fold change=2alpha=0.05power=0.8# genes=12625
Sample Size to Detect 2-Fold Change (All Genes)
What do the results look like? Fixed I, , 1- vs. Sample Size: All Genes
Page 26 Industry/FDA Statistics Workshop: September 18-19, 2003
0.0 0.2 0.4 0.6 0.8 1.0
Power
Pro
porti
on o
f Gen
es w
ith P
ower
>=
x
0%
=0 3
2%=4
000
63%
=800
0 95%
=120
00
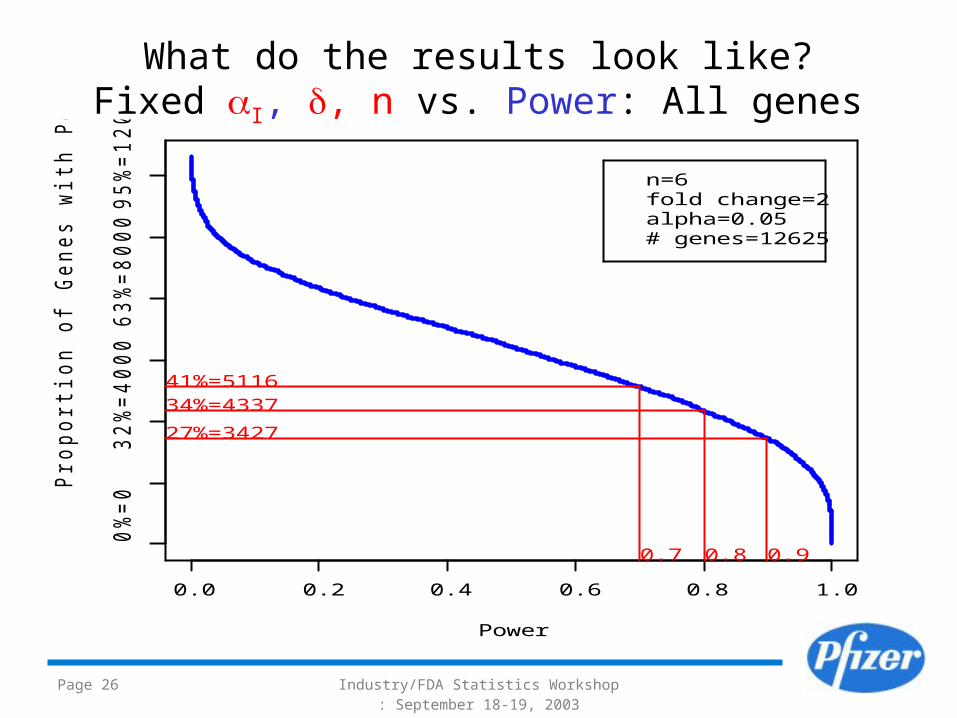
0.7
41%=5116
0.8
34%=4337
0.9
27%=3427
n=6fold change=2alpha=0.05# genes=12625
Power to Detect 2-Fold Change (All Genes)
What do the results look like?Fixed I, , n vs. Power: All genes

Page 27 Industry/FDA Statistics Workshop: September 18-19, 2003
2 4 6 8 10
Fold Change
Pro
porti
on o
f Gen
es w
ith P
ower
>=
80%
at F
old
Cha
nge=
delta
0%
=0 2
8%=2
00 5
6%=4
00 8
4%=6
00
1.5
8%=57
2
35%=251
2.5
47%=338
3
57%=407
4
66%=475
6
77%=549
10
86%=613
n=6alpha=0.05power=0.8# genes=716
Fold Change to Achieve 80% Power (Focus List)
What do the results look like?Fixed I, 1-, n vs. Fold Change: All Genes
Page 29 Industry/FDA Statistics Workshop: September 18-19, 2003
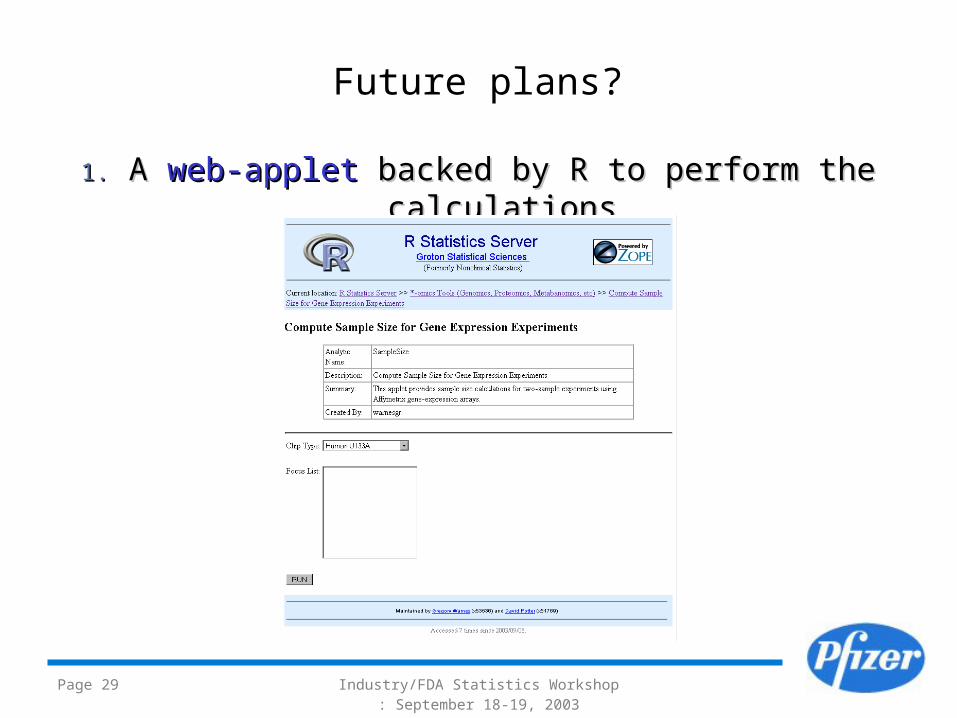
Future plans?
1.1. AA web-applet web-applet backed by R to perform the calculations backed by R to perform the calculations
Page 30 Industry/FDA Statistics Workshop: September 18-19, 2003
Future plans?
1.1. Provide a Provide a web-appletweb-applet backed by R to perform the backed by R to perform the calculationscalculations
2.2. Use a Use a library of gene variation information library of gene variation information in normal in normal samples, (structured by organism, Affymetrix chip type, samples, (structured by organism, Affymetrix chip type, cell type, normalization/scaling method)cell type, normalization/scaling method)
3.3. Extend to Extend to more complicated designsmore complicated designs (2-way ANOVA, (2-way ANOVA, Repeated measures, etc)Repeated measures, etc)
4.4. Other types of multiple comparison adjustments (Other types of multiple comparison adjustments (FDRFDR))5.5. Develop models that deal with correlations between Develop models that deal with correlations between
genes.genes.

Page 32 Industry/FDA Statistics Workshop: September 18-19, 2003
References Two-sample t-test sample size:Two-sample t-test sample size:
Cochrain WG, Cox GM (1953). Experimental Designs (2nd Ed). 17-28. General sample size calculationsGeneral sample size calculations::
Chow SC, Liu JP (1998). Design and Analysis of Clinical Trials : Concept and Methodologies. Wiley-Interscience. Chapter 10, 424 – 482
Chow SC , Shao J, Wang H (2003). Sample Size Calculation in Clinical Research. Marcel Dekker [New, looks interesting]
Gene expression experiments sample size:Gene expression experiments sample size: Zien A, Fluck J, Zimmer R, Lengauer T (2002). Microarrays: How Many Do You Need?
RECOMB02, Meyers G, Hannenhalli S, Istrail S, Pevzner P, Waterman M, eds. 321-330. Statistical analysis softwareStatistical analysis software::
Ihaka R, Gentleman R, et al (2003). http://www.r-project.org [web site] Ross Ihaka and Robert Gentleman (1996). R: A Language for Data Analysis and Graphics,
Journal of Computational and Graphical Statistics, Vol 5, Number 3: 299-314. Web applet softwareWeb applet software::
Warnes GR, (2003). http://www.analytics.washington.edu/Zope/projects/RSessionDA/ [web site]
Me: Me: http://www.warnes.net

Finis