Sample Report: Europe Cross-Border B2C E-Commerce 2017
15
Transcript of Sample Report: Europe Cross-Border B2C E-Commerce 2017
© Copyright 2015 ystats.com GmbH & Co. KG, 22765 Hamburg, Germany 2
3
4
GENERAL METHODOLOGY OF MARKET REPORTS
Secondary Market Research
The reports are compiled based on secondary market research. Secondary research is information gathered from previously published sources. Our reports are
solely based on information and data acquired from national and international statistical offices, industry and trade associations, business reports, business and
company databases, journals, company registries, news portals and many other reliable sources. By using various sources we ensure maximum objectivity for
all obtained data. As a result, companies gain a precise and unbiased impression of the market situation.
Cross referencing of data is conducted in order to ensure validity and reliability.
The source of information and its release date are provided on every chart. It is possible that the information contained in one chart is derived from several
sources. If this is the case, all sources are mentioned on the chart.
The reports include mainly data from the last 12 months prior to the date of report publication. Exact publication dates are mentioned in every chart.
Definitions
The reports take into account a broad definition of B2C E-Commerce, which might include mobile commerce. As definitions may vary among sources, exact
definition used by the source (if available) is included at the bottom of the chart.
Chart Types
Our reports include text charts, pie charts, bar charts, rankings, line graphs and tables. Every chart contains an Action Title, which summarizes the main
idea/finding of the chart and a Subtitle, which provides necessary information about the country, the topic, units or measures of currency, and the applicable time
period(s) to which the data refers. With respect to rankings, it is possible that the summation of all categories amounts to more than 100%. In this case, multiple
answers were possible, which is noted at the bottom of the chart.
Report Structure
Reports are comprised of the following elements, in the following order: Cover page, preface, legal notice, methodology, definitions, table of contents,
management summary (summarizing main information contained in each section of report) and report content (divided into sections and chapters). When
available, we also include forecasts in our report content. These forecasts are not our own; they are published by reliable sources. Within Global and Regional
reports, we include all major developed and emerging markets, ranked in order of importance by using evaluative criteria such as sales figures.
Notes and Currency Values
If available, additional information about the data collection, for example the time of survey and number of people surveyed, is provided in the form of a note. In
some cases, the note (also) contains additional information needed to fully understand the contents of the respective data.
When providing information about amounts of money, local currencies are most often used. When referencing currency values in the Action Title, the EUR
values are also provided in brackets. The conversions are always made using the average currency exchange rate for the respective time period. Should the
currency figure be in the future, the average exchange rate of the past 12 months is used.
5
METHODOLOGY OF THE CURRENT REPORT
Report Coverage
This report covers cross-border B2C E-Commerce in Europe. It includes information about cross-border E-Commerce exports and imports, with a focus on
cross-border imports and cross-border online shopper behavior.
All major European markets are covered in this report, with data availability varying across the countries.
Report Structure
Information about global developments and trends is presented first. This includes forecasts regarding cross-border B2C E-Commerce sales and their share of
total B2C E-Commerce sales worldwide and by region, cross-border online shopper penetration worldwide and in top 10 countries, drivers and barriers of cross-
border online shopping according to consumers, ranking of product categories purchased by cross-border online shoppers, information about payment and
delivery in cross-border E-Commerce.
The rest of the report devoted to Europe. Regional information is presented first, covering regional development and country comparisons.
The countries are grouped by advanced and emerging E-Commerce markets and are presented in the descending order of B2C E-Commerce sales.
Depending on data availability, the following types of market information are included: cross-border online shopper penetration, cross-border B2C E-Commerce
sales (imports and/or exports), countries most purchased from by online shoppers in the country, countries most sold to by online merchants in the country, most
purchased product categories, reasons for buying from out-of-country online sellers and barriers to cross-border E-Commerce. Not all the mentioned types of
information are available for each of the countries covered. For the largest B2C E-Commerce market in the region, the UK, also a text chart with a qualitative
overview of cross-border B2C E-Commerce is presented.
6
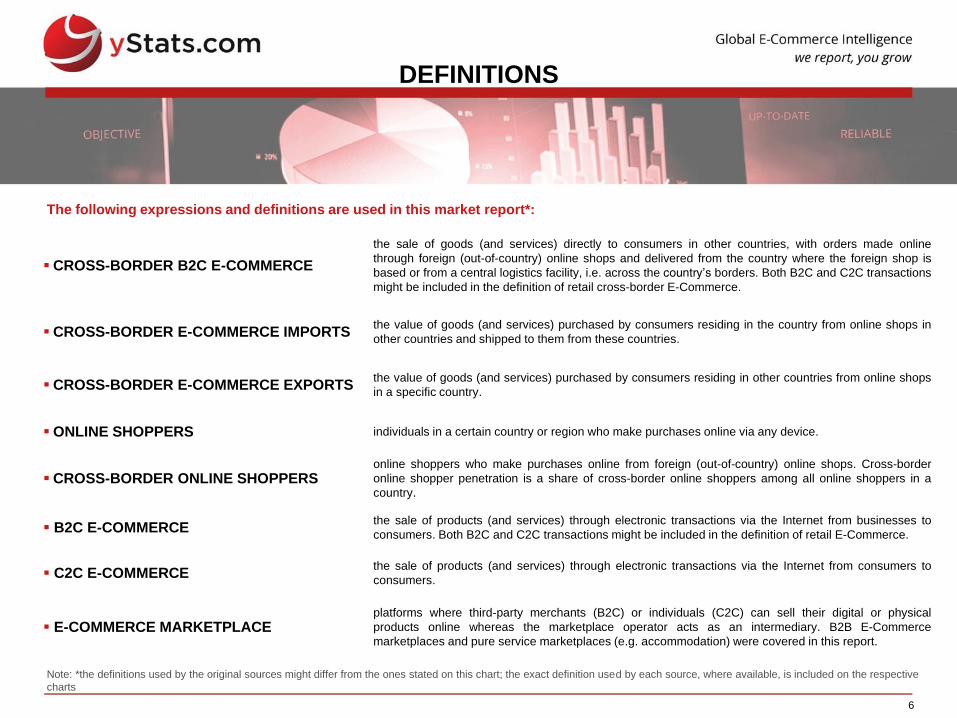
DEFINITIONS
CROSS-BORDER B2C E-COMMERCE
the sale of goods (and services) directly to consumers in other countries, with orders made online
through foreign (out-of-country) online shops and delivered from the country where the foreign shop is
based or from a central logistics facility, i.e. across the country’s borders. Both B2C and C2C transactions
might be included in the definition of retail cross-border E-Commerce.
CROSS-BORDER E-COMMERCE IMPORTS the value of goods (and services) purchased by consumers residing in the country from online shops in
other countries and shipped to them from these countries.
CROSS-BORDER E-COMMERCE EXPORTS the value of goods (and services) purchased by consumers residing in other countries from online shops
in a specific country.
ONLINE SHOPPERS individuals in a certain country or region who make purchases online via any device.
CROSS-BORDER ONLINE SHOPPERS online shoppers who make purchases online from foreign (out-of-country) online shops. Cross-border
online shopper penetration is a share of cross-border online shoppers among all online shoppers in a
country.
B2C E-COMMERCE the sale of products (and services) through electronic transactions via the Internet from businesses to
consumers. Both B2C and C2C transactions might be included in the definition of retail E-Commerce.
C2C E-COMMERCE the sale of products (and services) through electronic transactions via the Internet from consumers to
consumers.
E-COMMERCE MARKETPLACE platforms where third-party merchants (B2C) or individuals (C2C) can sell their digital or physical
products online whereas the marketplace operator acts as an intermediary. B2B E-Commerce
marketplaces and pure service marketplaces (e.g. accommodation) were covered in this report.
The following expressions and definitions are used in this market report*:
Note: *the definitions used by the original sources might differ from the ones stated on this chart; the exact definition used by each source, where available, is included on the respective
charts
7
TABLE OF CONTENTS (1 OF 5)
1. Management Summary
2. Global Developments
• Cross-Border B2C E-Commerce Market Overview and Trends, February 2017
• Cross-Border Share of B2C E-Commerce Sales, in %, 2015 & 2021f
• Cross-Border B2C E-Commerce Sales, in USD billion, and Share of Total B2C E-Commerce Sales, in %, by Regions, 2014 & 2020f
• Share of Online Purchases Imported from Other Regions, in %, by Regions, 2016
• Cross-Border Online Shopper Penetration, in % of Online Shoppers, According to Three Consumer Surveys, 2015/2016
• Top 10 Countries by Cross-Border Online Shopper Penetration, in % of Cross-Border Online Shoppers, October 2016
• Top 3 Reasons for Cross-Border Online Shopping, in % of Cross-Border Online Shoppers, August 2016
• Top 10 Barriers to Cross-Border Online Shopping, in % of Online Shoppers, October 2016
• Product Categories Purchased Cross-Border, in % Cross-Border Online Shoppers, September 2015
• Top 3 Payment Methods Preferred in Cross-Border Online Shopping, in % of Cross-Border Online Shoppers, August 2016
• Breakdown of the Latest Cross-Border Online Purchase by Value in EUR, in % of Cross-Border Online Shoppers, October 2016
• Breakdown of the Latest Cross-Border Online Purchases by Parcel Weight in Kg, in % of Cross-Border Online Shoppers, October 2016
• Breakdown of the Latest Cross-Border Online Purchase by Shipping Cost in EUR, in % of Cross-Border Online Shoppers, 2015 & 2016
• Top 7 E-Commerce Websites Purchased From in Latest Cross-Border Online Purchase, in % of Cross-Border Online Shoppers, October 2016
• International Traffic Share of 11 Selected Leading E-Commerce Websites, incl. Total Website Visits on Desktop, in millions, Share of
International Traffic, in %, and Top 5 Countries by Share of Website Traffic, in %, January 2017
• Share of World’s Top 1,000 Online Retailers Shipping Cross-Border, by Selected Countries, September 2016
3. Europe
3.1. Regional
• Overview of the European Commission’s Proposals Related to Boosting Cross-Border B2C E-Commerce in the EU, December 2016
• Breakdown of Online Shoppers, by Domestic Shoppers Only, Domestic and Cross-Border Shoppers, and Cross-Border Shoppers Only, in %, by
Selected Countries, October 2016
• Cross-Border Online Shopper Penetration, in % of Online Shoppers, by France, Germany, Italy, Poland, Spain, Turkey, Russia, and the UK, Q4
2015
• Cross-Border Online Shopper Penetration in the EU, in % of Online Shoppers, 2012 - 2016
8
TABLE OF CONTENTS (2 OF 5)
3. Europe (Cont.)
3.1. Regional (Cont.)
• Cross-Border Online Shopper Penetration in the EU, by Online Shoppers Buying From Other EU Countries and from Non-EU Countries, in % of
Online Shoppers, 2012 - 2016
• Cross-Border Online Shopper Penetration in the EU, in % of Online Shoppers, by Country, 2016
• Cross-Border Online Shopper Penetration in the EU, by Online Shoppers Buying From Other EU Countries and from Non-EU Countries, in % of
Online Shoppers, by Country, 2016
• Share of E-Commerce Companies Selling to Other EU Countries, in %, by EU Countries, EU 28, TFYR of Macedonia, Norway, and Turkey,
2015
• Top 3 Product Categories Purchased in Cross-Border Online Shopping, in % of Cross-Border Online Shoppers, by Belgium, France, Germany,
Italy, Netherlands, Nordics, Poland, Spain, and the UK, May 2016
• Top 5 Countries Purchased from in Cross-Border Online Shopping, in % of Cross-Border Online Shoppers, by Belgium, France, Germany, Italy,
Netherlands, Nordics, Poland, Spain, and the UK, May 2016
• Reasons for Shopping Online from a Specific Country, in % of Cross-Border Online Shoppers, by Belgium, France, Germany, Italy, Netherlands,
Nordics, Poland, Spain, and the UK, May 2016
• Average Annual Online Spending on Tangible Goods and Offline Services, by Domestic, Cross-Border Inside the EU, and Cross-Border Outside
the EU, in EUR, by EU Country, 2015
3.2. Advanced Markets
3.2.1. UK
• Cross-Border B2C E-Commerce Overview and Trends, February 2017
• Share of Online Shoppers in the UK Who Have Purchased Cross-Border and Who Would Consider Purchasing Cross-Border, in %, August
2016
• Top 3 Barriers to Cross-Border Online Shopping, in % of Online Shoppers in the UK, August 2016
• Share of Online Shoppers in the UK Who Have Purchased and Who Would Purchase Cross-Border from Selected Countries, incl. the USA,
France, and Germany, in %, August 2016
• Share of E-Commerce Orders Sent by UK Online Retailers Internationally, in %, July 2015 & July 2016
• Shares of Top 150 Online Retailers in the UK Who Ship Internationally, Offer Prices in Other Currencies, and Offer Non-English Language
Options, in %, February 2016
• Share of Top 150 Online Retailers in the UK Offering Shipping to China, in %, and Localization Options Offered by Top Online Retailers
Shipping to China, in %, February 2016
9
TABLE OF CONTENTS (3 OF 5)
3. Europe (Cont.)
3.2. Advanced Markets (Cont.)
3.2.2. Germany
• Cross-Border Online Shopper Penetration, by Online Shoppers Who Have Purchased Cross-Border and Online Shoppers Who Plan to
Purchase Cross-Border, in % of Online Shoppers in Germany, by Total Online Shoppers and Online Shoppers 18-29, March 2016
• Top Product Categories Purchased Cross-Border, in % of Cross-Border Online Shoppers in Germany, March 2016
• Ways Used to Discover Foreign Online Shops, in % of Cross-Border Online Shoppers in Germany, March 2016
• Top 5 Countries and Regions in Cross-Border Online Shopping, by Purchased From and Planned Purchase in the Next 12 Months, in % of
Cross-Border Online Shoppers in Germany, March 2016
• Cross-Border Online Shopper Penetration, by Buying Cross-Border Regularly and Occasionally, in % of Online Shoppers in Germany,
December 2016
• Top Regions in Cross-Border Online Shopping, in % of Cross-Border Online Shoppers in Germany, December 2016
• Breakdown of Orders Receive by Cross-Border Online Merchants in Germany by Domestic, Europe and Non-European Countries, in %, October
2015
• Countries Sold to in Cross-Border Online Shopping, in % of Cross-Border Online Merchants in Germany, October 2015
• Adaptations Made by Cross-Border Online Merchants in Their Online Stores to Account for Conditions in Other Countries, in % of Cross-Border
Online Merchants in Germany, October 2015
• Breakdown of Perception of Suitability of Selected Payment Methods for Cross-Border E-Commerce, in % of Online Merchants in Germany,
October 2015
3.2.3. France
• Cross-Border Online Shopper Penetration, in % of Internet Users in France, June 2015 & June 2016
• Top 2 Reasons for Shopping Cross-Border, in % of Cross-Border Online Shoppers in France, 2016
• Top 2 Product Categories Purchased Cross-Border, in % of Cross-Border Online Shoppers in France, 2016
• Major Barriers to Cross-Border Online Shopping, in % of Online Shoppers in France Who Do Not Buy Cross-Border, 2016
3.2.4. Netherlands
• Cross-Border Online Shopper Penetration, in % of Individuals in the Netherlands, 2014 & 2015
• Cross-Border Online Spending, in EUR million, 2014 & 2015
• Breakdown of Cross-Border Online Spending of Online Shoppers in the Netherlands by Country, in %, 2014 & 2015
10
TABLE OF CONTENTS (4 OF 5)
3. Europe (Cont.)
3.2. Advanced Markets (Cont.)
3.2.5. Switzerland
• Cross-Border B2C/C2C E-Commerce Imports, in CHF million, 2014 & 2015
• Cross-Border B2C/C2C E-Commerce Imports Share of Total B2C/C2C E-Commerce Spending, in %, 2014 & 2015
3.2.6. Spain
• Breakdown of E-Commerce Transaction Value, by Exports, Imports and Domestic, in EUR million, Q1 2014 – Q2 2016
• Breakdown of E-Commerce Transaction Number, by Exports, Imports and Domestic, in millions, Q1 2014 – Q2 2016
• Breakdown of Cross-Border E-Commerce Exports Transaction Value and Number by Region, in % Q2 2016
• Breakdown of Cross-Border E-Commerce Imports Transaction Value and Number by Region, in % Q2 2016
3.2.7. Italy
• Breakdown of B2C E-Commerce Sales by Domestic and Cross-Border Imports, in EUR billion, 2012 – 2016e
• Cross-Border B2C E-Commerce Exports, in EUR billion, 2012 – 2016e
• Breakdown of Cross-Border B2C E-Commerce Exports by Product Category, in %, 2016e
3.2.8. Sweden
• Breakdown of Purchases from China, Germany, the UK and the USA by Product Categories, in % of Cross-Border Online Shoppers in Sweden,
Q2 2016
• Ways the Foreign E-Commerce Websites Used for the Latest Cross-Border Purchase Were Found, in % of Cross-Border Online Shoppers in
Sweden, Q2 2016
• Breakdown of the Share of E-Commerce Exports in Total E-Commerce Sales, in % of E-Commerce Companies in Sweden Selling to Other
Countries, August 2016
• Breakdown of Top 5 Countries That E-Commerce Companies in Sweden Sell to, in % of E-Commerce Companies Selling to Other Countries,
August 2016
11
TABLE OF CONTENTS (5 OF 5)
3. Europe (Cont.)
3.3. Emerging Markets
3.3.1. Russia
• B2C E-Commerce Sales, in RUB billion, and Breakdown by Domestic and Cross-Border Imports, in %, 2011 – 2016e
• Cross-Border B2C E-Commerce Imports, in RUB billion, 2013 – 2016e
• Number of Shipments of Goods from Foreign Online Stores, in millions, 2013 – 2016e
• Breakdown of Cross-Border Online Spending and Number of Shipments by Country, in %, 2016e
• Share of Moscow and St. Petersburg in Cross-Border B2C E-Commerce Imports, in %, H1 2016
• Breakdown of Cross-Border E-Commerce Imports by Product Categories, in %, 2016e
• Product Categories Purchased Online, by Purchased from Russian Online Stores, Chinese Online Stores, and English Language Online Stores,
in % of Online Shoppers in Russia, September 2016
• Share of Online Shoppers in Russia Who Purchased from Russian Online Stores from Own City and Another City, from Chinese Online Stores
and from English Language Online Stores, in %, 2013 - 2016
• Breakdown of Cross-Border B2C E-Commerce Exports by Product Category, in USD million and in %, 2016e
• Breakdown of Cross-Border B2C E-Commerce Exports by Regions, by Sales and Number of Buyers, in %, 2016e
• Main Barriers to Cross-Border B2C E-Commerce Exports, in % of Merchants in Russia Selling Goods or Services Online to Other Countries, in
%, September 2016
3.3.2. Poland
• Cross-Border Online Shopper Penetration, by Age Group, in % of Internet Users in Poland, April 2016
• Product Categories Purchased from Foreign Online Merchants, in % of Cross-Border Online Shoppers in Poland, April 2016
• Top 3 Foreign Online Merchants Purchased from, in % of Cross-Border Online Shoppers in Poland, 6 Months to April 2016
3.3.3. Turkey
• Number of Cross-Border E-Commerce Transactions with Domestic Bank Cards, in millions, and Value, in TRY million, Q1 2014 – Q4 2016
3.3.4. Czech Republic
• Cross-Border Online Shopper Penetration, by Age Group and Gender, in % of Online Shoppers in the Czech Republic, by Purchasing from
Other EU Countries and Non-EU Countries, Compared to Domestic Online Shoppers Only, 2016
3.3.5. Hungary
• Cross-Border Online Shopper Penetration, in % of Online Shoppers in Hungary, 2015
12
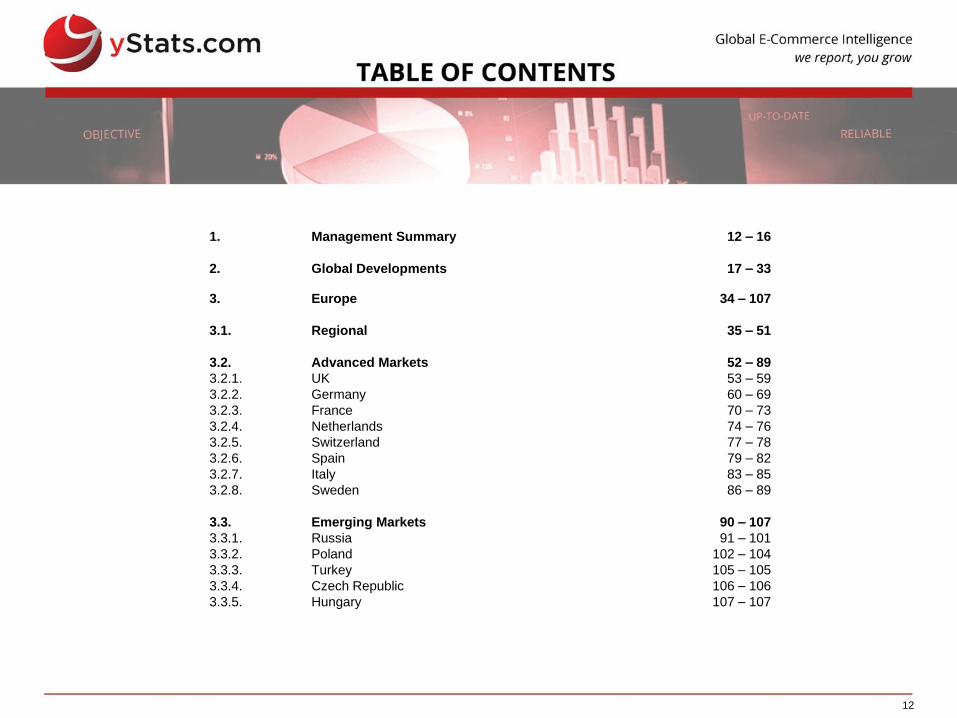
1. Management Summary 12 – 16
2. Global Developments 17 – 33
3.
3.1.
3.2.
3.2.1.
3.2.2.
3.2.3.
3.2.4.
3.2.5.
3.2.6.
3.2.7.
3.2.8.
3.3.
3.3.1.
3.3.2.
3.3.3.
3.3.4.
3.3.5.
Europe
Regional
Advanced Markets
UK
Germany
France
Netherlands
Switzerland
Spain
Italy
Sweden
Emerging Markets
Russia
Poland
Turkey
Czech Republic
Hungary
34 – 107
35 – 51
52 – 89
53 – 59
60 – 69
70 – 73
74 – 76
77 – 78
79 – 82
83 – 85
86 – 89
90 – 107
91 – 101
102 – 104
105 – 105
106 – 106
107 – 107
13
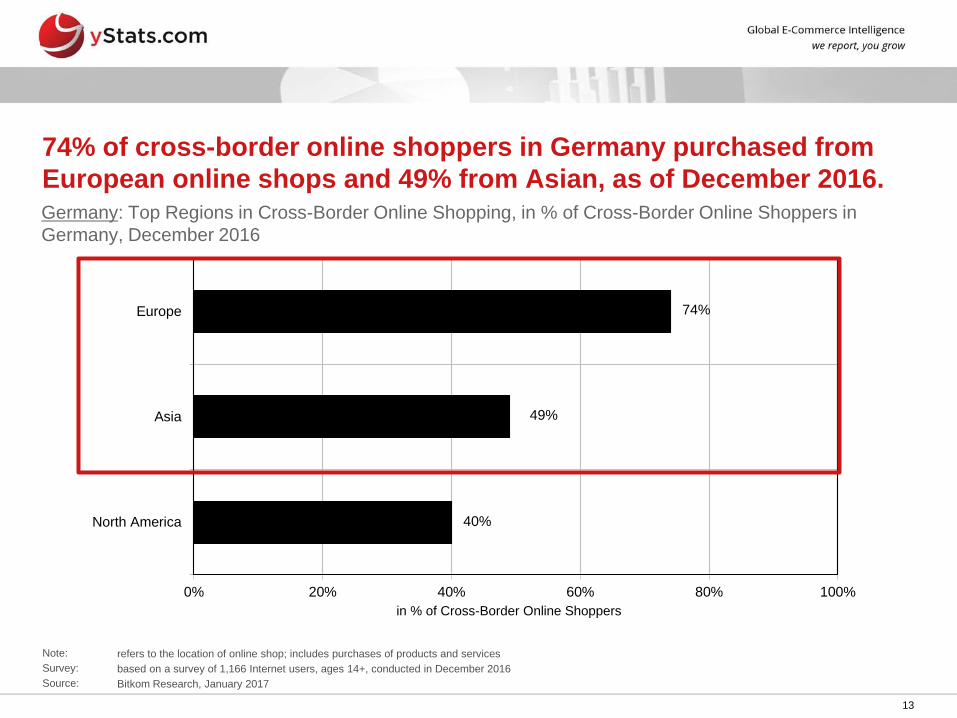
40%
49%
74%
0% 20% 40% 60% 80% 100%
North America
Asia
Europe
in % of Cross-Border Online Shoppers
74% of cross-border online shoppers in Germany purchased from
European online shops and 49% from Asian, as of December 2016. Germany: Top Regions in Cross-Border Online Shopping, in % of Cross-Border Online Shoppers in
Germany, December 2016
Note: refers to the location of online shop; includes purchases of products and services
Survey: based on a survey of 1,166 Internet users, ages 14+, conducted in December 2016
Source: Bitkom Research, January 2017
14
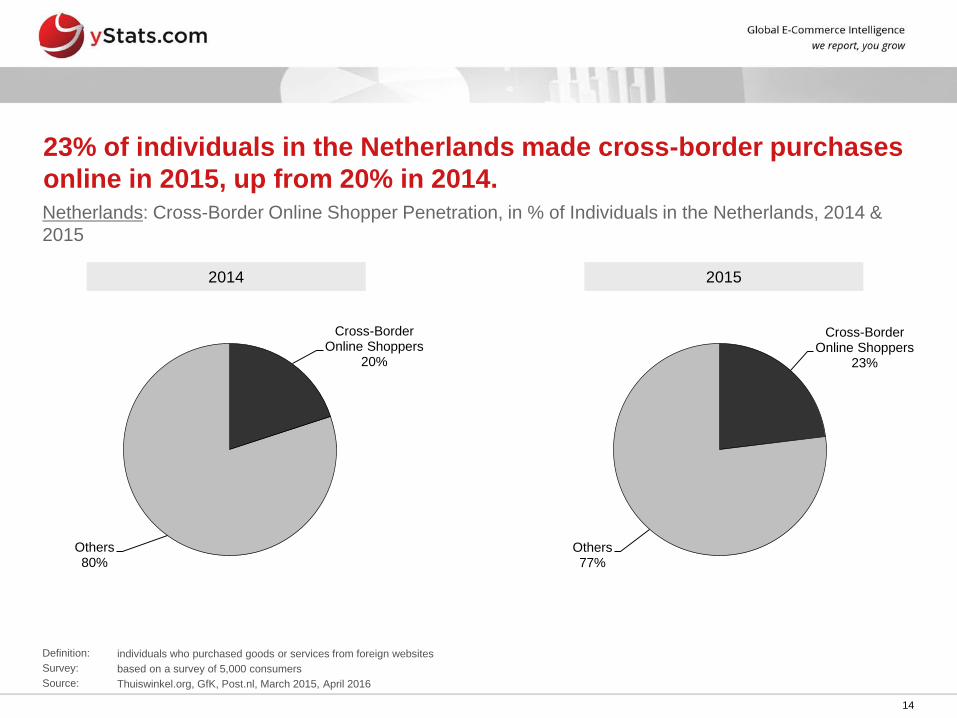
Cross-Border Online Shoppers
20%
Others 80%
2015 2014
Cross-Border Online Shoppers
23%
Others 77%
23% of individuals in the Netherlands made cross-border purchases
online in 2015, up from 20% in 2014. Netherlands: Cross-Border Online Shopper Penetration, in % of Individuals in the Netherlands, 2014 &
2015
Definition: individuals who purchased goods or services from foreign websites
Survey: based on a survey of 5,000 consumers
Source: Thuiswinkel.org, GfK, Post.nl, March 2015, April 2016

15