Sample Graphs/Charts
5
Sample Graphs/Charts
-
Upload
adrian-carter -
Category
Documents
-
view
58 -
download
0
description
Sample Graphs/Charts. Seashore/Ocean Biome. - PowerPoint PPT Presentation
Transcript of Sample Graphs/Charts

Sample Graphs/Charts

Seashore/Ocean Biome

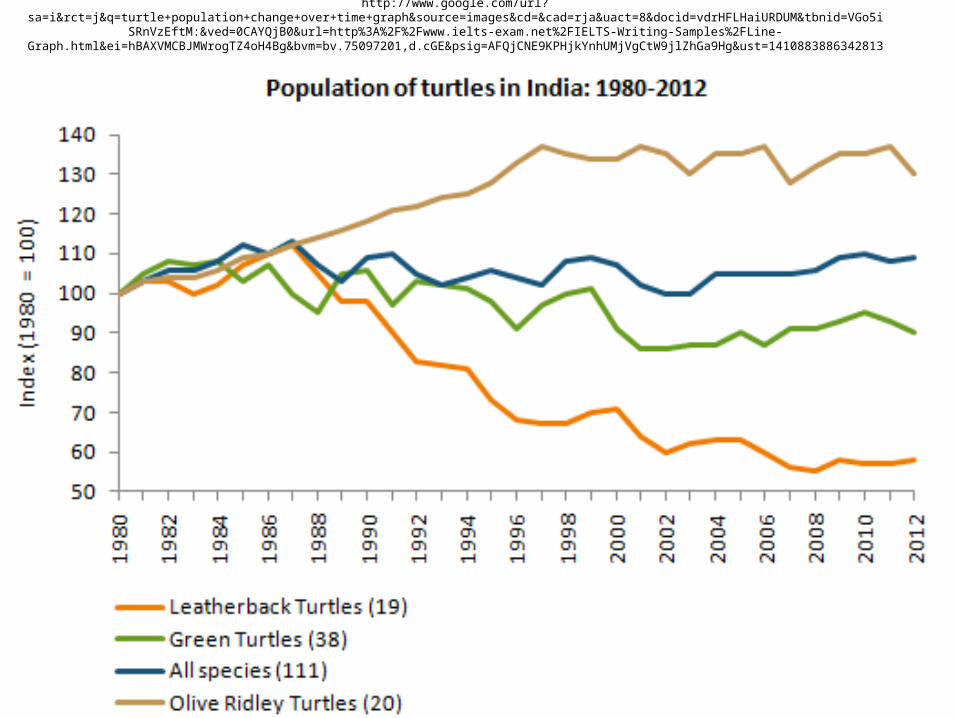
http://www.google.com/url?sa=i&rct=j&q=turtle+population+change+over+time+graph&source=images&cd=&cad=rja&uact=8&docid=vdrHFLHaiURDUM&tbnid=VGo5iSRnVzEftM:&ved=0CAYQjB0&url=http
%3A%2F%2Fwww.ielts-exam.net%2FIELTS-Writing-Samples%2FLine-Graph.html&ei=hBAXVMCBJMWrogTZ4oH4Bg&bvm=bv.75097201,d.cGE&psig=AFQjCNE9KPHjkYnhUMjVgCtW9jlZhGa9Hg&ust=1410883886342813

Human impact of increased CO2 causes ocean acidification, which lowers biodiversity. Alaska has been more strongly affected because it’s colder there and more CO2 is absorbed than in warmer water. AOOS is committed to working with a coalition of partners to fund, deploy and maintain buoys and moorings that monitor ocean pH.