Sample Design and Sampling Error - faculty.nps.edufaculty.nps.edu/rdfricke/MCOTEA_Docs/Lecture...
31
1 Sample Design and Sampling Error Professor Ron Fricker Naval Postgraduate School Monterey, California
Transcript of Sample Design and Sampling Error - faculty.nps.edufaculty.nps.edu/rdfricke/MCOTEA_Docs/Lecture...

1
Sample Design and Sampling Error
Professor Ron Fricker
Naval Postgraduate School
Monterey, California

2
Goals for this Lecture
• Introduction to sampling
– Convenience vs. random sampling
– Types of random sampling: simple random,
stratified, and cluster sampling
• Define “margin of error”
• Basic power calculations under SRS
– Continuous vs. binary response
• Finite population correction

3
Sampling for Statistical Inference
Population
Unobserved population
statistic
Sample
statisticinference
sample

4
Good Statistical Inference is (Almost) All About Good About Sampling
• If we are to use a sample to infer something about a
population, we need to:
– Be able to quantify how far off our sample statistic could be
from the population statistic (sampling error)
– Have some assurance that the sample is representative of
the population (i.e., minimize the chance of bias)
• Using a random sample is protection against
(unknowingly) selecting a biased sample
• Classical statistics is all about quantifying uncertainty
(i.e., sampling error) and using that information to
determine statistical significance

5
Types of Samples
• Convenience sample: Individuals in the
population decide to join the sample
– 900 number and other call-in polls
– Website surveys (often)
– Shopper and visitor surveys
• Random sample: Individuals or units are
chosen randomly from the population
– Whether or not part of the sample is not
individual’s choice/decision

6
Types of Random Sampling
• Simple random sample (SRS): any two samples of the same size are equally likely to be selected
• Some other possible random sampling methods: – Stratified sampling
• Divide population into nonoverlapping, homogeneous groups and then draw a SRS from each group
– Cluster sampling
• Data naturally occurs in clusters
• Use SRS to select clusters
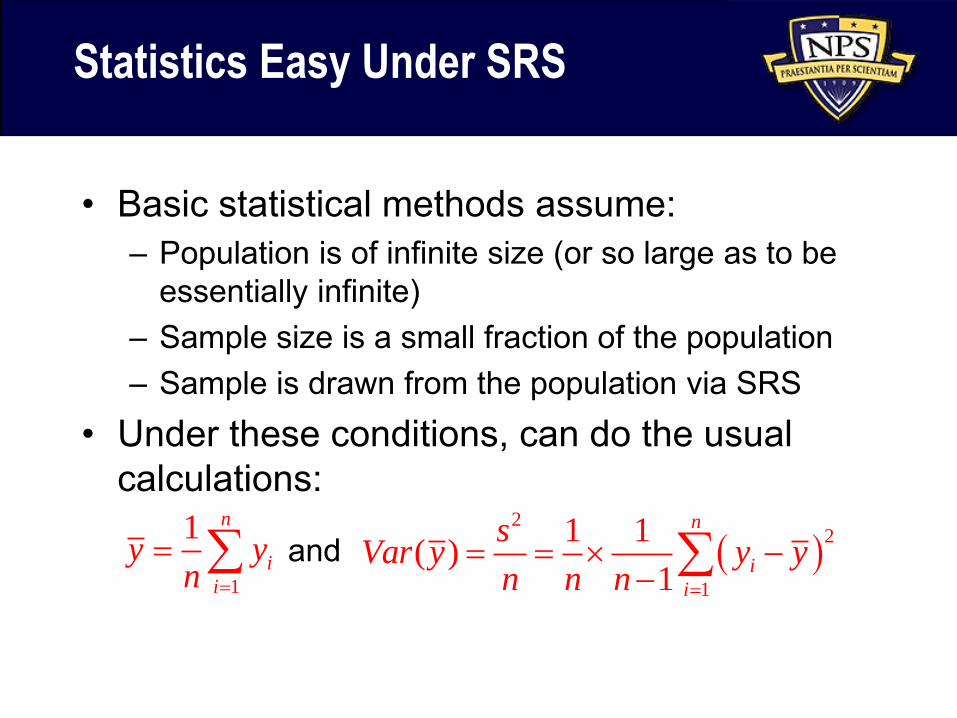
Statistics Easy Under SRS
• Basic statistical methods assume:
– Population is of infinite size (or so large as to be
essentially infinite)
– Sample size is a small fraction of the population
– Sample is drawn from the population via SRS
• Under these conditions, can do the usual
calculations:
and 2
2
1
1 1( )
1
n
i
i
sVar y y y
n n n
1
1 n
i
i
y yn

8
Finite Population Correction
• Previous calculations assumed an infinite
population size
– Fine when fraction being surveyed less than 5%
– Then
• If surveying more than 5 percent of the
population, must adjust the estimated sample
variance using a finite population correction
2
2( ) 1 /N n s
Var y f s nN n
/ 0f n N

Standard Error Estimates
• For various
sample sizes,
standard errors
for an infinite-
sized population
and one with
N=300
– Binary question
– Conservative
p=0.5 assumption
9

10
What Does “Margin of Error” Mean?
• Margin of error is just half the width of a 95
percent confidence interval
• Common survey terminology
– Convention is a 3% margin of error
– Means a 95% CI is the survey result +/- 3%
• To achieve a desired margin of error, must
have the right sample size (n)
– Power calculations are done by statisticians to
figure out the required sample size to achieve a
particular margin of error

11
2 2
/ 2
2
4z sn
w
SRS: How Much Data to Estimate m?
• To figure out how much data you need:
– Determine w, the desired width of the confidence
interval. Remember,
– Get an estimate of s from somewhere, a pilot
study, for instance
– Choose the confidence level: 100(1-)
– Required sample size:
n
szw 2/2

12
SRS: How Much Data for p?
• To figure out how much data you need:– Choose E, the margin of error
– Then,
– Algebra gives required sample size:
• Can simplify further:– Estimate p using worst case: 1/2
– For 95% CI, approximate with =2
– Then,
2
2
2/ )ˆ1(ˆ
E
ppzn
nppzE /)ˆ1(ˆ2/
21/n E2/z

13
Power Calculations
• Some of the steps in determining required sample size:– Make conservative assumptions about sample
variability (e.g., s)
– Use question with largest n (e.g., binary question)
– Multiply by number of strata / groups (i.e., smallest unit of analysis)
– Inflate to account for nonrespondents, missing data, etc.
• Can get tricky for non-SRS sampling methods– Don’t hesitate to consult a statistician

14
Stratified Sampling: What and Why?
• Stratified (random) sampling divides the
sampling frame up into strata from which
separate random samples are drawn
• Two main reasons, one practical and one
statistical
– To ensure sufficient observations are drawn from
small strata (i.e., to oversample)
• Often necessary to meet survey’s objectives
– To reduce the variance in the sample statistic(s)
• Assuming strata are relatively homogeneous

15
An Example

Proportionate Allocation to Strata
• Sample size within each strata is proportional
to strata size in population
• If N is population size and n is total sample
size, then where
– Nh is the population size of stratum h
– nh is the sample size for stratum h
• Estimate the population mean as
16
1 1
/H H
st h h h h
h h
y W y N N y
/ /h hn n N N

Proportionate Allocation to Strata
• Assuming SRS in each strata, the estimate of
the variance of the sample mean is
17
2 2
1
22
1 1
2
1 1
1 /
1 1
1
1
h
h
H
st h h h h
h
nHh h h
hi h
h ih h h
nHh h h
hi h
h ih h
v y W f s n
N N ny y
N N n n
N N ny y
N n n

18
Example
• Note (simple average)
• However (0.4 6) (0.5 5) (0.1 8) 5.7sty
(6 5 8) /3 6.3y

Design Effects
• Design effect compares how variation from
stratified sampling compares to SRS
• Design effect can be greater or less than 1
• But with reasonably homogeneous strata,
almost always get decrease in variance
– Means smaller std errors and confidence intervals
19
2 2
2 1
2
1 /
1 /
H
h h h hst h
SRS
W f s nv y
dv y f s n

Systematic Sampling
• Systematic sampling: can be a simple way to
do stratified sampling (proportional to size)
– Basic idea: take every kth element in list-based
sampling frame,
• Sort frame by strata
• If k is fractional, round up or down
• Select a random integer between 1 and N
• Start at that element in the frame and take
every kth element thereafter (if the end of the list
is reached, go to the beginning and continue)
• Aka implicitly stratified sampling
/k N n

21
Systematic Selection
Random start

What is Cluster Sampling?
• Units for survey occur in groups (clusters)
• Cluster sampling: use probability sampling to
select clusters, survey all units in each cluster
– Aka single stage cluster sampling
• There are more complicated types of cluster
sampling such as two-stage cluster sampling
– Select primary sampling units (PSUs) by
probability sampling
– Within each selected PSU, sample secondary
sampling units (SSUs) via probability sampling
– Survey all units in each selected SSU 22

Advantages and Disadvantages of Cluster Sampling
• Advantages:
– For some populations, cannot construct list-based
sampling frame
• Can first sample by cluster (area,
organizational, etc) then sample within
– For some efforts, too expensive to conduct a SRS
• E.g., drawing a SRS from the US population for
an in-person interview
• Disadvantage: Cluster samples generally
provide less precision than SRS or stratified
samples23

When To Use Cluster Sampling
• Use cluster sampling only when economically
justified
– I.e., when cost savings overcome (require) loss in
precision
• Most likely to occur when
– Constructing a complete list-based sampling
frame is difficult, expensive, or impossible
– The population is located in natural clusters
(schools, city blocks, etc.)
24

25
Example #1: Small Village

Example #2: NAEP
• Assume:
– 40,000 4th grade classrooms in US
– B=25 students per classroom
• Sampling procedure:
– Select a classrooms
– Visit each classroom and collect data on all
students
• If a = 8, will have data on 200 students
• Note the differences from SRS
– All groups of 200 students cannot be sampled
– Students in each classroom more likely to be alike26

• Would calculate the mean test score as
• And the variance is
where
Key idea: Only the classrooms are random
Mean & Variance Computations
1 1
a By
yaB
27
21a
fv y s
a
22
1
1
1
a
as y ya

The Design Effect
• Consider 8 classrooms with mean scores of
370, 370, 375, 375, 380, 380, 390, and 390
– So,
• Then and
• Suppose a SRS with n=200 gives
so that
• Design effect (d2) is the ratio of the variances:
28
2 62.5as 7.81v y 2 500s
2.50SRSv y
2 ( ) 7.813.13
( ) 2.50SRS
v yd
v y
378.75y

Interpretation
• In example, the design effect says that
clustering tripled the sampling variance
• Means an increase in the standard error (and
hence the confidence limits) of 77%
– Because
• Says in this case we need almost twice the
sample size as a SRS sample to get the
same precision
29
3.13 1.77

Effective Sample Size
• I like to think about design effects in terms of
effective sample size
– What size SRS would give the same precision as
the clustered sample?
• In previous example, we had n = 200 with
d2 = 3.13
– The effective sample size is
– So we could have done a SRS of a sample of 64
and achieved the same precision
– Would have meant going to 64/25 = 2.6 times as
many sites – perhaps unaffordable 30
200 / 3.13 64effn

What We Have Covered
31
• Introduction to sampling
– Convenience vs. random sampling
– Types of random sampling: simple random,
stratified, and cluster sampling
• Defined “margin of error”
• Basic power calculations under SRS
– Continuous vs. binary response
• Finite population correction