SAMPLE COSTS TO PRODUCE ORGANIC LEAF …...The sample costs to produce organic leaf lettuce in the...
19
LT-CC-09-O UNIVERSITY OF CALIFORNIA COOPERATIVE EXTENSION 2009 SAMPLE COSTS TO PRODUCE ORGANIC LEAF LETTUCE Double-Cropped CENTRAL COAST REGION Santa Cruz & Monterey Counties Laura Tourte UC Cooperative Extension Farm Advisor, Santa Cruz County Richard F. Smith UC Cooperative Extension Farm Advisor, Monterey County Karen M. Klonsky UC Cooperative Extension Specialist, Department of Agricultural and Resource Economics, UC Davis Richard L. De Moura UC Cooperative Extension Staff Research Associate, Department of Agricultural and Resource Economics, UC Davis
Transcript of SAMPLE COSTS TO PRODUCE ORGANIC LEAF …...The sample costs to produce organic leaf lettuce in the...
LT-CC-09-O
UNIVERSITY OF CALIFORNIA COOPERATIVE EXTENSION
2009
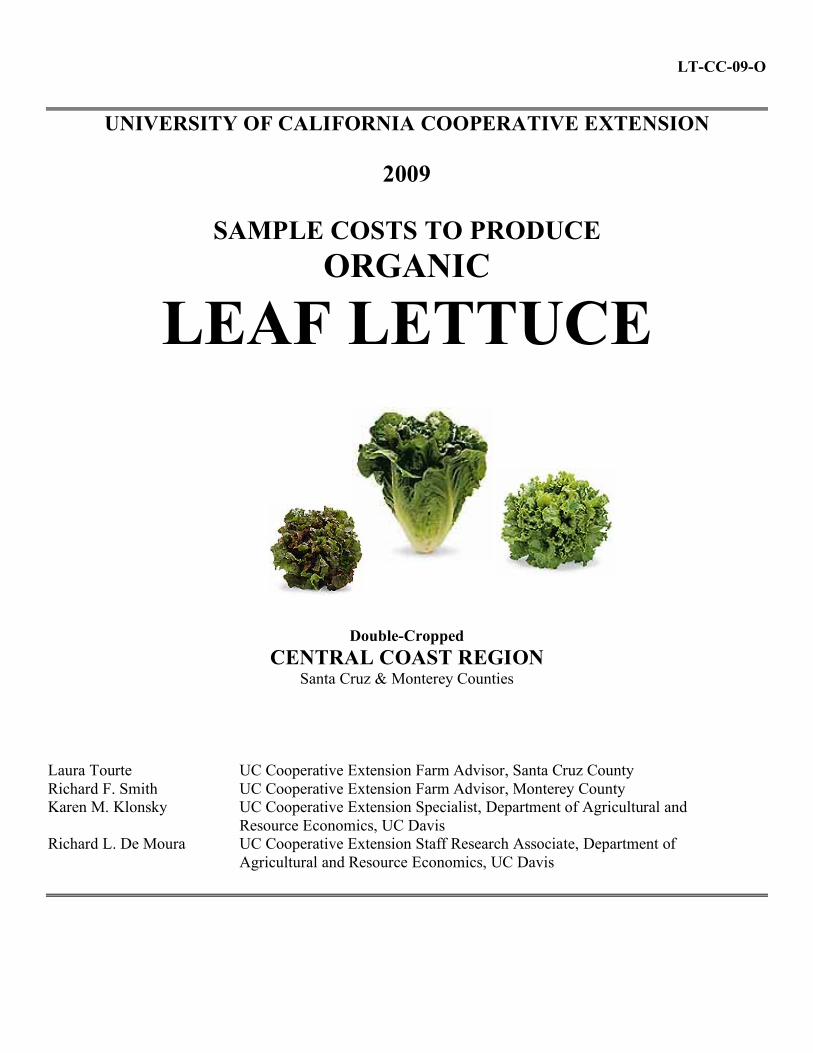
SAMPLE COSTS TO PRODUCE
ORGANIC
LEAF LETTUCE
Double-Cropped CENTRAL COAST REGION
Santa Cruz & Monterey Counties
Laura Tourte UC Cooperative Extension Farm Advisor, Santa Cruz County Richard F. Smith UC Cooperative Extension Farm Advisor, Monterey County Karen M. Klonsky UC Cooperative Extension Specialist, Department of Agricultural and Resource Economics, UC Davis Richard L. De Moura UC Cooperative Extension Staff Research Associate, Department of Agricultural and Resource Economics, UC Davis
2009 Leaf Lettuce Costs and Returns Study (ORGANIC) Central Coast UC Cooperative Extension 2
UNIVERSITY OF CALIFORNIA COOPERATIVE EXTENSION
SAMPLE COSTS TO PRODUCE ORGANIC LEAF LETTUCE - Central Coast Region 2009
CONTENTS INTRODUCTION............................................................................................................................................2 ASSUMPTIONS ..............................................................................................................................................3 Production Operating Costs ............................................................................................................................3 Labor, Interest and Equipment ........................................................................................................................5 Cash Overhead ...............................................................................................................................................6 Non-Cash Overhead........................................................................................................................................7 Acknowledgements.........................................................................................................................................8 REFERENCES.................................................................................................................................................9 Table 1. Cost Per Acre to Produce Organic Leaf Lettuce................................................................................10 Table 2. Costs and Returns Per Acre to Produce Organic Leaf Lettuce...........................................................12 Table 3. Monthly Cash Costs Per Acre to Produce Organic Lettuce ...............................................................14 Table 4. Ranging Analysis .............................................................................................................................16 Table 5. Whole Farm Annual Equipment, Investment, and Business Overhead Costs ....................................17 Table 6. Hourly Equipment Costs ..................................................................................................................18 Table 7. Operations with Equipment ..............................................................................................................19
INTRODUCTION
Organic production, as defined by the USDA’s Organic Foods Production Act of 1990, as amended (7 U.S.C. 6501 et seq.), is ‘a production system that is managed in accordance with the Act and associated regulations to respond to site-specific conditions by integrating cultural, biological, and mechanical practices that foster cycling of resources, promote ecological balance, and conserve biodiversity’.
The sample costs to produce organic leaf lettuce in the Central Coast Region – Santa Cruz and Monterey
Counties - are presented in this study. The study is intended as a guide only, and can be used to make production decisions, determine potential returns, prepare budgets and evaluate production loans. The practices described are based on production procedures considered typical for this crop and area, but will not apply to every situation. Sample costs for labor, materials, equipment and custom services are based on current figures. A “Your Costs” column in Tables 1 and 2 is provided for you to enter your farm costs.
The hypothetical farm operation, production practices, overhead, and calculations are described under
the assumptions. For additional information or explanation of calculations used in the study call the Department of Agricultural and Resource Economics, University of California, Davis, California, (530) 752-3589 or the Santa Cruz County UC Cooperative Extension office, (831) 763-8040.
Sample Cost of Production Studies for many commodities can be downloaded at http://coststudies.ucdavis.edu , requested through the Department of Agricultural and Resource Economics, UC Davis, (530) 752-1517 or from local county UC Cooperative Extension offices.
The University of California does not discriminate in any of its policies, procedures or practices. The university is an affirmative action/equal opportunity employer.
2009 Leaf Lettuce Costs and Returns Study (ORGANIC) Central Coast UC Cooperative Extension 3
ASSUMPTIONS
The following assumptions refer to tables 1 to 7 and pertain to sample costs to produce organic leaf lettuce in the Central Coast Region – Santa Cruz and Monterey Counties. Cultural practices and costs for organic lettuce production vary considerably among growers within the region; therefore, many of the costs, practices, and materials in this study will not be applicable to every farm. The practices and inputs used in this cost study serve as a guide only. The use of trade names and cultural practices in this report does not constitute an endorsement or recommendation by the University of California nor is any criticism implied by omission of other similar products or cultural practices.
Farm. The hypothetical farm is based on a 200 non-contiguous acre vegetable crop operation on which five acres are planted to organically grown fresh market leaf lettuce. Other crops grown are conventional and organic broccoli, cauliflower, and celery. The farm has met all requirements for organic production. The farm can produce up to 2 to 2.5 vegetable crops per year on each field. However in organic systems, when cover crops are planted, the number of vegetable or cash crops is often reduced to 1.5 to 2.0 crops per year per field. For this study, two crops per field per year (double-cropped) are assumed. Costs that affect both crops are allocated accordingly. The farm is operated by the grower and includes rented land on which the organic lettuce is planted. Organic farmers generally use a ‘systems management’ approach to farming by including a suite of production practices such as crop rotation, diversification, cover crops and organic matter additions to help build soil fertility and manage pests. Also, growers are continually experimenting with new techniques—especially in fertilization and pest management—as new strategies and technologies become available.
Production Operating Costs
Land Preparation. Primary tillage, which includes discing, rolling, subsoiling, and land leveling,
occurs in October and November of the year preceding planting. Fields are subsoiled, disced and rolled two times, then chiseled twice, followed by two passes with a landplane (these costs are allocated equally to the two crops). The land is disced and rolled in August following the first crop. In August, a custom operator lists the 40-inch beds and incorporates the preplant fertilizer. Two passes are made with a rolling cultivator; then in one operation, the grower shapes and rolls the bed.
Cover Crop. A cereal/legume mix cover crop is planted every second season (alternate years) at 120
pounds per acre following basic land preparation. However, practices vary widely among organic growers. For example, alternative cover crops that are used include cereal cover crops and mustards. In addition the frequency of their use can vary between growers (i.e. every year versus every other year). The crop is mowed in March of the first year and incorporated into the soil with two discing passes. One-half of the cost is allocated to the field each year with one-quarter of the cost charged to each crop (4 crops over a 2 year period).
Plant/Stand Establishment. An organically grown leaf lettuce variety is direct seeded using a four-
bed precision planter, planting two-rows (lines) on 40-inch beds. Fields are planted to a stand of 156,000 plants per acre at two to three-inch plant spacing. Alyssum for insectary purposes is planted on 5% of the acres, thus reducing the actual lettuce population to 148,200 plants per acre over the five acres. In the Central Coast leaf lettuce is planted from late December to mid-August. In this study the lettuce is planted in August following an organic broccoli crop. The plants are hand thinned approximately 30 days after planting.
Fertilize/Soil Amendments. Five tons of compost and one ton of gypsum (two and one-half tons of compost and one-half ton of gypsum are allocated to each crop) are commercially broadcast over the field prior to the primary tillage operations. The gypsum and compost are blended and applied in a single operation.
2009 Leaf Lettuce Costs and Returns Study (ORGANIC) Central Coast UC Cooperative Extension 4
Pelleted chicken manure (4-4-2) at 1,000 pounds per acre (40 pounds N) is applied at listing. Blood meal (13-0-0) is sidedressed by the grower at 450 pounds (58.5 pounds N) per acre approximately 30 to 35 days after planting (September). Phytamin 801, an organic liquid fertilizer, is applied through the drip system at six-gallons or 57 pounds per acre three times (September 1X; October 2X), totaling 18 gallons or 171 pounds (10.26 lbs N) per acre. It is assumed that soil building practices including incorporation of cover crops and applications of compost increase soil organic matter levels to mineralize sufficient N for the remainder of the crop needs.
Irrigation. The water is pumped from wells. Based on current grower and district information, the
estimated cost is $100.00 per acre-foot or $8.33 per acre-inch. Water costs vary considerably depending upon water district and pumping variables. In some areas district or agency fees may apply. A pre-irrigation using two acre-inches is applied prior to seedbed preparation to soften the soil. Approximately three-acre inches of water are applied through sprinklers during stand establishment – two-inches during the first 6-10 days after planting and another inch 2-3 weeks later prior to thinning. An additional 12.00 acre-inches are applied through the drip system during the remainder of the growing season for a seasonal total of 15.00 acre-inches. Total water applied including the pre-irrigation is 17.00 acre-inches. Water use will vary depending on various factors such as irrigation method, soil type, weather, and the time of the year the crop is planted.
Drip Tape. The grower lays the drip tape down the center of the bed by hand after thinning. Prior to
harvest the tape is picked up and hydraulically rolled onto spindles. Each operation is assumed to require an equipment operator and 3 men to handle the tape. The tape is assumed to last one year and used on two crops. One half of the drip tape is allocated to each crop.
Pest Management. Pest control materials and rates mentioned in this cost study are listed in Integrated
Pest Management for Cole Crops and Lettuce and UC Pest Management Guidelines: Lettuce. For more information on pesticides available, pest identification, monitoring, and management visit the UC IPM website at www.ipm.ucdavis.edu. Written recommendations are required for many commercially applied pesticides and are made by licensed pest control advisers. For information and pesticide use permits, contact the local county agricultural commissioner's office.
Pest Control Adviser. A Pest Control Adviser (PCA) or Consultant monitors the field for insects,
diseases, beneficial insects, and agronomic problems to determine if control measures are necessary. The Pest Management Consultant fee in this study is $30 per acre.
Weeds. The crop is thinned and weeded 30 to 35 days post plant (September). The field is cultivated
after thinning, and two weeks later, it is cultivated and furrowed (break bottoms). The fields are handweeded approximately three weeks after thinning (October), then cultivated and furrowed (break bottoms).
Insects. Lettuce aphid is managed with the use of insectary plantings in this study. The main beneficial
is the syrphid fly. One bed with two rows (lines) every 20 beds (5% of the acres) in the field are planted in August to alyssum using a planter junior. Seeding rate per acre is two to three million seed or approximately one pound. In this study 0.05 pounds per acre are planted over the five acres. The percentage of acreage planted will depend on the history of the field and pest pressure, but can range from 0 to 9%. Also the land cost or rent will influence the amount planted to insectaries – lower cost ground, more planting; higher cost ground, lesser planting. A Bacillus thuringiensis pesticide (Dipel) for worm control is applied in September. Also during the same application, a Pyrethrum based insecticide (Pyganic) is applied for worm and aphid control.
2009 Leaf Lettuce Costs and Returns Study (ORGANIC) Central Coast UC Cooperative Extension 5
Disease. Downey mildew can cause damage and crop loss in organic lettuce production. Organically acceptable copper products are a possible means of disease management; however, the application will not provide control under severe pressure, but may provide limited control under low to moderate pressure. Resistant varieties are the best control strategy for downy mildew in lettuce. No fungicides are applied in this study.
Harvest. Organic leaf lettuce is hand harvested (field-packed) under contract 70 to 80 days after
planting. Cool season plantings may require 130 days to mature but as the season warms, time to maturity decreases. Total costs will vary by type of pack, labor (piece rate vs. hourly), packer and other miscellaneous items. The costs in this study are $2.00 for the box (carton), $2.15 per box for harvest labor, which brings the field harvest cost to $4.15 per packed box, 24 heads per box weighing 20 to 26 pounds (25 lbs in this study) per box. Transportation costs vary depending on the distance to market and are included in the above costs. Most growers are within a 25-mile radius of the cooler. Cooling and palletizing cost an additional $1.10 per box, which brings the total harvest cost to $5.25 per box. Selling costs are 8% of the market price and $1.20 per box is used.
Yields. The crop yield is 750 twenty-five pound boxes or 9.38 tons per acre, which takes into account
the 5% acreage dedicated to the insectary planting. The typical yield range in the area is 500 to 1,000 boxes per acre. Like conventionally produced crops, yields for organically produced crops can vary depending on site and growing conditions. In some situations, and in years with high pest populations, organic yields may be lower than conventional yields because of fewer treatment options. Conversely, when growing conditions are optimal, and pest pressure low, organic yields can be similar or the same as conventional yields.
Returns. The price for Central Coast fresh market organic leaf lettuce delivered and sold through
grower-shipper channels is assumed for this study to be $15.00 per 25-pound box. This information is derived by using 70% of the average 2006 - 2008 San Francisco Terminal Market California origination selling prices. Table 4 shows the net returns above operating costs, cash costs and total costs for a range of prices and yields.
Pickup. The grower uses the pickup for business and personal use. The assumed business use is 2,856
miles per year for the farm. Labor, Interest and Equipment
Labor. Labor rates of $17.55 per hour for machine operators and $13.50 for general labor includes
payroll overhead of 35%. The basic hourly wages are $13.00 for machine operators and $10.00 for general labor. The overhead includes the employers’ share of federal and California state payroll taxes, workers' compensation insurance for truck crops (code 0172), and a percentage for other possible benefits. Workers’ compensation insurance costs will vary among growers, but for this study the cost is based upon the average industry final rate as of January 1, 2008 (California Department of Insurance, March 18, 2008, unreferenced). Labor for operations involving machinery are 20% higher than the operation time given in Table 1 to account for the extra labor involved in equipment set up, moving, maintenance, work breaks, and field repair.
Interest On Operating Capital. Interest on operating capital is based on cash operating costs and is calculated monthly until harvest at a nominal rate of 5.75% per year. A nominal interest rate is the typical market cost of borrowed funds. The interest cost of post harvest operations is discounted back to the last harvest month using a negative interest charge.
Equipment Operating Costs. Repair costs are based on purchase price, annual hours of use, total
hours of life, and repair coefficients formulated by American Society of Agricultural Engineers (ASAE). Fuel
2009 Leaf Lettuce Costs and Returns Study (ORGANIC) Central Coast UC Cooperative Extension 6
and lubrication costs are also determined by ASAE equations based on maximum power takeoff (PTO) horsepower, and fuel type. Prices for on-farm delivery of red dye diesel and gasoline are $3.70 (excludes excise taxes) and $3.56 per gallon, respectively. The cost includes a 2% local sales tax on diesel fuel, but does not include excise taxes. Gasoline costs include an 8% sales tax plus federal and state excise tax. Some federal and excise tax can be refunded for on-farm use when filing your income tax. The costs are based on 2008 (July to December) American Automobile Association (AAA) and Department of Energy (DOE) monthly data. The fuel, lube, and repair cost per acre for each operation in Table 1 is determined by multiplying the total hourly operating cost in Table 6 for each piece of equipment used for the selected operation by the hours per acre. Tractor time is 10% higher than implement time for a given operation to account for setup, travel and down time.
Risk. Risks associated with organic lettuce production are not assigned a production cost. While this study makes every effort to model a production system based on typical, real world practices, it cannot fully represent financial, agronomic and market risks that affect the profitability and economic viability of fresh market vegetable production. The market for fresh vegetables is volatile for both price and quantity. A market channel should be determined before any lettuce production begins.
Cash Overhead Cash overhead consists of various cash expenses paid out during the year that are assigned to the whole
farm and not to a particular operation. Because overhead costs are farm and ranch specific, costs will vary among growers. Costs are split in most cases equally between the double cropped acreage.
Property Taxes. Counties charge a base property tax rate of 1% on the assessed value of the property.
In some counties special assessment districts exist and charge additional taxes on property including equipment, buildings, and improvements. For this study, county taxes are calculated as 1% of the average value of the property. Average value equals new cost plus salvage value divided by two on a per acre basis.
Insurance. Insurance for farm investments varies depending on the assets included and the amount of
coverage. Property insurance provides coverage for property loss and is charged at 0.82% of the average value of the assets over their useful life. Liability insurance covers accidents on the farm and costs $861 for the entire farm or $4.31 per acre.
Office Expense. Annual office and business expenses are estimated at $250 per acre. Being two crops
are grown on the same acres; $125 is allocated to each crop. These expenses include office supplies, telephones, bookkeeping, accounting, legal fees, road maintenance, etc.
Rent. Land rents for Monterey and Santa Cruz Counties ranges from $900 to $2,500 per acre. In this
study, land rented for lettuce and broccoli production is $2,200 per acre with $1,200 allocated to lettuce and $1,000 to broccoli. Rents vary by area and ground quality. The land rented includes developed wells and irrigation system. The landowner incurs all costs for the land and the irrigation system.
Organic Certification. The grower pays an annual fee based on total organic farm income as well as a
crop and organic system plan inspection fee. The crop inspection fee varies based on inspector’s hourly rate, travel time and associated travel expenses. For this study, the cost of $900 is based on the double cropped organic lettuce and organic broccoli each grown on the five acres. A cost of $90 per acre is charged to each crop.
2009 Leaf Lettuce Costs and Returns Study (ORGANIC) Central Coast UC Cooperative Extension 7
Food Safety Program. Many growers of fresh market commodities such as leafy greens incorporate and participate in food safety programs for their operations. Part of a food safety program is participation in third party (independent) audits that are done to ensure the safety of fresh products and accommodate buyer requests, and to enhance marketability of the crop. Costs will vary depending upon farm or inspection circumstances. For this study, costs for the farm are estimated at approximately $1,000 per year.
Supervisor Salaries. Wages for managers are not included as a cash cost. Any returns above total
costs are considered a return to management. Field Sanitation. Sanitation services provide portable toilets and washbasins to the farm. The cost
includes a single toilet with washbasins, deliver and pickup, and two months of weekly servicing. Costs also include soap or other suitable cleansing agent, and single use towels. Separate potable water and single-use drinking cups are also supplied. Growers using contract labor may not have a separate sanitation cost. The contractor supplies the sanitation facilities.
Investment Repairs. Repair costs are the annual maintenance costs for investments in non-cash
overhead. For this study annual repairs are calculated as 2% of the new cost.
Non-Cash Overhead
Non-cash overhead is calculated as the capital recovery cost for equipment and other farm investments. Capital Recovery Costs. Capital recovery cost is the annual depreciation and interest costs for a capital
investment. It is the amount of money required each year to recover the difference between the purchase price and salvage value (unrecovered capital). Put another way, it is equivalent to the annual payment on a loan for the investment with the down payment equal to the discounted salvage value. This is a more complex method of calculating ownership costs than straight-line depreciation and opportunity costs, but more accurately represents the annual costs of ownership because it takes the time value of money into account. The calculation for the annual capital recovery costs is ((Purchase Price – Salvage Value) X Capital Recovery Factor) + (Salvage Value X Interest Rate).
Salvage Value. Salvage value is an estimate of the remaining value of an investment at the end of its
useful life. For farm machinery (tractors and implements) the remaining value is a percentage of the new cost of the investment (Boehlje and Eidman). The percent remaining value is calculated from equations developed by the American Society of Agricultural Engineers (ASAE) based on equipment type and years of life. The life in years is estimated by dividing the wearout life, as given by ASAE by the annual hours of use in this operation. For other investments including irrigation systems, buildings, and miscellaneous equipment, the value at the end of its useful life is zero. The salvage value for land is equal to the purchase price because land does not depreciate. The purchase price and salvage value for equipment and investments are shown in Table 5.
Capital Recovery Factor. Capital recovery factor is the amortization factor or annual payment whose
present value at compound interest is 1. The amortization factor is a table value that corresponds to the interest rate used and the life of the machine.
Interest Rate. The interest rate of 4.25% used to calculate capital recovery cost is the effective long term
interest rate effective January 8, 2009. The interest rate is provided by a local farm lending agency and will vary according to risk and amount of loan.
2009 Leaf Lettuce Costs and Returns Study (ORGANIC) Central Coast UC Cooperative Extension 8
New Grower Organic Certification Information (One time expense, costs not included). Organic growers are required to be registered with the state of California and certified by a federal government approved agency, for which they incur various costs. The total costs vary by the grower’s gross organic income, inspection time, and other possible fees. Estimated costs for the state and certifying agencies first year’s application and inspection fee is $700 or $140 per acre (5 acres) split equally between the two crops.
Building. The metal building or buildings are on a cement slab and comprise 2,400 square feet. Tools. This includes shop and field tools used on the farm. The value is estimated and does not
represent any specific data. Fuel Tanks. Two 300-gallon fuel tanks using gravity feed are on metal stands. The tanks are setup in a
cement containment pad that meets federal, state, and county regulations. Irrigation/Pipe/Trailers. The irrigation system is maintained by the landowner and included in the
land rental cost. The grower owns 1,456 feet of sprinkler pipe. The grower also owns two pipe trailers for hauling the pipe to the field. Irrigation water is pumped from a well and delivered to the fields through an underground pipe system. Main lines above ground are connected to the underground system to deliver water for the sprinkler and drip irrigations. In this study, water is pumped from a depth of 120 feet in a 500-foot well and the grower pays the pumping cost.
Equipment. Farm equipment is purchased new or used, but the study shows the current purchase price
for new equipment. The new purchase price is adjusted to 60% to indicate a mix of new and used equipment. Annual ownership costs for equipment and other investments are shown in Table 5. Equipment costs are composed of three parts: non-cash overhead, cash overhead, and operating costs. Both of the overhead factors have been discussed in previous sections. The operating costs consist of repairs, fuel, and lubrication and are discussed under operating costs.
Acknowledgements. The authors wish to thank the growers, pest control advisers, processors,
agricultural product dealers, and researchers who provided input. Table Values. Due to rounding, the totals may be slightly different from the sum of the components.
Some growers prefer to separate Harvest Costs from Total Cash Costs to reflect Total Growing Costs. In the tables in this study: Total Cash Costs - Harvest Costs = Total Growing Costs.
2009 Leaf Lettuce Costs and Returns Study (ORGANIC) Central Coast UC Cooperative Extension 9
REFERENCES Agricultural Commissioner. Annual Crop Reports. 2006-2007. Monterey County. Salinas, CA. American Society of Agricultural Engineers. (ASAE). 2002. American Society of Agricultural Engineers
Standards Yearbook. Russell H. Hahn and Evelyn E. Rosentreter (ed.). St. Joseph, MO. 41st edition. Boehlje, Michael D., and Vernon R. Eidman. 1984. Farm Management. John Wiley and Sons. New York, New
York California Chapter of the American Society of Farm Managers and Rural Appraisers. 2008 Trends in
Agricultural Land & Lease Values. American Society of Farm Managers and Rural Appraisers, Woodbridge, CA.
California State Automobile Association. 2008. Gas Price Averages 2008. AAA Press Room, San Francisco,
CA. Internet accessed January 2009. http://www.csaa.com/portal/site/CSAA California State Board of Equalization. Fuel Tax Division Tax Rates. Internet accessed January 2009.
http://www.boe.ca.gov/sptaxprog/spftdrates.htm Doane Editors. 1984. Facts and Figures for Farmers. Doane Publishing, St. Louis, MO. Energy Information Administration. 2008. Weekly Retail on Highway Diesel Prices. Internet accessed January
2009. http://tonto.eix.doe.gov/oog/info/wohdp Jackson, Louise Keith S. Mayberry, Frank Laemmlen, Steven T. Koike, and William Chaney. 1996. Leaf
Lettuce Production in California. University of California, Division of Agriculture and Natural Resources, Vegetable Research and Information Center. Publication 7216.
Tourte, Laura, Richard F. Smith, Karen M. Klonsky and Richard L. De Moura. 2004. Sample Production Costs
To Produce Organic Leaf Lettuce, Central Coast Region. University of California, Cooperative Extension. Santa Cruz and Monterey, CA.
University of California Statewide IPM Project. 2008. UC Pest Management Guidelines, Lettuces. University of
California, Davis, CA. http://www.ipm.ucdavis.edu United States Department of Agriculture, Fruit and Vegetable Market News.
http://marketnews.usda.gov/portal/fv?paf_dm=full&paf_gear_id=1200002&startIndex=1&dr=1&navType=comm&navClass=VEGETABLES&final=true
United States Department of Agriculture (USDA) Economic Research Service (ERS)
http://www.ers.usda.gov/Data/ Washington State Department of Agriculture Organic Food Program. Internet accessed February 24, 2009.
http://agr.wa.gov/FoodAnimal/Organic/Certificate/2009/Materials/2009BNLSorted_Product.pdf --------------------------------
2009 Leaf Lettuce Costs and Returns Study (ORGANIC) Central Coast UC Cooperative Extension 10
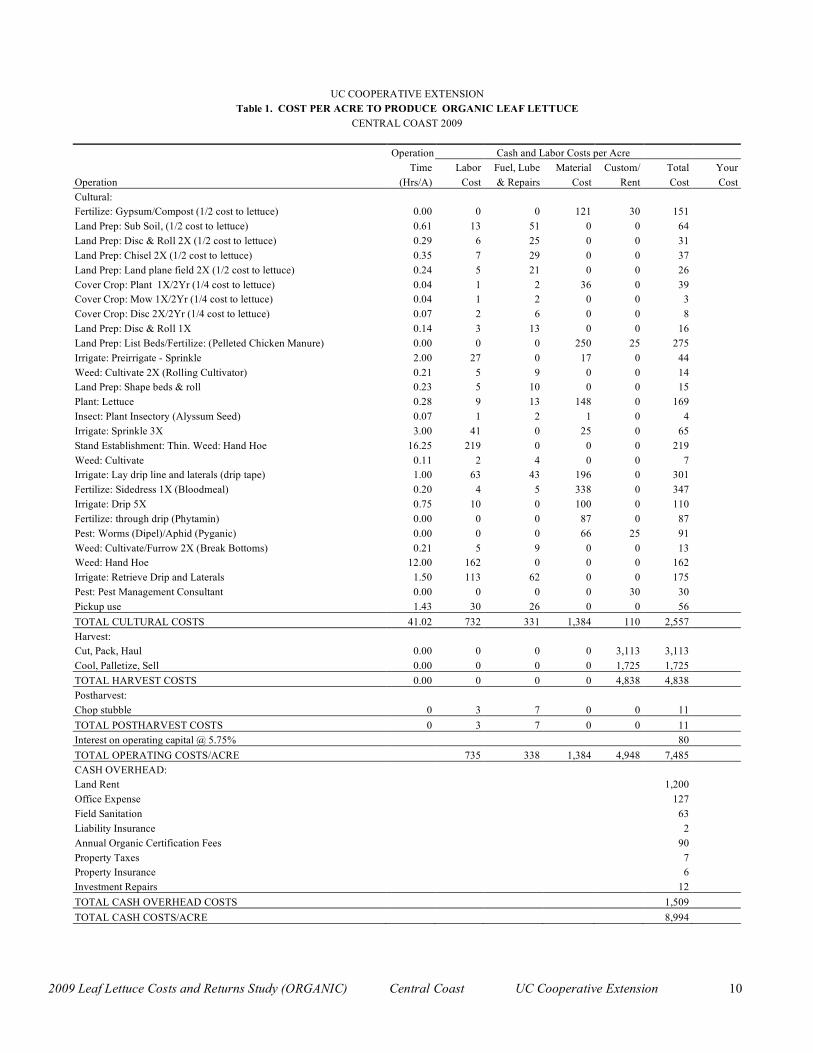
UC COOPERATIVE EXTENSION Table 1. COST PER ACRE TO PRODUCE ORGANIC LEAF LETTUCE
CENTRAL COAST 2009 Operation Cash and Labor Costs per Acre Time Labor Fuel, Lube Material Custom/ Total Your Operation (Hrs/A) Cost & Repairs Cost Rent Cost Cost Cultural: Fertilize: Gypsum/Compost (1/2 cost to lettuce) 0.00 0 0 121 30 151 Land Prep: Sub Soil, (1/2 cost to lettuce) 0.61 13 51 0 0 64 Land Prep: Disc & Roll 2X (1/2 cost to lettuce) 0.29 6 25 0 0 31 Land Prep: Chisel 2X (1/2 cost to lettuce) 0.35 7 29 0 0 37 Land Prep: Land plane field 2X (1/2 cost to lettuce) 0.24 5 21 0 0 26 Cover Crop: Plant 1X/2Yr (1/4 cost to lettuce) 0.04 1 2 36 0 39 Cover Crop: Mow 1X/2Yr (1/4 cost to lettuce) 0.04 1 2 0 0 3 Cover Crop: Disc 2X/2Yr (1/4 cost to lettuce) 0.07 2 6 0 0 8 Land Prep: Disc & Roll 1X 0.14 3 13 0 0 16 Land Prep: List Beds/Fertilize: (Pelleted Chicken Manure) 0.00 0 0 250 25 275 Irrigate: Preirrigate - Sprinkle 2.00 27 0 17 0 44 Weed: Cultivate 2X (Rolling Cultivator) 0.21 5 9 0 0 14 Land Prep: Shape beds & roll 0.23 5 10 0 0 15 Plant: Lettuce 0.28 9 13 148 0 169 Insect: Plant Insectory (Alyssum Seed) 0.07 1 2 1 0 4 Irrigate: Sprinkle 3X 3.00 41 0 25 0 65 Stand Establishment: Thin. Weed: Hand Hoe 16.25 219 0 0 0 219 Weed: Cultivate 0.11 2 4 0 0 7 Irrigate: Lay drip line and laterals (drip tape) 1.00 63 43 196 0 301 Fertilize: Sidedress 1X (Bloodmeal) 0.20 4 5 338 0 347 Irrigate: Drip 5X 0.75 10 0 100 0 110 Fertilize: through drip (Phytamin) 0.00 0 0 87 0 87 Pest: Worms (Dipel)/Aphid (Pyganic) 0.00 0 0 66 25 91 Weed: Cultivate/Furrow 2X (Break Bottoms) 0.21 5 9 0 0 13 Weed: Hand Hoe 12.00 162 0 0 0 162 Irrigate: Retrieve Drip and Laterals 1.50 113 62 0 0 175 Pest: Pest Management Consultant 0.00 0 0 0 30 30 Pickup use 1.43 30 26 0 0 56 TOTAL CULTURAL COSTS 41.02 732 331 1,384 110 2,557 Harvest: Cut, Pack, Haul 0.00 0 0 0 3,113 3,113 Cool, Palletize, Sell 0.00 0 0 0 1,725 1,725 TOTAL HARVEST COSTS 0.00 0 0 0 4,838 4,838 Postharvest: Chop stubble 0 3 7 0 0 11 TOTAL POSTHARVEST COSTS 0 3 7 0 0 11 Interest on operating capital @ 5.75% 80 TOTAL OPERATING COSTS/ACRE 735 338 1,384 4,948 7,485 CASH OVERHEAD: Land Rent 1,200 Office Expense 127 Field Sanitation 63 Liability Insurance 2 Annual Organic Certification Fees 90 Property Taxes 7 Property Insurance 6 Investment Repairs 12 TOTAL CASH OVERHEAD COSTS 1,509 TOTAL CASH COSTS/ACRE 8,994
2009 Leaf Lettuce Costs and Returns Study (ORGANIC) Central Coast UC Cooperative Extension 11
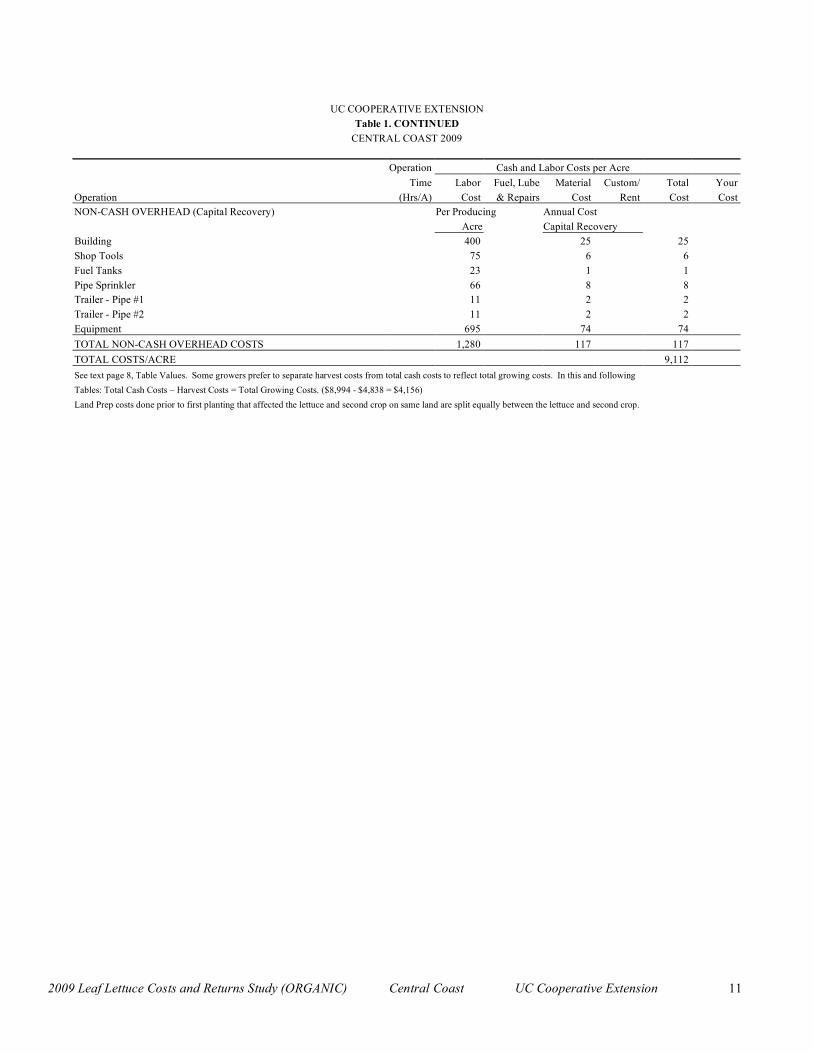
UC COOPERATIVE EXTENSION
Table 1. CONTINUED CENTRAL COAST 2009
Operation Cash and Labor Costs per Acre Time Labor Fuel, Lube Material Custom/ Total Your Operation (Hrs/A) Cost & Repairs Cost Rent Cost Cost NON-CASH OVERHEAD (Capital Recovery) Per Producing Annual Cost Acre Capital Recovery Building 400 25 25 Shop Tools 75 6 6 Fuel Tanks 23 1 1 Pipe Sprinkler 66 8 8 Trailer - Pipe #1 11 2 2 Trailer - Pipe #2 11 2 2 Equipment 695 74 74 TOTAL NON-CASH OVERHEAD COSTS 1,280 117 117 TOTAL COSTS/ACRE 9,112 See text page 8, Table Values. Some growers prefer to separate harvest costs from total cash costs to reflect total growing costs. In this and following Tables: Total Cash Costs – Harvest Costs = Total Growing Costs. ($8,994 - $4,838 = $4,156) Land Prep costs done prior to first planting that affected the lettuce and second crop on same land are split equally between the lettuce and second crop.

2009 Leaf Lettuce Costs and Returns Study (ORGANIC) Central Coast UC Cooperative Extension 12
UC COOPERATIVE EXTENSION
Table 2. COSTS AND RETURNS PER ACRE TO PRODUCE ORGANIC LEAF LETTUCE CENTRAL COAST 2009
Quantity/ Price or Value or Your Acre Unit Cost/Unit Cost/Acre Cost GROSS RETURNS Organic Leaf Lettuce 750.00 box 15.00 11,250 OPERATING COSTS Fertilizer:
Compost - Green Waste 1/2 cost (tonnage) to lettuce 2.50 ton 40.00 100 Gypsum 1/2 cost (tonnage) to lettuce 0.50 ton 42.00 21 Pelleted Chicken Manure 1,000.00 lb 0.25 250 13-0-0 Bloodmeal 450.00 lb 0.75 338 6-1-1 Phytamin 801 171.00 lb 0.51 87
Seed: Cover Crop (cereal/legume mix) 1/4 of seed to lettuce 30.00 lb 1.20 36 Leaf Lettuce (organic) 148.20 thou 1.00 148 Alyssum 0.05 lb 15.00 1
Irrigation: Water-Pumped 17.00 acin 8.33 142 Drip Tape (10mil) 1/2 cost (footage) to lettuce 6,541.00 foot 0.03 196
Insecticide: Dipel DF 1.00 lb 15.99 16 Pyganic 1.4 EC 2.00 pint 24.87 50
Contract/Custom: Ground Application (Insects) 1.00 acre 25.00 25 Harvest (carton, pick, haul, supervision) 750.00 box 4.15 3,113 Harvest (palletize, cool) 750.00 box 1.10 825 Sell Commission 8% of $15 750.00 box 1.20 900 Pest Management Consultant 1.00 acre 30.00 30 Spread Green Waste+Gypsum mixture 3.00 ton 10.00 30 List & Fertilize 1.00 acre 25.00 25
Labor (machine) 8.61 hrs 17.55 151 Labor (non-machine) 43.28 hrs 13.50 584 Fuel - Gas 5.95 gal 3.36 20 Fuel - Diesel 63.06 gal 3.70 233 Lube 38 Machinery repair 47 Interest on operating capital @ 5.75% 80 TOTAL OPERATING COSTS/ACRE 7,485 NET RETURNS ABOVE OPERATING COSTS 3,765 CASH OVERHEAD COSTS: Land Rent 1,200 Office Expense 127 Field Sanitation 63 Liability Insurance 2 Annual Organic Certification Fees 90 Property Taxes 7 Property Insurance 6 Investment Repairs 12 TOTAL CASH OVERHEAD COSTS/ACRE 1,509 TOTAL CASH COSTS/ACRE 8,994
2009 Leaf Lettuce Costs and Returns Study (ORGANIC) Central Coast UC Cooperative Extension 13
UC COOPERATIVE EXTENSION
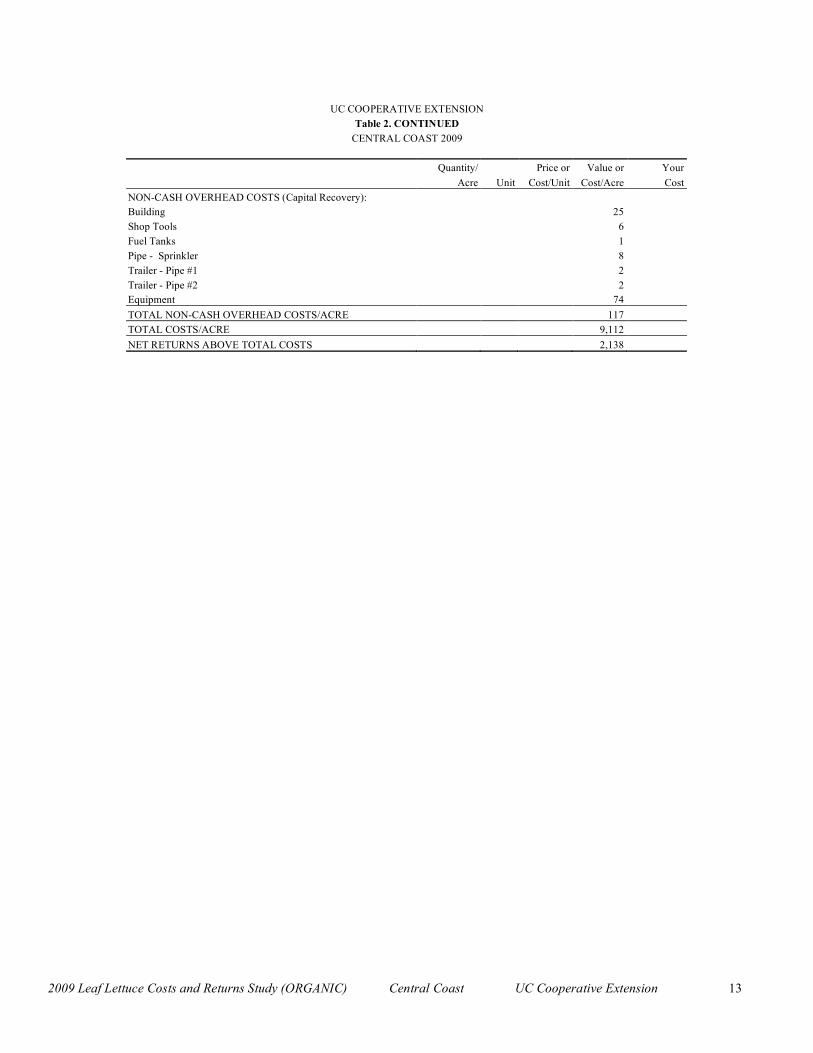
Table 2. CONTINUED CENTRAL COAST 2009
Quantity/ Price or Value or Your Acre Unit Cost/Unit Cost/Acre Cost NON-CASH OVERHEAD COSTS (Capital Recovery): Building 25 Shop Tools 6 Fuel Tanks 1 Pipe - Sprinkler 8 Trailer - Pipe #1 2 Trailer - Pipe #2 2 Equipment 74 TOTAL NON-CASH OVERHEAD COSTS/ACRE 117 TOTAL COSTS/ACRE 9,112 NET RETURNS ABOVE TOTAL COSTS 2,138
2009 Leaf Lettuce Costs and Returns Study (ORGANIC) Central Coast UC Cooperative Extension 14
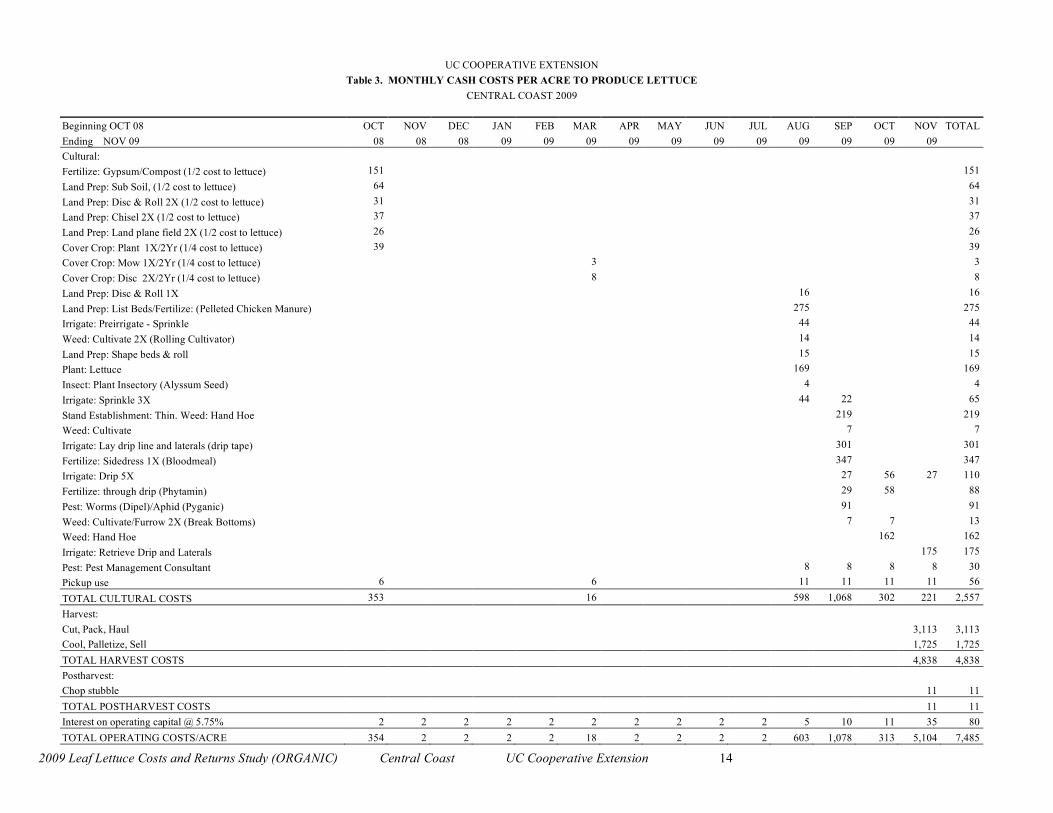
UC COOPERATIVE EXTENSION Table 3. MONTHLY CASH COSTS PER ACRE TO PRODUCE LETTUCE
CENTRAL COAST 2009 Beginning OCT 08 OCT NOV DEC JAN FEB MAR APR MAY JUN JUL AUG SEP OCT NOV TOTAL Ending NOV 09 08 08 08 09 09 09 09 09 09 09 09 09 09 09 Cultural: Fertilize: Gypsum/Compost (1/2 cost to lettuce) 151 151 Land Prep: Sub Soil, (1/2 cost to lettuce) 64 64 Land Prep: Disc & Roll 2X (1/2 cost to lettuce) 31 31 Land Prep: Chisel 2X (1/2 cost to lettuce) 37 37 Land Prep: Land plane field 2X (1/2 cost to lettuce) 26 26 Cover Crop: Plant 1X/2Yr (1/4 cost to lettuce) 39 39 Cover Crop: Mow 1X/2Yr (1/4 cost to lettuce) 3 3 Cover Crop: Disc 2X/2Yr (1/4 cost to lettuce) 8 8 Land Prep: Disc & Roll 1X 16 16 Land Prep: List Beds/Fertilize: (Pelleted Chicken Manure) 275 275 Irrigate: Preirrigate - Sprinkle 44 44 Weed: Cultivate 2X (Rolling Cultivator) 14 14 Land Prep: Shape beds & roll 15 15 Plant: Lettuce 169 169 Insect: Plant Insectory (Alyssum Seed) 4 4 Irrigate: Sprinkle 3X 44 22 65 Stand Establishment: Thin. Weed: Hand Hoe 219 219 Weed: Cultivate 7 7 Irrigate: Lay drip line and laterals (drip tape) 301 301 Fertilize: Sidedress 1X (Bloodmeal) 347 347 Irrigate: Drip 5X 27 56 27 110 Fertilize: through drip (Phytamin) 29 58 88 Pest: Worms (Dipel)/Aphid (Pyganic) 91 91 Weed: Cultivate/Furrow 2X (Break Bottoms) 7 7 13 Weed: Hand Hoe 162 162 Irrigate: Retrieve Drip and Laterals 175 175 Pest: Pest Management Consultant 8 8 8 8 30 Pickup use 6 6 11 11 11 11 56 TOTAL CULTURAL COSTS 353 16 598 1,068 302 221 2,557 Harvest: Cut, Pack, Haul 3,113 3,113 Cool, Palletize, Sell 1,725 1,725 TOTAL HARVEST COSTS 4,838 4,838 Postharvest: Chop stubble 11 11 TOTAL POSTHARVEST COSTS 11 11 Interest on operating capital @ 5.75% 2 2 2 2 2 2 2 2 2 2 5 10 11 35 80 TOTAL OPERATING COSTS/ACRE 354 2 2 2 2 18 2 2 2 2 603 1,078 313 5,104 7,485
2009 Leaf Lettuce Costs and Returns Study (ORGANIC) Central Coast UC Cooperative Extension 15
UC COOPERATIVE EXTENSION
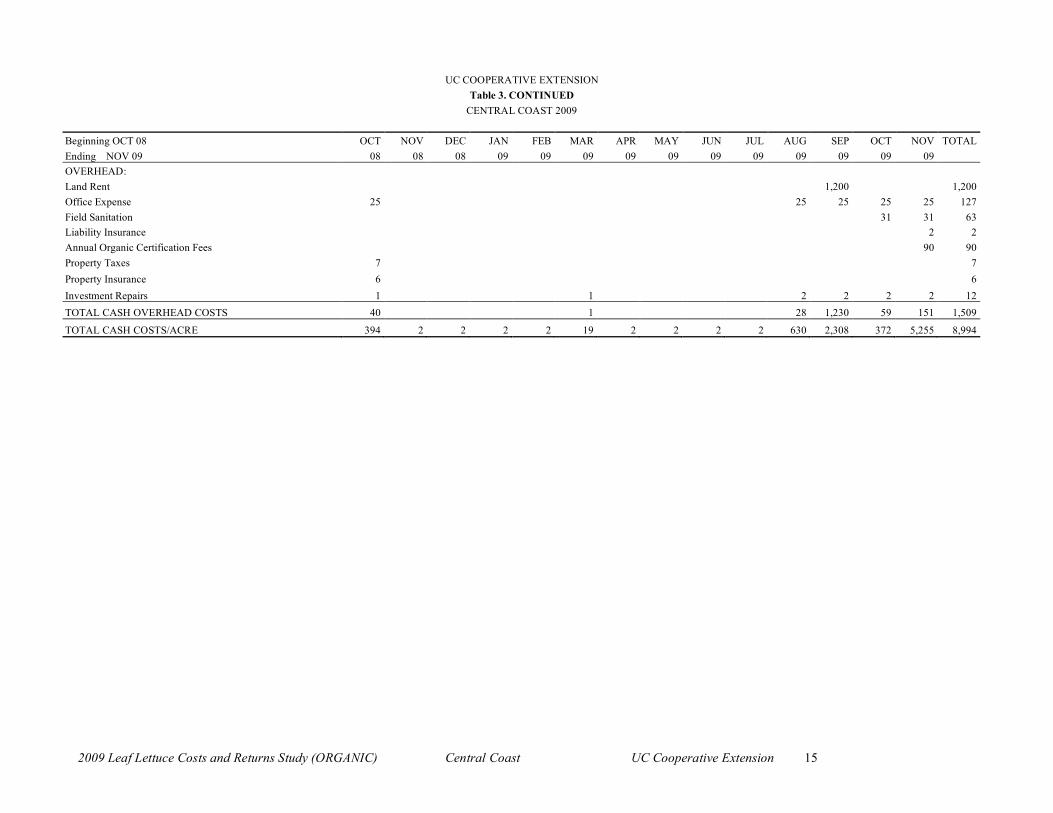
Table 3. CONTINUED CENTRAL COAST 2009
Beginning OCT 08 OCT NOV DEC JAN FEB MAR APR MAY JUN JUL AUG SEP OCT NOV TOTAL Ending NOV 09 08 08 08 09 09 09 09 09 09 09 09 09 09 09 OVERHEAD: Land Rent 1,200 1,200 Office Expense 25 25 25 25 25 127 Field Sanitation 31 31 63 Liability Insurance 2 2 Annual Organic Certification Fees 90 90 Property Taxes 7 7 Property Insurance 6 6 Investment Repairs 1 1 2 2 2 2 12 TOTAL CASH OVERHEAD COSTS 40 1 28 1,230 59 151 1,509
TOTAL CASH COSTS/ACRE 394 2 2 2 2 19 2 2 2 2 630 2,308 372 5,255 8,994
2009 Leaf Lettuce Costs and Returns Study (ORGANIC) Central Coast UC Cooperative Extension 16
UC COOPERATIVE EXTENSION
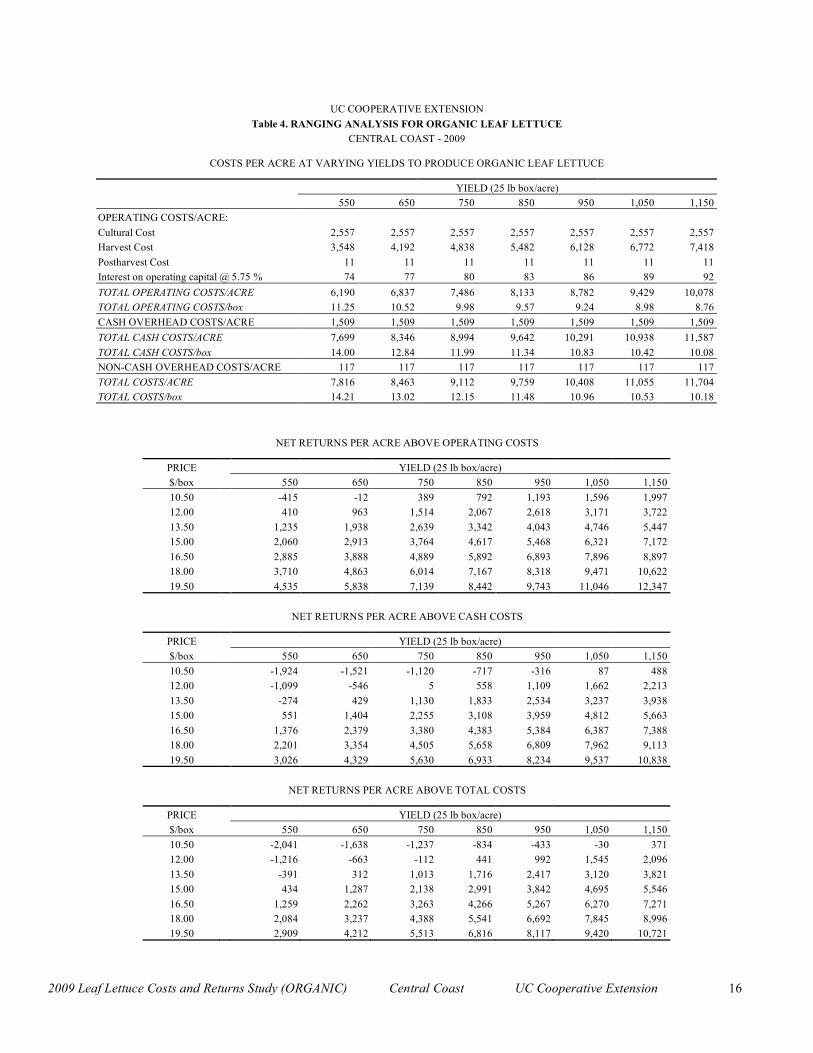
Table 4. RANGING ANALYSIS FOR ORGANIC LEAF LETTUCE CENTRAL COAST - 2009
COSTS PER ACRE AT VARYING YIELDS TO PRODUCE ORGANIC LEAF LETTUCE
YIELD (25 lb box/acre) 550 650 750 850 950 1,050 1,150 OPERATING COSTS/ACRE: Cultural Cost 2,557 2,557 2,557 2,557 2,557 2,557 2,557 Harvest Cost 3,548 4,192 4,838 5,482 6,128 6,772 7,418 Postharvest Cost 11 11 11 11 11 11 11 Interest on operating capital @ 5.75 % 74 77 80 83 86 89 92 TOTAL OPERATING COSTS/ACRE 6,190 6,837 7,486 8,133 8,782 9,429 10,078 TOTAL OPERATING COSTS/box 11.25 10.52 9.98 9.57 9.24 8.98 8.76 CASH OVERHEAD COSTS/ACRE 1,509 1,509 1,509 1,509 1,509 1,509 1,509 TOTAL CASH COSTS/ACRE 7,699 8,346 8,994 9,642 10,291 10,938 11,587 TOTAL CASH COSTS/box 14.00 12.84 11.99 11.34 10.83 10.42 10.08 NON-CASH OVERHEAD COSTS/ACRE 117 117 117 117 117 117 117 TOTAL COSTS/ACRE 7,816 8,463 9,112 9,759 10,408 11,055 11,704 TOTAL COSTS/box 14.21 13.02 12.15 11.48 10.96 10.53 10.18
NET RETURNS PER ACRE ABOVE OPERATING COSTS
PRICE YIELD (25 lb box/acre) $/box 550 650 750 850 950 1,050 1,150 10.50 -415 -12 389 792 1,193 1,596 1,997 12.00 410 963 1,514 2,067 2,618 3,171 3,722 13.50 1,235 1,938 2,639 3,342 4,043 4,746 5,447 15.00 2,060 2,913 3,764 4,617 5,468 6,321 7,172 16.50 2,885 3,888 4,889 5,892 6,893 7,896 8,897 18.00 3,710 4,863 6,014 7,167 8,318 9,471 10,622 19.50 4,535 5,838 7,139 8,442 9,743 11,046 12,347
NET RETURNS PER ACRE ABOVE CASH COSTS
PRICE YIELD (25 lb box/acre) $/box 550 650 750 850 950 1,050 1,150 10.50 -1,924 -1,521 -1,120 -717 -316 87 488 12.00 -1,099 -546 5 558 1,109 1,662 2,213 13.50 -274 429 1,130 1,833 2,534 3,237 3,938 15.00 551 1,404 2,255 3,108 3,959 4,812 5,663 16.50 1,376 2,379 3,380 4,383 5,384 6,387 7,388 18.00 2,201 3,354 4,505 5,658 6,809 7,962 9,113 19.50 3,026 4,329 5,630 6,933 8,234 9,537 10,838
NET RETURNS PER ACRE ABOVE TOTAL COSTS
PRICE YIELD (25 lb box/acre) $/box 550 650 750 850 950 1,050 1,150 10.50 -2,041 -1,638 -1,237 -834 -433 -30 371 12.00 -1,216 -663 -112 441 992 1,545 2,096 13.50 -391 312 1,013 1,716 2,417 3,120 3,821 15.00 434 1,287 2,138 2,991 3,842 4,695 5,546 16.50 1,259 2,262 3,263 4,266 5,267 6,270 7,271 18.00 2,084 3,237 4,388 5,541 6,692 7,845 8,996 19.50 2,909 4,212 5,513 6,816 8,117 9,420 10,721
2009 Leaf Lettuce Costs and Returns Study (ORGANIC) Central Coast UC Cooperative Extension 17
UC COOPERATIVE EXTENSION
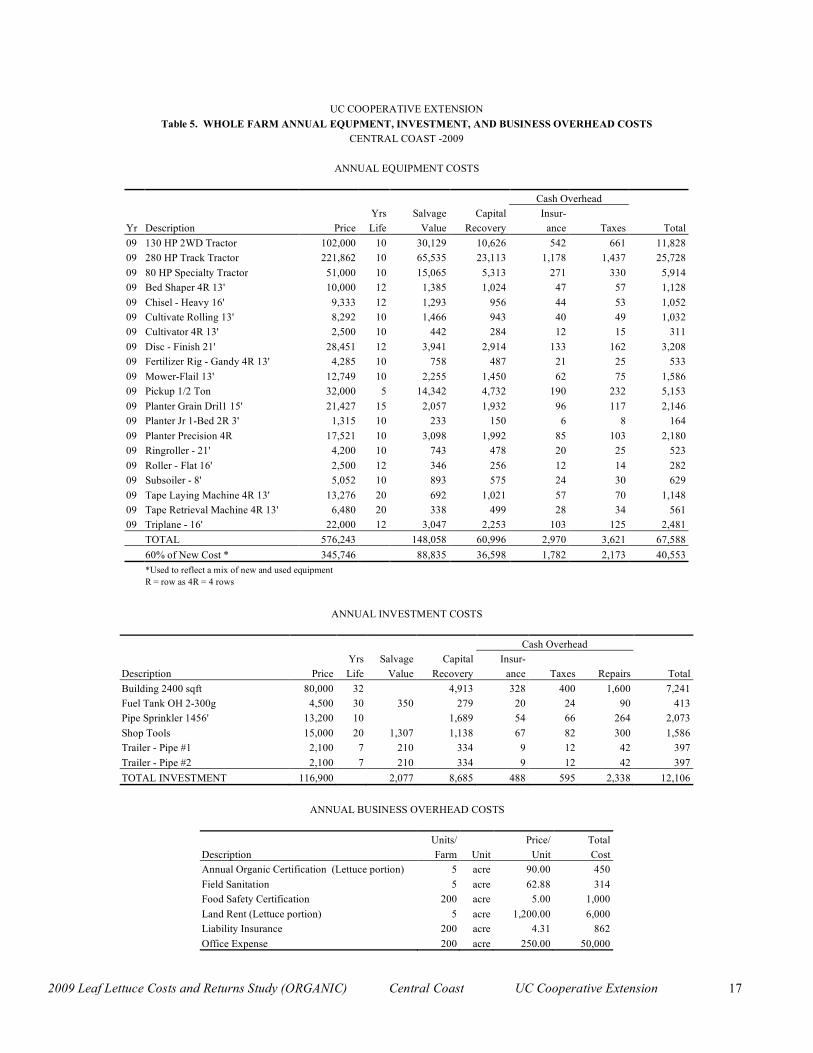
Table 5. WHOLE FARM ANNUAL EQUPMENT, INVESTMENT, AND BUSINESS OVERHEAD COSTS CENTRAL COAST -2009
ANNUAL EQUIPMENT COSTS
Cash Overhead Yrs Salvage Capital Insur- Yr Description Price Life Value Recovery ance Taxes Total 09 130 HP 2WD Tractor 102,000 10 30,129 10,626 542 661 11,828 09 280 HP Track Tractor 221,862 10 65,535 23,113 1,178 1,437 25,728 09 80 HP Specialty Tractor 51,000 10 15,065 5,313 271 330 5,914 09 Bed Shaper 4R 13' 10,000 12 1,385 1,024 47 57 1,128 09 Chisel - Heavy 16' 9,333 12 1,293 956 44 53 1,052 09 Cultivate Rolling 13' 8,292 10 1,466 943 40 49 1,032 09 Cultivator 4R 13' 2,500 10 442 284 12 15 311 09 Disc - Finish 21' 28,451 12 3,941 2,914 133 162 3,208 09 Fertilizer Rig - Gandy 4R 13' 4,285 10 758 487 21 25 533 09 Mower-Flail 13' 12,749 10 2,255 1,450 62 75 1,586 09 Pickup 1/2 Ton 32,000 5 14,342 4,732 190 232 5,153 09 Planter Grain Dril1 15' 21,427 15 2,057 1,932 96 117 2,146 09 Planter Jr 1-Bed 2R 3' 1,315 10 233 150 6 8 164 09 Planter Precision 4R 17,521 10 3,098 1,992 85 103 2,180 09 Ringroller - 21' 4,200 10 743 478 20 25 523 09 Roller - Flat 16' 2,500 12 346 256 12 14 282 09 Subsoiler - 8' 5,052 10 893 575 24 30 629 09 Tape Laying Machine 4R 13' 13,276 20 692 1,021 57 70 1,148 09 Tape Retrieval Machine 4R 13' 6,480 20 338 499 28 34 561 09 Triplane - 16' 22,000 12 3,047 2,253 103 125 2,481 TOTAL 576,243 148,058 60,996 2,970 3,621 67,588 60% of New Cost * 345,746 88,835 36,598 1,782 2,173 40,553 *Used to reflect a mix of new and used equipment R = row as 4R = 4 rows
ANNUAL INVESTMENT COSTS
Cash Overhead Yrs Salvage Capital Insur- Description Price Life Value Recovery ance Taxes Repairs Total Building 2400 sqft 80,000 32 4,913 328 400 1,600 7,241 Fuel Tank OH 2-300g 4,500 30 350 279 20 24 90 413 Pipe Sprinkler 1456' 13,200 10 1,689 54 66 264 2,073 Shop Tools 15,000 20 1,307 1,138 67 82 300 1,586 Trailer - Pipe #1 2,100 7 210 334 9 12 42 397 Trailer - Pipe #2 2,100 7 210 334 9 12 42 397 TOTAL INVESTMENT 116,900 2,077 8,685 488 595 2,338 12,106
ANNUAL BUSINESS OVERHEAD COSTS
Units/ Price/ Total Description Farm Unit Unit Cost Annual Organic Certification (Lettuce portion) 5 acre 90.00 450 Field Sanitation 5 acre 62.88 314 Food Safety Certification 200 acre 5.00 1,000 Land Rent (Lettuce portion) 5 acre 1,200.00 6,000 Liability Insurance 200 acre 4.31 862 Office Expense 200 acre 250.00 50,000
2009 Leaf Lettuce Costs and Returns Study (ORGANIC) Central Coast UC Cooperative Extension 18
UC COOPERATIVE EXTENSION
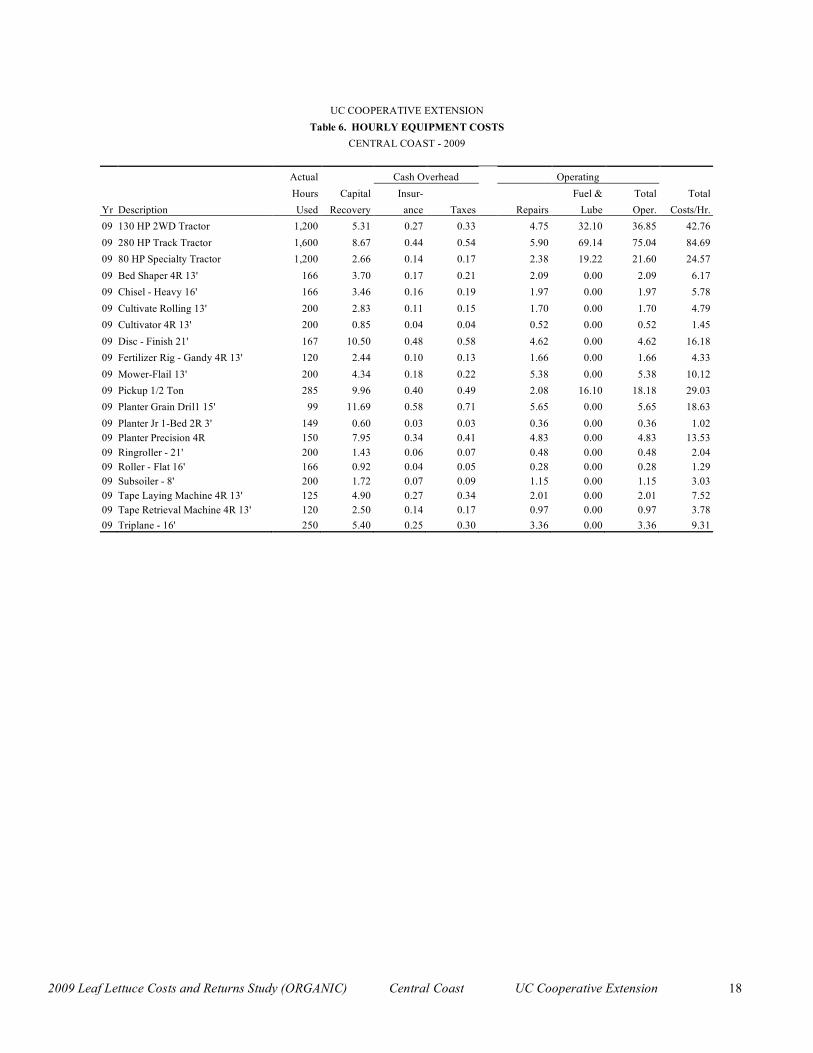
Table 6. HOURLY EQUIPMENT COSTS CENTRAL COAST - 2009
Actual Cash Overhead Operating Hours Capital Insur- Fuel & Total Total Yr Description Used Recovery ance Taxes Repairs Lube Oper. Costs/Hr. 09 130 HP 2WD Tractor 1,200 5.31 0.27 0.33 4.75 32.10 36.85 42.76 09 280 HP Track Tractor 1,600 8.67 0.44 0.54 5.90 69.14 75.04 84.69 09 80 HP Specialty Tractor 1,200 2.66 0.14 0.17 2.38 19.22 21.60 24.57 09 Bed Shaper 4R 13' 166 3.70 0.17 0.21 2.09 0.00 2.09 6.17 09 Chisel - Heavy 16' 166 3.46 0.16 0.19 1.97 0.00 1.97 5.78 09 Cultivate Rolling 13' 200 2.83 0.11 0.15 1.70 0.00 1.70 4.79 09 Cultivator 4R 13' 200 0.85 0.04 0.04 0.52 0.00 0.52 1.45 09 Disc - Finish 21' 167 10.50 0.48 0.58 4.62 0.00 4.62 16.18 09 Fertilizer Rig - Gandy 4R 13' 120 2.44 0.10 0.13 1.66 0.00 1.66 4.33 09 Mower-Flail 13' 200 4.34 0.18 0.22 5.38 0.00 5.38 10.12 09 Pickup 1/2 Ton 285 9.96 0.40 0.49 2.08 16.10 18.18 29.03 09 Planter Grain Dril1 15' 99 11.69 0.58 0.71 5.65 0.00 5.65 18.63 09 Planter Jr 1-Bed 2R 3' 149 0.60 0.03 0.03 0.36 0.00 0.36 1.02 09 Planter Precision 4R 150 7.95 0.34 0.41 4.83 0.00 4.83 13.53 09 Ringroller - 21' 200 1.43 0.06 0.07 0.48 0.00 0.48 2.04 09 Roller - Flat 16' 166 0.92 0.04 0.05 0.28 0.00 0.28 1.29 09 Subsoiler - 8' 200 1.72 0.07 0.09 1.15 0.00 1.15 3.03 09 Tape Laying Machine 4R 13' 125 4.90 0.27 0.34 2.01 0.00 2.01 7.52 09 Tape Retrieval Machine 4R 13' 120 2.50 0.14 0.17 0.97 0.00 0.97 3.78 09 Triplane - 16' 250 5.40 0.25 0.30 3.36 0.00 3.36 9.31
2009 Leaf Lettuce Costs and Returns Study (ORGANIC) Central Coast UC Cooperative Extension 19
UC COOPERATIVE EXTENSION
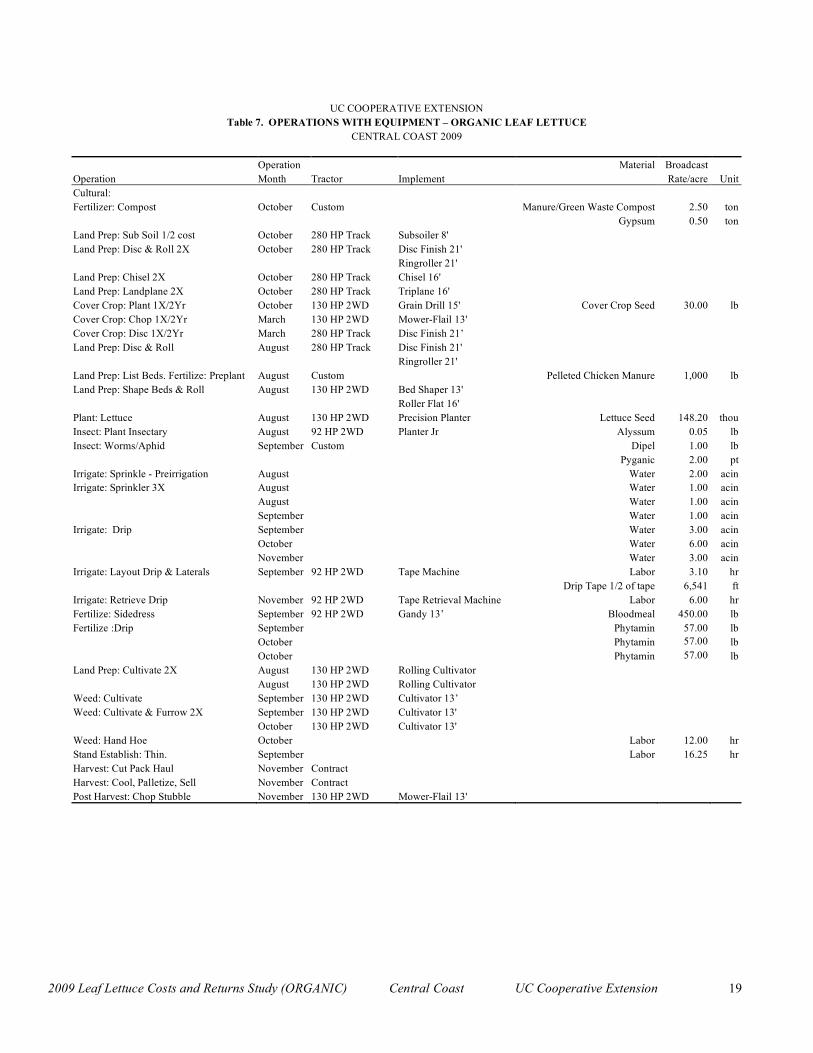
Table 7. OPERATIONS WITH EQUIPMENT – ORGANIC LEAF LETTUCE CENTRAL COAST 2009
Operation Material Broadcast Operation Month Tractor Implement Rate/acre Unit Cultural: Fertilizer: Compost October Custom Manure/Green Waste Compost 2.50 ton Gypsum 0.50 ton Land Prep: Sub Soil 1/2 cost October 280 HP Track Subsoiler 8' Land Prep: Disc & Roll 2X October 280 HP Track Disc Finish 21' Ringroller 21' Land Prep: Chisel 2X October 280 HP Track Chisel 16' Land Prep: Landplane 2X October 280 HP Track Triplane 16' Cover Crop: Plant 1X/2Yr October 130 HP 2WD Grain Drill 15' Cover Crop Seed 30.00 lb Cover Crop: Chop 1X/2Yr March 130 HP 2WD Mower-Flail 13' Cover Crop: Disc 1X/2Yr March 280 HP Track Disc Finish 21’ Land Prep: Disc & Roll August 280 HP Track Disc Finish 21' Ringroller 21' Land Prep: List Beds. Fertilize: Preplant August Custom Pelleted Chicken Manure 1,000 lb Land Prep: Shape Beds & Roll August 130 HP 2WD Bed Shaper 13' Roller Flat 16' Plant: Lettuce August 130 HP 2WD Precision Planter Lettuce Seed 148.20 thou Insect: Plant Insectary August 92 HP 2WD Planter Jr Alyssum 0.05 lb Insect: Worms/Aphid September Custom Dipel 1.00 lb Pyganic 2.00 pt Irrigate: Sprinkle - Preirrigation August Water 2.00 acin Irrigate: Sprinkler 3X August Water 1.00 acin August Water 1.00 acin September Water 1.00 acin Irrigate: Drip September Water 3.00 acin October Water 6.00 acin November Water 3.00 acin Irrigate: Layout Drip & Laterals September 92 HP 2WD Tape Machine Labor 3.10 hr Drip Tape 1/2 of tape 6,541 ft Irrigate: Retrieve Drip November 92 HP 2WD Tape Retrieval Machine Labor 6.00 hr Fertilize: Sidedress September 92 HP 2WD Gandy 13’ Bloodmeal 450.00 lb Fertilize :Drip September Phytamin 57.00 lb October Phytamin 57.00 lb October Phytamin 57.00 lb Land Prep: Cultivate 2X August 130 HP 2WD Rolling Cultivator August 130 HP 2WD Rolling Cultivator Weed: Cultivate September 130 HP 2WD Cultivator 13’ Weed: Cultivate & Furrow 2X September 130 HP 2WD Cultivator 13' October 130 HP 2WD Cultivator 13' Weed: Hand Hoe October Labor 12.00 hr Stand Establish: Thin. September Labor 16.25 hr Harvest: Cut Pack Haul November Contract Harvest: Cool, Palletize, Sell November Contract Post Harvest: Chop Stubble November 130 HP 2WD Mower-Flail 13'