SAMPLE CHAPTER · PDF file · 2015-11-06• Visual Studio .NET 2003 (any...
42
S AMPLE C HAPTER
Transcript of SAMPLE CHAPTER · PDF file · 2015-11-06• Visual Studio .NET 2003 (any...
S A M P L E C H A P T E R
SQL Server 2005 Reporting Services in Action
by Bret Updegraff Sample Chapter 1
Copyright 2006 Manning Publications
vii
brief contents
1 Introducing SQL Server 2005 Reporting Services 1
2 Report authoring basics 41
3 Working with data 64
4 Designing reports 104
5 Using expressions and functions 150
6 Using custom code 185
7 Ad hoc reporting with the Report Builder application 215
8 Managing the Reporting Services environment 259
9 Securing Reporting Services 311
10 On-demand report delivery 341
11 Mastering the ReportViewer controls 389
12 Subscribed report delivery 420
13 Extending Reporting Services 453
14 Performance and scalability 497
appendix A Installing SQL Server Reporting Services 524
appendix B Understanding .NET code access security 531
1
C H A P T E R 1
Introducing SQL Server 2005 Reporting Services1.1 What is Reporting Services? 21.2 Reporting Services at a glance 71.3 RS architecture 131.4 Understanding report processing 191.5 Delivering reports 22
1.6 What is the report lifecycle? 241.7 RS in action 251.8 Evaluating RS 361.9 Summary 37
“So much information, so little time...” the character Poison Ivy would likely say ifthe Batman saga were taking place in today’s enterprise.
Organizations tend to spend much of their IT budgets on streamlining internalprocesses to gain a competitive advantage. Various data is pulled into Microsoft Exceland passed around departments; mainframe data is exported and loaded into flat files,Excel spreadsheets, and Microsoft Access databases. If users don’t have the data theyneed, they typically have to issue a request for this data to be made available in a newreport. In many organizations, these requests consume significant IT and develop-ment resources. Too often, Excel spreadsheets are the prevalent reporting tools today,and inaccurate data, and thus wrong decisions, often result from manual data entry,or “pencil pushing.” According to Microsoft, today’s information workers spend asmuch as 80 percent of their time gathering information, with only 20 percent left toanalyze it and make a decision. Aware of these issues, Microsoft initiated theMicrosoft SQL Server 2000 Reporting Services project at the beginning of the newmillennium, with a bold vision to “enable employees at all levels of an organization
2 CHAPTER 1 INTRODUCING SQL SERVER 2005 REPORTING SERVICES
to realize the promise of Business Intelligence to promote better decision making.”Now in its second release, Reporting Services 2005 offers you an even more robustfeature set.
This chapter provides a panoramic view of Reporting Services (RS). Throughoutthe rest of this book we use the terms Reporting Services and RS interchangeably. Youwill learn:
• Why RS is such a compelling choice for enterprise reporting
• The main parts of the RS architecture
• The report-generation process and report lifecycle
• The steps for creating your first RS report
1.1 WHAT IS REPORTING SERVICES?
Microsoft SQL Reporting Services is a full-featured, server-based, end-to-end report-ing application that includes services, tools, and APIs to create, publish, and managereporting solutions. SQL Reporting Services was originally slated for an initial releasewith SQL Server 2005. Thanks to the convergence of customer demand and productreadiness, RS was introduced as an add-on to SQL Server 2000 at the beginning of2004. This revised edition book covers the SQL Server 2005 release of Reporting Ser-vices, and compares, when relevant, the changes from the SQL Server 2000 release.
Let’s consider a typical scenario that Reporting Services can address effectively.Let’s say that an organization has built a web portal for submitting orders online. Asthe business grows, the same organization may need to implement a reporting infra-structure to analyze sales data and understand its business; for example, to identify thetop-selling products, customer demographics, and so forth. To accomplish this goal,the organization could leverage RS.
We use the term report to refer to the web-based or saved-to-file counterpart of astandard paper-oriented report. For example, an organization may want to give itscustomers an option to generate various reports online—an Order History report, forinstance. Web reporting has traditionally been difficult to implement. Even more dif-ficult has been exporting reports to different file formats. RS solves both problems ele-gantly by providing an out-of-the-box web-enabled reporting platform, and byproviding the ability to manually or programmatically generate exports in the mostpopular export formats.
Let’s get started. In this section we do the following:
• Take a look at the problems that Reporting Services helps us solve
• Learn about the different versions and editions of Reporting Services
• Find out where Reporting Services fits into the SQL Server platform
WHAT IS REPORTING SERVICES? 3
1.1.1 Solving reporting problems with Reporting Services
Ironically, despite the important role that reporting plays in today’s enterprises, creat-ing and distributing reports have traditionally been painstaking and laborious chores.To understand why we need RS, let’s analyze the reporting problem space.
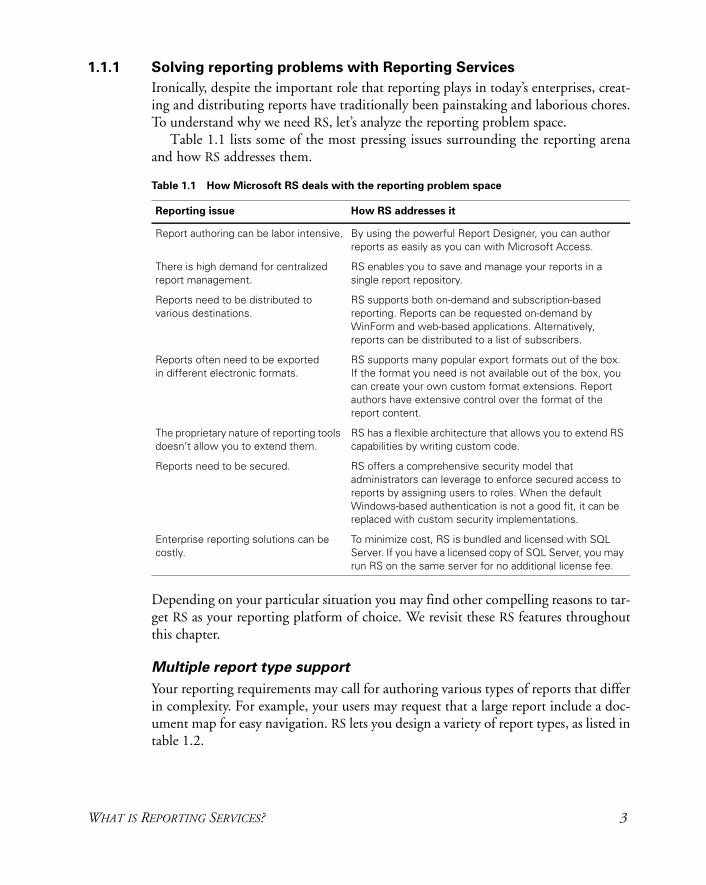
Table 1.1 lists some of the most pressing issues surrounding the reporting arenaand how RS addresses them.
Depending on your particular situation you may find other compelling reasons to tar-get RS as your reporting platform of choice. We revisit these RS features throughoutthis chapter.
Multiple report type support
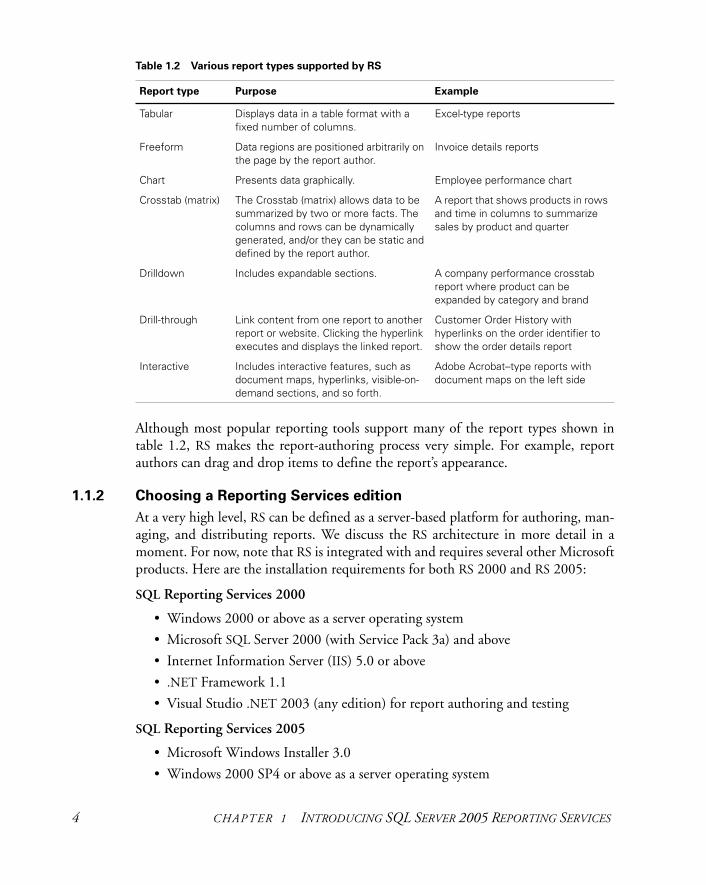
Your reporting requirements may call for authoring various types of reports that differin complexity. For example, your users may request that a large report include a doc-ument map for easy navigation. RS lets you design a variety of report types, as listed intable 1.2.
Table 1.1 How Microsoft RS deals with the reporting problem space
Reporting issue How RS addresses it
Report authoring can be labor intensive. By using the powerful Report Designer, you can author reports as easily as you can with Microsoft Access.
There is high demand for centralized report management.
RS enables you to save and manage your reports in a single report repository.
Reports need to be distributed to various destinations.
RS supports both on-demand and subscription-based reporting. Reports can be requested on-demand by WinForm and web-based applications. Alternatively, reports can be distributed to a list of subscribers.
Reports often need to be exported in different electronic formats.
RS supports many popular export formats out of the box. If the format you need is not available out of the box, you can create your own custom format extensions. Report authors have extensive control over the format of the report content.
The proprietary nature of reporting tools doesn’t allow you to extend them.
RS has a flexible architecture that allows you to extend RS capabilities by writing custom code.
Reports need to be secured. RS offers a comprehensive security model that administrators can leverage to enforce secured access to reports by assigning users to roles. When the default Windows-based authentication is not a good fit, it can be replaced with custom security implementations.
Enterprise reporting solutions can be costly.
To minimize cost, RS is bundled and licensed with SQL Server. If you have a licensed copy of SQL Server, you may run RS on the same server for no additional license fee.
4 CHAPTER 1 INTRODUCING SQL SERVER 2005 REPORTING SERVICES
Although most popular reporting tools support many of the report types shown intable 1.2, RS makes the report-authoring process very simple. For example, reportauthors can drag and drop items to define the report’s appearance.
1.1.2 Choosing a Reporting Services edition
At a very high level, RS can be defined as a server-based platform for authoring, man-aging, and distributing reports. We discuss the RS architecture in more detail in amoment. For now, note that RS is integrated with and requires several other Microsoftproducts. Here are the installation requirements for both RS 2000 and RS 2005:
SQL Reporting Services 2000
• Windows 2000 or above as a server operating system
• Microsoft SQL Server 2000 (with Service Pack 3a) and above
• Internet Information Server (IIS) 5.0 or above
• .NET Framework 1.1
• Visual Studio .NET 2003 (any edition) for report authoring and testing
SQL Reporting Services 2005
• Microsoft Windows Installer 3.0
• Windows 2000 SP4 or above as a server operating system
Table 1.2 Various report types supported by RS
Report type Purpose Example
Tabular Displays data in a table format with a fixed number of columns.
Excel-type reports
Freeform Data regions are positioned arbitrarily on the page by the report author.
Invoice details reports
Chart Presents data graphically. Employee performance chart
Crosstab (matrix) The Crosstab (matrix) allows data to be summarized by two or more facts. The columns and rows can be dynamically generated, and/or they can be static and defined by the report author.
A report that shows products in rows and time in columns to summarize sales by product and quarter
Drilldown Includes expandable sections. A company performance crosstab report where product can be expanded by category and brand
Drill-through Link content from one report to another report or website. Clicking the hyperlink executes and displays the linked report.
Customer Order History with hyperlinks on the order identifier to show the order details report
Interactive Includes interactive features, such as document maps, hyperlinks, visible-on-demand sections, and so forth.
Adobe Acrobat–type reports with document maps on the left side
WHAT IS REPORTING SERVICES? 5
• Microsoft SQL Server 2005 (included)
• Internet Information Server (IIS) 5.0 or above
• .NET Framework 2.0 (included)
• Microsoft Data Access Components (MDAC) 2.8 for systems running Win-dows 2000
NOTE With RS 2005 you do not need to have a licensed version of Visual Stu-dio installed. If you do not have Visual Studio, RS will install a shell ver-sion of Visual Studio 2005, called the Business Intelligence DevelopmentStudio (BIDS).
For more information about installing RS, refer to appendix A.To address different user needs, RS is available in several editions, as you can see
by looking at table 1.3. The release of SQL Server 2005 introduces two new edi-tions, called Workgroup and Express. While these new editions offer limited fea-tures and functionality of RS, they allow for more flexibility and options across theRS product set.
For more information about how the RS editions differ, refer to the product docu-mentation or the “Reporting Services Features Comparison” section in the RS officialwebsite at http://www.microsoft.com/hk/sql/reportingservices/productinfo/features.mspx (RS 2000) or www.microsoft.com/sql/2005/productinfo/rsfeatures.mspx (RS 2005).
Table 1.3 RS editions to meet various reporting needs
Edition Choose when…
Express You only need basic functionality on a single computer. Express only supports limited rendering formats. Also, you can only use a local and relational database with Express. Security roles are fixed with Express and you cannot use the Management Studio or Report Builder with this edition.
Workgroup You only need basic functionality on a single computer. Workgroup only supports limited rendering formats. Also, you can only use a local and relational database with Workgroup.
Standard You need to install RS on a single computer. The Standard edition doesn’t support clustered deployment to load-balance multiple RS instances.
Enterprise You need all RS features, including load balancing, data-driven subscriptions, and Report Builder infinite drill-through.
Developer You have to integrate RS with client applications or extend its capabilities by writing .NET code. The Developer edition supports the same feature set as the Enterprise edition, but it is for use as a test and development system, not as a production server.
Evaluation You need to evaluate RS. The Evaluation edition expires after 180 days. This trial edition supports all of the features of the Enterprise edition.
6 CHAPTER 1 INTRODUCING SQL SERVER 2005 REPORTING SERVICES
For information about RS licensing requirements, visit the Microsoft ReportingServices page at www.microsoft.com/sql/reporting/.
Now that we understand what RS is, let’s see how it fits into the Microsoft Busi-ness Intelligence vision.
1.1.3 Reporting Services and the
Microsoft SQL Server platform
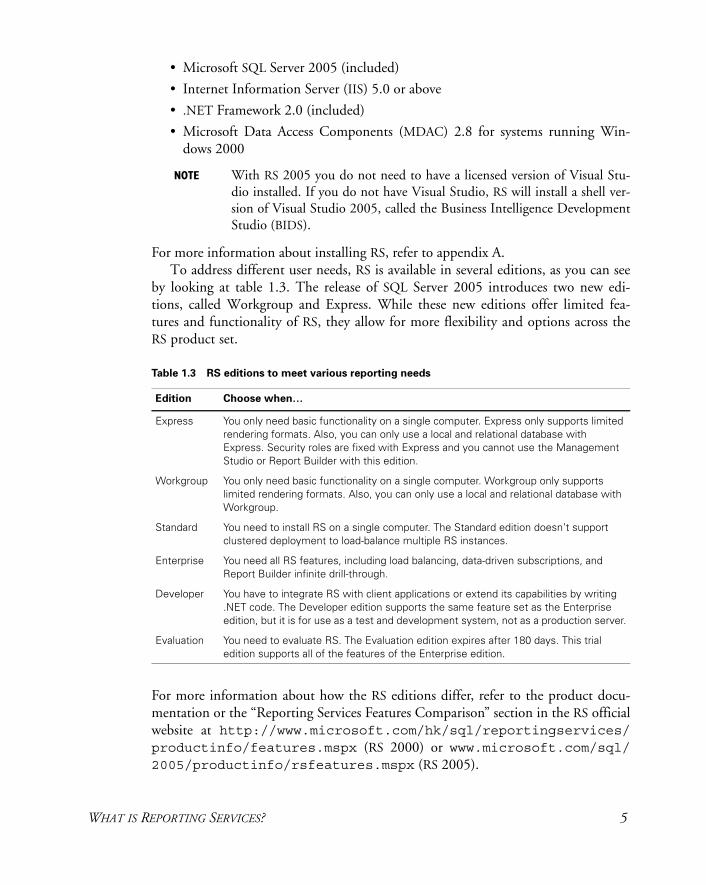
With the release of SQL Server 2005, Microsoft added some feature-rich tools to SQLServer. Many of these new tools fit into the area of Business Intelligence (BI). Withthis focus, some new tools are available that enable developers to easily build anddeploy applications that address the most common data management and analysischallenges facing many organizations every day, such as analysis of vast volumes ofdata, trend discovery, data management, and of course, comprehensive reporting.Given that, RS is positioned as an integral part of Microsoft’s data management andanalysis platform. Figure 1.1 shows the placement of RS in the Microsoft SQL Serverplatform offering.
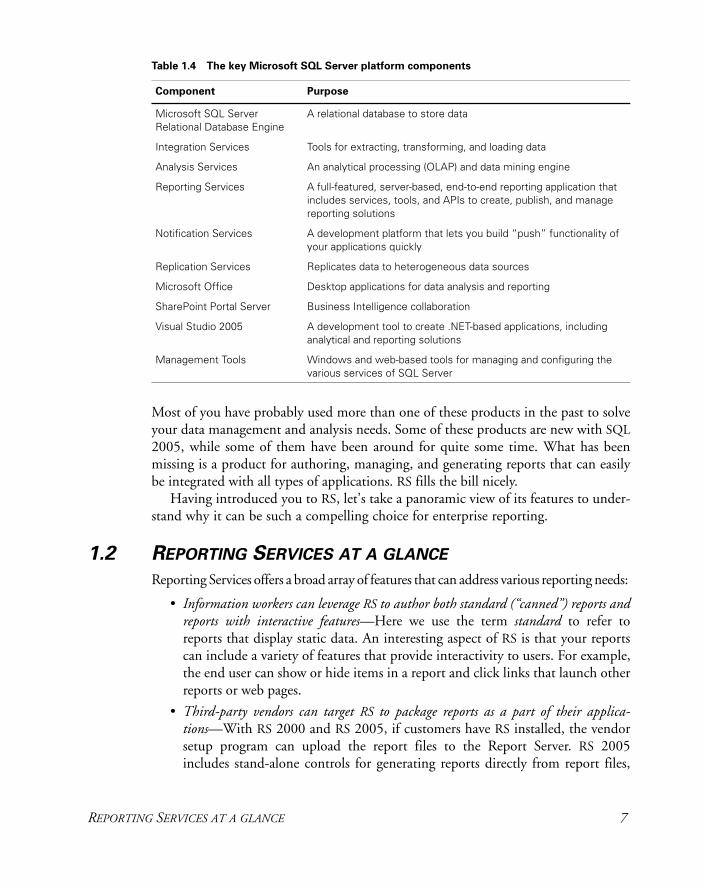
Table 1.4 outlines the purpose of the major building blocks within the MicrosoftSQL Server platform.
Figure 1.1 The Microsoft SQL Server platform consists of several products
layered on top of the SQL Server database engine and addresses various data
management and reporting needs.
REPORTING SERVICES AT A GLANCE 7
Most of you have probably used more than one of these products in the past to solveyour data management and analysis needs. Some of these products are new with SQL2005, while some of them have been around for quite some time. What has beenmissing is a product for authoring, managing, and generating reports that can easilybe integrated with all types of applications. RS fills the bill nicely.
Having introduced you to RS, let’s take a panoramic view of its features to under-stand why it can be such a compelling choice for enterprise reporting.
1.2 REPORTING SERVICES AT A GLANCE
Reporting Services offers a broad array of features that can address various reporting needs:
• Information workers can leverage RS to author both standard (“canned”) reports andreports with interactive features—Here we use the term standard to refer toreports that display static data. An interesting aspect of RS is that your reportscan include a variety of features that provide interactivity to users. For example,the end user can show or hide items in a report and click links that launch otherreports or web pages.
• Third-party vendors can target RS to package reports as a part of their applica-tions—With RS 2000 and RS 2005, if customers have RS installed, the vendorsetup program can upload the report files to the Report Server. RS 2005includes stand-alone controls for generating reports directly from report files,
Table 1.4 The key Microsoft SQL Server platform components
Component Purpose
Microsoft SQL Server Relational Database Engine
A relational database to store data
Integration Services Tools for extracting, transforming, and loading data
Analysis Services An analytical processing (OLAP) and data mining engine
Reporting Services A full-featured, server-based, end-to-end reporting application that includes services, tools, and APIs to create, publish, and manage reporting solutions
Notification Services A development platform that lets you build “push” functionality of your applications quickly
Replication Services Replicates data to heterogeneous data sources
Microsoft Office Desktop applications for data analysis and reporting
SharePoint Portal Server Business Intelligence collaboration
Visual Studio 2005 A development tool to create .NET-based applications, including analytical and reporting solutions
Management Tools Windows and web-based tools for managing and configuring the various services of SQL Server

8 CHAPTER 1 INTRODUCING SQL SERVER 2005 REPORTING SERVICES
and does not require RS to be installed. Microsoft is partnering with a numberof independent software vendors (ISVs) to create add-ons to RS to extend itscapabilities. For a full list of the Microsoft partners for RS, visit www.microsoft.com/sql/reporting/partners/default.asp.
• Organizations can use RS to report-enable their business-to-business (B2B) or business-to-consumer (B2C) applications—For example, an organization can selectivelyexpose some of its data in the form of reports to its business partners.
• Business workers can use Report Builder, which is bundled with RS 2005, to createad hoc reports without having to understand the relational or multidimensionaldata structure that they are reporting against—Report Builder provides aMicrosoft Office–like report-authoring tool that allows end users to create theirown reports in a very simple environment.
Let’s now take a look at the RS landscape and observe some of RS’s most prominentlandmarks. Don’t worry if you find you are not getting the Big Picture yet. In sec-tion 1.3, we take a closer look at the main pieces of the RS architecture.
1.2.1 Authoring features
As a report author, with RS you have several choices for creating reports. We discusseach of these options in detail in chapters 2 and 7. For now, we’d like to introduce youto the Report Designer and the Report Builder application. For advanced reportauthoring, the Report Designer will likely be your tool of choice. The Report Builderapplication is an Office-like application that is used to create on-the-fly reports.
Introducing the Report Designer
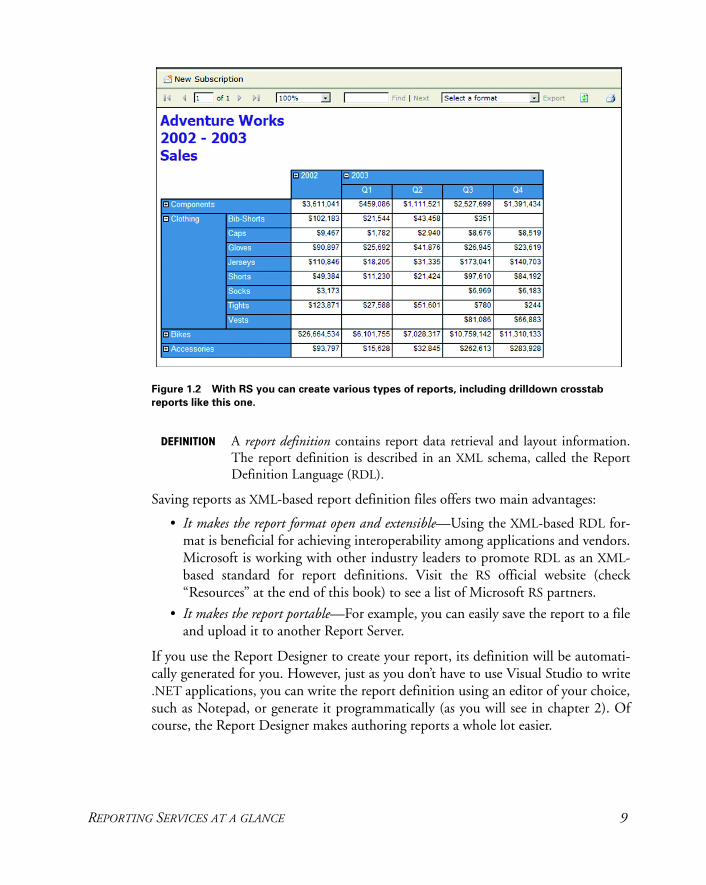
Using the Report Designer graphical environment, you can create reports of differenttypes, such as drilldown crosstab reports, like the one shown in figure 1.2.
RS doesn’t restrict your report-authoring options to static paper-oriented reports.Instead, you can make your reports more versatile and easy to use by adding interac-tive features, such as expandable sections, hyperlinks, and document maps. Given itstight integration with the Visual Studio integrated development environment (IDE),the Report Designer provides you with access to all report design features as well asteam development features, such as source code management.
About the Report Definition Language
At this point, you may be wondering what an RS-based report file looks like and howit is stored. RS saves the report as an Extensible Markup Language (XML) file that isdescribed using the Report Definition Language (RDL) schema.
REPORTING SERVICES AT A GLANCE 9
DEFINITION A report definition contains report data retrieval and layout information.The report definition is described in an XML schema, called the ReportDefinition Language (RDL).
Saving reports as XML-based report definition files offers two main advantages:
• It makes the report format open and extensible—Using the XML-based RDL for-mat is beneficial for achieving interoperability among applications and vendors.Microsoft is working with other industry leaders to promote RDL as an XML-based standard for report definitions. Visit the RS official website (check“Resources” at the end of this book) to see a list of Microsoft RS partners.
• It makes the report portable—For example, you can easily save the report to a fileand upload it to another Report Server.
If you use the Report Designer to create your report, its definition will be automati-cally generated for you. However, just as you don’t have to use Visual Studio to write.NET applications, you can write the report definition using an editor of your choice,such as Notepad, or generate it programmatically (as you will see in chapter 2). Ofcourse, the Report Designer makes authoring reports a whole lot easier.
Figure 1.2 With RS you can create various types of reports, including drilldown crosstab
reports like this one.
10 CHAPTER 1 INTRODUCING SQL SERVER 2005 REPORTING SERVICES
Introducing the Report Builder
The Report Builder is an application that runs on the client machine and provides auser interface for creating ad hoc (on-the-fly) reports. The application is similar inlook and feel to the Office suite of products. It is meant to be an easy-to-use applica-tion for creating reports and will typically be used by power business users. As youlearn in chapter 7, the Report Builder application enables drag-and-drop report build-ing functionality for nondevelopers.
1.2.2 Management features
RS facilitates report management by storing reports and their related items in a centralreport catalog. To deploy and manage a report, you need to upload it to the reportcatalog. When this happens, it becomes a managed report.
DEFINITIONS Throughout the rest of this book we will use the terms report catalog andreport repository interchangeably to refer to the RS Configuration Database.For more information about this database, refer to section 1.3.2.
A managed report is a report that is uploaded to the report catalog.
For .NET developers, the term managed here has nothing to do with .NET managedcode, although the pattern is the same. While .NET managed code runs under thesupervision of the .NET common language runtime (CLR), a managed report is gen-erated under the control of the Report Server.
You may wonder what really happens when a report is uploaded to the report cat-alog. At publishing time, the Report Server parses the report definition (RDL), gen-erates a .NET assembly, and stores the assembly in the Report ConfigurationDatabase for the report. The RDL file is never used again. When the report is proc-essed, the assembly is loaded and executed by the Report Server.
A report can include other items, such as images and data source–related informa-tion. These report-related items are also stored in the report catalog. Finally, thereport catalog captures additional information, called metadata, associated withreports. For example, just as you can organize physical files in folders, RS allows youto organize reports in folders.
DEFINITION The report metadata describes additional configuration information asso-ciated with a report, such as security permissions, the parent folder, andso forth.
RS offers centralized report management that administrators will appreciate. To sim-plify the administration of the report catalog, RS comes with a tool called the ReportManager. The Report Manager is implemented as a web-based application, and assuch it is easily accessible. This tool empowers you to manage just about any aspect ofthe report repository, including:
• Report information and metadata, such as the folder structure and report properties
• Data sources from which the report will draw data
REPORTING SERVICES AT A GLANCE 11
• Report parameters (for parameterized reports)
• Security
You learn more about the Report Manager in chapter 8.
1.2.3 Delivery features
Reports hosted under RS can be delivered using on-demand (“pulled”) delivery orsubscribed (“pushed”) delivery. The more common scenario is on-demand delivery,where the user requests the report explicitly. As a report author, you don’t have to doanything special to web-enable your report because RS does this for you once it isuploaded to the report catalog.
The “pushed” delivery option alone can justify implementing RS. This optionprovides end users with the ability to subscribe to reports, so reports will be sent tothem when a certain event is triggered—when a timing event triggers, for instance,report subscriptions based on a schedule. As another example, a financial institutioncould allow its customers to opt in and subscribe to certain reports of interest, suchas a monthly bank statement. Then, at the end of the month, the bank statementreport could be generated and sent to users via e-mail.
We discuss the report-delivery process in more detail in section 1.5; on-demanddelivery is the topic of chapter 10, and subscribed delivery is detailed in chapter 12.
1.2.4 Extensibility features
An important characteristic of every enterprise-oriented product, such as RS, is that ithas to be easily extended. Simply put, extensibility relates to the system’s ability toaccommodate new features that are built out of old ones. One of the things I likemost about RS is the extensibility features it includes by virtue of its open and flexiblearchitecture. Developers can easily extend RS by writing .NET code in their preferred.NET language. Specifically, you can extend RS in the following areas:
• Custom .NET code—.NET developers can enhance reports programmaticallyby writing .NET custom code. Chapter 6 demonstrates how you can addforecasting features to your reports by using prepackaged code in the form of.NET assemblies.
• Data processing extensions—Out of the box, RS can connect natively to SQL Server,Oracle, or any data source that has an ODBC or OLE DB provider. RS 2005 addsAnalysis Services databases, Integration Services projects, XML files, and XML Webservices as sources of data. In addition, you can write your own custom data exten-sions to report off other data structures, as chapter 13 illustrates.
• Delivery extensions—Out of the box, subscribed reports can be delivered via e-mail or file share delivery extensions. Developers can write their own deliveryextensions to deliver the report to other destinations, such as to web services, asyou learn in chapter 13.
12 CHAPTER 1 INTRODUCING SQL SERVER 2005 REPORTING SERVICES
• Security extensions—By default, RS uses the Windows-based security model toenforce restricted access to the report catalog. If Windows-based security is notan option, you can replace it with custom security models. You see an exampleof how this may be done in chapter 13, where we implement custom authenti-cation and authorization for Internet-oriented reporting.
• Rendering extensions—Generating reports in export formats other than the onessupported natively can be accomplished by writing custom rendering extensions.See section 1.4.2 for more information about the supported export formats.
• Custom report items—ISVs can embed custom server controls that provide addi-tional functionality which RS can’t provide out of the box. Some examples ofcustom report items are custom charts, gauges, and maps. These controls areadded to the Report Designer Toolbox and have their own set of property pagesand dialog boxes.
1.2.5 Scalability features
A scalable application responds well under increased loads. RS can scale up and out toaddress the high-volume reporting requirements of large organizations. It is designedfrom the ground up to process reports efficiently. For example, it supports severalreport-caching options, such as report execution caching, snapshots, and report ses-sions, as we discuss in chapter 8.
Reporting Services Enterprise Edition supports clustered deployment, which youcan use to load-balance several RS servers on multiple machines. This allows enter-prise organizations with high-scalability requirements to scale out RS and providesfault tolerance. RS performance is the subject of chapter 14.
1.2.6 Security features
RS is designed to provide a secured environment from the ground up. It offers a com-prehensive security model for accessing reports that leverages Windows authentica-tion. This model maps the user Windows account or group to a role, and the roledescribes what permissions the user has to access items in the report catalog. Reportadministrators can add Windows users to predefined roles or create new ones.
Once again, when the default Windows-based security model is not a good fit, youcan replace it by plugging in your own custom authentication and authorizationimplementations in the form of custom security extensions. You learn how to do thisin chapter 13.
To promote trustworthy computing, RS leverages the .NET code-based security to“sandbox” custom code based on configurable security policies. We discuss the RSsecurity model in chapter 9.
1.2.7 Deployment features
Because it is server based, RS has zero deployment requirements for integrating withclient applications. For this reason, any type of client applications can target RS, not
RS ARCHITECTURE 13
only .NET-based applications. Because you can access RS through the two most pop-ular web protocols, HTTP-GET and Simple Object Access Protocol (SOAP), any web-capable application can be integrated with RS, regardless of the targeted platform anddevelopment language. You see both of these protocols in action in chapter 10.
DEFINITIONS The Hypertext Transfer Protocol (HTTP), on which the Internet is based,comes in two flavors: HTTP-GET and HTTP-POST. While HTTP-GETpasses request parameters as a part of the URL, HTTP-POST passes them asname/value pairs inside the actual message.
Simple Object Access Protocol (SOAP) is a lightweight XML-based pro-tocol, layered on top of HTTP, for exchanging structured and type infor-mation on the Web. In recent years, SOAP has become the industry-standard protocol for communicating with web services.
Integrating your applications with RS requires a good grasp of its architecture. Thenext section outlines the major RS building blocks.
1.3 RS ARCHITECTURE
An important feature of the RS architecture is that it is service oriented as opposed to objectoriented. Don Box, a prominent Microsoft architect working on the next-generation webservices, outlines the following four characteristics of a service-oriented architecture:
• Boundaries are explicit—Cross-application communication uses explicit messag-ing rather than implicit method call invocation.
• Services are autonomous—The lifetime of a service-oriented application is notcontrolled by its clients.
• Services share schema and contract, not class—Service-oriented applications adver-tise their functionality to the outside world using XML-based schemas.
• Service compatibility is determined based on policies—By using policies, service-oriented applications indicate which conditions must be true in order for theservice to function properly.
You may have used object-oriented reporting tools in the past in which the reportconsumer instantiates an object instance of the report provider. A characteristic of thismodel is that both the report consumer and the report provider instances share thesame process space. For example, to render an Access report, you need to instantiatean object of type Access.Application. Then, you use OLE automation toinstruct Access to open the report database and render the report.
You no doubt agree that as useful and widespread as the object-oriented model is, itis subject to some well-known shortcomings. For example, both the consumer and pro-vider are usually installed on the same machine. Consequently, the reports hosted by thereport provider are not easily accessible by geographically dispersed clients. For instance,only Component Object Model (COM)-capable clients can interface with Access.
14 CHAPTER 1 INTRODUCING SQL SERVER 2005 REPORTING SERVICES
A second shortcoming involves application interdependencies. Object-oriented appli-cations are typically deployed as a unit. All Access clients, for example, need to havethe Access type library installed locally to establish a reference to it.
To address these shortcomings, RS departs radically from the object-oriented par-adigm. In terms of reporting, the RS service-oriented architecture offers two distinctadvantages: (1) Administrators can centralize the report storage and management inone place, and (2) it promotes application interoperability—report consumers canrequest reports over standard web protocols, such as HTTP-GET and SOAP.
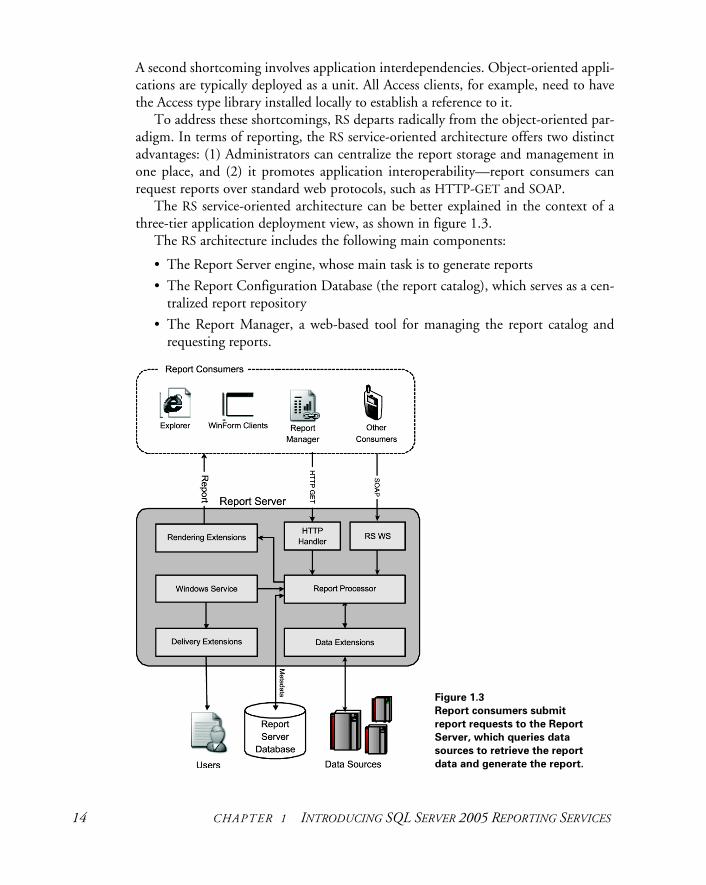
The RS service-oriented architecture can be better explained in the context of athree-tier application deployment view, as shown in figure 1.3.
The RS architecture includes the following main components:
• The Report Server engine, whose main task is to generate reports
• The Report Configuration Database (the report catalog), which serves as a cen-tralized report repository
• The Report Manager, a web-based tool for managing the report catalog andrequesting reports.
Figure 1.3
Report consumers submit
report requests to the Report
Server, which queries data
sources to retrieve the report
data and generate the report.
RS ARCHITECTURE 15
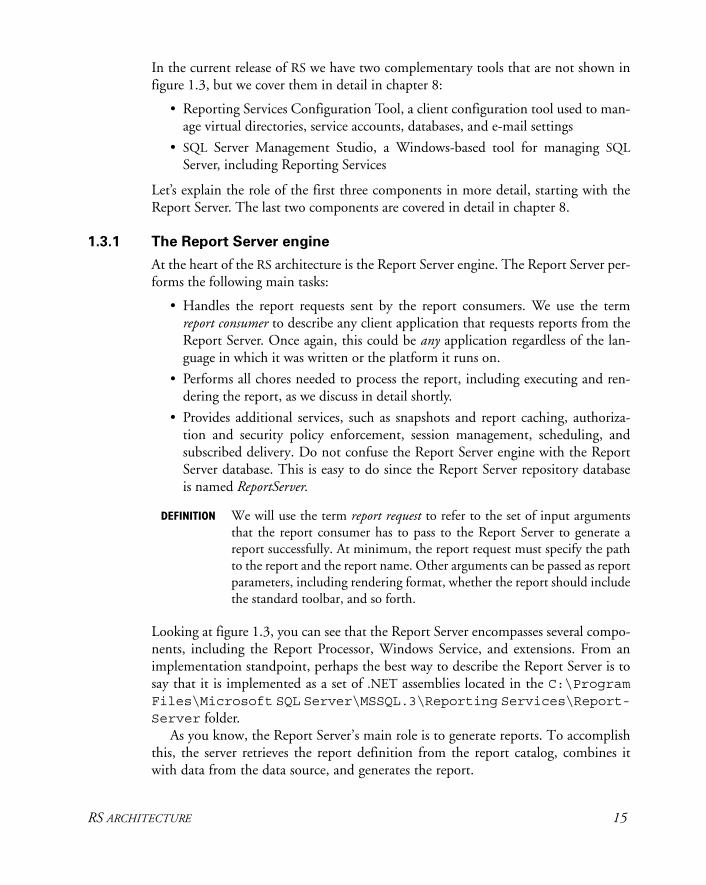
In the current release of RS we have two complementary tools that are not shown infigure 1.3, but we cover them in detail in chapter 8:
• Reporting Services Configuration Tool, a client configuration tool used to man-age virtual directories, service accounts, databases, and e-mail settings
• SQL Server Management Studio, a Windows-based tool for managing SQLServer, including Reporting Services
Let’s explain the role of the first three components in more detail, starting with theReport Server. The last two components are covered in detail in chapter 8.
1.3.1 The Report Server engine
At the heart of the RS architecture is the Report Server engine. The Report Server per-forms the following main tasks:
• Handles the report requests sent by the report consumers. We use the termreport consumer to describe any client application that requests reports from theReport Server. Once again, this could be any application regardless of the lan-guage in which it was written or the platform it runs on.
• Performs all chores needed to process the report, including executing and ren-dering the report, as we discuss in detail shortly.
• Provides additional services, such as snapshots and report caching, authoriza-tion and security policy enforcement, session management, scheduling, andsubscribed delivery. Do not confuse the Report Server engine with the ReportServer database. This is easy to do since the Report Server repository databaseis named ReportServer.
DEFINITION We will use the term report request to refer to the set of input argumentsthat the report consumer has to pass to the Report Server to generate areport successfully. At minimum, the report request must specify the pathto the report and the report name. Other arguments can be passed as reportparameters, including rendering format, whether the report should includethe standard toolbar, and so forth.
Looking at figure 1.3, you can see that the Report Server encompasses several compo-nents, including the Report Processor, Windows Service, and extensions. From animplementation standpoint, perhaps the best way to describe the Report Server is tosay that it is implemented as a set of .NET assemblies located in the C:\ProgramFiles\Microsoft SQL Server\MSSQL.3\Reporting Services\Report-Server folder.
As you know, the Report Server’s main role is to generate reports. To accomplishthis, the server retrieves the report definition from the report catalog, combines itwith data from the data source, and generates the report.
16 CHAPTER 1 INTRODUCING SQL SERVER 2005 REPORTING SERVICES
Figure 1.3 and the product documentation indicate that the Report Processorcomponent is responsible for report processing. The implementation details of theprocessor are not disclosed at the time of this writing, but most likely the majority ofits functionality is encapsulated in the Microsoft.ReportingServices.Processing-Core.dll assembly. For the remainder of this book we use the terms Report Processorand Report Server interchangeably.
Section 1.4 explains the purpose of each of the Report Server components andshows how they relate to report processing.
From an integration standpoint, perhaps the most important observation that youneed to draw from figure 1.3 is that the Report Server has two web-based communi-cation façades that expose its functionality to external clients: HTTP Handler, whichaccepts URL-based report requests submitted via HTTP-GET, and the Web service(shown in figure 1.3 as RS WS), which handles SOAP requests. You will see how thesefaçades impact the report-delivery process in section 1.5.
1.3.2 The Report Server database
When you install RS, the setup program creates the Report Server database structure.This structure is implemented as two physical SQL Server databases: Database #1 isthe Report Configuration Database (ReportServer), and it hosts the report catalogand metadata. Database #2, ReportServerTempDB, is used for caching reports. In thissection, we’ll take a closer look at each.
The Report Configuration Database
The Report Configuration Database, called ReportServer, hosts the report catalog andmetadata. As mentioned earlier, in order for a report to be available to the end users,its report definition file must be uploaded (published) to the catalog.
If you open the ReportServer database in the SQL Server Management Studio, youwill be able to deduce the purpose of most of its tables. For example, the Report Con-figuration Database keeps the catalog items in the Catalog table, the data sourceinformation in the Data-Source table, and so forth. Note that Microsoft discour-ages querying the report catalog directly. Instead, the recommended way to access thereport catalog is through the Report Server APIs. Microsoft also discourages you frommaking data changes directly to the catalog. The reason behind this is that Microsoftmay change the catalog schema in the future but will maintain backward compatibil-ity through the Report Server API.
As you may recall, RS can be deployed in a load-balanced cluster environment.In this deployment model, the ReportServer database is shared among all nodes ofthe cluster.
The Reporting Services Temporary Database
The RS setup program also creates a second SQL Server database named Report-ServerTempDB, which is used by RS for caching purposes. For example, once the
RS ARCHITECTURE 17
report is executed, the Report Server saves a copy of the report in the ReportServer-TempDB database.
DEFINITION Report caching describes the Report Server feature of keeping the reportintermediate format in the Report Server database for a certain duration.
We return to the topic of report caching in chapter 8.Let’s take a look at the web application used to manage the Report Server.
1.3.3 The Report Manager
Implemented as an ASP.NET web application, the Report Manager performs twomain tasks: report management and requests for reports. You can think of the ReportManager as an application façade that communicates with the Report Server via theReport Server APIs. From the Report Server perspective, the Report Manager is nodifferent than any other client application.
Report management
Users familiar with SharePoint Portal Server will find the Report Manager similar tothis product both in terms of user interface and purpose. As with SharePoint, you canuse the Report Manager to create folders, upload resources, manage subscriptions,and set up security.
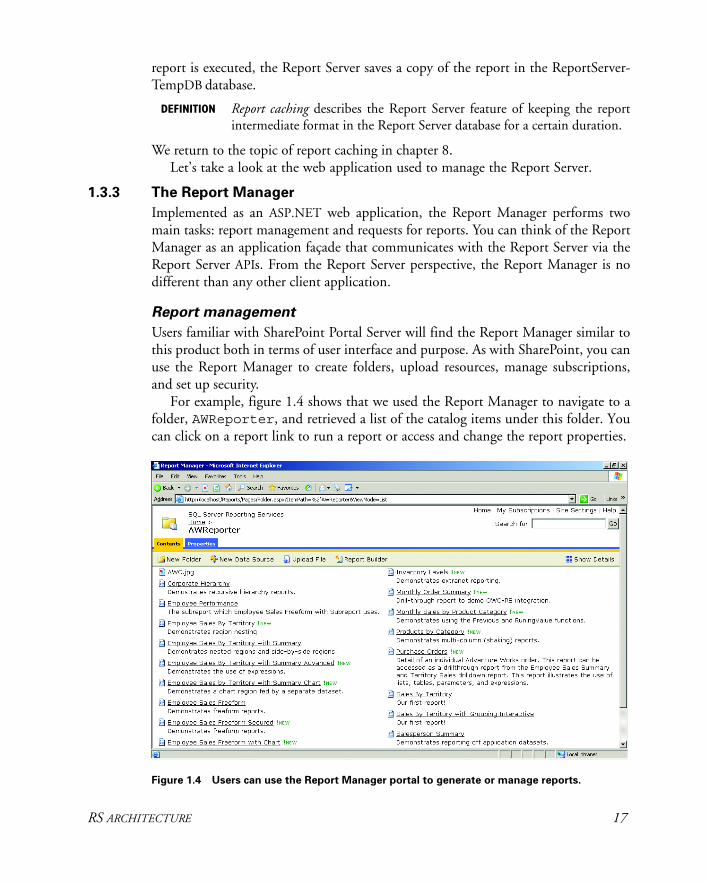
For example, figure 1.4 shows that we used the Report Manager to navigate to afolder, AWReporter, and retrieved a list of the catalog items under this folder. Youcan click on a report link to run a report or access and change the report properties.
Figure 1.4 Users can use the Report Manager portal to generate or manage reports.
18 CHAPTER 1 INTRODUCING SQL SERVER 2005 REPORTING SERVICES
In case you’re wondering where the items shown in figure 1.4 come from, we createthem in the next few chapters when we discuss the report-authoring process.
Keep in mind that in RS you work with virtual folders. Neither the folders nor thereport definition files actually exist in a file system. Instead, they exist in the ReportServer database as metadata, but they appear as folders and items when you access theReport Server through the Report Manager.
Requesting reports
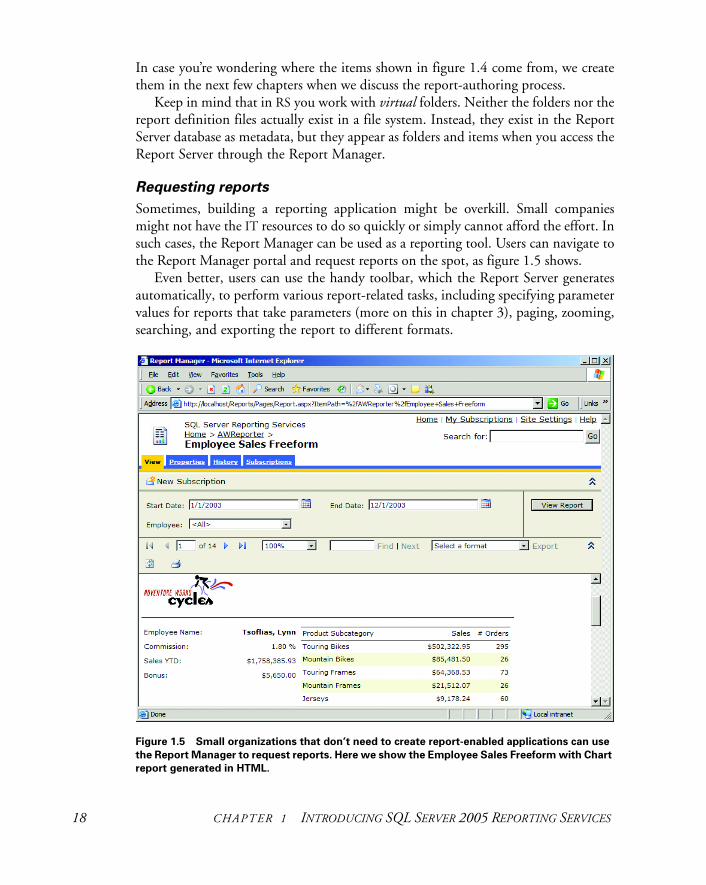
Sometimes, building a reporting application might be overkill. Small companiesmight not have the IT resources to do so quickly or simply cannot afford the effort. Insuch cases, the Report Manager can be used as a reporting tool. Users can navigate tothe Report Manager portal and request reports on the spot, as figure 1.5 shows.
Even better, users can use the handy toolbar, which the Report Server generatesautomatically, to perform various report-related tasks, including specifying parametervalues for reports that take parameters (more on this in chapter 3), paging, zooming,searching, and exporting the report to different formats.
Figure 1.5 Small organizations that don’t need to create report-enabled applications can use
the Report Manager to request reports. Here we show the Employee Sales Freeform with Chart
report generated in HTML.
UNDERSTANDING REPORT PROCESSING 19
Now that we’ve taken a quick tour of the major building blocks of Reporting Services,let’s peek under its hood to see how it processes, renders, and delivers reports.
1.4 UNDERSTANDING REPORT PROCESSING
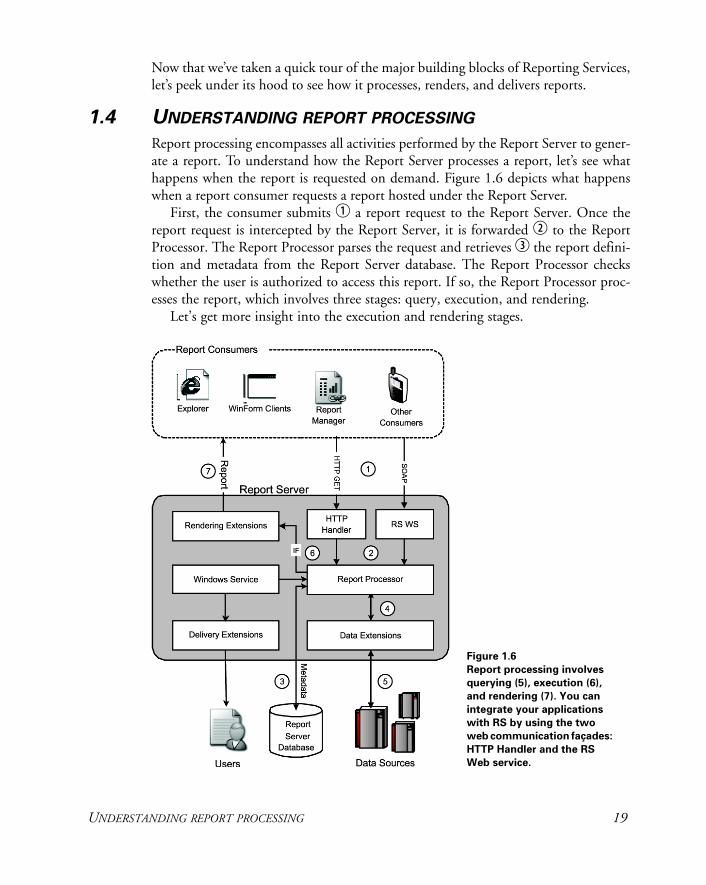
Report processing encompasses all activities performed by the Report Server to gener-ate a report. To understand how the Report Server processes a report, let’s see whathappens when the report is requested on demand. Figure 1.6 depicts what happenswhen a report consumer requests a report hosted under the Report Server.
First, the consumer submits b a report request to the Report Server. Once thereport request is intercepted by the Report Server, it is forwarded c to the ReportProcessor. The Report Processor parses the request and retrieves d the report defini-tion and metadata from the Report Server database. The Report Processor checkswhether the user is authorized to access this report. If so, the Report Processor proc-esses the report, which involves three stages: query, execution, and rendering.
Let’s get more insight into the execution and rendering stages.
Figure 1.6
Report processing involves
querying (5), execution (6),
and rendering (7). You can
integrate your applications
with RS by using the two
web communication façades:
HTTP Handler and the RS
Web service.
20 CHAPTER 1 INTRODUCING SQL SERVER 2005 REPORTING SERVICES
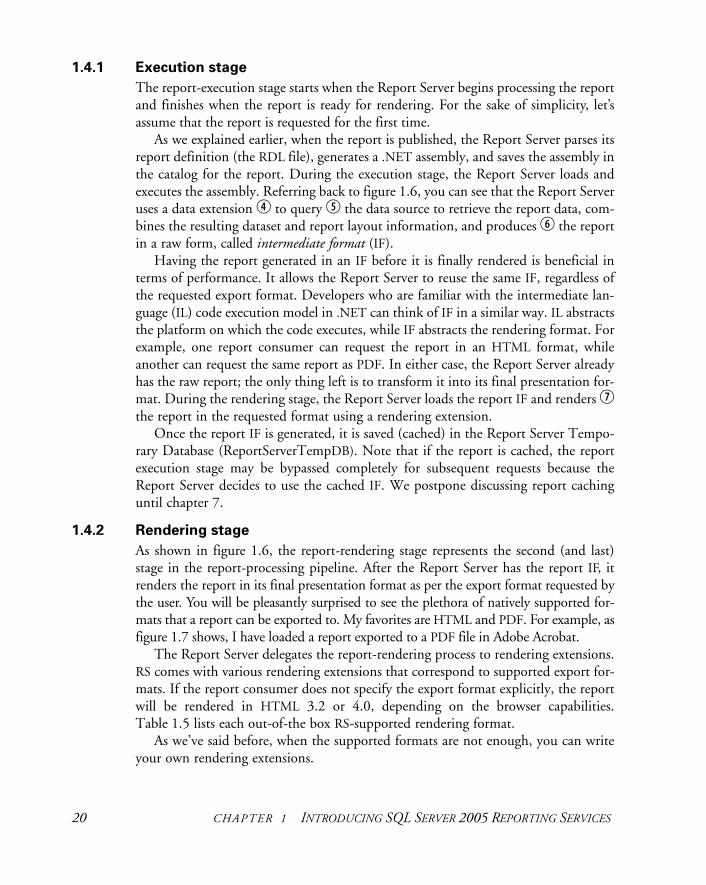
1.4.1 Execution stage
The report-execution stage starts when the Report Server begins processing the reportand finishes when the report is ready for rendering. For the sake of simplicity, let’sassume that the report is requested for the first time.
As we explained earlier, when the report is published, the Report Server parses itsreport definition (the RDL file), generates a .NET assembly, and saves the assembly inthe catalog for the report. During the execution stage, the Report Server loads andexecutes the assembly. Referring back to figure 1.6, you can see that the Report Serveruses a data extension e to query f the data source to retrieve the report data, com-bines the resulting dataset and report layout information, and produces g the reportin a raw form, called intermediate format (IF).
Having the report generated in an IF before it is finally rendered is beneficial interms of performance. It allows the Report Server to reuse the same IF, regardless ofthe requested export format. Developers who are familiar with the intermediate lan-guage (IL) code execution model in .NET can think of IF in a similar way. IL abstractsthe platform on which the code executes, while IF abstracts the rendering format. Forexample, one report consumer can request the report in an HTML format, whileanother can request the same report as PDF. In either case, the Report Server alreadyhas the raw report; the only thing left is to transform it into its final presentation for-mat. During the rendering stage, the Report Server loads the report IF and renders hthe report in the requested format using a rendering extension.
Once the report IF is generated, it is saved (cached) in the Report Server Tempo-rary Database (ReportServerTempDB). Note that if the report is cached, the reportexecution stage may be bypassed completely for subsequent requests because theReport Server decides to use the cached IF. We postpone discussing report cachinguntil chapter 7.
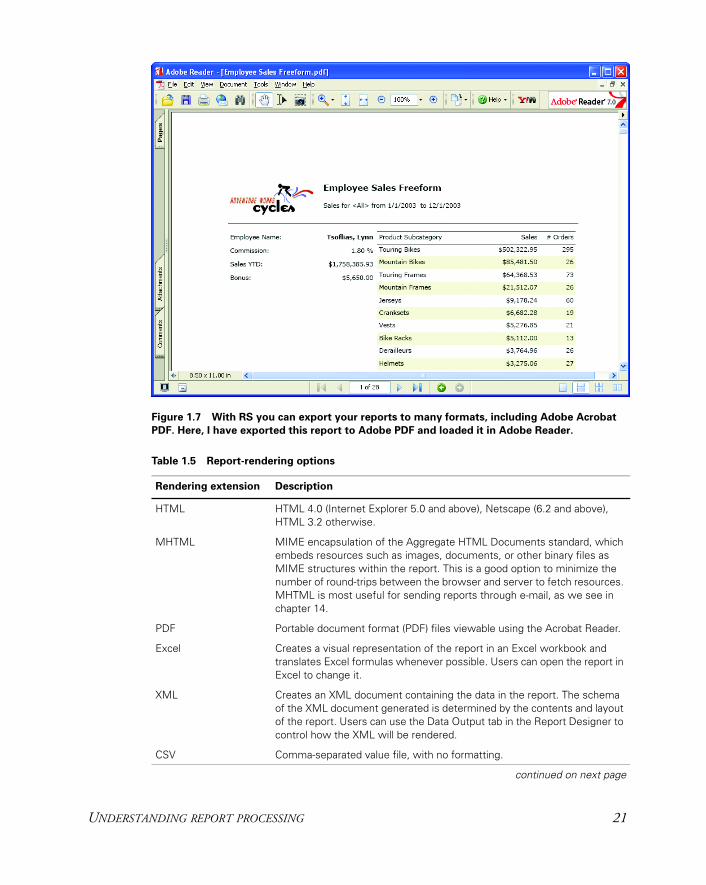
1.4.2 Rendering stage
As shown in figure 1.6, the report-rendering stage represents the second (and last)stage in the report-processing pipeline. After the Report Server has the report IF, itrenders the report in its final presentation format as per the export format requested bythe user. You will be pleasantly surprised to see the plethora of natively supported for-mats that a report can be exported to. My favorites are HTML and PDF. For example, asfigure 1.7 shows, I have loaded a report exported to a PDF file in Adobe Acrobat.
The Report Server delegates the report-rendering process to rendering extensions.RS comes with various rendering extensions that correspond to supported export for-mats. If the report consumer does not specify the export format explicitly, the reportwill be rendered in HTML 3.2 or 4.0, depending on the browser capabilities.Table 1.5 lists each out-of-the box RS-supported rendering format.
As we’ve said before, when the supported formats are not enough, you can writeyour own rendering extensions.
UNDERSTANDING REPORT PROCESSING 21
Table 1.5 Report-rendering options
Rendering extension Description
HTML HTML 4.0 (Internet Explorer 5.0 and above), Netscape (6.2 and above), HTML 3.2 otherwise.
MHTML MIME encapsulation of the Aggregate HTML Documents standard, which embeds resources such as images, documents, or other binary files as MIME structures within the report. This is a good option to minimize the number of round-trips between the browser and server to fetch resources. MHTML is most useful for sending reports through e-mail, as we see in chapter 14.
PDF Portable document format (PDF) files viewable using the Acrobat Reader.
Excel Creates a visual representation of the report in an Excel workbook and translates Excel formulas whenever possible. Users can open the report in Excel to change it.
XML Creates an XML document containing the data in the report. The schema of the XML document generated is determined by the contents and layout of the report. Users can use the Data Output tab in the Report Designer to control how the XML will be rendered.
CSV Comma-separated value file, with no formatting.
continued on next page
Figure 1.7 With RS you can export your reports to many formats, including Adobe Acrobat
PDF. Here, I have exported this report to Adobe PDF and loaded it in Adobe Reader.
22 CHAPTER 1 INTRODUCING SQL SERVER 2005 REPORTING SERVICES
Once the report is generated it is ready to travel to its final destination: the report user.RS gives you a lot of flexibility to distribute your reports, as you see in the next section.
1.5 DELIVERING REPORTS
As we mentioned earlier, RS supports both on-demand (pull) and subscribed (push)report delivery. To view a report on demand, the user explicitly requests the reportfrom the Report Server. Alternatively, the user can choose to subscribe to a report.With this option, the report is pushed to the subscribers when the report data isrefreshed or on a specified schedule.
Let’s take a closer look at each delivery option.
1.5.1 On-demand delivery
One of the most important decisions you will make when integrating RS reports inyour application is how the application will access the Report Server to requestreports. Although in some cases the system design may dictate the integration option,occasionally the choice won’t be so straightforward and you may have to carefullyevaluate the application requirements to determine the best approach. We revisit theon-demand delivery options in more detail in chapter 10. For now, note that reportscan be requested on demand in two ways: URL access and the Web service.
URL-based report access
The report consumer requests a report by URL by submitting an HTTP-GET requestto the Report Server. The advantages of URL access are its simplicity and better perform-ance. In the simplest case, the consumer can embed the report URL into a hyperlink.
For example, a web-based application can have a drop-down Reports menu, whereeach link targets an RS report. With the URL access option, the report arguments arepassed as query parameters in the report URL. For example, assuming that you haveinstalled the sample reports included with the book source code, the following URLwill run the Territory Sales Crosstab sample report with the start date 3/1/2003 andan end date of 4/30/2004.
http://localhost/ReportServer?/AWReporter/Territory Sales Crosstab&StartDate=3/1/2003&EndDate=4/30/2004
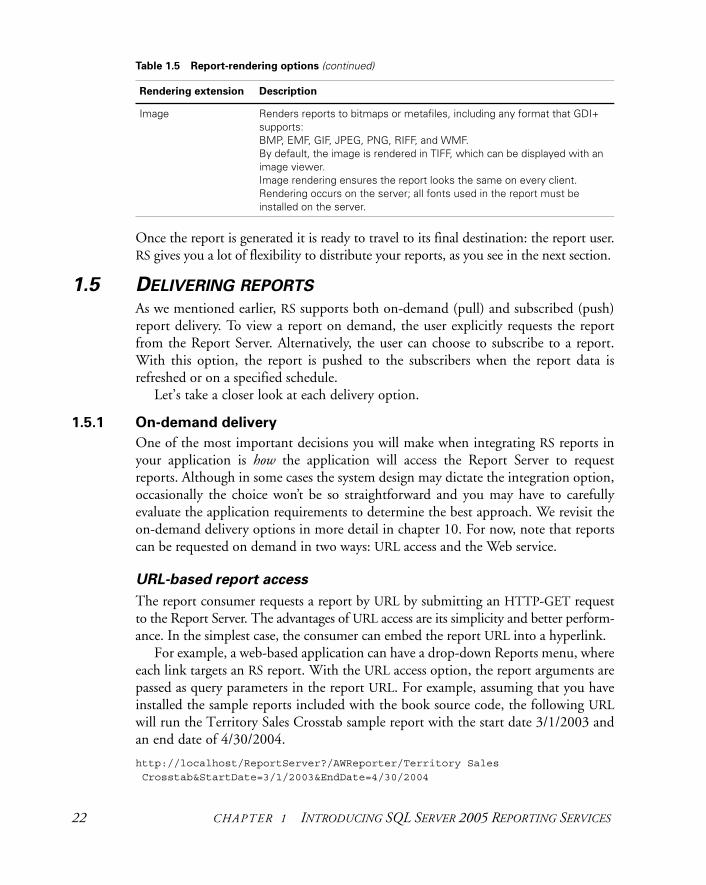
Image Renders reports to bitmaps or metafiles, including any format that GDI+ supports: BMP, EMF, GIF, JPEG, PNG, RIFF, and WMF. By default, the image is rendered in TIFF, which can be displayed with an image viewer. Image rendering ensures the report looks the same on every client. Rendering occurs on the server; all fonts used in the report must be installed on the server.
Table 1.5 Report-rendering options (continued)
Rendering extension Description
DELIVERING REPORTS 23
Web service
With RS, reports can also be requested by submitting SOAP-based requests to theReport Server Web service. The main advantage of this service is that its feature setgoes well beyond just report rendering. It also encompasses an extensive set of meth-ods to manage all aspects of the Report Server, such as uploading reports, retrieving alist of resources from the report catalog, and securing RS.
You can think of the Report Server Web service as a façade to the Report Serverthat allows RS to be integrated with a broad array of platforms. For example, if youare building an enterprise application integration (EAI) solution, a BizTalk schedulemight invoke the Web service Render() method, get the XML representation of thereport, retrieve some data from it, and pass it on to another application. Or, if yourreporting application is B2B oriented and your partner has a Web service, you cansend the report results to it in XML.
In some cases, a report consumer will use a combination of both access options tointegrate with RS. For example, a report consumer can use the RS Web service to findout what parameters a report takes. Then, the application presentation layer canpresent the parameters to the user so that the user can enter the parameter values.When the user submits the report request, the application can use URL access to sendthe request to the Report Server.
Report Viewer controls
If you are building applications with Visual Studio 2005 (.NET Framework 2.0), youwill want to take advantage of the Report Viewer controls. These controls take thework out of adding RS reports to your applications. The Report Viewer controls notonly help you pull reports from the RS server (remote mode), but also allow you tocreate reports that work outside of the RS server (local mode). Local mode eliminatesthe need for your applications to communicate with a report server to take advantageof Reporting Services features. However, using the Report Viewer control outside of areport server has both benefits and limitations. We learn all about the Report Viewercontrols in chapter 11.
1.5.2 Subscribed delivery
In the “push” report-delivery scenario, the reports are generated and delivered automat-ically by the Report Server to a delivery target. Reports can also be delivered at a sched-uled time. For example, a financial institution can set up a portfolio balance report to begenerated and delivered through e-mail to its customers at the end of each month.
The Report Server Windows service (ReportingServicesService.exe)works in tandem with the SQL Server Agent service to generate and deliver sub-scribed reports.
NOTE SQL Server Agent is a component of Microsoft SQL Server, and it is respon-sible for running scheduled SQL Server tasks.
24 CHAPTER 1 INTRODUCING SQL SERVER 2005 REPORTING SERVICES
For example, if the report is to be generated according to a set schedule, the SQLServer Agent will create a job and move the subscription to the Subscriptions tablewhen the time is up. The RS Windows service periodically polls the Report Configu-ration Database to find out whether there are any new subscription jobs. If this is thecase, the Windows service picks up the job, generates the report, and delivers it to theend users through a delivery extension.
Out of the box, RS comes with two delivery extensions:
• E-mail delivery extension
• File share delivery extension
The e-mail delivery extension delivers the report via e-mail. The report can be deliv-ered to either subscribed users (opt-in subscription) or to a data-driven list of recipi-ents. The file share extension delivers reports to a network share. When these twooptions are not enough, you can write custom delivery extensions.
Note that the Report Server Windows service doesn’t communicate with theReport Server through the HTTP Handler or Web service façades. Instead, because itis installed on the same machine as the Report Server, the Windows service directlyloads and calls the Report Server assemblies. This is beneficial for two reasons. Thefirst relates to availability. Even if the IIS server is down, the Windows service will stillexecute scheduled tasks and deliver reports to subscribers. The other reason is betterperformance—the web façades are completely bypassed.
Another task that the Report Services Windows service is responsible for is per-forming background database integrity checks, as well as other administrative tasks.
Before we see RS in action, let’s analyze the report lifecycle. A good high-levelunderstanding of the lifecycle is important because the remaining chapters of thisbook follow an identical flow.
1.6 WHAT IS THE REPORT LIFECYCLE?
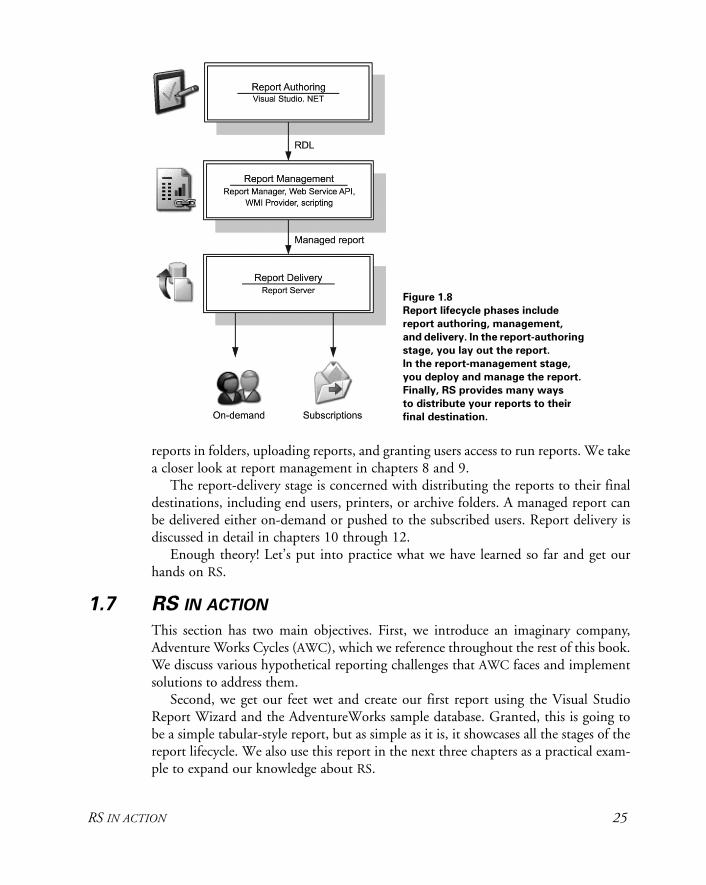
By now, you probably realize that the Report Server is a sophisticated reporting plat-form with a feature set that goes well beyond a desktop reporting tool. To minimizethe learning curve, this book follows a logical path based on the report lifecycle. Thereport lifecycle is the process that you typically follow to work with reports, and itinvolves the three stages as shown in figure 1.8: authoring, management, and delivery.
In the report-authoring stage, you create the RDL file through the use of report-authoring tools. For example, you can use the Visual Studio Report Designer to layout the report. Recall that both report data retrieval and layout information aredescribed in the RDL file. We’ll discuss many more details of the report-authoringstage in chapters 2 through 7.
In the report-management stage, you manage the report catalog. As you recall, thereport catalog is stored in the Report Configuration Database. The report catalogkeeps the report and all related items. Typical management tasks include organizing
RS IN ACTION 25
reports in folders, uploading reports, and granting users access to run reports. We takea closer look at report management in chapters 8 and 9.
The report-delivery stage is concerned with distributing the reports to their finaldestinations, including end users, printers, or archive folders. A managed report canbe delivered either on-demand or pushed to the subscribed users. Report delivery isdiscussed in detail in chapters 10 through 12.
Enough theory! Let’s put into practice what we have learned so far and get ourhands on RS.
1.7 RS IN ACTION
This section has two main objectives. First, we introduce an imaginary company,Adventure Works Cycles (AWC), which we reference throughout the rest of this book.We discuss various hypothetical reporting challenges that AWC faces and implementsolutions to address them.
Second, we get our feet wet and create our first report using the Visual StudioReport Wizard and the AdventureWorks sample database. Granted, this is going tobe a simple tabular-style report, but as simple as it is, it showcases all the stages of thereport lifecycle. We also use this report in the next three chapters as a practical exam-ple to expand our knowledge about RS.
Figure 1.8
Report lifecycle phases include
report authoring, management,
and delivery. In the report-authoring
stage, you lay out the report.
In the report-management stage,
you deploy and manage the report.
Finally, RS provides many ways
to distribute your reports to their
final destination.
26 CHAPTER 1 INTRODUCING SQL SERVER 2005 REPORTING SERVICES
The Adventure Works sample database
Finally, if you install the SQL Server 2005 samples, the setup program installs a sampledatabase called AdventureWorks. This database is also used by other Microsoft prod-ucts, such as Commerce Server. To install the AdventureWorks, you need to select theadvanced options during the installation. See appendix A for more details.
The AdventureWorks database includes a much more “realistic” sales ordering data-base model than the SQL Server sample databases, Northwind or Pubs. You quicklyrealize this by surveying the data held in the more than 60 tables. We work with thissample database in this section, and you have a chance to create a report using RS.
1.7.1 About the Adventure Works Reporter
Let’s start with a hypothetical problem statement. You are a developer with AWC,which manufactures and sells goods to individuals and retailers. The company hasenjoyed tremendous success the last few years. Sales are going up exponentially andthe customer base is growing fast. Today, AWC has customers both in the UnitedStates and overseas. It has already implemented a web-based ordering online transac-tion processing (OLTP) system to capture sales orders online.
However, success does not come cheap. Data inaccuracy and slow decision mak-ing are among the top complaints by the sales managers. Often, data is captured andconsolidated in the form of Excel spreadsheets. A reporting system is needed topresent the company with data in a format that’s both easy to understand and analyze,and to allow AWC’s management to discover trends and see how the company is per-forming. You have been designated as a lead developer for the new Adventure Works(AW) Reporter system. Fascinated by Microsoft SQL Server 2005 RS, you decide tobase your reporting system on it.
NOTE In the real world, you should abstain from reporting off an OLTP databasefor performance reasons. As the name suggests, OLTP systems must scale tomeet large transaction volumes and handle hundreds and even thousandsof users. Reporting applications usually submit queries to retrieve and ana-lyze substantial sets of data, which impose data locks on many records inthe database. This can severely tax your OLTP system performance. For thisreason, reporting and OLTP are usually two mutually exclusive options. Atypical solution involves consolidating OLTP data and then uploading it toa data warehouse database that is optimized and designated for reportingpurposes only.
1.7.2 Your first report
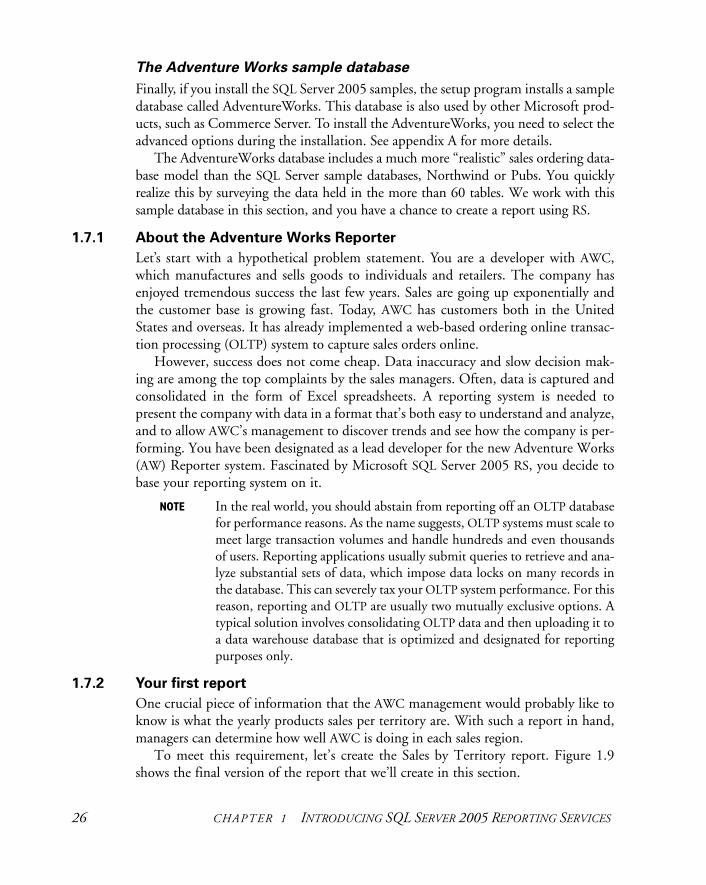
One crucial piece of information that the AWC management would probably like toknow is what the yearly products sales per territory are. With such a report in hand,managers can determine how well AWC is doing in each sales region.
To meet this requirement, let’s create the Sales by Territory report. Figure 1.9shows the final version of the report that we’ll create in this section.
RS IN ACTION 27
This is just one of the many sample reports we design throughout the course of thisbook. We use the Sales by Territory report in subsequent chapters to demonstrateother RS features.
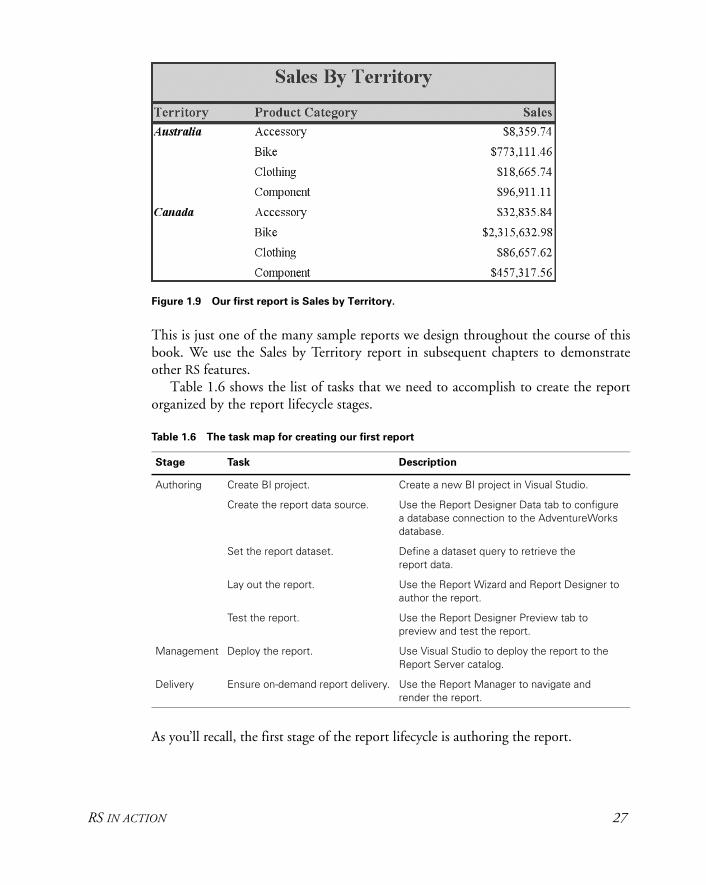
Table 1.6 shows the list of tasks that we need to accomplish to create the reportorganized by the report lifecycle stages.
As you’ll recall, the first stage of the report lifecycle is authoring the report.
Table 1.6 The task map for creating our first report
Stage Task Description
Authoring Create BI project. Create a new BI project in Visual Studio.
Create the report data source. Use the Report Designer Data tab to configure a database connection to the AdventureWorks database.
Set the report dataset. Define a dataset query to retrieve the report data.
Lay out the report. Use the Report Wizard and Report Designer to author the report.
Test the report. Use the Report Designer Preview tab to preview and test the report.
Management Deploy the report. Use Visual Studio to deploy the report to the Report Server catalog.
Delivery Ensure on-demand report delivery. Use the Report Manager to navigate and render the report.
Figure 1.9 Our first report is Sales by Territory.
28 CHAPTER 1 INTRODUCING SQL SERVER 2005 REPORTING SERVICES
Authoring the report
Let’s develop our first report using the Report Designer. To do so, we need to create anew Visual Studio Business Intelligence (BI) project.
Task: Create a Business Intelligence Project
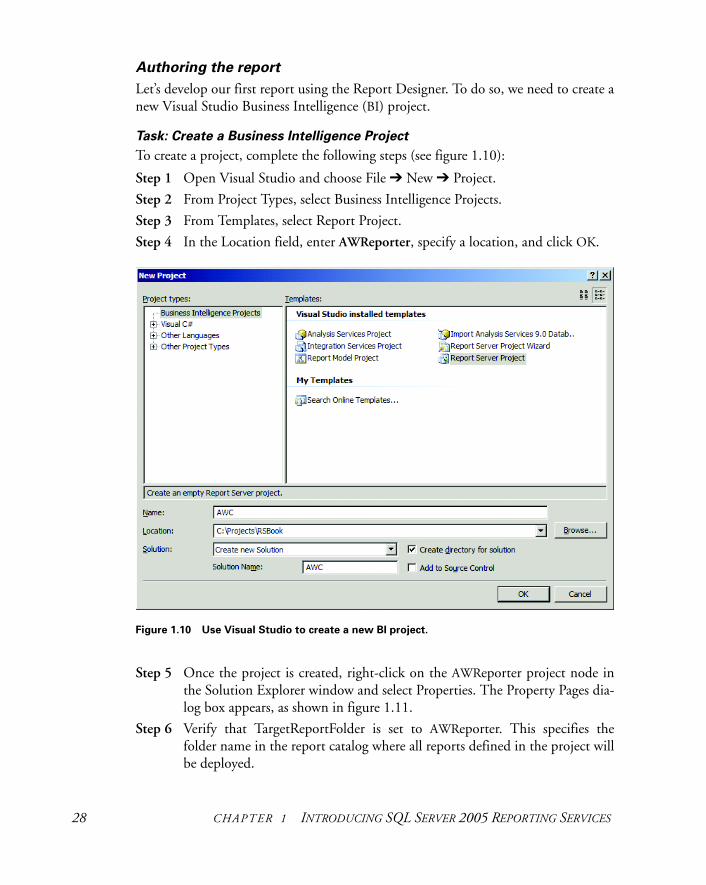
To create a project, complete the following steps (see figure 1.10):
Step 1 Open Visual Studio and choose File ➔ New ➔ Project.
Step 2 From Project Types, select Business Intelligence Projects.
Step 3 From Templates, select Report Project.
Step 4 In the Location field, enter AWReporter, specify a location, and click OK.
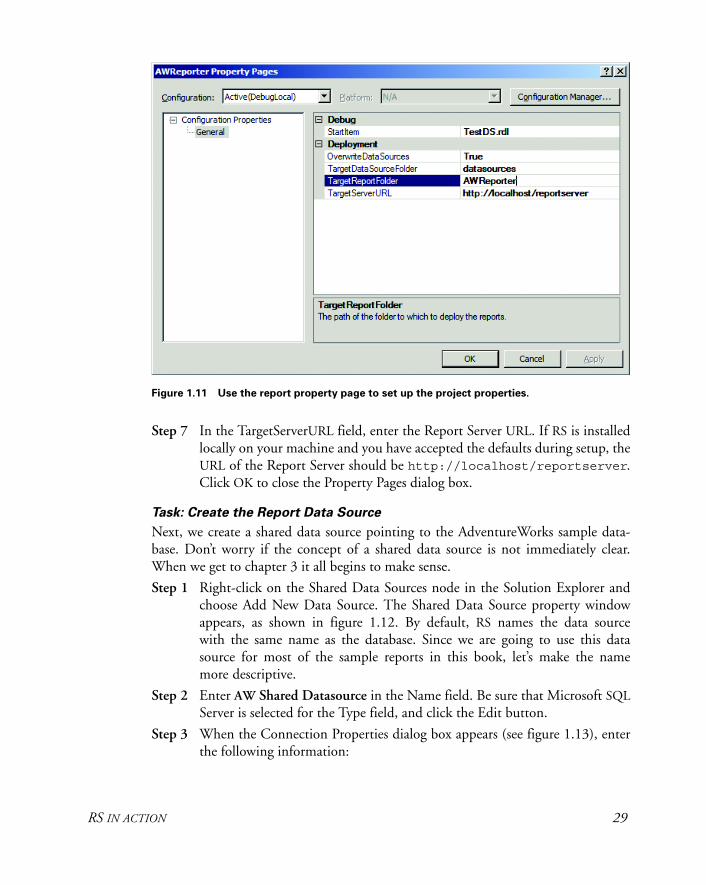
Step 5 Once the project is created, right-click on the AWReporter project node inthe Solution Explorer window and select Properties. The Property Pages dia-log box appears, as shown in figure 1.11.
Step 6 Verify that TargetReportFolder is set to AWReporter. This specifies thefolder name in the report catalog where all reports defined in the project willbe deployed.
Figure 1.10 Use Visual Studio to create a new BI project.
RS IN ACTION 29
Step 7 In the TargetServerURL field, enter the Report Server URL. If RS is installedlocally on your machine and you have accepted the defaults during setup, theURL of the Report Server should be http://localhost/reportserver.Click OK to close the Property Pages dialog box.
Task: Create the Report Data Source
Next, we create a shared data source pointing to the AdventureWorks sample data-base. Don’t worry if the concept of a shared data source is not immediately clear.When we get to chapter 3 it all begins to make sense.
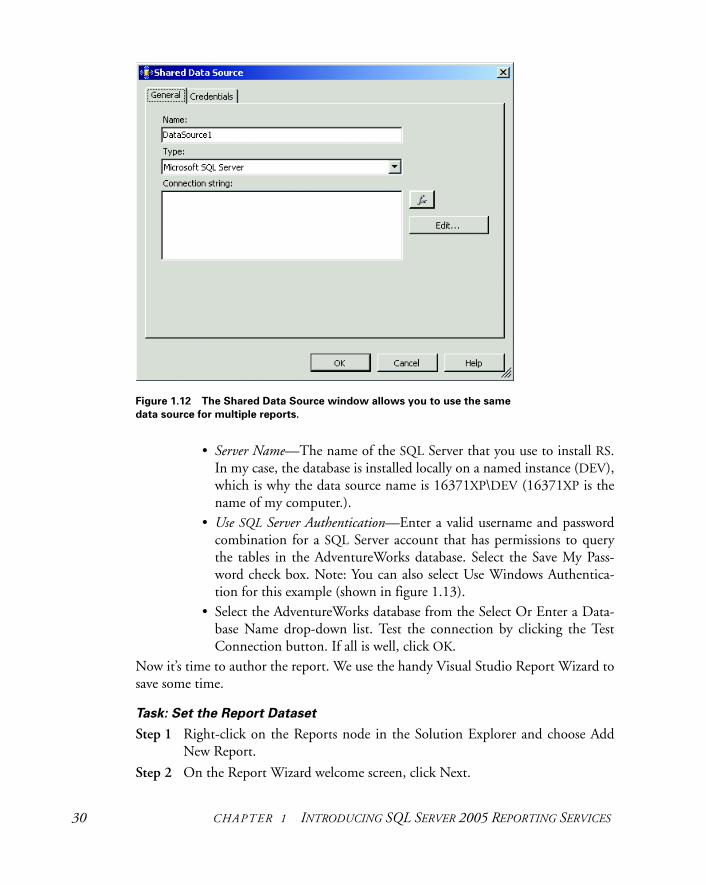
Step 1 Right-click on the Shared Data Sources node in the Solution Explorer andchoose Add New Data Source. The Shared Data Source property windowappears, as shown in figure 1.12. By default, RS names the data sourcewith the same name as the database. Since we are going to use this datasource for most of the sample reports in this book, let’s make the namemore descriptive.
Step 2 Enter AW Shared Datasource in the Name field. Be sure that Microsoft SQLServer is selected for the Type field, and click the Edit button.
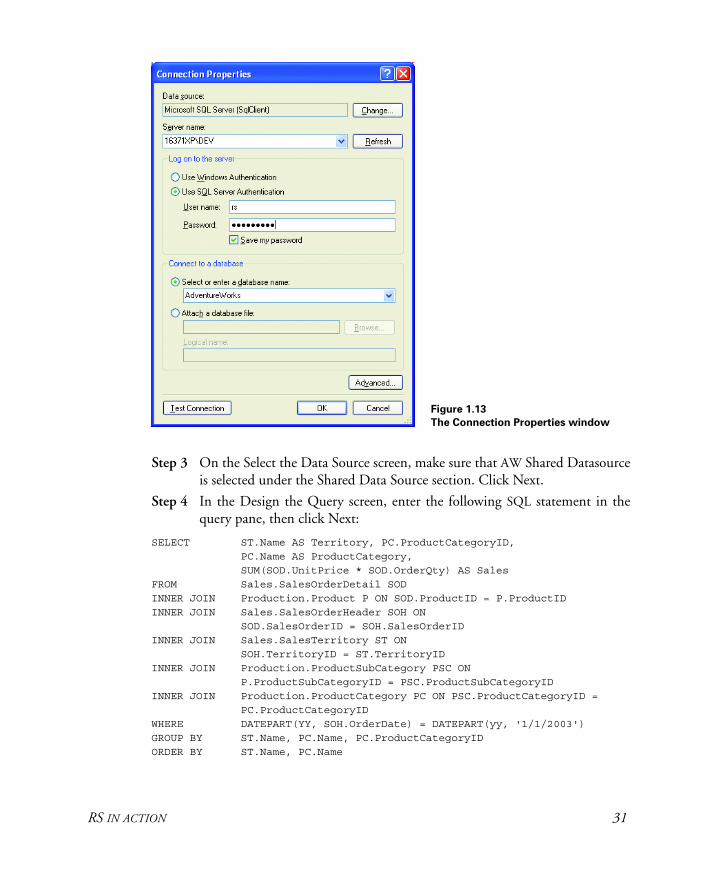
Step 3 When the Connection Properties dialog box appears (see figure 1.13), enterthe following information:
Figure 1.11 Use the report property page to set up the project properties.
30 CHAPTER 1 INTRODUCING SQL SERVER 2005 REPORTING SERVICES
• Server Name—The name of the SQL Server that you use to install RS.In my case, the database is installed locally on a named instance (DEV),which is why the data source name is 16371XP\DEV (16371XP is thename of my computer.).
• Use SQL Server Authentication—Enter a valid username and passwordcombination for a SQL Server account that has permissions to querythe tables in the AdventureWorks database. Select the Save My Pass-word check box. Note: You can also select Use Windows Authentica-tion for this example (shown in figure 1.13).
• Select the AdventureWorks database from the Select Or Enter a Data-base Name drop-down list. Test the connection by clicking the TestConnection button. If all is well, click OK.
Now it’s time to author the report. We use the handy Visual Studio Report Wizard tosave some time.
Task: Set the Report Dataset
Step 1 Right-click on the Reports node in the Solution Explorer and choose AddNew Report.
Step 2 On the Report Wizard welcome screen, click Next.
Figure 1.12 The Shared Data Source window allows you to use the same
data source for multiple reports.
RS IN ACTION 31
Step 3 On the Select the Data Source screen, make sure that AW Shared Datasourceis selected under the Shared Data Source section. Click Next.
Step 4 In the Design the Query screen, enter the following SQL statement in thequery pane, then click Next:
SELECT ST.Name AS Territory, PC.ProductCategoryID, PC.Name AS ProductCategory, SUM(SOD.UnitPrice * SOD.OrderQty) AS SalesFROM Sales.SalesOrderDetail SOD INNER JOIN Production.Product P ON SOD.ProductID = P.ProductIDINNER JOIN Sales.SalesOrderHeader SOH ON SOD.SalesOrderID = SOH.SalesOrderID INNER JOIN Sales.SalesTerritory ST ON SOH.TerritoryID = ST.TerritoryID INNER JOIN Production.ProductSubCategory PSC ON P.ProductSubCategoryID = PSC.ProductSubCategoryID INNER JOIN Production.ProductCategory PC ON PSC.ProductCategoryID = PC.ProductCategoryIDWHERE DATEPART(YY, SOH.OrderDate) = DATEPART(yy, '1/1/2003')GROUP BY ST.Name, PC.Name, PC.ProductCategoryIDORDER BY ST.Name, PC.Name
Figure 1.13
The Connection Properties window
32 CHAPTER 1 INTRODUCING SQL SERVER 2005 REPORTING SERVICES
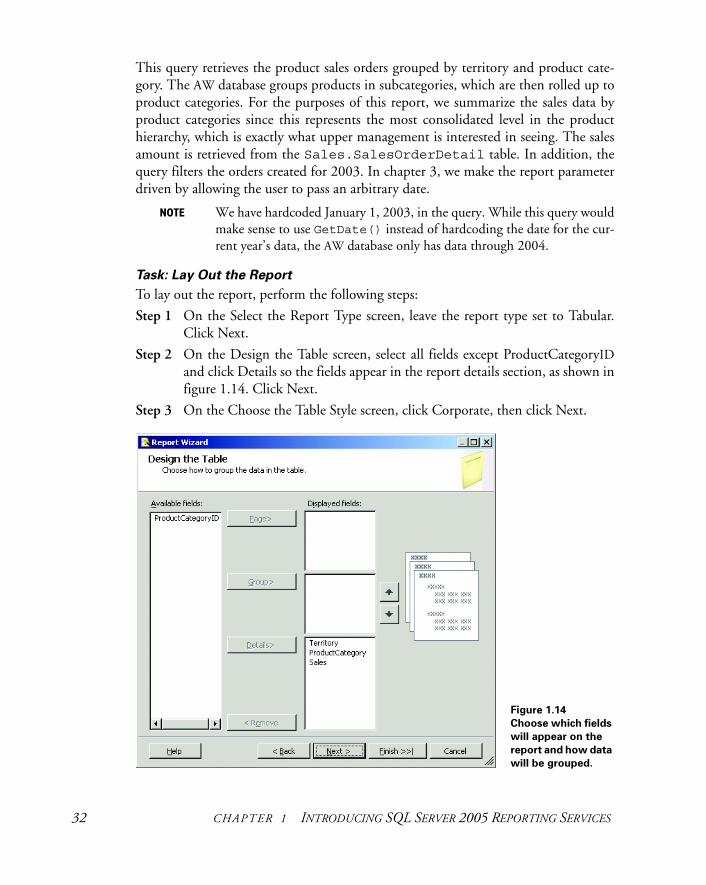
This query retrieves the product sales orders grouped by territory and product cate-gory. The AW database groups products in subcategories, which are then rolled up toproduct categories. For the purposes of this report, we summarize the sales data byproduct categories since this represents the most consolidated level in the producthierarchy, which is exactly what upper management is interested in seeing. The salesamount is retrieved from the Sales.SalesOrderDetail table. In addition, thequery filters the orders created for 2003. In chapter 3, we make the report parameterdriven by allowing the user to pass an arbitrary date.
NOTE We have hardcoded January 1, 2003, in the query. While this query wouldmake sense to use GetDate() instead of hardcoding the date for the cur-rent year’s data, the AW database only has data through 2004.
Task: Lay Out the Report
To lay out the report, perform the following steps:
Step 1 On the Select the Report Type screen, leave the report type set to Tabular.Click Next.
Step 2 On the Design the Table screen, select all fields except ProductCategoryIDand click Details so the fields appear in the report details section, as shown infigure 1.14. Click Next.
Step 3 On the Choose the Table Style screen, click Corporate, then click Next.
Figure 1.14
Choose which fields
will appear on the
report and how data
will be grouped.
RS IN ACTION 33
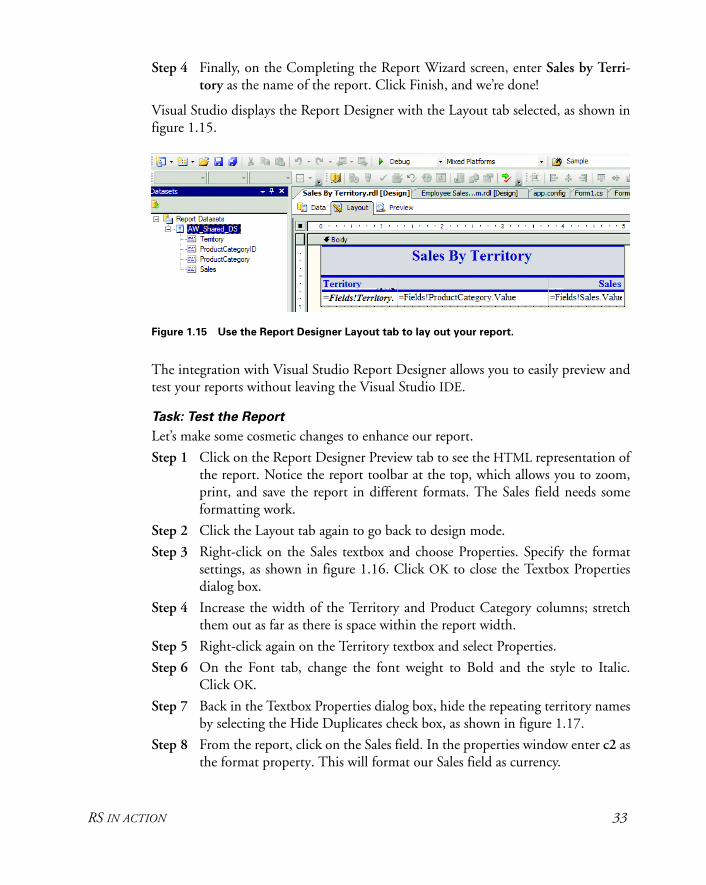
Step 4 Finally, on the Completing the Report Wizard screen, enter Sales by Terri-tory as the name of the report. Click Finish, and we’re done!
Visual Studio displays the Report Designer with the Layout tab selected, as shown infigure 1.15.
The integration with Visual Studio Report Designer allows you to easily preview andtest your reports without leaving the Visual Studio IDE.
Task: Test the Report
Let’s make some cosmetic changes to enhance our report.
Step 1 Click on the Report Designer Preview tab to see the HTML representation ofthe report. Notice the report toolbar at the top, which allows you to zoom,print, and save the report in different formats. The Sales field needs someformatting work.
Step 2 Click the Layout tab again to go back to design mode.
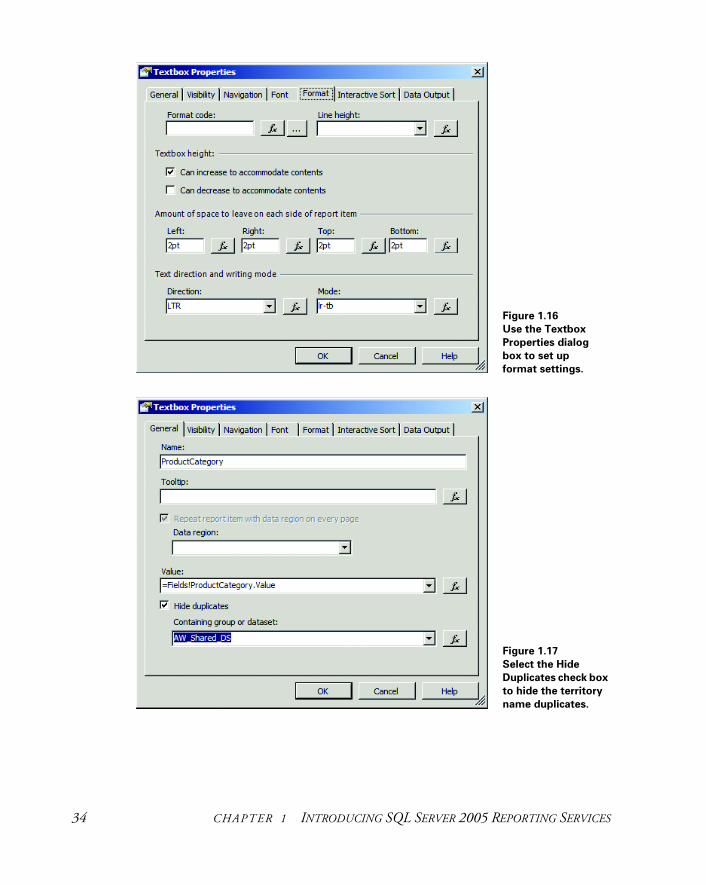
Step 3 Right-click on the Sales textbox and choose Properties. Specify the formatsettings, as shown in figure 1.16. Click OK to close the Textbox Propertiesdialog box.
Step 4 Increase the width of the Territory and Product Category columns; stretchthem out as far as there is space within the report width.
Step 5 Right-click again on the Territory textbox and select Properties.
Step 6 On the Font tab, change the font weight to Bold and the style to Italic.Click OK.
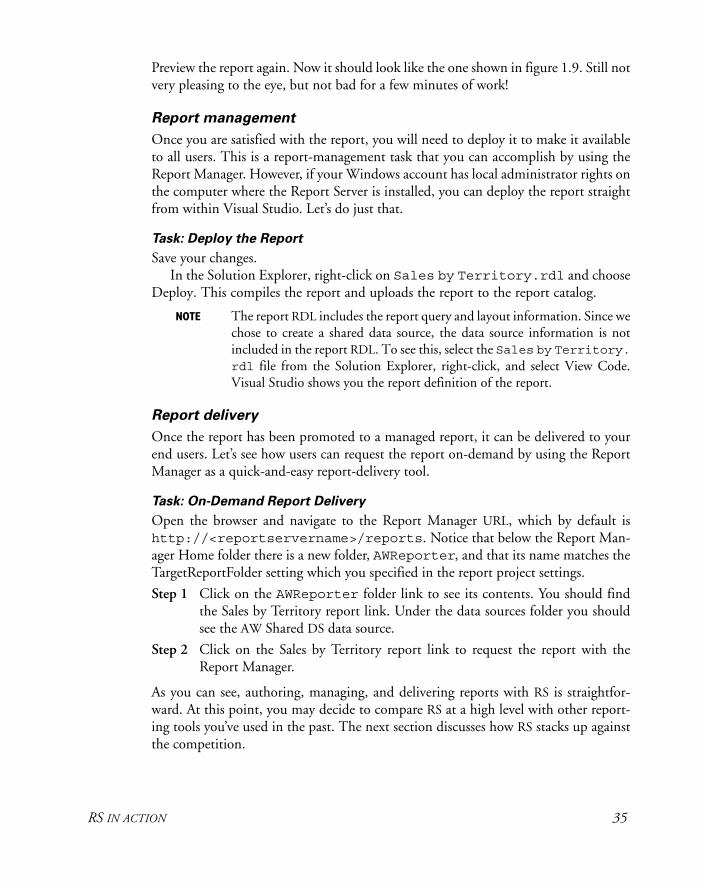
Step 7 Back in the Textbox Properties dialog box, hide the repeating territory namesby selecting the Hide Duplicates check box, as shown in figure 1.17.
Step 8 From the report, click on the Sales field. In the properties window enter c2 asthe format property. This will format our Sales field as currency.
Figure 1.15 Use the Report Designer Layout tab to lay out your report.
34 CHAPTER 1 INTRODUCING SQL SERVER 2005 REPORTING SERVICES
Figure 1.16
Use the Textbox
Properties dialog
box to set up
format settings.
Figure 1.17
Select the Hide
Duplicates check box
to hide the territory
name duplicates.
RS IN ACTION 35
Preview the report again. Now it should look like the one shown in figure 1.9. Still notvery pleasing to the eye, but not bad for a few minutes of work!
Report management
Once you are satisfied with the report, you will need to deploy it to make it availableto all users. This is a report-management task that you can accomplish by using theReport Manager. However, if your Windows account has local administrator rights onthe computer where the Report Server is installed, you can deploy the report straightfrom within Visual Studio. Let’s do just that.
Task: Deploy the Report
Save your changes. In the Solution Explorer, right-click on Sales by Territory.rdl and choose
Deploy. This compiles the report and uploads the report to the report catalog.
NOTE The report RDL includes the report query and layout information. Since wechose to create a shared data source, the data source information is notincluded in the report RDL. To see this, select the Sales by Territory.rdl file from the Solution Explorer, right-click, and select View Code.Visual Studio shows you the report definition of the report.
Report delivery
Once the report has been promoted to a managed report, it can be delivered to yourend users. Let’s see how users can request the report on-demand by using the ReportManager as a quick-and-easy report-delivery tool.
Task: On-Demand Report Delivery
Open the browser and navigate to the Report Manager URL, which by default ishttp://<reportservername>/reports. Notice that below the Report Man-ager Home folder there is a new folder, AWReporter, and that its name matches theTargetReportFolder setting which you specified in the report project settings.
Step 1 Click on the AWReporter folder link to see its contents. You should findthe Sales by Territory report link. Under the data sources folder you shouldsee the AW Shared DS data source.
Step 2 Click on the Sales by Territory report link to request the report with theReport Manager.
As you can see, authoring, managing, and delivering reports with RS is straightfor-ward. At this point, you may decide to compare RS at a high level with other report-ing tools you’ve used in the past. The next section discusses how RS stacks up againstthe competition.
36 CHAPTER 1 INTRODUCING SQL SERVER 2005 REPORTING SERVICES
1.8 EVALUATING RS
Throughout my career as a software consultant, I have had the opportunity to turnmany clients on to Reporting Services. I am continually impressed by how quicklymost developers have learned to effectively build reports and enable end users to getthe data they need. Not only is RS easy to use and deploy, it is also surprisingly featurerich. My favorite top ten features, where I believe RS excels, are as follows:
1 Report Builder—Adds ad hoc reporting capabilities to your business users. Thistool will allow business users to create amazingly complex queries for reports bydragging and dropping fields and selecting filters for the data. In addition, infi-nite drill-through reporting will change the way you think about ad hoc reports.
2 Natively exposed as a Web service—The RS reports are widely accessible, and youdon’t have to do anything special to publish your reports as web services becausethey are hosted under the Report Server, which provides a web service façade.
3 Support of plethora of export formats—You may be delighted to learn that theability to export reports to PDF and Excel is provided out of the box. In addi-tion, reports can be delivered in many other popular formats, including webformats (HTML), popular image formats (such as TIFF and JPEG), and data for-mats (Excel, XML, and CSV).
4 On-demand and subscribed report delivery—Another huge plus is the subscribedreport delivery option, which allows developers to implement opt-in report fea-tures in their applications.
5 Documented report definition format—Developers can create reports to be pub-lished to the Report Server using Microsoft or third-party design tools that sup-port the RS XML RDL.
6 .NET Framework integration—In the extensibility area, you’ll appreciate the factthat you are not locked out from a programmability standpoint. As we men-tioned earlier, when built-in features are not enough, you can reach out andborrow from the power of the .NET Framework by integrating your reportswith .NET code. In addition, the Report Services programming model is100 percent .NET based.
7 Extensible architecture—The RS architecture is fully extensible and allows devel-opers to plug in their own security, data, delivery, and rendering extensions.
8 Zero deployment—Thanks to its service-oriented architecture, RS has no clientfootprint and offers true zero deployment for all application types.
9 Scalability—RS can scale better, since it is designed from the ground up to scalein web farm environments.
10 Cost—From a cost perspective, it is hard to beat the bundled-with-the-SQL-Server RS pricing model, especially if you compare it with the five-digit pricetag of third-party reporting tools.
SUMMARY 37
1.9 SUMMARY
This chapter took you on a whirlwind tour of the RS platform. We discussed its spacein the SQL Server platform and addressed how it fits into the Microsoft BI initiative.We also looked at its features and high-level architecture. You even had a chance touse RS and create a simple report based on the AdventureWorks sample database.Now that you have a workable, high-level understanding of its features, you can beginusing RS to report-enable your own applications.
By now, you should understand the major components of RS and their role in thereport lifecycle. In addition, you should see the advantages that the service-orientedand web-enabled RS architecture has to offer.
Perhaps most important, you should be familiar with the three stages of the reportlifecycle: report authoring, management, and delivery. The remaining chaptersexplore each of these stages in this order. In the next chapter, we discuss differentways to create RS reports.