Same plan different performance
53
Same Plan Different Performance Mauro Pagano
-
Upload
mauro-pagano -
Category
Software
-
view
90 -
download
0
Transcript of Same plan different performance

SamePlanDifferentPerformance
MauroPagano

SQLisslower….• SameSQLexperiencesdifferentperformanceinsystemsthatareidentical(orsupposedto)
• Firstchecktheexecutionplan• Mostofthetimeplanisdifferent,addressit• Butwhatiftheplanisthesame?
2

CBOisinnocent(thistime,maybe)• ExecplaniswhereCBO’sjobend(kindof)• SameplanmeansCBO“worked”thesame• Doesn’tmeaneverythingelseIS thesame• Shiftfocusonnextstep,SQLexecution
3
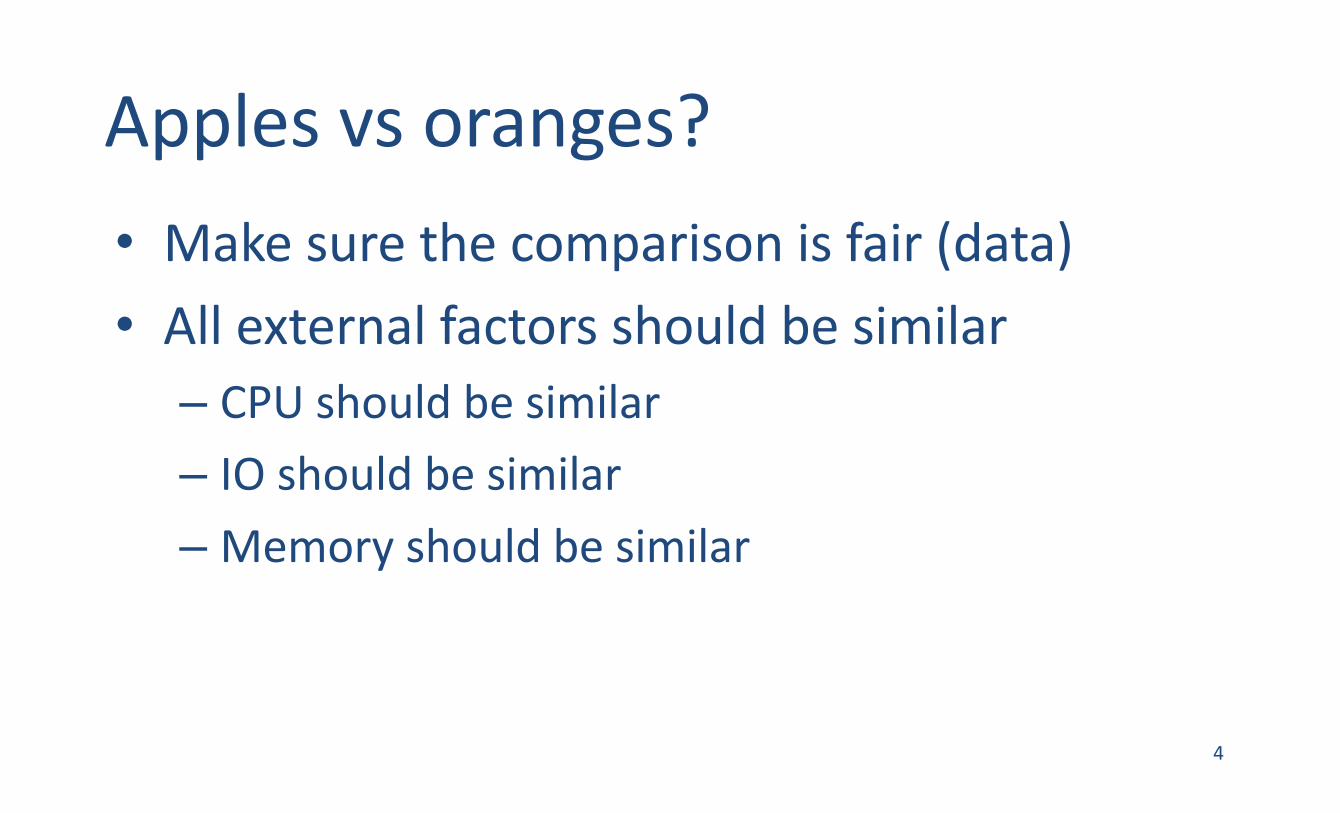
Applesvs oranges?• Makesurethecomparisonisfair(data)• Allexternalfactorsshouldbesimilar– CPUshouldbesimilar– IOshouldbesimilar–Memoryshouldbesimilar
4

“Everythingisthesame!”• Plan,dataandhardwarematch,nowwhat?• DigintohowtheSQLisexecuted• Waiteventsandsessionstatistics• Factors– configuration,storagelayout,load
5

Oldfriendsget-together• Waitevents– Dotheymatch?– Aretheycloseincardinality?– Dowespendthesametimeonthem?
• Sessionstatistics– Dotheymatch?– Aretheycloseinvalues?
6

Backtotheplanforasecond• Execplanismadeoflotsofsmallsteps• Eachoneproduces/handles/consumesrows• Samebehaviorsinshortandlongplans• Keepitsimple,focusonthestep• Removethenoiseifpossible(reduceTC)
7

Eachscenarioisaquiz• SQLisprovided• Changestotheinitialsetuparedisclosed• Eachruninoneenvironment
• Identifywhat’sdifferentandwhy
8

Setup• Linuxx86-64,11.2.0.3• 1table,1Mrows,3columns,noindex– N1unique– N2100NDV– C1100charslongpaddedstring
• Identicalhardware,sameDDLtocreatetable• Controlledenvironmentstoisolatebehavior• SimplestSQLtoreproducedesiredbehavior
9

Scenario#1• SQL– select/*+INDEX(TEST1M)*/count(*)
fromtest1mwheren1between1and1000000
• Environment– AddedindexonN1
10

Scenario#1– Run(A)call count cpu elapsed disk query current rows------- ------ -------- ---------- ---------- ---------- ---------- ----------Parse 1 0.00 0.00 0 0 0 0Execute 1 0.00 0.00 0 0 0 0Fetch 2 0.31 0.45 2228 2228 0 1------- ------ -------- ---------- ---------- ---------- ---------- ----------total 4 0.32 0.45 2228 2228 0 1
Rows (1st) Rows (avg) Rows (max) Row Source Operation---------- ---------- ---------- ---------------------------------------------------
1 1 1 SORT AGGREGATE (cr=2228 pr=2228 pw=0 time=451619 us)1000000 1000000 1000000 INDEX RANGE SCAN TEST1M_IDX (cr=2228 pr=2228
Event waited on Times Max. Wait Total Waited---------------------------------------- Waited ---------- ------------
db file sequential read 2228 0.00 0.15
11
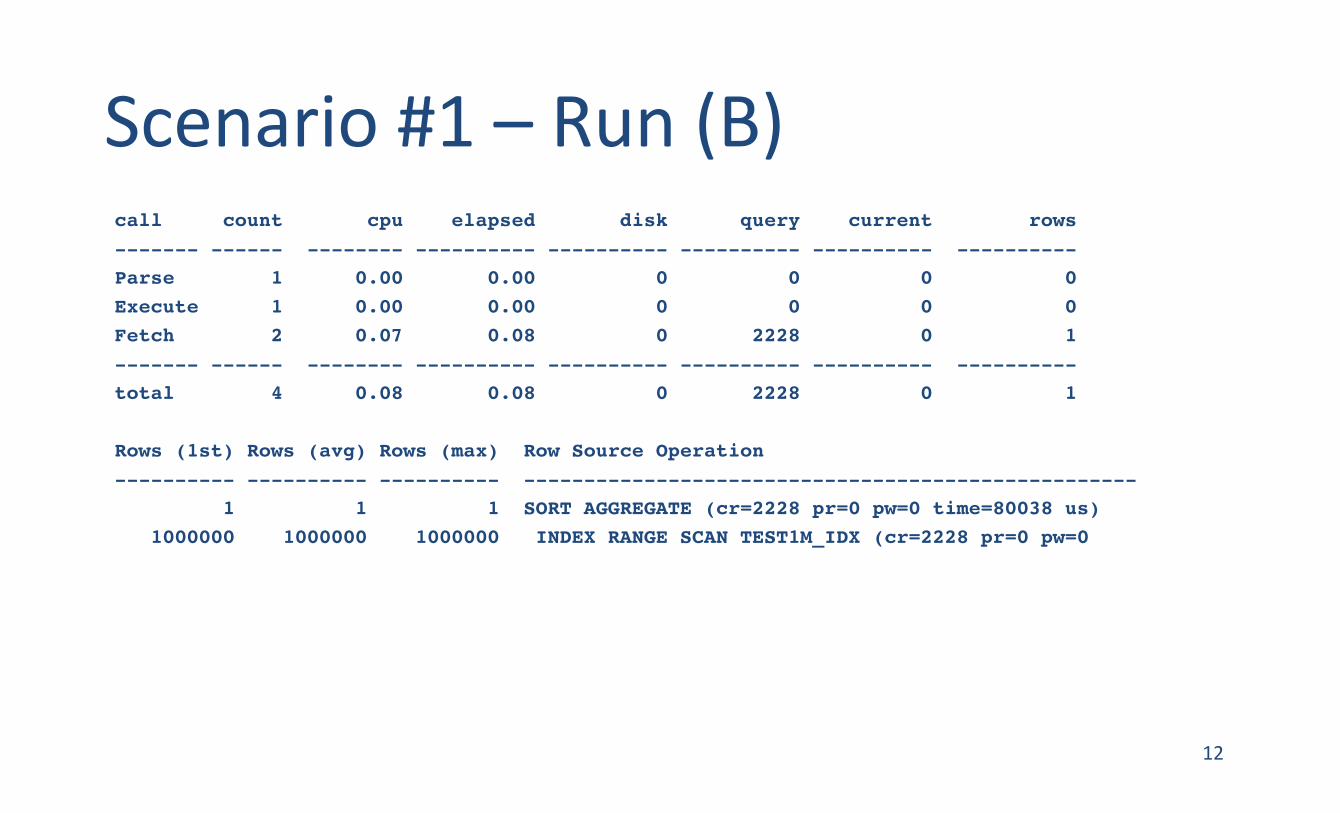
Scenario#1– Run(B)call count cpu elapsed disk query current rows------- ------ -------- ---------- ---------- ---------- ---------- ----------Parse 1 0.00 0.00 0 0 0 0Execute 1 0.00 0.00 0 0 0 0Fetch 2 0.07 0.08 0 2228 0 1------- ------ -------- ---------- ---------- ---------- ---------- ----------total 4 0.08 0.08 0 2228 0 1
Rows (1st) Rows (avg) Rows (max) Row Source Operation---------- ---------- ---------- ---------------------------------------------------
1 1 1 SORT AGGREGATE (cr=2228 pr=0 pw=0 time=80038 us)1000000 1000000 1000000 INDEX RANGE SCAN TEST1M_IDX (cr=2228 pr=0 pw=0
12

Scenario#1Solution• BufferCachecold/warm• (Partof)thedataalreadyinmemory• Reducednumberofphysicalreads(pr)• Fasterperformancebecauselessreads• Numberof(same)waiteventsislower• Isolatedenvironmentlikelytoreadmore
13
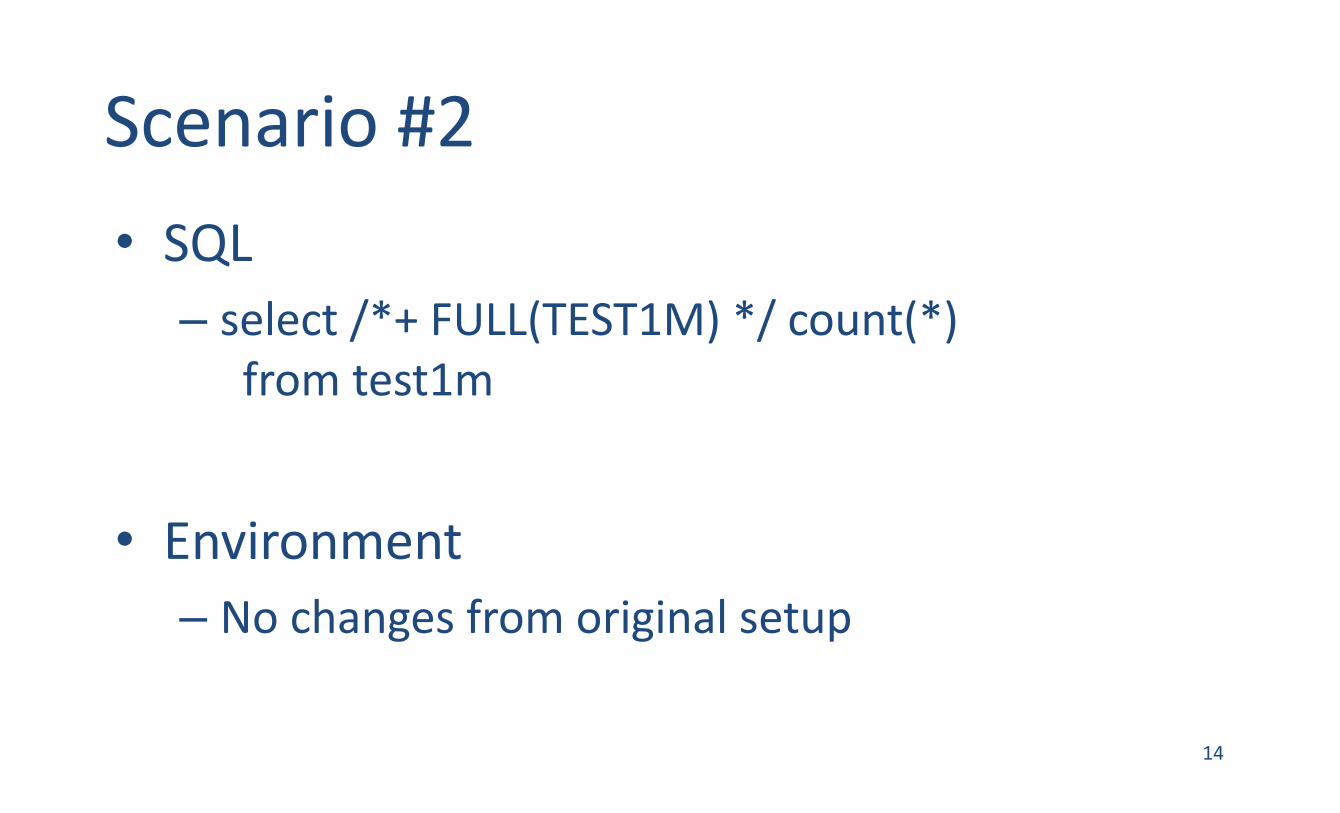
Scenario#2• SQL– select/*+FULL(TEST1M)*/count(*)
fromtest1m
• Environment– Nochangesfromoriginalsetup
14

Scenario#2– Run(A)call count cpu elapsed disk query current rows------- ------ -------- ---------- ---------- ---------- ---------- ----------Parse 1 0.00 0.01 0 0 0 0Execute 1 0.00 0.00 0 0 0 0Fetch 2 0.57 1.51 28574 28584 0 1------- ------ -------- ---------- ---------- ---------- ---------- ----------total 4 0.57 1.52 28574 28584 0 1
Rows (1st) Rows (avg) Rows (max) Row Source Operation---------- ---------- ---------- ---------------------------------------------------
1 1 1 SORT AGGREGATE (cr=28584 pr=28574 pw=0 time=1513999 us)1000000 1000000 1000000 TABLE ACCESS FULL TEST1M (cr=28584 pr=28574
Event waited on Times Max. Wait Total Waited---------------------------------------- Waited ---------- ------------db file sequential read 1 0.00 0.00db file scattered read 240 0.02 1.07
15

Scenario#2– Run(B)call count cpu elapsed disk query current rows------- ------ -------- ---------- ---------- ---------- ---------- ----------Parse 1 0.00 0.00 0 0 0 0Execute 1 0.00 0.00 0 0 0 0Fetch 2 1.04 2.42 14286 28583 0 1------- ------ -------- ---------- ---------- ---------- ---------- ----------total 4 1.04 2.42 14286 28583 0 1
Rows (1st) Rows (avg) Rows (max) Row Source Operation---------- ---------- ---------- ---------------------------------------------------
1 1 1 SORT AGGREGATE (cr=28583 pr=14286 pw=0 time=2424726 us)1000000 1000000 1000000 TABLE ACCESS FULL TEST1M (cr=28583 pr=14286
Event waited on Times Max. Wait Total Waited---------------------------------------- Waited ---------- ------------db file sequential read 5732 0.01 0.89db file scattered read 4277 0.00 0.75
16

Scenario#2– Run(A)- WaitsWAIT#140245916217600:nam='db filescatteredread'ela=4834file#=26block#=16002blocks=128WAIT#140245916217600:nam='db filescatteredread'ela=4020file#=26block#=16130blocks=128WAIT#140245916217600:nam='db filescatteredread'ela=2452file#=26block#=16258blocks=128WAIT#140245916217600:nam='db filescatteredread'ela=8712file#=26block#=16386blocks=128WAIT#140245916217600:nam='db filescatteredread'ela=6417file#=26block#=16514blocks=128WAIT#140245916217600:nam='db filescatteredread'ela=2267file#=26block#=16642blocks=128WAIT#140245916217600:nam='db filescatteredread'ela=2637file#=26block#=16770blocks=128WAIT#140245916217600:nam='db filescatteredread'ela=2304file#=26block#=16898blocks=128WAIT#140245916217600:nam='db filescatteredread'ela=1809file#=26block#=17026blocks=128WAIT#140245916217600:nam='db filescatteredread'ela=2661file#=26block#=17154blocks=128
17

Scenario#2– Run(B)- WaitsWAIT#140245916165224:nam='db filesequentialread'ela=124file#=26block#=16002blocks=1WAIT#140245916165224:nam='db filescatteredread'ela=139file#=26block#=16004blocks=2WAIT#140245916165224:nam='db filesequentialread'ela=117file#=26block#=16007blocks=1….<<another38waitshere>>WAIT#140245916165224:nam='db filesequentialread'ela=132file#=26block#=16113blocks=1WAIT#140245916165224:nam='db filesequentialread'ela=123file#=26block#=16116blocks=1WAIT#140245916165224:nam='db filescatteredread'ela=142file#=26block#=16118blocks=2WAIT#140245916165224:nam='db filescatteredread'ela=141file#=26block#=16121blocks=2WAIT#140245916165224:nam='db filescatteredread'ela=135file#=26block#=16124blocks=2WAIT#140245916165224:nam='db filesequentialread'ela=119file#=26block#=16127blocks=1
18

Scenario#2Solution• Buffercachestatus(cold/warm)• (Partof)thedataalreadyinmemory• Reducednumberofphysicalreads(pr)• Numberof(same)waiteventsishigher• Waiteventsdetailshelptrackitdown– Non-contiguousblocksread
• Slowerperformancebecausesmallerreads
19
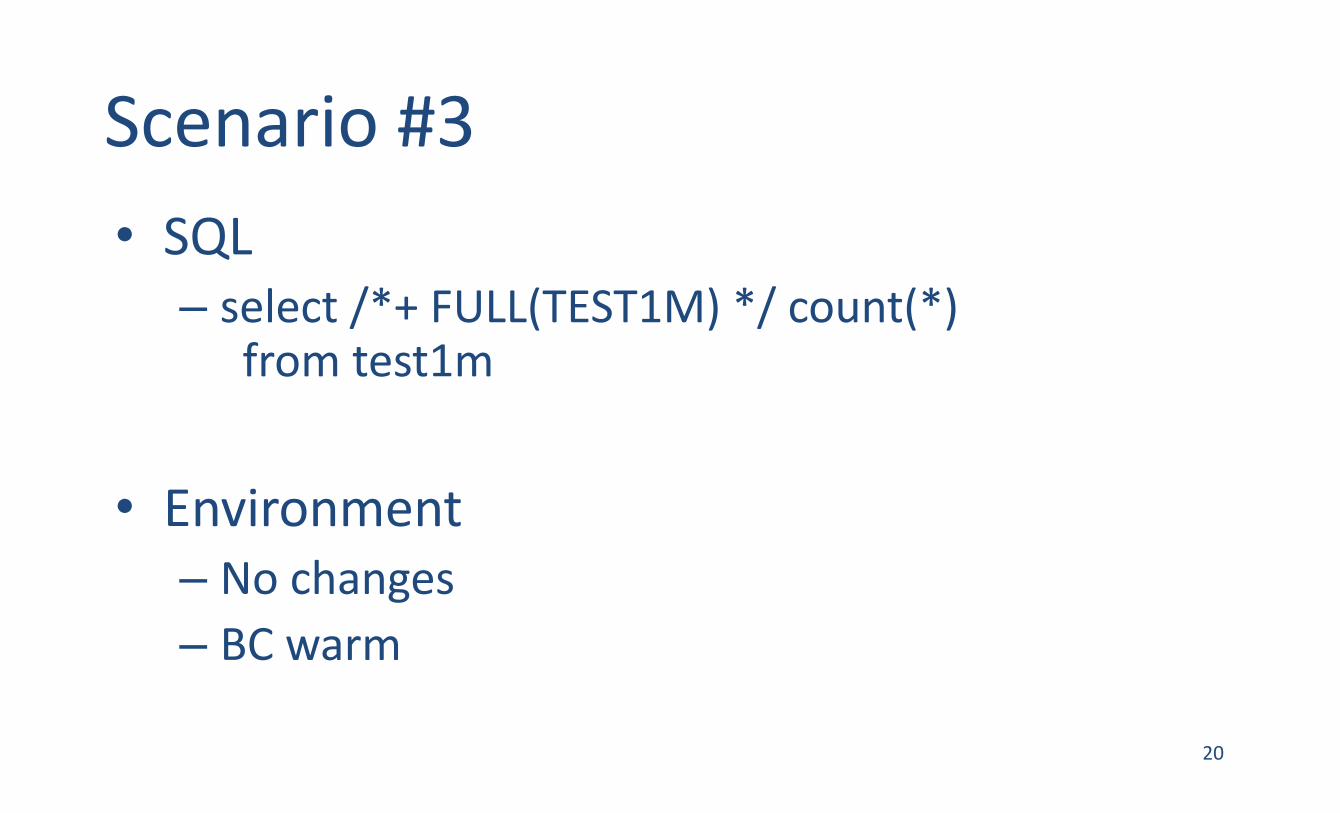
Scenario#3• SQL– select/*+FULL(TEST1M)*/count(*)
fromtest1m
• Environment– Nochanges– BCwarm
20

Scenario#3– Run(A)call count cpu elapsed disk query current rows------- ------ -------- ---------- ---------- ---------- ---------- ----------Parse 1 0.00 0.00 0 0 0 0Execute 1 0.00 0.00 0 0 0 0Fetch 2 0.92 2.96 14286 28583 0 1------- ------ -------- ---------- ---------- ---------- ---------- ----------total 4 0.92 2.96 14286 28583 0 1
Rows (1st) Rows (avg) Rows (max) Row Source Operation---------- ---------- ---------- ---------------------------------------------------
1 1 1 SORT AGGREGATE (cr=28583 pr=14286 pw=0 time=2967930 us)1000000 1000000 1000000 TABLE ACCESS FULL TEST1M (cr=28583 pr=14286
Event waited on Times Max. Wait Total Waited---------------------------------------- Waited ---------- ------------db file sequential read 5732 0.10 1.17db file scattered read 4277 0.28 1.13
21

Scenario#3– Run(B)call count cpu elapsed disk query current rows------- ------ -------- ---------- ---------- ---------- ---------- ----------Parse 1 0.00 0.00 0 0 0 0Execute 1 0.00 0.00 0 0 0 0Fetch 2 0.11 1.01 28573 28575 0 1------- ------ -------- ---------- ---------- ---------- ---------- ----------total 4 0.11 1.02 28573 28575 0 1
Rows (1st) Rows (avg) Rows (max) Row Source Operation---------- ---------- ---------- ---------------------------------------------------
1 1 1 SORT AGGREGATE (cr=28575 pr=28573 pw=0 time=1019952 us)1000000 1000000 1000000 TABLE ACCESS FULL TEST1M (cr=28575 pr=28573
Event waited on Times Max. Wait Total Waited---------------------------------------- Waited ---------- ------------enq: KO - fast object checkpoint 2 0.00 0.00direct path read 179 0.03 0.90
22

Scenario#3– Solution• Bufferedvs DirectPathreads(differentwaitstoo)• (Partof)thedataalreadyinmemory• DirectPath– skipsBufferCacheandreadswholetableeverytime– consistentperformance– numberofwaiteventsisconsistent
• Bufferedvs DirectPathdecisionismadeAFTERplanselection(severalcriteria)
23

Scenario#4• SQL– select/*+FULL(TEST1M)*/count(*)
fromtest1m
• Environment– Nochanges– BCcold
24

Scenario#4– Run(A)call count cpu elapsed disk query current rows------- ------ -------- ---------- ---------- ---------- ---------- ----------Parse 1 0.00 0.01 0 0 0 0Execute 1 0.00 0.00 0 0 0 0Fetch 2 0.57 3.08 15872 15884 1 1------- ------ -------- ---------- ---------- ---------- ---------- ----------total 4 0.57 3.10 15872 15884 1 1
Rows (1st) Rows (avg) Rows (max) Row Source Operation---------- ---------- ---------- ---------------------------------------------------
1 1 1 SORT AGGREGATE (cr=15884 pr=15872 pw=0 time=3086869 us)1000000 1000000 1000000 TABLE ACCESS FULL TEST1M (cr=15884 pr=15872
Event waited on Times Max. Wait Total Waited---------------------------------------- Waited ---------- ------------db file scattered read 2005 0.05 2.53
25
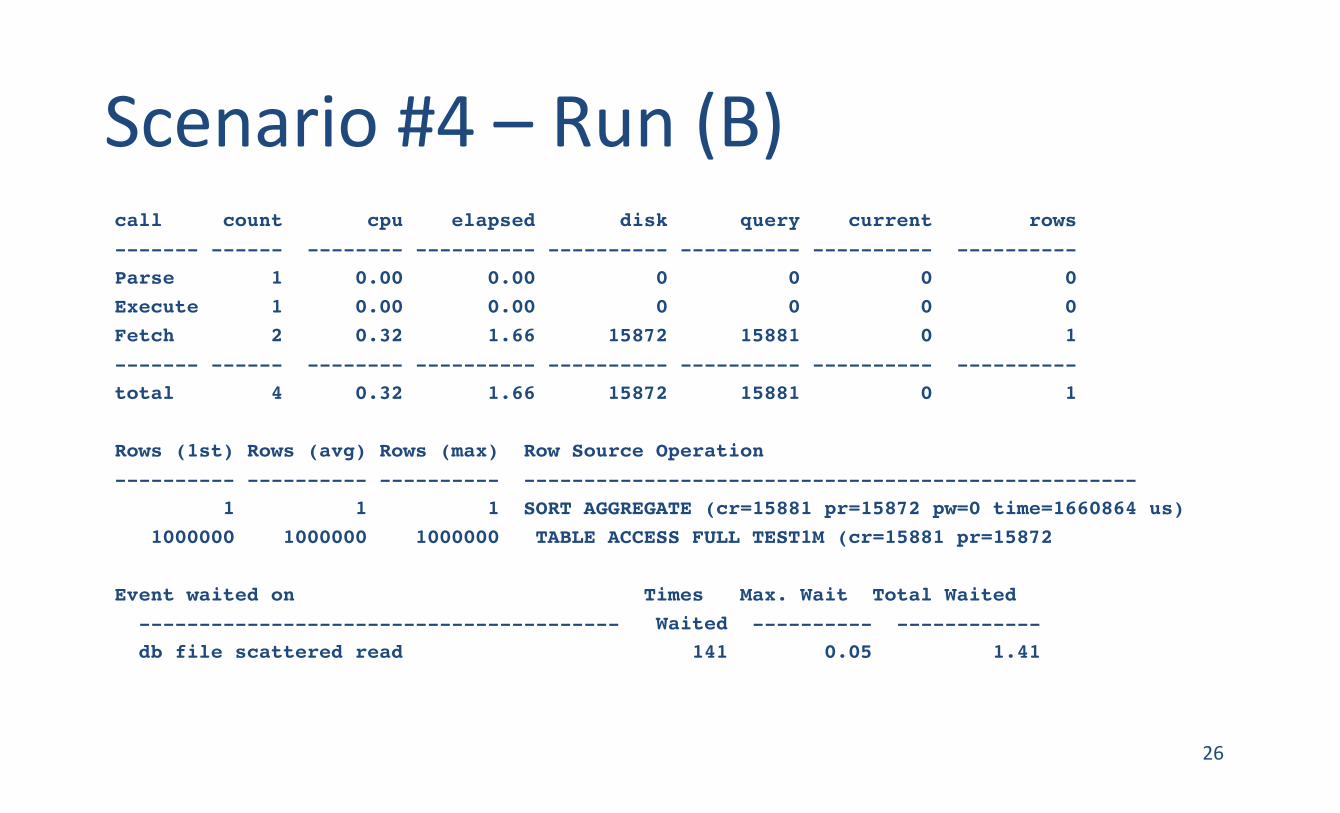
Scenario#4– Run(B)call count cpu elapsed disk query current rows------- ------ -------- ---------- ---------- ---------- ---------- ----------Parse 1 0.00 0.00 0 0 0 0Execute 1 0.00 0.00 0 0 0 0Fetch 2 0.32 1.66 15872 15881 0 1------- ------ -------- ---------- ---------- ---------- ---------- ----------total 4 0.32 1.66 15872 15881 0 1
Rows (1st) Rows (avg) Rows (max) Row Source Operation---------- ---------- ---------- ---------------------------------------------------
1 1 1 SORT AGGREGATE (cr=15881 pr=15872 pw=0 time=1660864 us)1000000 1000000 1000000 TABLE ACCESS FULL TEST1M (cr=15881 pr=15872
Event waited on Times Max. Wait Total Waited---------------------------------------- Waited ---------- ------------db file scattered read 141 0.05 1.41
26
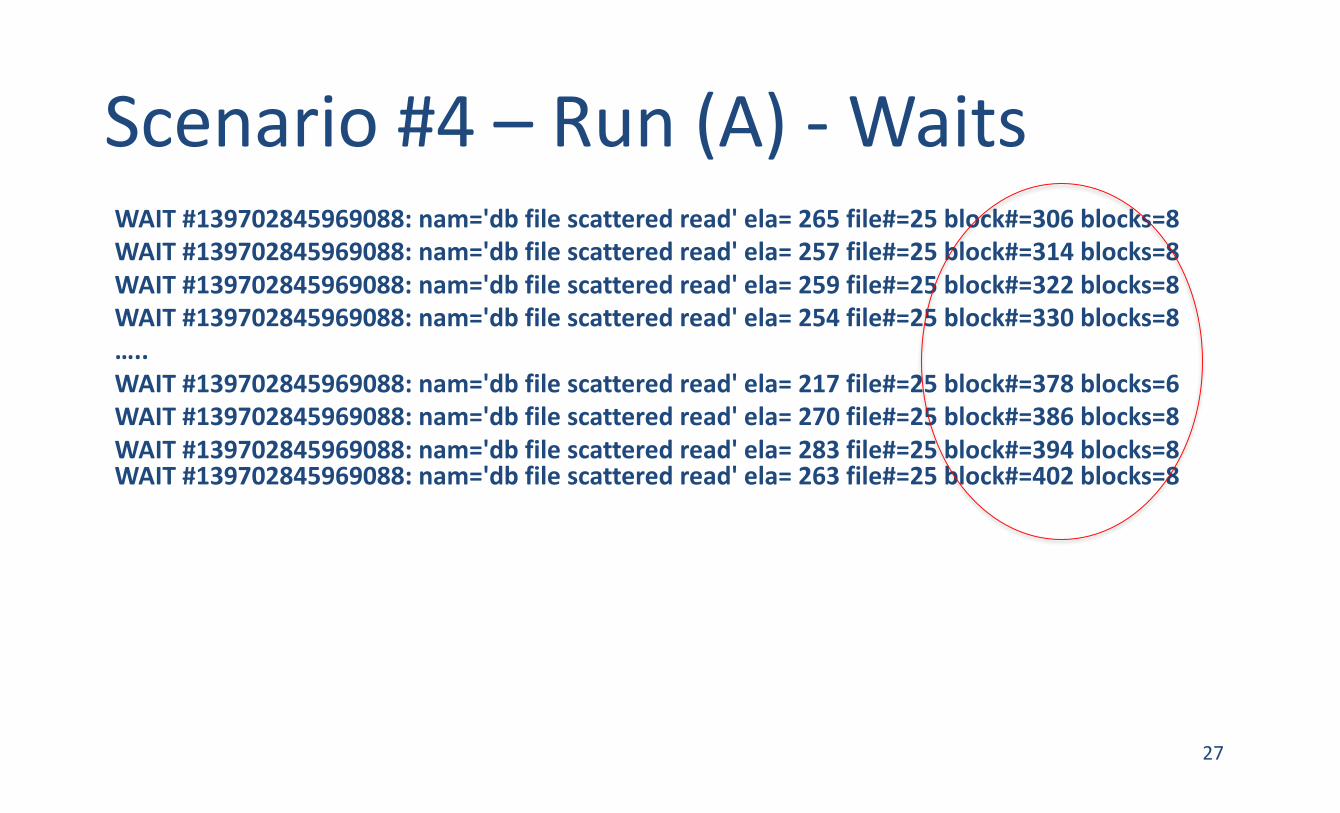
Scenario#4– Run(A)- WaitsWAIT#139702845969088:nam='db filescatteredread'ela=265file#=25block#=306blocks=8WAIT#139702845969088:nam='db filescatteredread'ela=257file#=25block#=314blocks=8WAIT#139702845969088:nam='db filescatteredread'ela=259file#=25block#=322blocks=8WAIT#139702845969088:nam='db filescatteredread'ela=254file#=25block#=330blocks=8…..WAIT#139702845969088:nam='db filescatteredread'ela=217file#=25block#=378blocks=6WAIT#139702845969088:nam='db filescatteredread'ela=270file#=25block#=386blocks=8WAIT#139702845969088:nam='db filescatteredread'ela=283file#=25block#=394blocks=8WAIT#139702845969088:nam='db filescatteredread'ela=263file#=25block#=402blocks=8
27

Scenario#4– Run(B)- WaitsWAIT#139702846026760:nam='db filescatteredread'ela=13508file#=25block#=258blocks=128WAIT#139702846026760:nam='db filescatteredread'ela=9016file#=25block#=386blocks=128
28

Scenario#4– Solution1• Differentdb_file_multiblock_read_count value• Samenumberofblocksreadfromdisk• Numberof(same)waiteventsishigher• Waiteventsdetailshelptrackitdown– Contiguousblocksread
• Slowerperformancebecausesmallerreads
29
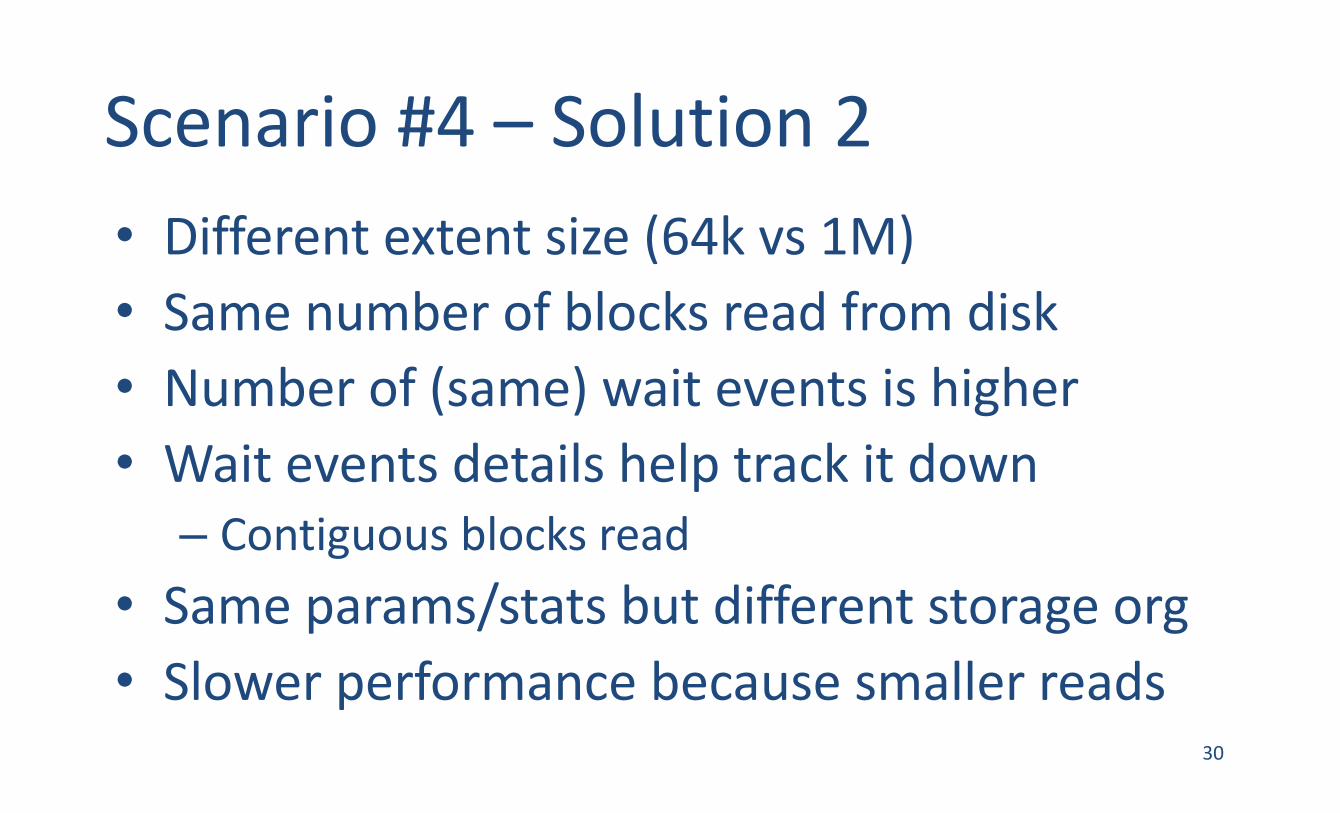
Scenario#4– Solution2• Differentextentsize(64kvs 1M)• Samenumberofblocksreadfromdisk• Numberof(same)waiteventsishigher• Waiteventsdetailshelptrackitdown– Contiguousblocksread
• Sameparams/statsbutdifferentstorageorg• Slowerperformancebecausesmallerreads
30

Scenario#5• SQL– select/*+FULL(TEST1M)*/count(*)
fromtest1m
• Env changes– Nochanges– BCcold,MBRCandextentareidentical
31

Scenario#5– Run(A)call count cpu elapsed disk query current rows------- ------ -------- ---------- ---------- ---------- ---------- ----------Parse 1 0.00 0.00 0 0 0 0Execute 1 0.00 0.00 0 0 0 0Fetch 2 0.26 0.72 14285 14297 1 1------- ------ -------- ---------- ---------- ---------- ---------- ----------total 4 0.27 0.72 14285 14297 1 1
Rows (1st) Rows (avg) Rows (max) Row Source Operation---------- ---------- ---------- ---------------------------------------------------
1 1 1 SORT AGGREGATE (cr=14297 pr=14285 pw=0 time=723883 us)1000000 1000000 1000000 TABLE ACCESS FULL TEST1M (cr=14297 pr=14285
Event waited on Times Max. Wait Total Waited---------------------------------------- Waited ---------- ------------db file scattered read 128 0.04 0.51
32

Scenario#5– Run(B)call count cpu elapsed disk query current rows------- ------ -------- ---------- ---------- ---------- ---------- ----------Parse 1 0.00 0.00 0 0 0 0Execute 1 0.00 0.00 0 0 0 0Fetch 2 0.44 1.29 28574 28586 1 1------- ------ -------- ---------- ---------- ---------- ---------- ----------total 4 0.44 1.29 28574 28586 1 1
Rows (1st) Rows (avg) Rows (max) Row Source Operation---------- ---------- ---------- ---------------------------------------------------
1 1 1 SORT AGGREGATE (cr=28586 pr=28574 pw=0 time=1291333 us)1000000 1000000 1000000 TABLE ACCESS FULL TEST1M (cr=28586 pr=28574
Event waited on Times Max. Wait Total Waited---------------------------------------- Waited ---------- ------------db file scattered read 240 0.04 0.95
33
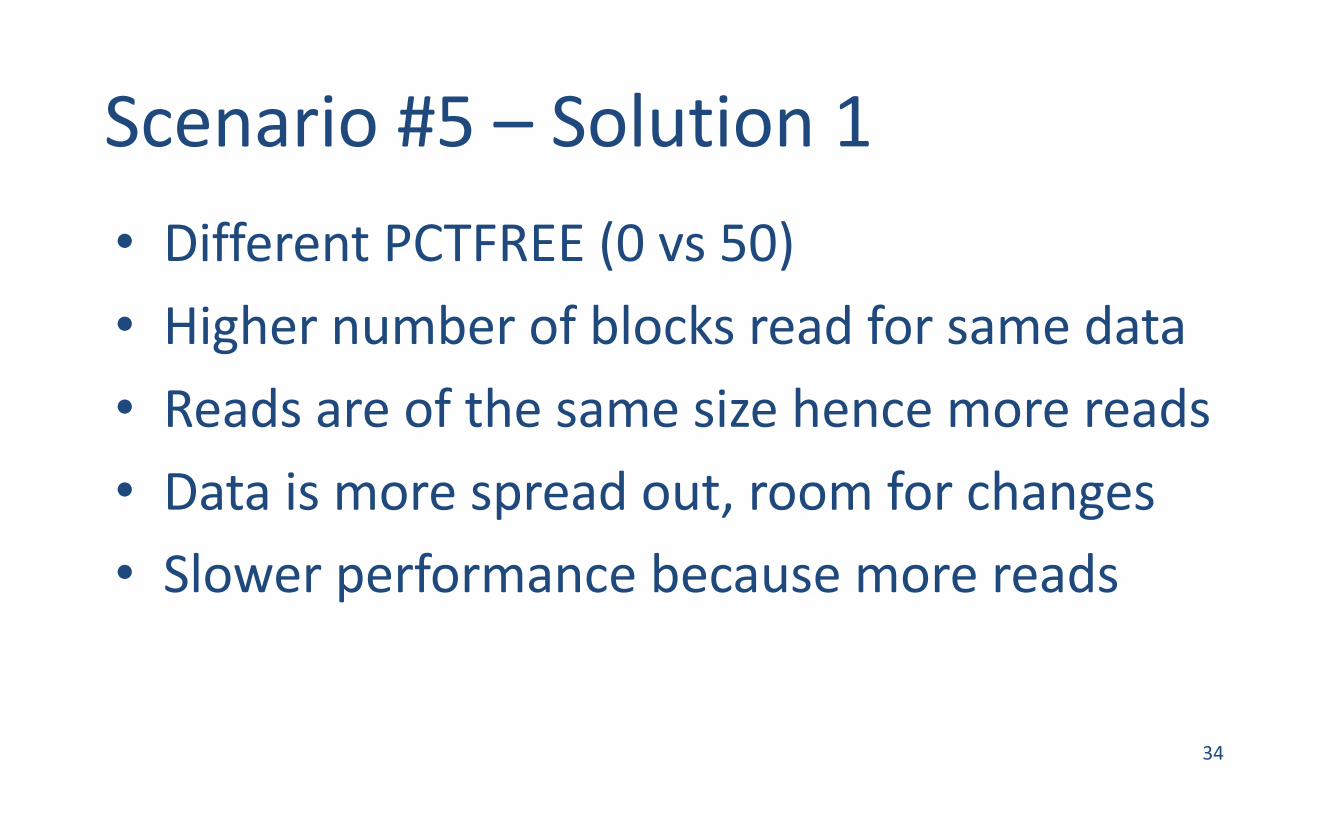
Scenario#5– Solution1• DifferentPCTFREE(0vs 50)• Highernumberofblocksreadforsamedata• Readsareofthesamesizehencemorereads• Dataismorespreadout,roomforchanges• Slowerperformancebecausemorereads
34

Scenario#5– Solution2• EmptyblocksbelowHWM• Highernumberofblocksreadforsamedata• Readsareofthesamesizehencemorereads• Datahasbeendeleted,FTSreadseverything• Slowerperformancebecausemorereads
35

Scenario#6• SQL– select/*+FULL(TEST1M)*/count(*)
fromtest1m
• Env changes– Nochanges– BCcold,MBRC,PCTFREEandextentareidentical
36

Scenario#6– Run(A)call count cpu elapsed disk query current rows------- ------ -------- ---------- ---------- ---------- ---------- ----------Parse 1 0.00 0.00 0 0 0 0Execute 1 0.00 0.00 0 0 0 0Fetch 2 0.44 1.29 28574 28586 1 1------- ------ -------- ---------- ---------- ---------- ---------- ----------total 4 0.44 1.29 28574 28586 1 1
Rows (1st) Rows (avg) Rows (max) Row Source Operation---------- ---------- ---------- ---------------------------------------------------
1 1 1 SORT AGGREGATE (cr=28586 pr=28574 pw=0 time=1291333 us)1000000 1000000 1000000 TABLE ACCESS FULL TEST1M (cr=28586 pr=28574
Event waited on Times Max. Wait Total Waited---------------------------------------- Waited ---------- ------------db file scattered read 240 0.04 0.95
37
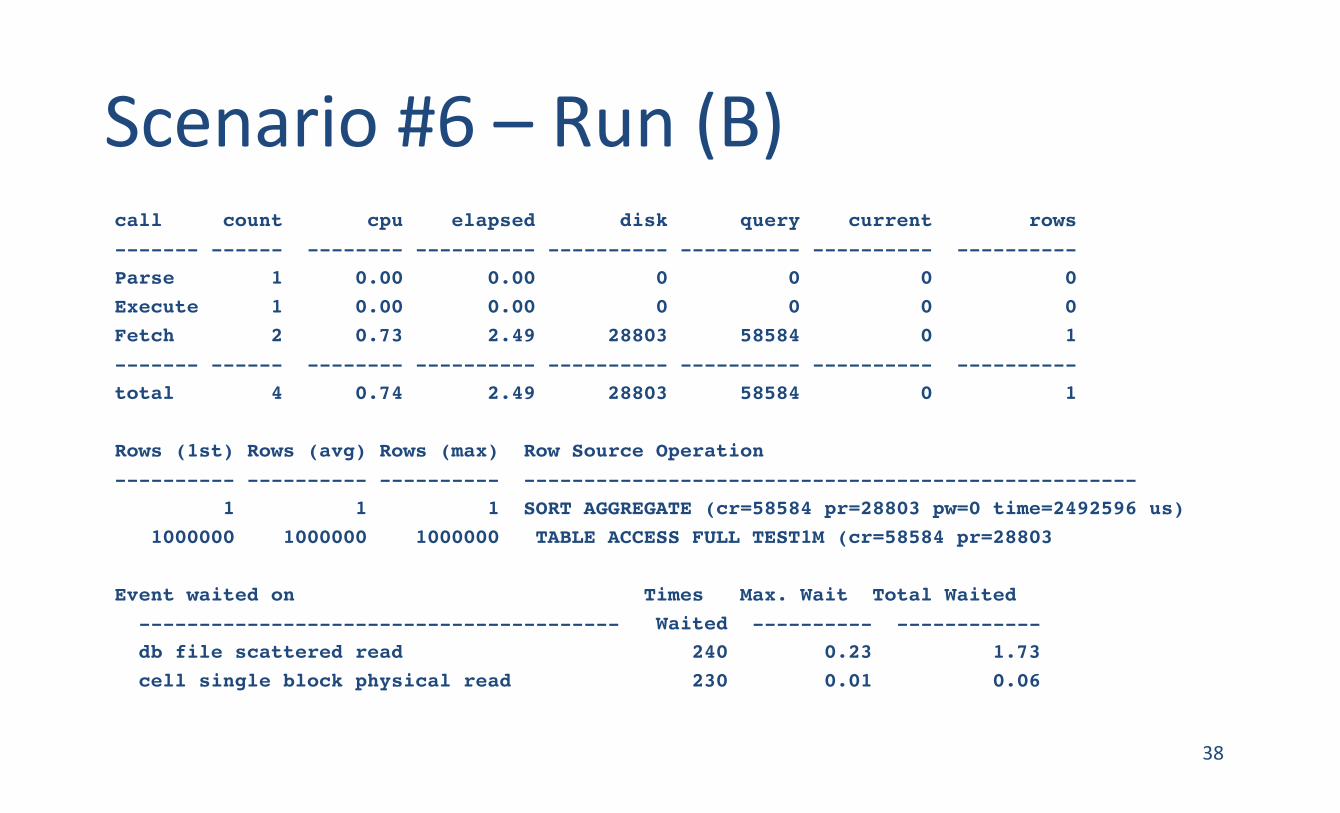
Scenario#6– Run(B)call count cpu elapsed disk query current rows------- ------ -------- ---------- ---------- ---------- ---------- ----------Parse 1 0.00 0.00 0 0 0 0Execute 1 0.00 0.00 0 0 0 0Fetch 2 0.73 2.49 28803 58584 0 1------- ------ -------- ---------- ---------- ---------- ---------- ----------total 4 0.74 2.49 28803 58584 0 1
Rows (1st) Rows (avg) Rows (max) Row Source Operation---------- ---------- ---------- ---------------------------------------------------
1 1 1 SORT AGGREGATE (cr=58584 pr=28803 pw=0 time=2492596 us)1000000 1000000 1000000 TABLE ACCESS FULL TEST1M (cr=58584 pr=28803
Event waited on Times Max. Wait Total Waited---------------------------------------- Waited ---------- ------------db file scattered read 240 0.23 1.73cell single block physical read 230 0.01 0.06
38

Scenario#6– WaitsandSesStats• Waiteventsshow
– singleblockreadsfromUNDOtbs forobj#=0WAIT#140029131327704:nam='db filescatteredread'ela=15412file#=26block#=15618blocks=128obj#=74828WAIT#140029131327704:nam='cellsingleblockphysicalread'ela=220…bytes=8192obj#=0WAIT#140029131327704:nam='db filescatteredread'ela=11786file#=26block#=15746blocks=128obj#=74828WAIT#140029131327704:nam='cellsingleblockphysicalread'ela=233…bytes=8192obj#=0WAIT#140029131327704:nam='db filescatteredread'ela=5938file#=26block#=15874blocks=128obj#=74828WAIT#140029131327704:nam='cellsingleblockphysicalread'ela=224…bytes=8192obj#=0WAIT#140029131327704:nam='db filescatteredread'ela=12162file#=26block#=16002blocks=128obj#=74828
• v$sesstat showshigh– datablocksconsistentreads- undorecordsapplied
39

Scenario#6 - Solution• Differentconcurrency/workload• Highernumberofblocksreadforsamedata• Waits->readsfromUNDOtbs• SesStats ->UNDOrecordsapplied• Slowerperformancebecausemorereads+moreworktorecreatethecorrectimage
40

Scenario#7• SQL– select/*1strun*/n1,c1
fromtest1mwheren1in(1,1000,5000)
• Env changes– IndexonTEST1M(N1)– BCcold,MBRC,PCTFREEandextentareidentical– NoconcurrencyatthetimeSQLisexecuted
41

Scenario#7– Whysomanycr/pr?call count cpu elapsed disk query current rows------- ------ -------- ---------- ---------- ---------- ---------- ----------Parse 1 0.00 0.00 0 0 0 0Execute 1 0.00 0.00 0 0 0 0Fetch 2 0.00 0.75 11 18 0 3------- ------ -------- ---------- ---------- ---------- ---------- ----------total 4 0.00 0.75 11 18 0 3
Rows (1st) Rows (avg) Rows (max) Row Source Operation---------- ---------- ---------- ---------------------------------------------------
3 3 3 INLIST ITERATOR (cr=18 pr=11 pw=0 time=235681 us)3 3 3 TABLE ACCESS BY INDEX ROWID TEST1M (cr=18 pr=113 3 3 INDEX RANGE SCAN TEST1M_IDX (cr=9 pr=5 pw=0
Event waited on Times Max. Wait Total Waited---------------------------------------- Waited ---------- ------------
db file sequential read 11 0.18 0.52
42

Scenario#7– WaitsandSesStats• Waiteventsshow– singleblockreadsfromdatatbs,sameobj#
WAIT#140…:nam='db filesequentialread'ela=7414file#=26block#=2356blocks=1obj#=75022WAIT#140…:nam='db filesequentialread'ela=41395file#=26block#=131blocks=1obj#=74828WAIT#140…:nam='db filesequentialread'ela=181594file#=26block#=78403blocks=1obj#=74828
• v$sesstat showshigh– tablefetchcontinuedrow
43

Scenario#7- Solution• Rowmigration,indexpointstooriginalrowid• Highernumberofblocksreadforsamedata• Waits->readsarefromdatatbs• SesStats ->tablefetchcontinuedrow• Slowerperformancebecausemorereads+moreworktofindalltherowpieces
• Similarbehaviorhappenswithchainedrows44
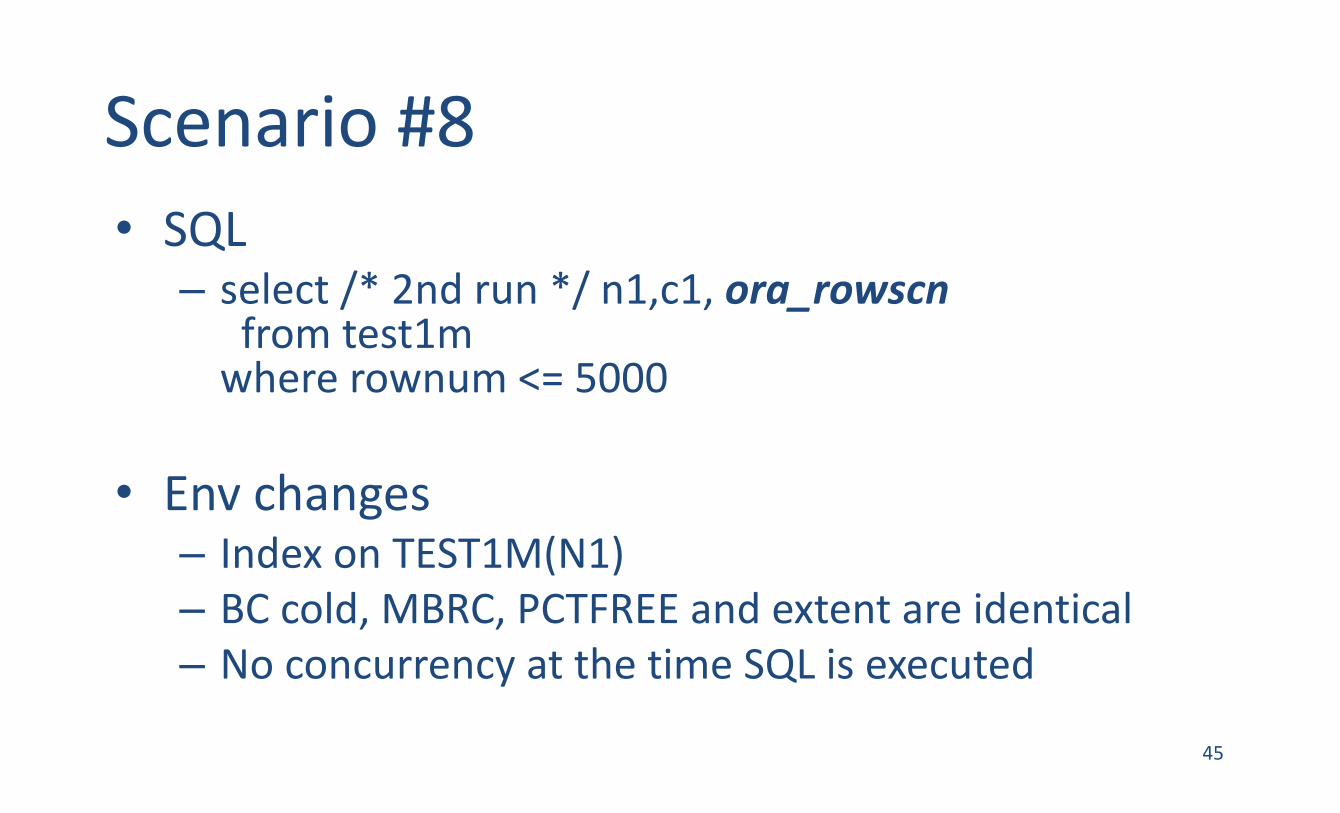
Scenario#8• SQL– select/*2ndrun*/n1,c1,ora_rowscn
fromtest1mwhererownum <=5000
• Env changes– IndexonTEST1M(N1)– BCcold,MBRC,PCTFREEandextentareidentical– NoconcurrencyatthetimeSQLisexecuted
45
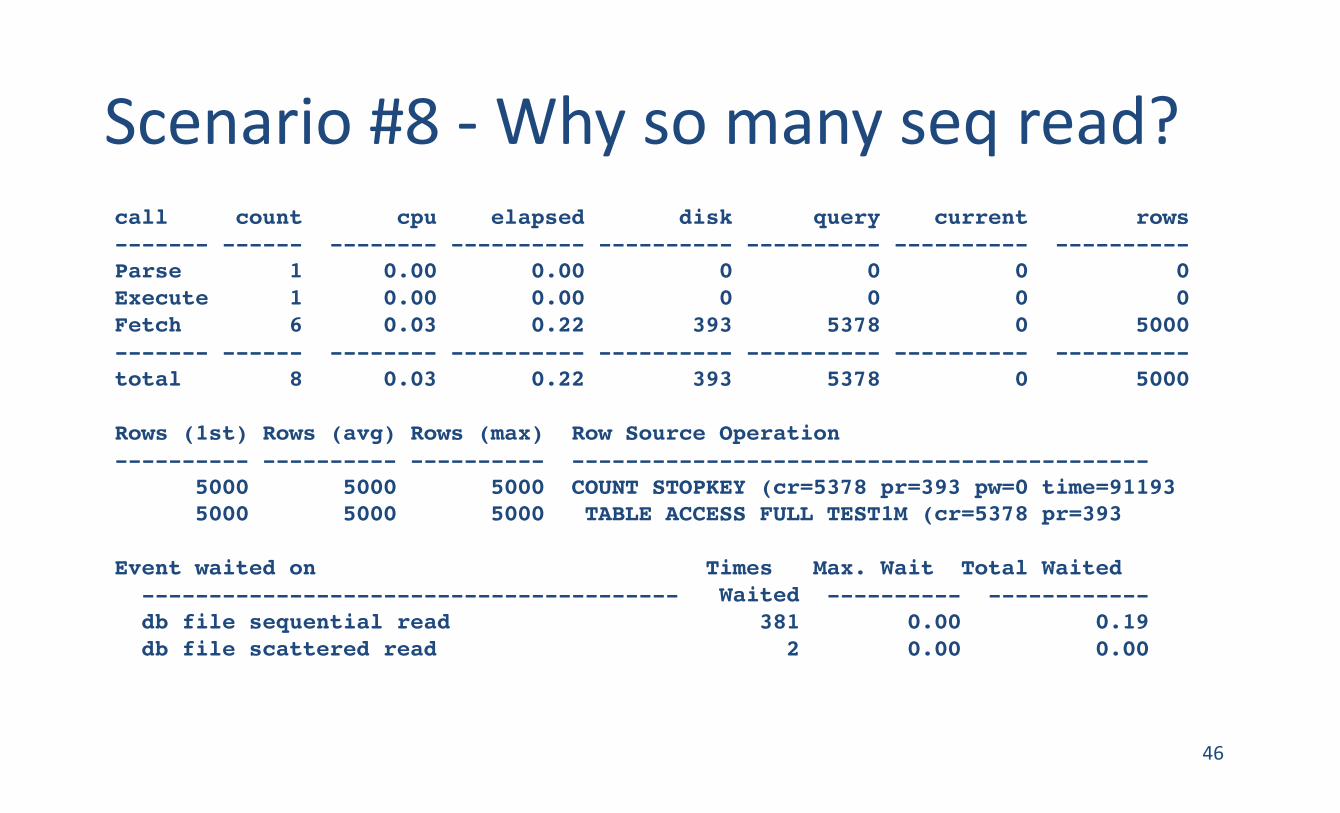
Scenario#8- Whysomanyseq read?call count cpu elapsed disk query current rows------- ------ -------- ---------- ---------- ---------- ---------- ----------Parse 1 0.00 0.00 0 0 0 0Execute 1 0.00 0.00 0 0 0 0Fetch 6 0.03 0.22 393 5378 0 5000------- ------ -------- ---------- ---------- ---------- ---------- ----------total 8 0.03 0.22 393 5378 0 5000
Rows (1st) Rows (avg) Rows (max) Row Source Operation---------- ---------- ---------- -------------------------------------------
5000 5000 5000 COUNT STOPKEY (cr=5378 pr=393 pw=0 time=911935000 5000 5000 TABLE ACCESS FULL TEST1M (cr=5378 pr=393
Event waited on Times Max. Wait Total Waited---------------------------------------- Waited ---------- ------------db file sequential read 381 0.00 0.19db file scattered read 2 0.00 0.00
46
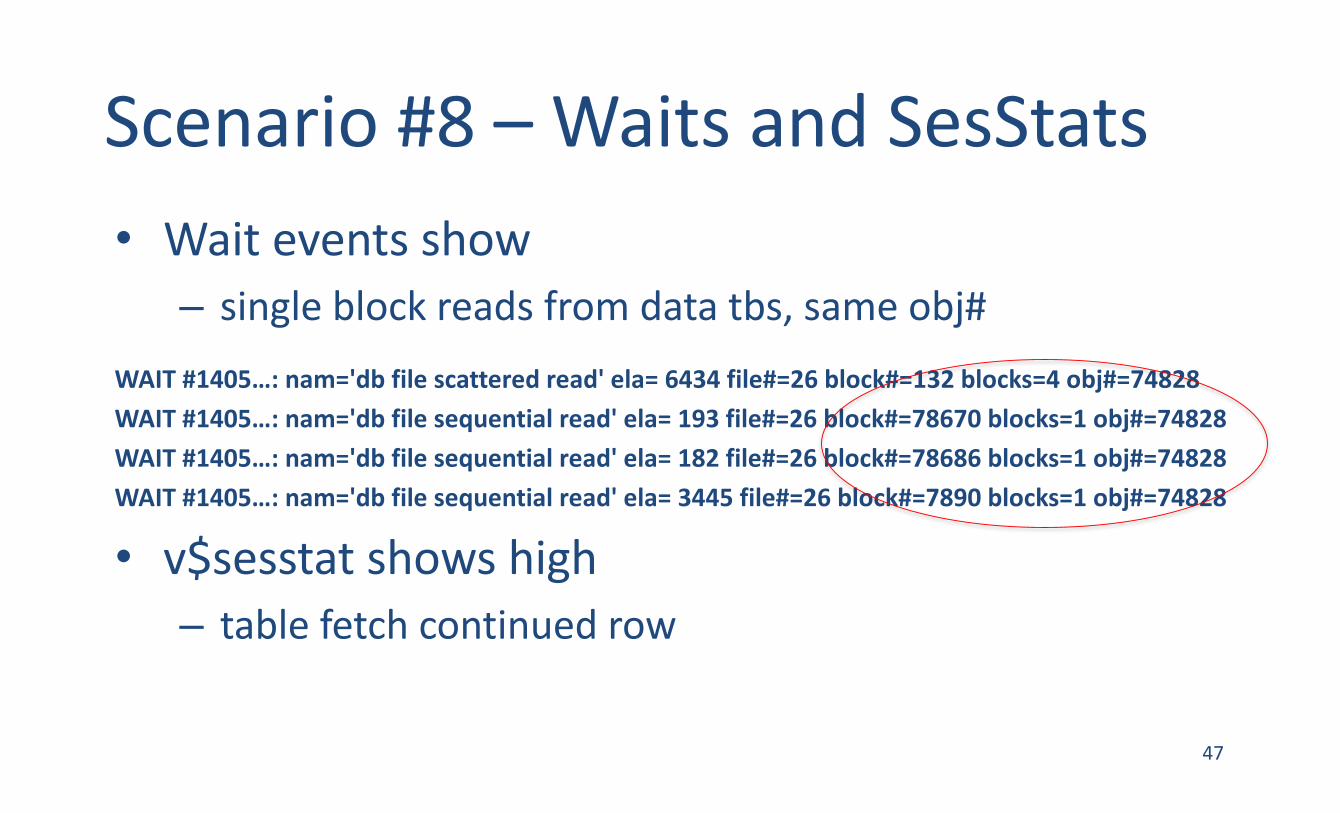
Scenario#8– WaitsandSesStats• Waiteventsshow– singleblockreadsfromdatatbs,sameobj#
WAIT#1405…:nam='db filescatteredread'ela=6434file#=26block#=132blocks=4obj#=74828WAIT#1405…:nam='db filesequentialread'ela=193file#=26block#=78670blocks=1obj#=74828WAIT#1405…:nam='db filesequentialread'ela=182file#=26block#=78686blocks=1obj#=74828WAIT#1405…:nam='db filesequentialread'ela=3445file#=26block#=7890blocks=1obj#=74828
• v$sesstat showshigh– tablefetchcontinuedrow
47

Scenario#8- Solution• Rowmigration,pseudocolneedsrowheader• Highernumberofblocksreadforsamedata• Waits->readsarefromdatatbs• SesStats ->tablefetchcontinuedrow• Slowerperformancebecausemorereads+moreworktofindalltherowpieces
• Similarbehaviorhappenswithchainedrows48
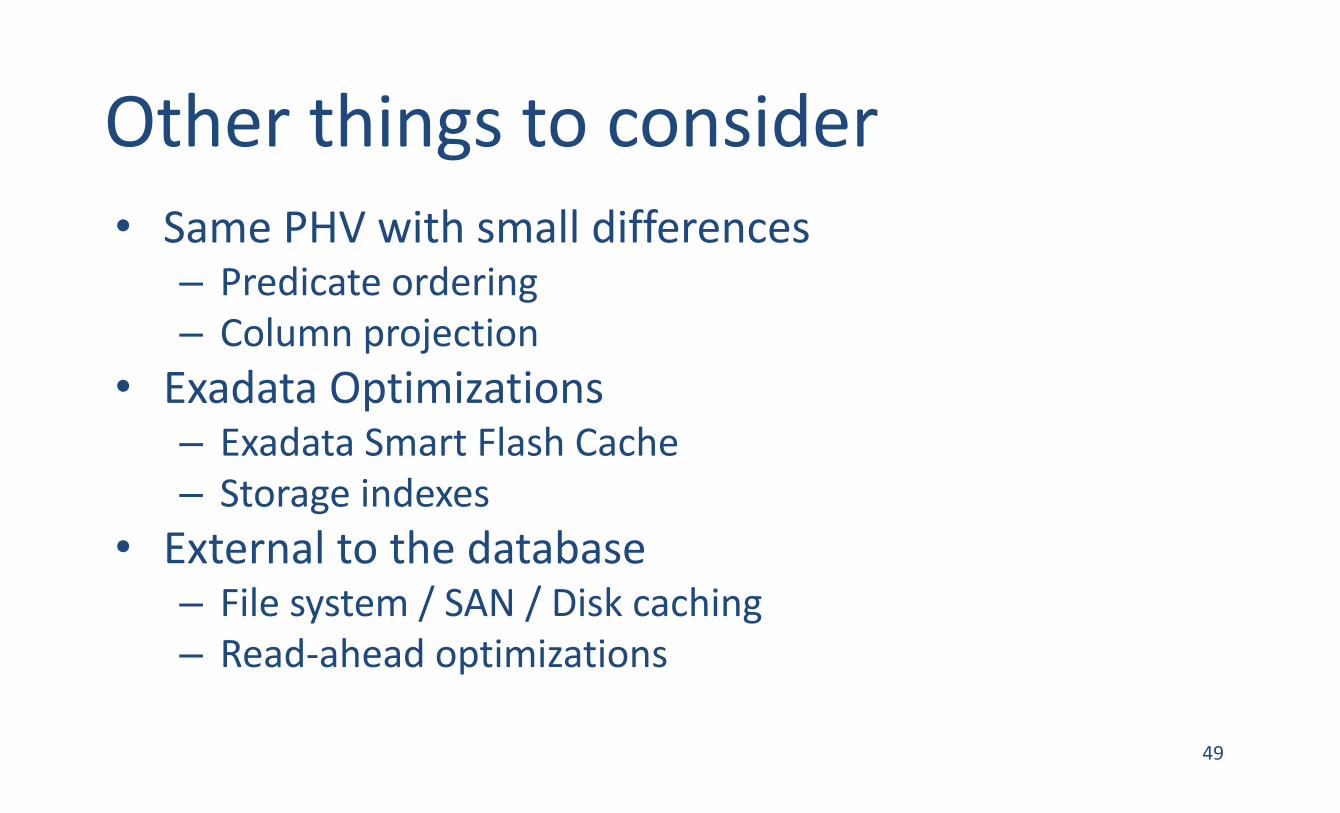
Otherthingstoconsider• SamePHVwithsmalldifferences
– Predicateordering– Columnprojection
• Exadata Optimizations– Exadata SmartFlashCache– Storageindexes
• Externaltothedatabase– Filesystem/SAN/Diskcaching– Read-aheadoptimizations
49

Conclusions• Sameplancanstillrundifferently• Storageorganizationandconcurrencyimpact• Fixonescenariocanintroduceanother,ie.– lowPCTFREEhigherchanceofrowmigration– highcachingslowsdownbufferedmreads
• Findabalancetoachieveoptimalperformance
50

51

References• 'DB_FILE_MULTIBLOCK_READ_COUNT'ANDEXTENTSMANAGEMENT(DocID181272.1)
• Higher'directpathread'Waitsin11gwhenComparedto10g(DocID793845.1)
• WhyIsMyQuerySometimesSlowerThanOtherTimeswithHigherConsistentGetsAlthoughNoChangeinExecutionPlan?(DocID1558349.1)
• RowChainingandRowMigration(DocID122020.1)
52

ContactInformation• http://mauro-pagano.com– Email• [email protected]
– Download• SQLd360vYYMM (date)
– Pages• SQLd360
53