SAM PuttLab 2008 Operating Manual - Science & Motion Golf
133
SAM PuttLab Operating Manual Version 2008
Transcript of SAM PuttLab 2008 Operating Manual - Science & Motion Golf

SAM PuttLab
Operating Manual
Version 2008

Document reference
Reference The information contained in this document is subject to change without notice. The software described in this document is furnished under a license agreement. The software may be used or copied only in accordance with the terms of the agreement. It is against the law to copy the software on any medium except as specially allowed in the license. No part of this document may be reproduced or transmitted in any form or by any means, electronical or mechanical, for any purpose, without the express written permission of the authors. SAM – PuttLab Version 2008Operating Manual [05/08/2008] Copyright © 2008 Science&Motion Sports GmbH All rights reserved Email: [email protected]: www.scienceandmotion.com Trademark Notices
• "Microsoft" and "Windows" are registered trademarks of Microsoft Corporation in the U.S. and other countries.
• All other trademarks and registered trademarks appearing in the "Quick Installation Guide" and "Operating Manual" are the property of their respective owners.

Table of contents
Page 3
Table of contents
Table of contents ............................................................................................................................................. 3
1 INTRODUCTION AND SET-UP .......................................................................................6
1.1 Welcome..................................................................................................................................................... 6
1.2 A Word from the Inventor ......................................................................................................................... 7
1.3 General operation conditions................................................................................................................... 8 1.3.1 Environment requirements.................................................................................................................... 8 1.3.2 Optimum length of putts........................................................................................................................ 8
1.4 Functionality of SAM PuttLab .................................................................................................................. 9
1.5 Package Components ............................................................................................................................. 10
1.6 Soft- and Hardware Requirements......................................................................................................... 11
1.7 Safety Warnings....................................................................................................................................... 12
1.8 Transport and Storage ............................................................................................................................ 14
1.9 Hardware and Software Installation....................................................................................................... 15
2 WHAT'S NEW IN PUTTLAB 2008 .................................................................................16
2.1 Video module ........................................................................................................................................... 16
2.2 Media File Attachment ............................................................................................................................ 17
2.3 Predefined Putting Sessions.................................................................................................................. 17
2.4 Audio Feedback module in training mode............................................................................................ 18
2.5 Individual report logos............................................................................................................................ 18
2.6 Direct emailing of PDF reports............................................................................................................... 19
2.7 Putter Selection module ......................................................................................................................... 19
2.8 Improved report graphics and parameters ........................................................................................... 20
2.9 Usage of multiple PuttLab systems with one software installation ................................................... 23
2.10 Improved data import / export functions ............................................................................................ 23
3 FIRST STEPS WITH YOUR SAM PUTTLAB.................................................................24
3.1 Start the SAM PuttLab software............................................................................................................. 24 3.1.1 Enter the Serial Key ............................................................................................................................ 24 3.1.2 SAM PuttLab Wizard........................................................................................................................... 26
3.2 Quick Overview of Project and Player Management............................................................................ 27
Table of contents
Page 4
3.3 Check System Functionality................................................................................................................... 28
3.4 First Measurement................................................................................................................................... 29
3.5 Open a Result Report.............................................................................................................................. 30
4 USING THE SAM PUTTLAB SOFTWARE ....................................................................31
4.1 The Main Screen ...................................................................................................................................... 31 4.1.1 Organization of the Main Screen ........................................................................................................ 31 4.1.2 Toolbar ................................................................................................................................................ 32 4.1.3 "Data Selection" Bar ........................................................................................................................... 33 4.1.4 Main Menu Items ................................................................................................................................ 35
4.2 Registration.............................................................................................................................................. 39 4.2.1 Overview ............................................................................................................................................. 39 4.2.2 Manage your registrations .................................................................................................................. 40
4.3 Program Settings..................................................................................................................................... 42 4.3.1 Measurement / Calibration settings .................................................................................................... 42 4.3.2 Report Email Settings ......................................................................................................................... 43 4.3.3 Video Settings..................................................................................................................................... 44
4.4 Calibration ................................................................................................................................................ 46 4.4.1 General Information ............................................................................................................................ 46 4.4.2 Steps before every calibration ............................................................................................................ 46 4.4.3 Countdown Calibration........................................................................................................................ 48 4.4.4 Direct Calibration ................................................................................................................................ 48 4.4.5 Calibration by moving the Club........................................................................................................... 49
4.5 Measurement............................................................................................................................................ 50 4.5.1 Start of a Measurement session ........................................................................................................ 50 4.5.2 Measurement screen toolbar .............................................................................................................. 53
4.6 Training..................................................................................................................................................... 54 4.6.1 Start of a Training session ................................................................................................................. 54 4.6.2 Training screen toolbar commands .................................................................................................... 57 4.6.3 Audio Feedback .................................................................................................................................. 58
4.7 Manual Recording.................................................................................................................................... 61
4.8 Predefined Putting Sessions.................................................................................................................. 63 4.8.1 Session overview: ............................................................................................................................... 63 4.8.2 How to run a predefined PuttLab Session .......................................................................................... 64
4.9 Video ......................................................................................................................................................... 66 4.9.1 Overview ............................................................................................................................................. 66 4.9.2 Setup your video camera .................................................................................................................... 66 4.9.3 The video main screen........................................................................................................................ 70 4.9.4 Video recording settings ..................................................................................................................... 75
4.10 Viewing the Results............................................................................................................................... 76 4.10.1 Print Report view............................................................................................................................... 76 4.10.2 Direct Report emailing ...................................................................................................................... 78 4.10.3 Screen Report view........................................................................................................................... 79 4.10.4 Competence Profile Reports............................................................................................................. 81 4.10.5 Individual report logos....................................................................................................................... 82
4.11 Games..................................................................................................................................................... 85 4.11.1 Game Settings .................................................................................................................................. 86

Table of contents
Page 5
4.11.2 Games description ............................................................................................................................ 87
4.12 3D Putt Replay ....................................................................................................................................... 89 4.12.1 General overview .............................................................................................................................. 89 4.12.2 Functional description ....................................................................................................................... 91
4.13 Data management.................................................................................................................................. 93 4.13.1 How to set up the data management in a practical way ................................................................... 93 4.13.2 Media file attachments ...................................................................................................................... 94 4.13.3 Project management......................................................................................................................... 96 4.13.4 Player management.......................................................................................................................... 99 4.13.5 Session management ..................................................................................................................... 102 4.13.6 Export result records....................................................................................................................... 104 4.13.7 Import result records ....................................................................................................................... 107
4.14 Keyboard-Shortcuts ............................................................................................................................ 109
5 SAM PUTTLAB PRO FEATURES ...............................................................................110
5.1 Head and Wrist Measurement......................................................................................................... 110 5.1.1 Wrist measurement........................................................................................................................... 111 5.1.2 Head measurement ...................................................................................................................... 113 5.1.3 Measurement and Training with HEAD or WRIST sensor................................................................ 116 5.1.4 WRIST measurement reports ........................................................................................................... 117 5.1.5 HEAD measurement reports............................................................................................................. 118
5.2 Extended data analysis functions........................................................................................................ 119 5.2.1 The data edit window ........................................................................................................................ 119 5.2.2 The four plot window......................................................................................................................... 122 5.2.3 Stroke statistics................................................................................................................................. 125 5.2.4 Stroke parameter .............................................................................................................................. 125 5.2.5 Player statistics ................................................................................................................................. 125 5.2.6 List of data values ............................................................................................................................. 127 5.2.7 The data viewer window ................................................................................................................... 129
A. TECHNICAL TROUBLESHOOTING......................................................................130
B. TECHNICAL DATA ................................................................................................131
C. FAQ ........................................................................................................................132
Welcome
Page 6
1 Introduction and Set-Up 1.1 Welcome Welcome to the Operating Manual of "SAM PuttLab"! First, we want to thank you for purchasing our product. Motion researchers and golf professionals joined forces to develop the first computer-aided analysis of the short game. With the "SAM PuttLab" you have the chance to measure no fewer than 28 parameters of the putting stroke, a number most golfers probably were not aware of. It marks a new dimension for the analysis and the practice of the short game. Use this innovative and revolutionary system and gain the decisive advantage in golf practice. You can't wait to improve your short game and want to start immediately? If you want to start immediately, follow our Quick-Start-Guide (you will find it as printout in the case) and then go straight to these chapters in the order listed below. 1.7 Safety warnings 4.3 Settings 4.4 Calibration 4.5 Measurement 4.6 Training

A Word from the Inventor
Page 7
Dear customer, Thank you for purchasing the SAM PuttLab. Following is a brief introduction into the history of the system that will revolutionize the Putt training - the SAM PuttLab. I have been conducting interdisciplinary research in motor behaviour for more than 15 years. Themain goal of our research was to basically understand the process of motor learning and theorganisation of skilled human movements. During this time we developed various innovativesystems to precisely measure and analyse movements. One system turned out to be very suitable for the measurement of three dimensional movements in space – the ultrasound measurement system. In the course of our research, my team and I also gained extensive experience in a range ofdifferent sports. We discovered that the most important factor for efficient learning in sports is adequate feedback. Lack of feedback is the reason why putting, in terms of movement complexity,is considered to be the easyiest part of the golf game, but the most difficult part to learn. To closethis gap, we developed the SAM PuttLab, a system to precisely measure all aspects of your puttingstroke, and to give you an instant feedback of your individual movement performance. The SAM PuttLab is the most comprehensive putt training tool ever developed, extremely accurate and easy to use. The software is customized to exactly fit these needs. Training with the PuttLabwill substantially improve your short game after only a few lessons. We have been testing thesystem extensively on all different levels of players, from amateurs up to the very best PGA Tour players, and they all loved the system. At this point I would like to emphasize that the feedback ofthese PGA Pros has been greatly appreciated and helped us optimize this tool even further. I am confident, that the SAM PuttLab will meet your expectations and assist you in optimizing yourshort game in the most efficient way. Best regards, Dr. Christian Marquardt
1.2 A Word from the Inventor

General operation conditions
Page 8
1.3 General operation conditions 1.3.1 Environment requirements The system can be operated indoors and outdoors without problems. Some conditions have to be fulfilled for optimum quality of the recorded stroke data: 1. General Check if the area around the Basic Unit in a range of 2 meters (6.5 feet) is not occupied by other objects (like chairs, boxes, etc.). This can lead to interferences of the ultrasonic signals and may reduce the quality of the recordings. 2. Indoors Choose a place for the recordings whith a maximum distance to walls or other objects placed on the ground. Generally it could be a problem to do measurements in very small rooms with wall distances of less than 2 or 3 meters (6.5 to 10 feet). 3. Outdoors Protect the system against direct rain, both the Triplet and the Basic Unit are not water resistant. If there is a strong or stormy wind during the recordings this will have impact to the signal quality (noise). Try to find a place where the system is protected from the wind (maybe use a windshield). 1.3.2 Optimum length of putts The automatic stroke recognition, the result data display and the rating of the strokes is optimized for a putt length of 3 to 5 meters (10 to 16 feet) on a stimp of 10. It should be no problem to analyse also putt strokes up to 8 meters (25 feet), but due to the higher velocity and acceleration the data curves may go out of the range of the graphs and the benchmark rating may not be very useful to characterize those putts.

Functionality of SAM PuttLab
Page 9
1.4 Functionality of SAM PuttLab The SAM PuttLab comprises a computer-supported system designed for three-dimensional motion analysis. The function of this system is based on the timing of the interval between emission and reception of ultrasonic signals. General Recent technical developments allow the recording of human movements with a high spatial and temporal resolution under low experimental demands. Some very expensive recording systems are based on recording the trace of infrared markers with video cameras. A more refined method is using miniature ultrasonic transmitters, which are attached to the moving object. These transmitters send ultrasonic pulses to the microphones (at least three) of the measuring system in short sequences (typically some milliseconds). The positions of the transmitters are then calculated from time delays of the pulses and stored on the computer. SAM PuttLab can record the positional data, stores it on a computer, reconstructs the movements from the data, and provides an in-depth kinematical analysis. Graphic reports show even smallest details of the individual movement execution. In the feedback training mode, online analysis of the executed movement is performed. The results are displayed as instant feedback on the computer screen. Data registration The positional data of the movements is recorded using the SAM MotionAnalyzer movement registration system. In this measuring system the positions of miniature ultrasonic transmitters are sampled at a maximum frequency of 210 Hz (total for all markers used) at a spatial resolution of about 0.1 mm. Before data analysis the raw positional data is filtered using specially designed filter procedures. Automatic segmentation During data recording a data tracer is automatically identifies single strokes from the data flow. For each identified valid stroke an automatic segmentation is calculated to divide the movement into relevant movement segments. The movement data and the segmentation information are then stored on the computer. Based on the data segmentation up to 28 different movement parameters and their distribution in movement repetition can be analyzed. Analysis SAM PuttWare software includes extensive graphical and statistical tools to analyze the movement data. Single strokes can be easily selected from the recorded data. The movement characteristics can be inspected in different plots. All data values and differences are displayed on the screen and can be saved to a file. Graphic Reports SAM PuttWare provides powerful graphic reports with multiple graphs, texts, and boxes. The high resolution graphical reports allow clear illustration and documentation of the individual movement performance. Graphic reports can be created for screen display or for print out and are available for different performance levels. The reports can also be converted to PDF-format and saved to file. Competence profiles A special software module allows displaying the data in bar charts on uniform scales. The transformation of the parameters to z-values allows a direct comparison of movement performance for different tasks with a group performance, i.e. with a certain handicap group or with PGA professionals. The higher the z-value of a movement parameter is indicated the higher is the deviation of the performance from the mean of the group.

Package Components
Training The SAM feedback module is an extremely powerful training tool. In the training mode each single stroke is analyzed in real time and the results are displayed on the computer screen or projected to the wall using a beamer. This way, you know immediately what was the difference to the last stroke(s) or how close the movement came to the ideal. The progress of the training session is displayed in a bar chart graph. Training reports are available for each relevant movement parameter to be trained separately. Therapy of Yips The SAM MotionAnalyzer allows to separate and to analyze single movement components although the complete movement is rather complex. Thus, preserved movement capabilities might be identified also inside of disturbed movements and can then be explored for tailoring an adequate and effective treatment strategy. In addition, the detailed information given by SAM PuttWare can be used to explain and illustrate specific and inadequate compensation strategies to the golfer. 1.5 Package Components
Triplet Battery Clip Basic Unit
Tripod USB Cable (3m) 2x AA Batteries
Software-CD
Triplet Calibration Sheet
Transport Case
Quick-Start-Guide
Page 10

Soft- and Hardware Requirements
1.6 Soft- and Hardware Requirements Minimum hardware requirements
• Pentium IV with at least 1.5 GHz (or comparable) • 512 MB RAM • CD drive (for installation) • 200 MB free space on your hard drive • Free USB port
Optimum hardware requirements (PC)
• Pentium IV with 2 GHz (or comparable) • 1 GB RAM • CD drive (for installation) • 300 MB free space on your hard drive • Free USB port
Optimum hardware requirements (Notebook)
• Processor with small power consumption like Intel Centrino or comparable, at least 1.5 GHz.
• 1 GB MB RAM (2 GB in case of Windows Vista) • CD drive (for installation) • 200 MB free space on your hard drive • Free USB port
Software requirements Windows XP and Windows Vista are supported by SAM PuttLab.
If your system does not match the minimum hardware requirements you could get slowdowns which negatively affect the quality of the product. Science & Motion Sports takes no responsibility if the system does not work properly under lower hardware and software specifications than listed above.
Page 11

Safety Warnings
1.7 Safety Warnings About locations for usage of SAM PuttLab
• Do not place the equipment near flammable liquids such as alcohol or thinners. If the
internal electrical parts come in contact with flammable liquids, fire or electrical shock may result.
• Do not place the following objects on top of the equipment. If the internal electrical parts come in contact with these objects, fire or electrical shock may result: - metallic objects, such as necklaces - containers with liquid, such as cups, vases, and flower pots If any of these objects or liquids enter the equipment, immediately unplug the USB cable and contact you retailer.
• Do not place the equipment in the following areas. Fire or electrical shock may result: - Areas with high temperatures (higher than 60°) - Areas near flame sources
• Do not place the equipment on shaky stands, unstable surfaces or surfaces subject to frequent vibrations. If the equipment falls, it may cause injuries.
• Do not place heavy objects on the equipment. Objects may fall and cause injuries.
About the Power Supply
• Do not damage, mutilate or modify the USB cable. Do not place heavy objects on, pull or
excessively bend the USB cable. Damaged wires may cause fire or electrical shock.
• Do not twist or tie the USB cable together. Fire or electrical shock may result.
• Always plug the USB cable in all the way. If it is not plugged in completely, fire or electrical shock may result.
Page 12

Safety Warnings
General Handling Precautions
• Do not take apart or modify the equipment. Fire or electrical shock may result from improper handling of its components.
• If you hear unusual noises, see smoke, feel excessive heat or smell anything unusual, immediately unplug the USB cable and contact your retailer. Continued use may result in fires or electrical shock.
• Do not use flammable sprays near this equipment. Also do not spill water, liquids, or flammable liquids on the equipment. If these fluids enter this equipment and contact the electrical parts, fire or electrical shock may result.
• When cleaning the equipment, use a well-wrung, water-moistened cloth. Do not use
flammable liquids, such as alcohol, benzene or thinners. If a flammable liquid enters the inner electrical parts, fire or electrical shock may result.
• Do not use the supplied CD-ROM in regular CD audio players. It may produce excessively loud sound that may cause hearing damage.
• Do not attempt to service the system yourself in any manner other than described in the manual. If the cover is removed you could be exposed to lethal voltages or other hazards.
• Most of the package components are shipped inside plastic bags. These bags can be dangerous. To avoid danger of suffocation, keep the plastic bags away from babies and children.
• The batteries included in this package are not rechargeable. Do not try to recharge them.
Page 13

Transport and Storage
1.8 Transport and Storage
• You can easily take the SAM PuttLab wherever you want within the original case.
• Please insert the parts into the case as they were shipped.
• Clean the system components of dust, dirt, and water sprinkles with a dry cloth before storing.
• When not in use for extended periods of time, remove the batteries from the battery clip.
• Don't store the case in a damp or wet place.
• When not in use for periods over 1 day, such as long weekends unplug the USB cable for safety.
Storage temperatures
Page 14

Hardware and Software Installation
Page 15
1.9 Hardware and Software Installation For setup and installation of hardware and software please use the "Quick Start Guide" document and follow the steps described there. This document covers the following topics:
a) hardware setup b) software and USB driver installation c) software start d) doing first measurement e) system calibration f) usage of FlexTriplet (sensor mounting on the putter)
The "Quick Start Guide" is available as printed brochure for every PuttLab system. If you don't have the "Quick Start Guide" as a printout the document is available as PDF on every installation CD and you also can download the latest version under: www.scienceandmotion.com/downloads

What's new in PuttLab 2008
2 What's new in PuttLab 2008 PuttLab version 2008 includes a lot of new features. The main differences to the previous version 2.0 are listed in this chapter to give a quick overview. All the new features are described in detail in this manual. Just follow the links in this overview to jump to the detailed descriptions. 2.1 Video module PuttLab 2008 includes a Video Module for capturing video clips parallel to the putt recordings. You can use any Windows compatible camera like DV cameras (Firewire) and USB cameras (also Webcams). Also special cameras that come with a WDM Windows driver can be used. The video module includes the following features: • Automatic recording of video clips of all recorded putts (one video per putt will be automatically
captured and saved together with the Puttlab data) • Easy replay of the recorded videos, also directly from the report view • Manual recording and disk storage of video clips • Replay of video clips (AVI, WMV, MPEG) • Saving snapshots as image files out of live video or replay video • Different replay options like slow motion or single Step navigation • Overlay drawing functions for lines, circles and wedges for angle measurement. Works in live
recording and replay mode!
Screenshot of Puttlab 2008 Video Module To learn all the details on the Video Module go to 4.9
Page 16

What's new in PuttLab 2008
2.2 Media File Attachment The "Media File Attachment" feature allows to add and archive any media or document files to your putt data easily. The different types of files will be detected automatically and can be opened just by clicking with the mouse. The files can be: • Video files (avi, wmv, mpeg etc.) • Audio files (wav, mp3) • Pictures (jpg, bmp, etc.) • Documents (pdf, doc, txt) Example how to use the feature: • Easily add text comments or pictures to your training sessions This will be a great help
remembering players and situations when you look up the data later in the future. • Add videos for each putt and also get information on body movement together with the PuttLab
recorded data. Screenshot of "Media Files" section:
Page 17
- Data type is shown by symbols - Open any file by double-clicking - Add files to the list by "drag and drop" - Add as many files as you like for one session
More details on the media file attachments you can find in 4.13.2. 2.3 Predefined Putting Sessions PuttLab 2008 includes eight predefined putting sessions. These sessions cover different usage cases of SAM PuttLab, for example training, analysis, putter selection or putter fitting. The advantage of the sessions is that they guide the user through the process, from data input to the result presentation in the reports. It is also possible to add user specific sessions later to the program, for example a special training with report screens that are not available in the standard program. All the details on the predefined sessions you can find in 4.8.

What's new in PuttLab 2008
2.4 Audio Feedback module in training mode Training now with additional audio feedback. In PuttLab 2008 the result output for the putts can also be an acoustic feedback for the most important training parameters Example: Training parameter is club face alignment at impact. After the putt you either hear:
a) "left" – the club face angle exceeds the given limit to the left b) "right" – the club face angle exceeds the given limit to the right c) "good" - the club face angle is inside the given limit
The sounds (sound files in wav format) and the limits are selectable for each parameter. Advantages:
• training with direct feedback without having to look to a computer screen • training of two parameters in parallel, one with visual feedback, one with acoustic feedback • clear feedback, no distraction by having to read numbers or graphs on the screen
More details on the Audio Feedback module you can find in 4.6.3. 2.5 Individual report logos PuttLab 2008 allows to change the header graphics of the print report easily. Use the PuttLab for your personal advertising or as marketing tool for sponsoring! The left portion of this header can be replaced by any individual logo graphics:
• use your own logo or the club logo • use a company logo for corporate events • add as many logos you like and select one for the actual printout
Examples: All details on the individual report logos you can find in 4.10.5.
Page 18

What's new in PuttLab 2008
2.6 Direct emailing of PDF reports PuttLab 2008 allows to directly send print reports as PDF by email. This feature will use an installed email client software like Outlook or Thunderbird to generate a complete email with the PDF report as attachment. It is even possible to define the email text including the name of the player. All details on the direct report emailing you find in 4.10.2 2.7 Putter Selection module The Putter Selection Module is one of the predefined putting sessions. The ideal tool for selling putters! The putter selection process will automatically ask for all the data needed including data of the putter like loft, shaft angle and lie angle. In the process up to 8 putters can directly being compared and the results will be shown in the new designed "Putter Selection Report":
The report shows all the overview data on the first page and the details on the following pages. So the putter selection process will be very much simplified and the customer gets a high quality printout with all the relevant and easy to understand information. The "Overall Rating" number will directly show the putter with the best over all performance for the actual player!
Page 19
What's new in PuttLab 2008
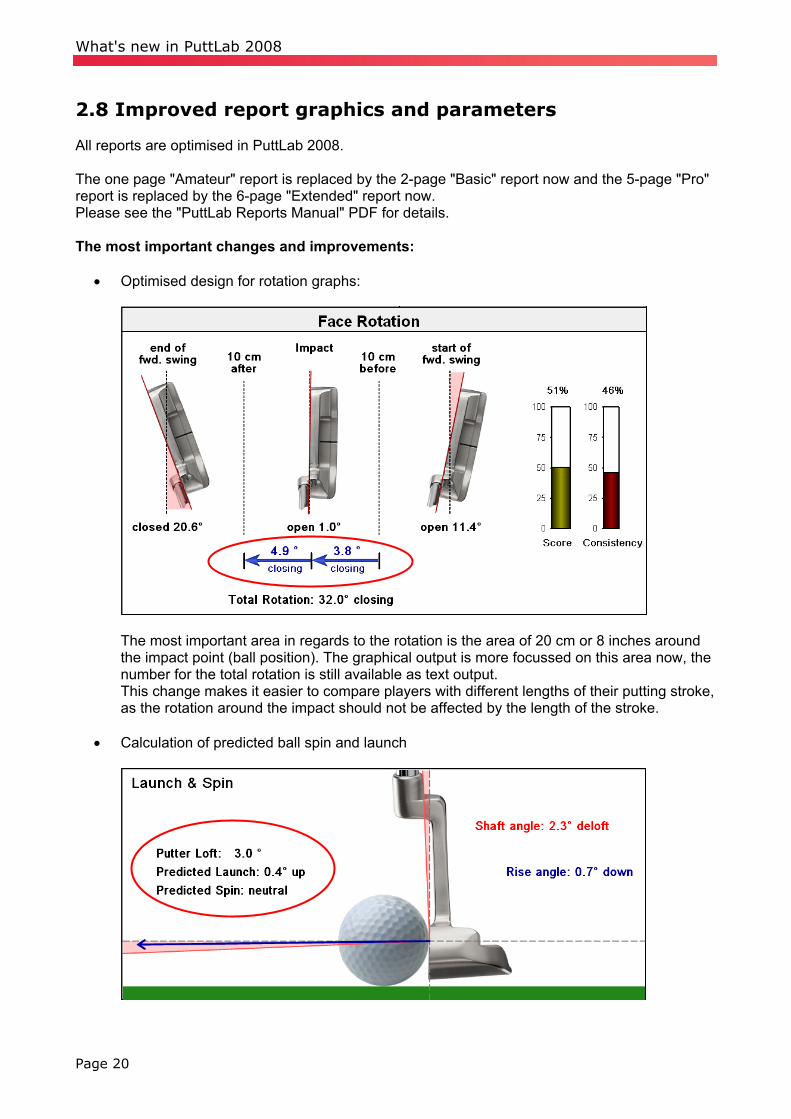
2.8 Improved report graphics and parameters All reports are optimised in PuttLab 2008. The one page "Amateur" report is replaced by the 2-page "Basic" report now and the 5-page "Pro" report is replaced by the 6-page "Extended" report now. Please see the "PuttLab Reports Manual" PDF for details. The most important changes and improvements:
• Optimised design for rotation graphs:
The most important area in regards to the rotation is the area of 20 cm or 8 inches around the impact point (ball position). The graphical output is more focussed on this area now, the number for the total rotation is still available as text output. This change makes it easier to compare players with different lengths of their putting stroke, as the rotation around the impact should not be affected by the length of the stroke.
• Calculation of predicted ball spin and launch
Page 20

What's new in PuttLab 2008
If the loft of the putter has been entered in the player data the software is able to calculate the predicted ball spin and launch angle. If no data for the putter loft is available the program uses the default value of 3 degrees loft for the calculations.
• Calculation of predicted ball direction This new parameter is important for players having a compensation in their club alignment and path direction. For example a 1 degree open clubface at impact can be completely compensated by a 4 degree "outside in" direction:
So not ideal results for alignment and direction can still lead to a very good performance in ball direction if the player can repeat this strategy very consistently.
• Display of target lines for path and side-view graphics
The lines will allow to better see if the path is off to left or right compared to the target line.
Page 21

What's new in PuttLab 2008
• Display of additional player details and "Overall Rating" also on the first page of the Extended Report:
This will allow easy quick-comparison of the actual performance to sessions from the past.
• Display of single data values in the report graphs
This allows to see the variance and the sequence of the putt strokes. The display can be shown or hidden by using the "F7" key.
• Show or hide the bars for "Rating" or "Consistency"
Show or hide the "Score" bar by pressing the "F5" key. Show or hide the "Consistency" bar by pressing the "F6" key. This works for Screen and Print reports.
Page 22

What's new in PuttLab 2008
Page 23
2.9 Usage of multiple PuttLab systems with one software installation
PuttLab 2008 allows the usage of up to 4 PuttLab systems with one software installation. In the past this was a limitation for users or locations with multiple PuttLabs. If somebody tried to use a PuttLab system that is not registered on his actual software the program asked for a registration of a new software key. If the key is not available the system won't work. In future this problem can be easily avoided by adding all available PuttLab software keys to all computers to be used. Then you can easily switch from one registration to another and mixed usage of different PuttLab hardware is not a problem any more. All details on the software registration you find in 4.2 2.10 Improved data import / export functions In PuttLab 2008 the data export / import functionality is extended to a new level. It is now possible to export complete Projects, Players or single data sets of one Player. The export of complete Projects is also a good data backup mechanism. Import of exported data can be done on the same computer or a different one. So the data export can be used to transfer data from one PuttLab installation to another (even on a different computer). Learn more about the data export and import in chapter 4.13.6 and 4.13.7.

Start the SAM PuttLab software
3 First steps with your SAM PuttLab 3.1 Start the SAM PuttLab software First start the software via the desktop icon. You can also start it via the Windows start menu under "Programs" > "SAM PuttLab 2008". 3.1.1 Enter the Serial Key
Be sure to have the Basic Unit connected to your USB port before first start of the software! When you start SAM PuttLab via the desktop-icon or the Windows Start menu you will be asked to enter the software key that comes with your copy of the software:
The serial key is either provided as a printout you find in the PuttLab package or provided by email.
The key which is provided to you is a unique number for your product. Please keep it in a secure place.
After input of the software key the software will check if the right Hardware is connected to your PC (by checking the serial number of the basic Unit). If you get an error message after the serial key input this can have several reasons:
1) Input of wrong serial key
Please re-check the input with the number on your serial label (on the backside of the CD sleeve).
2) The connected Basic Unit is not the right one
Page 24
Start the SAM PuttLab software
The software is registered to a dedicated Basic Unit (by serial number assignment of the hardware). After input of the serial key the software will check if the right unit is connected to the PC. If the numbers doesn't match, the software will generate the error message shown above. This can only happen if you have more than one hardware devices and have interchanged them or if a mistake happened in the delivery of the system components. So please check if the basic Unit with the requested serial number is available to you and connect it to the PC that you are working with. If you do not have the requested Basic Unit please contact the Science&Motion support ([email protected]).
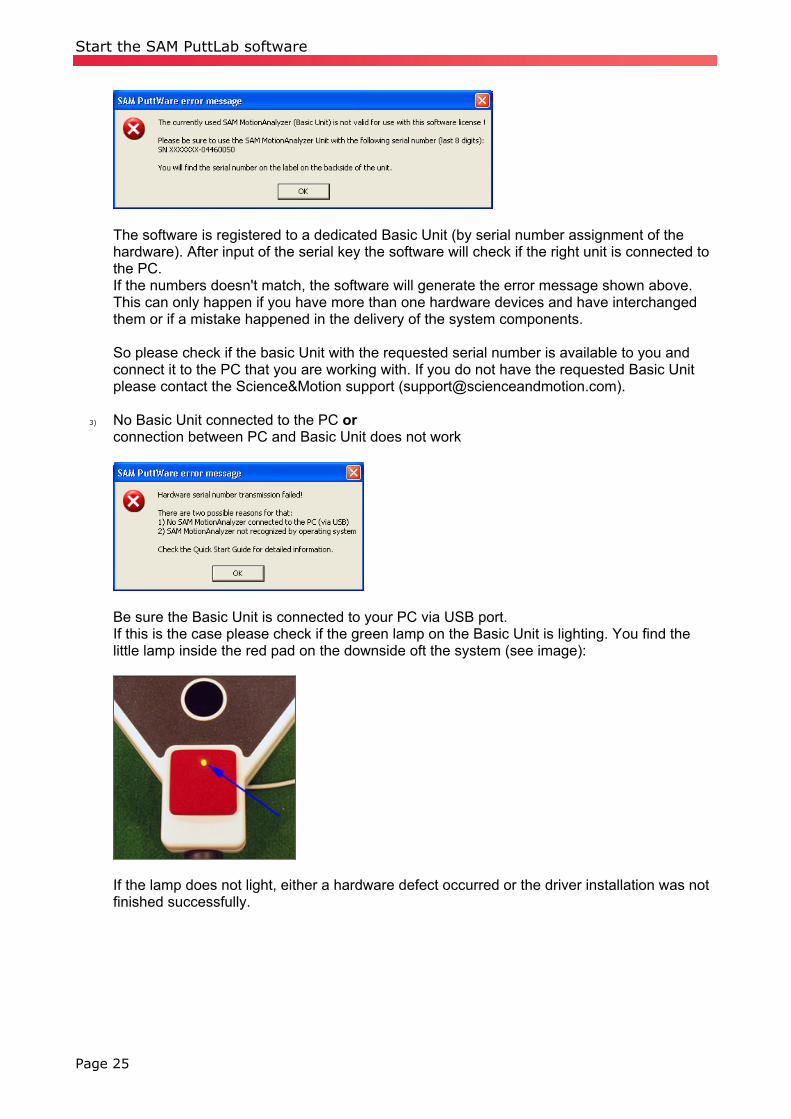
3) No Basic Unit connected to the PC or connection between PC and Basic Unit does not work
Be sure the Basic Unit is connected to your PC via USB port. If this is the case please check if the green lamp on the Basic Unit is lighting. You find the little lamp inside the red pad on the downside oft the system (see image):
If the lamp does not light, either a hardware defect occurred or the driver installation was not finished successfully.
Page 25

Start the SAM PuttLab software
3.1.2 SAM PuttLab Wizard 1. The first time you start the software the "SAM PuttLab Wizard" pops up. In the first window he helps you creating your first Project. For detailed information on Projects click the "Help" button.
SAM PuttWare Wizard – Create a project 2. On the second window the wizard helps you to create your first Player. Follow the information given by the wizard page. By clicking the "Help" button you get more information on Players.
SAM Wizard – Create Player
You can manage Projects, Players and measurement data with the data management tools within SAM PuttWare. Chapter 4.13 explains how. If you don't want to view the wizard on next start up just check the box at the lower left of the wizard window. Once you successfully created a Project and a Player the wizard will not show up again.
Page 26

Quick Overview of Project and Player Management
3.2 Quick Overview of Project and Player Management The PuttLab data is organized in a hierarchical structure with different levels. Data Management is very important if multiple people are using one SAM PuttLab, for example for training purposes. A practical usage of the Data Management will allow to find, compare and export measurement and training data in a comfortable way. The Data Management consists of four main levels.
1. Projects This is the top level layer of the Data Management. A Project can hold multiple Players. You need to create Projects to separate different sets of Players.
2. Players Players will contain all the data recorded during measure- and training sessions. So each measurement or a training session will be assigned to the currently selected Player. A Player also can be assigned a lot of additional data like loft of putter, handicap, age, etc.
3. Sessions Sessions will contain your measurement data and also attached media files and videos (if available). A new Measurement or Training will automatically start a new Session, so you do not have to do this manually. One Player can hold up to 999 Sessions. A double-click on a Session will open the assigned Report.
4. Measurements One Session can hold up to 999 data sets of measurement or training. These data sets can be viewed or printed out (via reports) and exported (to a PDF document).
So it's easy to keep an overview of all the data you achieved during months or years of training if you manage your data in a practical way. The "SAM Wizard" helped you to create your first Project and Player when you started SAM PuttLab for the first time.
You cannot record measurements or view data without having a Player selected.
Page 27

Check System Functionality
3.3 Check System Functionality The PuttLab software includes a test dialog for checking the hardware functionality.
a) Attach the triplet to your putter and connect it to the battery clip b) Attach the battery clip to the right side of your trousers and turn it on by pressing the button. c) In the Main Screen of the software open the menu entry "Setup" and select "Device
diagnosis". The following screen appears:
d) Move the club with triplet (or triplet alone) in front of the basic unit. e) The front side of the triplet has to point into the direction of the basic unit. f) Move the triplet around at a distance of 50 to 100 cm to the basic unit and check if all three
signal lights (Marker1 to Marker3) turn green. If this is the case the system is OK. The signals should stay green while moving around in the normal operational area. If one of the signal lights shows in red, one of the sensors (ultrasonic markers) of the triplet is probably defective.
It is normal that the lights turn red or gray in the display if the system is not switched ON (check lamp on the battery clip, it must be green) or if one of the sensors is out of the measuring range (distance > 100cm or angle > 80 degrees to one side)
Afterwards close the "Device diagnosis" screen by clicking the "Exit" button. Page 28

First Measurement
3.4 First Measurement
a) Select the 'Measure' icon from the toolbar to start your first measurement (or just press the F5 key). The "Start measurement" screen opens. Give your measurement a description (optional) and click the "Start" button. The measure screen opens.
b) Mark the spot from where you make all your putts (use chalk or a sticker). Then place a golf ball exactly on the spot.
c) Attach the Battery Clip to the right side of your trousers. Now move with your golf club in front of the Basic Unit and press the button on the Battery Clip. The "No Data Signal" text box disappears and you can see the motion of your golf club as animation on the display.
d) Now you need to calibrate your system. Please read the complete chapter 4.4 or the "Quick Start Guide" for details.
e) After you successfully calibrated the system you can start putting in front of the basic unit. Hold the club head still for 2 seconds before each putt in the calibrated address position until the "Ready"-signal on the screen turns green. Then do your putt!
f) Verify on the mid-section of the measure screen if your stroke was successfully recorded.
g) Repeat steps "e" to "f" until all trials are recorded (default = 5 trials). The measure screen closes and your result report is displayed automatically.
Page 29
Open a Result Report
3.5 Open a Result Report After finishing your measurement a report is displayed. There are different reports to choose from as pre-selection, depending on whether you are conducting a measurement or a training session.
• In measurement mode the report will be displayed directly after you accomplished your last stroke.
• In training mode you get instant feedback on your last stroke and can change aspects of your stroke analysis during your training strokes.
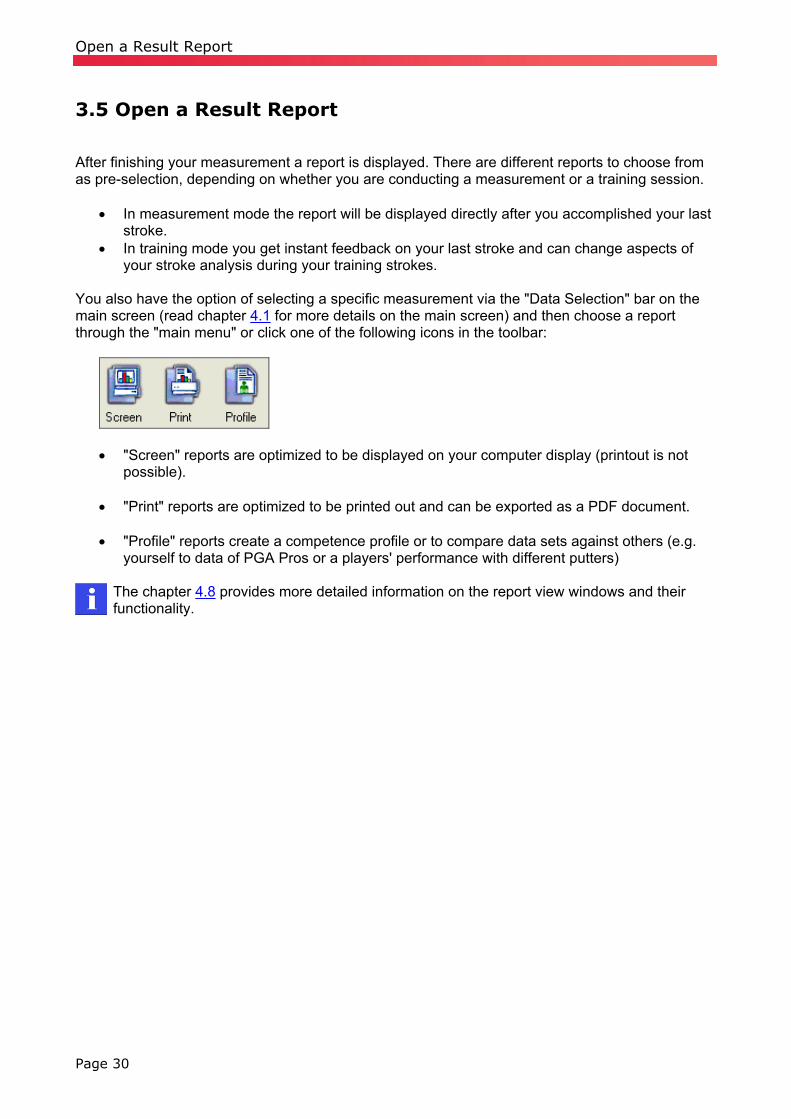
You also have the option of selecting a specific measurement via the "Data Selection" bar on the main screen (read chapter 4.1 for more details on the main screen) and then choose a report through the "main menu" or click one of the following icons in the toolbar:
• "Screen" reports are optimized to be displayed on your computer display (printout is not possible).
• "Print" reports are optimized to be printed out and can be exported as a PDF document.
• "Profile" reports create a competence profile or to compare data sets against others (e.g.
yourself to data of PGA Pros or a players' performance with different putters)
The chapter 4.8 provides more detailed information on the report view windows and their functionality.
Page 30

The Main Screen
4 Using the SAM PuttLab software 4.1 The Main Screen 4.1.1 Organization of the Main Screen
Toolbar
Data selection bar
Session bar
SAM PuttLab Main Screen * *Depending on your product edition of SAM PuttLab the Screen may look different. SAM PuttLab can be operated using only the main screen controls which contain all available functions.
• The most important functions can be executed using the toolbar which is positioned directly below the menu.
• On the left side you can see the "Data Selection" bar where Projects, Players, Sessions and measurement data can be selected.
• The "session bar" is positioned at the right of the program window. It displays all the available predefined PuttLab recording Sessions.
Page 31
The Main Screen
4.1.2 Toolbar
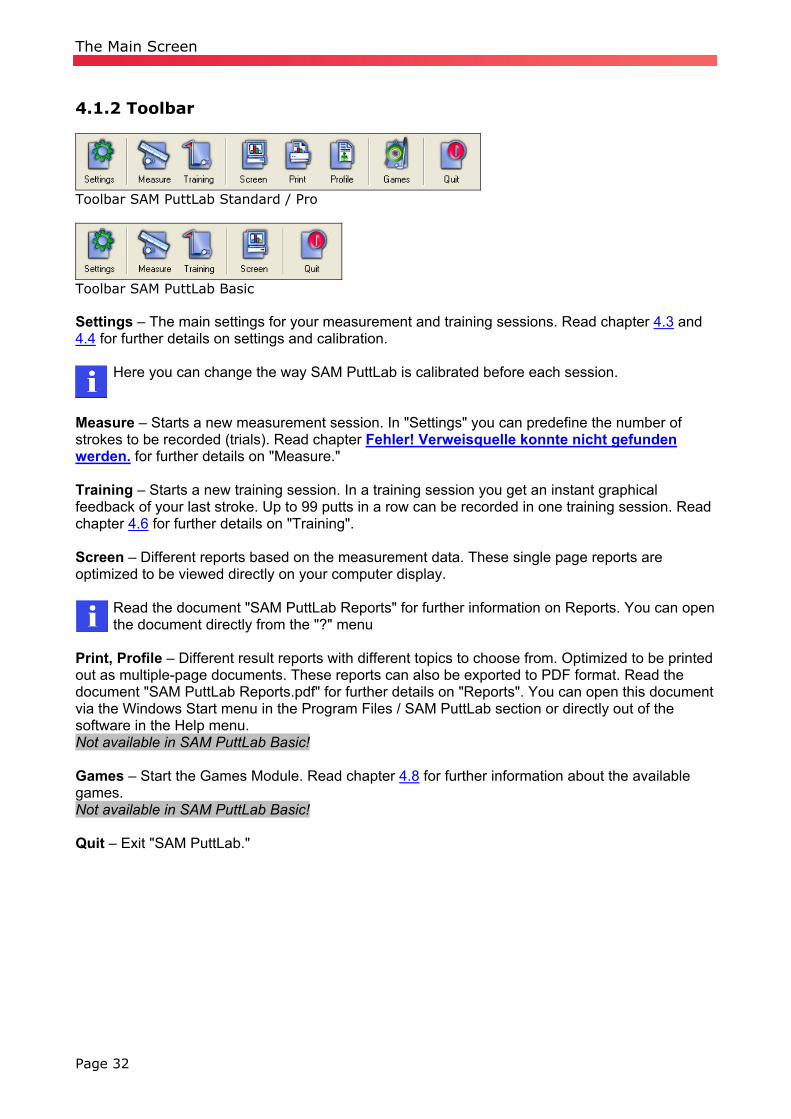
Toolbar SAM PuttLab Standard / Pro
Toolbar SAM PuttLab Basic Settings – The main settings for your measurement and training sessions. Read chapter 4.3 and 4.4 for further details on settings and calibration.
Here you can change the way SAM PuttLab is calibrated before each session. Measure – Starts a new measurement session. In "Settings" you can predefine the number of strokes to be recorded (trials). Read chapter Fehler! Verweisquelle konnte nicht gefunden werden. for further details on "Measure." Training – Starts a new training session. In a training session you get an instant graphical feedback of your last stroke. Up to 99 putts in a row can be recorded in one training session. Read chapter 4.6 for further details on "Training". Screen – Different reports based on the measurement data. These single page reports are optimized to be viewed directly on your computer display.
Read the document "SAM PuttLab Reports" for further information on Reports. You can open the document directly from the "?" menu
Print, Profile – Different result reports with different topics to choose from. Optimized to be printed out as multiple-page documents. These reports can also be exported to PDF format. Read the document "SAM PuttLab Reports.pdf" for further details on "Reports". You can open this document via the Windows Start menu in the Program Files / SAM PuttLab section or directly out of the software in the Help menu. Not available in SAM PuttLab Basic! Games – Start the Games Module. Read chapter 4.8 for further information about the available games. Not available in SAM PuttLab Basic! Quit – Exit "SAM PuttLab."
Page 32
The Main Screen
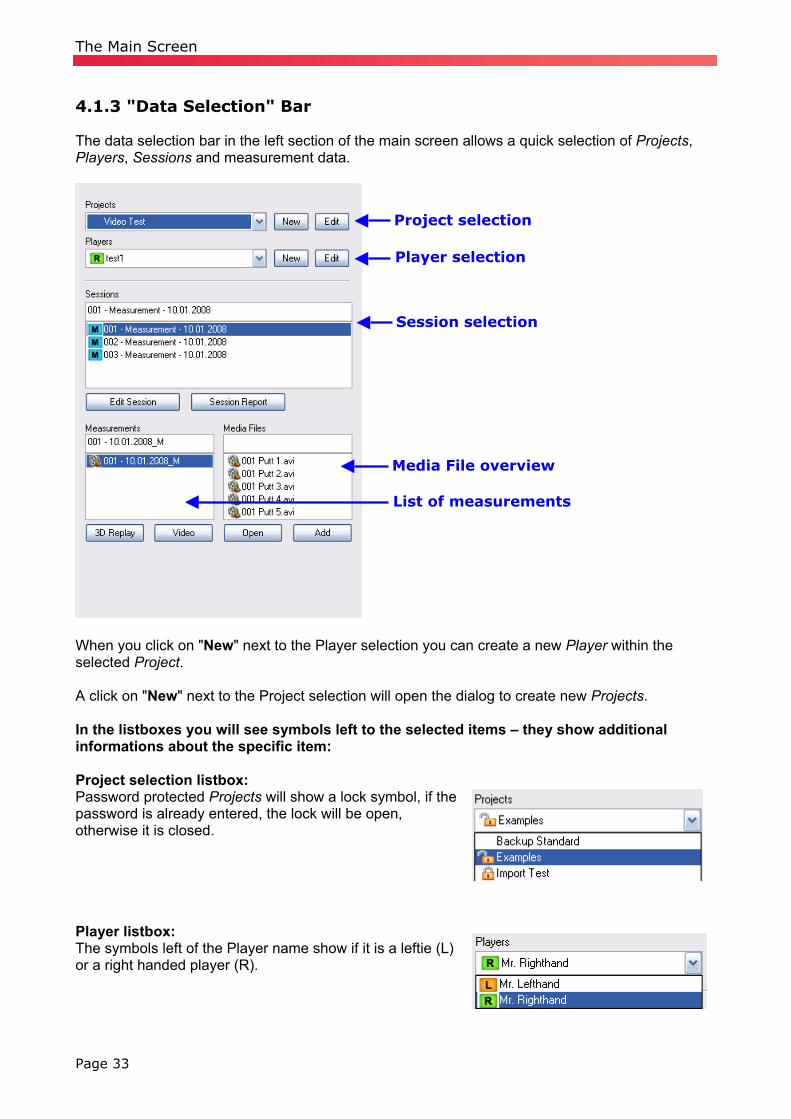
4.1.3 "Data Selection" Bar The data selection bar in the left section of the main screen allows a quick selection of Projects, Players, Sessions and measurement data.
Page 33
Project selection
Player selection
Session selection
Media File overview
List of measurements
When you click on "New" next to the Player selection you can create a new Player within the selected Project. A click on "New" next to the Project selection will open the dialog to create new Projects. In the listboxes you will see symbols left to the selected items – they show additional informations about the specific item: Project selection listbox: Password protected Projects will show a lock symbol, if the password is already entered, the lock will be open, otherwise it is closed. Player listbox: The symbols left of the Player name show if it is a leftie (L) or a right handed player (R).

The Main Screen
Sessions listbox: In the Session Listbox the symbols show the type of the recording: M = Measurement T = Training PS = Putter Selection PF = Putter Fitting
A double click on a Session will directly open the Report associated to this Session. Measurements listbox:
Page 34
Symbols only relevant for SAM PuttLab Pro edition! Left of the measurements a symbol will show if the data set includes additional recorded data from hand or head sensors. This allows to choose the right reports for those special measurements. Media Files listbox: The medial listbox contains all the media files attached to a recording session. The type of the file is shown by the symbol. There are symbols available for four different file types:
• Video files (avi, wmv,mpeg) • Audio files (wav,mp3) • Documents (doc,pdf,txt) • Image files (bmp,,jpg)
A double click on a media file will open the file in the associated windows program. So you just need to double click on a file to see the picture, play the video or read the document.

The Main Screen
4.1.4 Main Menu Items Menu FILE
Page 35
Manage Projects, Manage Players, Manage Sessions Management of your Projects, Players, and Sessions: • Add, delete or edit Projects. • Add, delete or edit Players. • Edit or delete Sessions or data sets. Read chapter 4.13 for further details on data management. Export data This option extracts measurement result data into compressed data files (.CAB format). These files can be used to import the data to another PC with SAM PuttLab installed or to a different Project on the same PC. It is also possible to send the files via email for remote analysis of the data (e.g. to your coach or to Science&Motion). The data export can be done for:
• complete Projects (all Players and data of a Project) • complete Players (all data and file attachments for one specific Player) • or single Sessions (single recording sessions of one Player)
The export/import functions can also be used for data backup. A detailed description of the data export process is described in Chapter 4.13.6. Import data Imports data files which are generated with the "Export data" function. The data can be added to an existing Project or to a new one. A detailed description of the data import process you can find in Chapter 4.13.7. Exit Closes SAM PuttLab. Menu RECORDING Here you can start measurement or training sessions. Start Measurement or Start Training will start a session. Further details about Measurement and Training can be found in chapters Fehler! Verweisquelle konnte nicht gefunden werden. and 4.6. Start Putting Game will start the Games Module of PuttLab. The games combine serious training and fun. We have three great games implemented into the SAM PuttLab yet. Further information on the available games you find in chapter 4.11.
Games are not available in SAM PuttLab Basic edition!

The Main Screen
Menu REPORT This menu will present all result reports that are available on your system. Clicking on one of the entries will open the result report for the currently selected Project, Player, and Session. Read the document "SAM PuttLab Reports.pdf" for further details on "Reports". You can open this document via the Windows Start menu in the Program Files / SAM PuttLab section or directly out of the software in the Help menu. Menu VIDEO
PuttLab 2008 contains a brand new video recording and replay module.
The menu for video offers the functions for setup and operation of your video camera and recording. The PuttLab software provides video recording, playback, saving snapshots as image files and overlay drawing functions. Open Video Window Opens the main video window for recording and playback. See chapter 4.9.3 for detailed description of all the features. Camera Setup Wizard The "Camera Setup Wizard" will allow easy step by step configuration of your camera. See 4.9.2 for details. Video Settings Opens a dialog for specific settings, see 4.9.4 for details. Menu ANALYSIS
Only available in SAM PuttLab Pro edition!
Page 36
Data edit window and Four plot window These options allow to display and edit the recorded data sets in a very detailed mode. See chapter 5.2 for detailed description. Menu RESULTS
Only available in SAM PuttLab Pro edition! Stroke statistics Creates and shows a database table of all available Measurements of the current selected Player. For every single measurement the mean values and the standard deviation values for all trials will be calculated and displayed. See chapter 5.2.3 for detailed description. Stroke parameter

The Main Screen
Creates and shows a database table of all available strokes in the current selected measurement record. All raw data values for the single stroke will be displayed. See chapter 5.2.4 for detailed description. Player statistics This function creates and shows a database table with all the numerical mean and standard deviation data of multiple pre-selected Players. See chapter 5.2.5 for detailed description. Menu SETUP The Setup menu provides different functions to control the behaviour of the SAM PuttLab software and diagnosis of the hardware: View data recording log file The system creates log files during each Measurement or Training session. This log files include detailed information about the single steps of the recording process and the putt stroke detection. The file can be used for analyzing purposes in case of problems. Device diagnosis Opens the "device diagnosis" window. Here you can check if the system hardware is working properly: See chapter 3.3 for details. Select Report logo
SAM PuttLab now provides the option to place individual logos on the print reports instead of the standard Puttlab logo. This dialog will allow to set different logos and also to import user generated logos into the software. See chapter 4.10.5 for details.
Program Settings Opens the program settings dialog. See chapter 4.3 for details. Audio Feedback Settings
The 2008 version of PuttLab includes a new Audio Feedback module for the Training mode. This would allow to get acoustical feedback instead or in parallel to the feedback in the report (visually). • allows training without having to look on a computer screen • allows training of two parameters in parallel, one with acoustic and one with visual
feedback More details on functionality and configuration can be found in chapter 4.6.3.
Change language: If there are different languages installed on your PC you will see all available languages in a listbox. You can select one of the languages and the program will startup again in the new language.
Page 37

The Main Screen
Registration This will open the Registration Dialog. See Chapter 4.2 for more information on how to register your software for one or multiple PuttLab units, or how to upgrade to another program edition. "?" - MENU Here you can access this operation manual as online PDF document, the "Quick Start Guide" document, and the "Troubleshooting" guide. SAM PuttLab operation manual This will open the online operation manual of the SAM PuttLab. This document provides a full description of the functionality of the system. Show Quick Start Guide This will open the "Quick Start Guide" document in the PDF Viewer. This is the same document that is delivered as printout with your SAM PuttLab. Show Report Manual This will open the "SAM PuttLab Reports" document in the PDF Viewer. In this document you can find brief descriptions of all avaliable report views of SAM PuttLab. Show Troubleshooting Guide This will open the troubleshooting help. This is a kind of FAQ document where you can find solutions for problems that may occur during installation or operating of the software. About SAM PuttLab This will open the "About SAM PuttLab" dialog. You can find information about the software version and the registration in this dialog.
Page 38

Registration
4.2 Registration 4.2.1 Overview In the Registration dialog you can see the current registration information, you can add registrations for additional PuttLab units or upgrade the software to a different edition. The dialog can be opened from the main menu in the "Setup" section.
In the upper section Currently active software registration you find the current registration data: Active software key, Program edition (Basic, Standard or Pro) and the hardware serial number of the Basic Unit. In the section Available registrations all available registrations are listed in a table. The currently active registration is marked with a green check mark. The currently connected hardware serial number is marked by a gray background.
Now it is possible to register up to 4 PuttLab systems in for on software installation. So multiple systems can be operated without having to enter the serial key each time when a different unit is connected.
Page 39
Registration
4.2.2 Manage your registrations
The PuttLab software licenses are bound to the PuttLab units (hardware). For each unit you will need a valid software key to operate the unit with your installed software. Up to 4 units can be registered in one software installation to make it possible to use different units with one computer easily.
At first start of the software you will be forced to enter a software key matching to your PuttLab unit. If you only want to operate this original unit with your software then you will not have to register a key again. You will only have to add or change registration if you:
• Want to use multiple PuttLab units with one software installation • Upgrade your PuttLab to another product edition
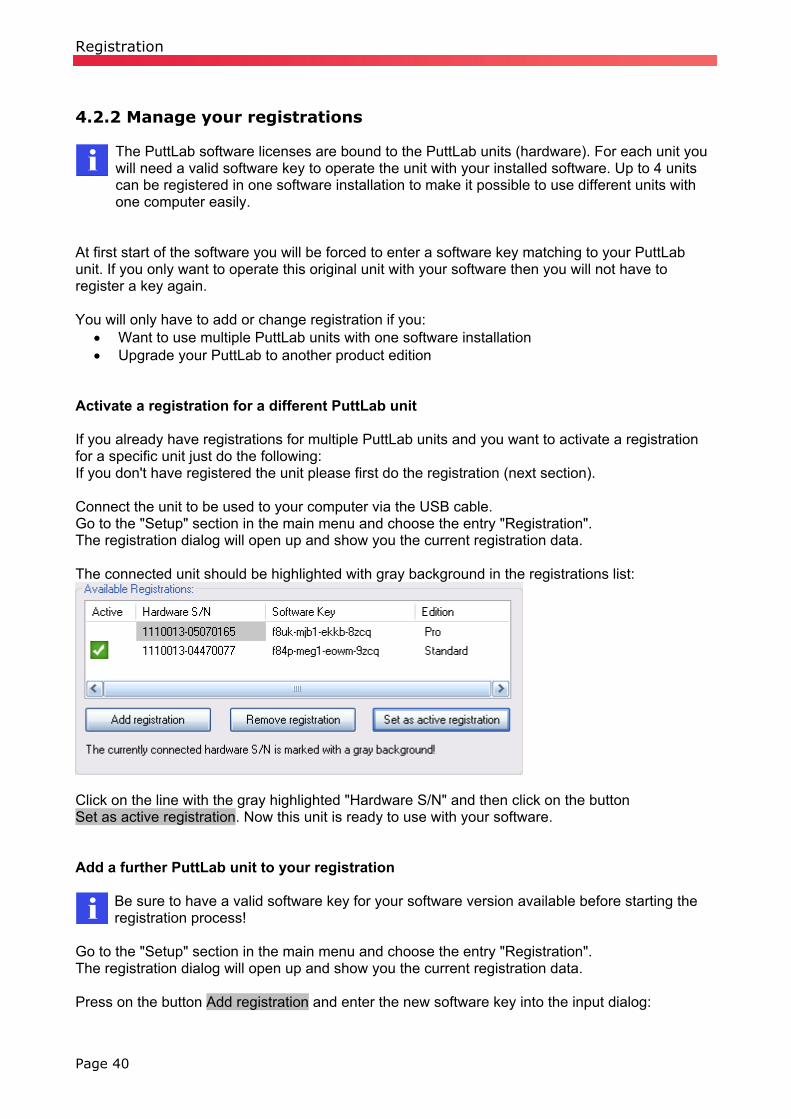
Activate a registration for a different PuttLab unit If you already have registrations for multiple PuttLab units and you want to activate a registration for a specific unit just do the following: If you don't have registered the unit please first do the registration (next section). Connect the unit to be used to your computer via the USB cable. Go to the "Setup" section in the main menu and choose the entry "Registration". The registration dialog will open up and show you the current registration data. The connected unit should be highlighted with gray background in the registrations list:
Click on the line with the gray highlighted "Hardware S/N" and then click on the button Set as active registration. Now this unit is ready to use with your software. Add a further PuttLab unit to your registration
Be sure to have a valid software key for your software version available before starting the registration process!
Go to the "Setup" section in the main menu and choose the entry "Registration". The registration dialog will open up and show you the current registration data. Press on the button Add registration and enter the new software key into the input dialog:
Page 40

Registration
Press OK to finalize the input. The software will check your key and if the key is valid you will see it in the registration list. If the key is not valid or maybe the PuttLab unit associated to this key already has been registered you will see a error message. Delete a PuttLab key from your registration Go to the "Setup" section in the main menu and choose the entry "Registration". The registration dialog will open up and show you the current registration data. Select the registration from the list you want to delete and press the button Remove registration.
Please note: You cannot remove the only registration, as it would leave your software without valid license!
Upgrade a PuttLab registration to a different product edition In case you want to upgrade one or multiple PuttLab registrations to a higher product edition (e.g. from Standard to Pro edition), you will need to enter the new software key(s). Go to the "Setup" section in the main menu and choose the entry "Registration". The registration dialog will open up and show you the current registration data. Click on the button Add registration and enter the software key in the following dialog. Press OK to finalize the input. If a key was already registered for this PuttLab unit you will see this message:
Press Yes and the new product edition will be set for this unit.
Please note: The old registration data will be overwritten if you enter a new software key for an existing unit!
Page 41

Program Settings
4.3 Program Settings The "Program settings dialog" for the recording configuration can be opened from the menu in section Setup – Program Settings or from the Toolbar (leftmost icon). The settings dialog provides three pages:
• Page 1: Measurement / Calibration settings • Page 2: Report Email settings • Page 3: Video settings
"Program settings" dialog 4.3.1 Measurement / Calibration settings This page of the settings dialog provides the following settings: Number of putts – Number of successful putt strokes which will be recorded during one measurement session. When the given number of strokes is reached, the measurement session will end automatically, save the data and open the pre-defined result report. The maximum number here is 10 strokes (default value is 5). Calibration method - Here you can select the way the system will be calibrated at the beginning of your "measurement" or "training" sessions. When you choose "calibration via automatic countdown" you can additionally define the time duration for the countdown (read Chapter 4.4 for further details on the calibration methods).
Page 42

Program Settings
4.3.2 Report Email Settings
PuttLab 2008 provides direct emailing of reports (as PDF attachment). All you need is a properly installed email client software (Outlook, Mozilla Thunderbird or other).
The reports will be send to the email address given in the Player data – if there is no address available the email client program will open with an empty address field. The settings page provides standard text you can add to your emails for subject and text. In the text you can include the Players' name by using placeholders:
• %f will insert the Players' fist name • %l will insert the Players' last name • %n will insert the players' full name
Example: The name of a player is John Putt. The name is entered in the player data like follows:
The text: "Your first name is %f, MR. %l, so your full name is %n" will show up as: "Your first name is John, Mr. Putt, so your full name is John Putt This will allow to send personal emails with your individual texts. More details on how to send the emails you can find in chapter 4.10.2.
Page 43

Program Settings
4.3.3 Video Settings
New in PuttLab 2008: Full video recording and replay module. See chapter 4.8 for further information.
The setup of your video device will be done in the "Camera setup wizard". Further information on this you can find in chapter 4.9.2.
In the Video Settings dialog you can define parameters to control the automatic video recording parallel to the putts in the measurement mode:
Length of recorded putt videos In the PuttLab measurement mode video can be automatically be recorded parallel to the putting. In the end you will have a single video clip for each putt attached to your data. The PuttLab records only the "active" movement of your putting stroke, for the video recording it is useful to have some time before and after the putt movement on in the video clip (e.g. to see the addressing). Here you can specify the time to be added to the video before the putt movement (backswing) starts and the time to be added after the movement ends. All values have to be entered in milliseconds.
Page 44

Program Settings
Video window visibility During recording of putts in the measurement mode the video window would cover a part of the screen, so it is good to hide the window when putting strokes are recorded. This is the default setting. a) hide video window:
In this case you will see the video window at beginning of the measurement to check if the camera works and the captured area is ok. On beginning of the measurement the video window will disappear, and can be reopened after the measurement is done. b) don't hide video window
In this case the video window will always be visible (if you don't hide it manually). This is useful if you have two displays for your PuttLab system. Then you can have the video window always active and visible on the second display. Maximum recording time Depending on the video compression you use (Video Codec) the recorded videos will consume a lot of space on your harddisk. Uncompressed video of size 640x480 pixel will need the following disk space:
• 10 seconds: 250 MB • 30 seconds: 750 MB • 1 minute: 1.5 GB
So it is very important to limit the maximum recording time to prevent your disk from running full! 60 seconds is the default value and this should be enough for most occasions. Maximum allowed value is 120 seconds.
Page 45
Calibration
4.4 Calibration 4.4.1 General Information
A system calibration has to be performed after every software startup and also after every change of either the ball position or the target alignment during a measurement or training session. Also after changing the putter for a new measurement. Without proper calibration the result data might be inconsistent.
The calibration process will calibrate the following parameters:
4) Ball position (impact) in x and y direction 5) Zero angle of the clubhead alignment (target direction) 6) Zero angle of the shaft alignment (shaft loft) 7) Height of the ground
So try to be very accurate in executing the calibration to ensure best data reliability. After startup of a Measurement or Training you are requested to calibrate the system by messages on the screen. Please follow the instructions given on the screen. If you want to calibrate again during a measurement or training session press the [C] key or click on the the following button in the toolbar:
SAM PuttLab provides three different types of calibration methods which can be selected in the "Program settings" dialog (see chapter 4.3.1). The methods of calibration will be explained in the following sections.
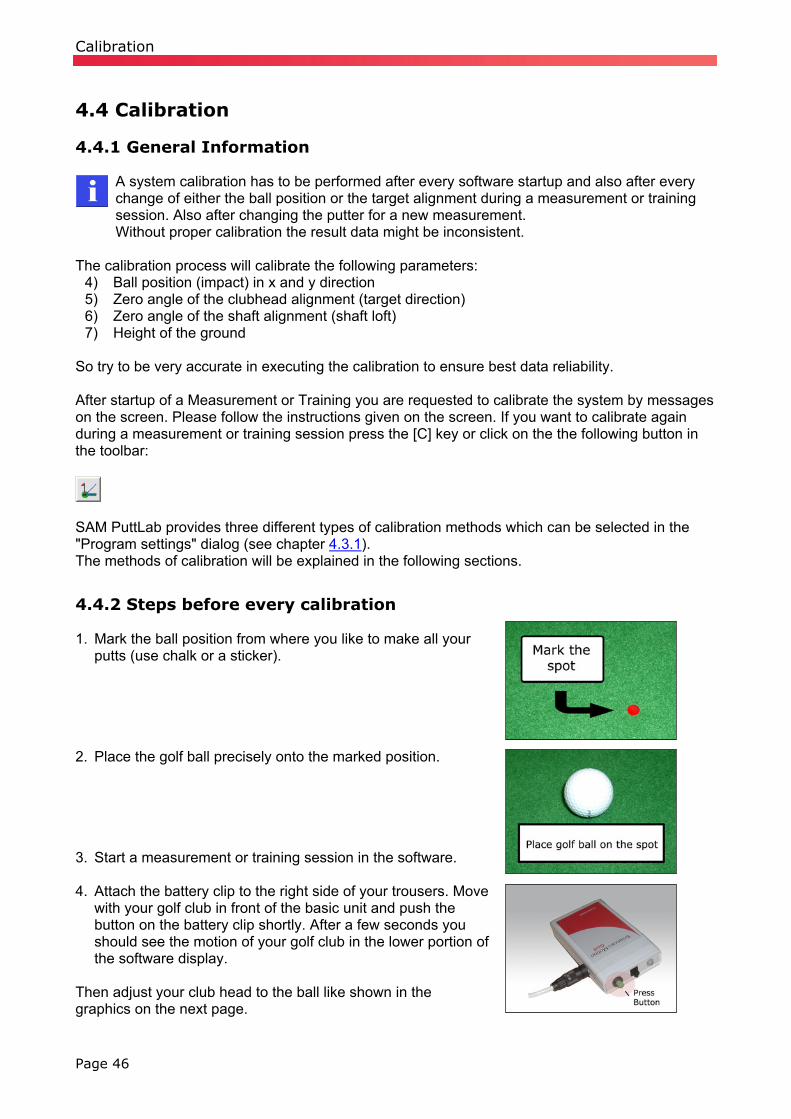
4.4.2 Steps before every calibration 1. Mark the ball position from where you like to make all your
putts (use chalk or a sticker).
2. Place the golf ball precisely onto the marked position. 3. Start a measurement or training session in the software. 4. Attach the battery clip to the right side of your trousers. Move
with your golf club in front of the basic unit and push the button on the battery clip shortly. After a few seconds you should see the motion of your golf club in the lower portion of the software display.
Then adjust your club head to the ball like shown in the graphics on the next page.
Page 46

Calibration
The graphics show you the right calibration position: a) Calibration position top view: Be sure to have your club head close to the ball and in horizontal sweet spot position when you calibrate:
b) Calibration position side view: Be sure to have your club head set on the ground in proper lie angle (club head bottom flat to the ground) when you calibrate:
The next pages will give an overview of the different calibration methods.
Page 47

Calibration
4.4.3 Countdown Calibration The "Countdown Calibration" method is based on a countdown timer that runs for a pre-defined time. At the end of the timer the calibration will be done automatically by using the club head position at this time. This is a good way to calibrate the system without having to press a key on the keyboard (e.g. if no second person is around). The timer runs through two phases: 1) Phase one (progress bar is running over green area) During this phase you have time to prepare your address position, i.e.: • move to address position • set club head on the ground • align club head to target • adjust club head to sweet spot position (relative to the ball) 2) Phase two (progress bar is running in blue area) During this phase of the calibration try to hold your club head stable in your address position. At the end of this phase the software will automatically detect your calibration position.
To start the calibration press the [C] key on the keyboard (when you are on the measurement or training screen). The countdown will start immediately; execute the steps described above. The duration of the complete countdown can be adjusted from 10 to 20 seconds in the "Recording settings" dialog (see 4.3). 4.4.4 Direct Calibration The calibration method "Direct calibration" is the easiest and quickest way to calibrate the system when a second person is present or when it is no problem for you to press a key while you hold the club in calibration position. After pressing the [C] key on the keyboard the current club head position and alignment will be taken immediately as calibration position. Before pressing [C] be sure to properly address your club head as shown in the picture on the right: • set club head on the ground • align club head to target • adjust club head to sweet spot position (relative to the ball) Page 48

Calibration
4.4.5 Calibration by moving the Club For experienced users this method of calibration will be the most effective one. In this mode the software is able to detect a specific club movement as a trigger command to finish the calibration.
1. On the measurement or training screen press the [C]-key. The calibration window opens up.
2. Put the club head to the ground and align the club head to the target hole. Check if the ball is on the "sweet spot." (see 4.4.2 for details)
3. Hold the club still in this position for about 3 seconds and then simply lift the club up vertically as shown in the picture below. This movement is the "trigger" for the software to execute the calibration (see picture).
Calibration by lifting the club
Page 49

Measurement
4.5 Measurement There are two modes in the program to record the data of your putting strokes, Measurement and Training. The Measurement provides a recording without direct feedback of results. A pre-defined number of strokes will be recorded by the system. After all strokes are finished, a result report will open up automatically for the analysis of the strokes.
Chapter 4.3 explains how to set up the Measurement. You can change the number of recorded strokes and, most importantly, you can define how to calibrate. Please read carefully chapter 4.4 about calibration. If you don't calibrate your system properly the data analysis may become less precise.
4.5.1 Start of a Measurement session The easiest way to start a Measurement is to click on the Toolbar icon. Another way is to use the menu or the keyboard shortcut [M]. In the startup dialog you will be asked to give your Measurement Session a name and description (optional):
In the section Session Report you can define the result report which will be displayed automatically after all strokes of the Measurement are finished. Optional settings can be made in the section Recording Setup: enable video recording Activates the automatic video recording for the measurement mode. Videos will be recorded together with the putts automatically.
Be sure to have a camera connected and successfully finished the 4.9.2 when you activate this option.
Page 50

Measurement
Measurement with HAND sensor attached and Measurement with HEAD sensor attached These options are only available in the Pro edition of the software. If you want to use the additional head or wrist sensor you have to activate one of these options.
Be sure to have the additional head/wrist sensor connected to your battery clip when you activate this option – otherwise the system will not be able to record putts! See chapter 5.1.3 for details on working with the additional sensors.
Click the "Start" button and the Measurement screen opens:
Measurement screen Once you are in the Measurement screen follow the next steps to execute your stroke recording.
1. Press the button on the battery clip. When you move with your golf club in front of the Basic Unit the "No Data Signal" field should disappear and you can see the motion of your club in the graphics display.
2. Depending on the calibration method you have chosen in the settings (default = calibration by countdown) you need to calibrate the system like described in chapter 4.4.
3. At the bottom left of the window you can see the Triplet symbol below "Status". It indicates whether the 3 sensors are having connection to the Basic Unit. If you are in the measuring range the color of the sensors should be green. A red color indicates interrupted connection (e.g. in case club is out of measuring range).
Page 51
Measurement
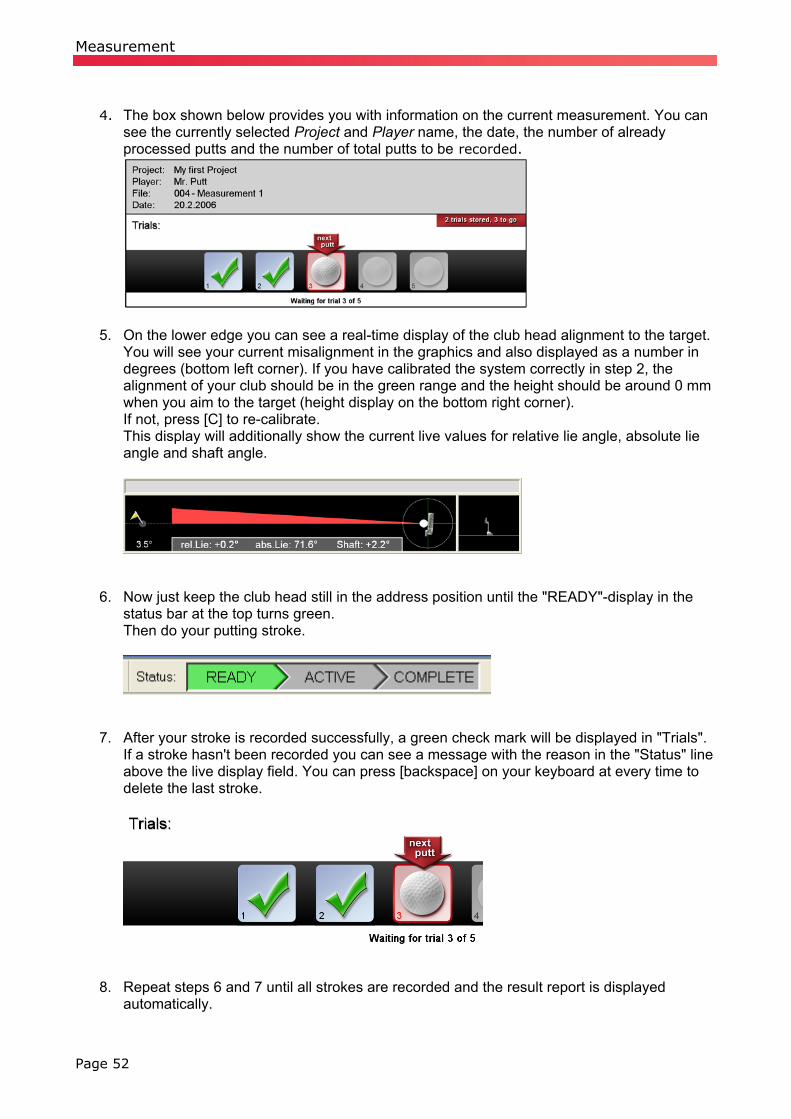
4. The box shown below provides you with information on the current measurement. You can
see the currently selected Project and Player name, the date, the number of already processed putts and the number of total putts to be recorded.
5. On the lower edge you can see a real-time display of the club head alignment to the target. You will see your current misalignment in the graphics and also displayed as a number in degrees (bottom left corner). If you have calibrated the system correctly in step 2, the alignment of your club should be in the green range and the height should be around 0 mm when you aim to the target (height display on the bottom right corner). If not, press [C] to re-calibrate. This display will additionally show the current live values for relative lie angle, absolute lie angle and shaft angle.
6. Now just keep the club head still in the address position until the "READY"-display in the
status bar at the top turns green. Then do your putting stroke.
7. After your stroke is recorded successfully, a green check mark will be displayed in "Trials".
If a stroke hasn't been recorded you can see a message with the reason in the "Status" line above the live display field. You can press [backspace] on your keyboard at every time to delete the last stroke.
8. Repeat steps 6 and 7 until all strokes are recorded and the result report is displayed
automatically.
Page 52
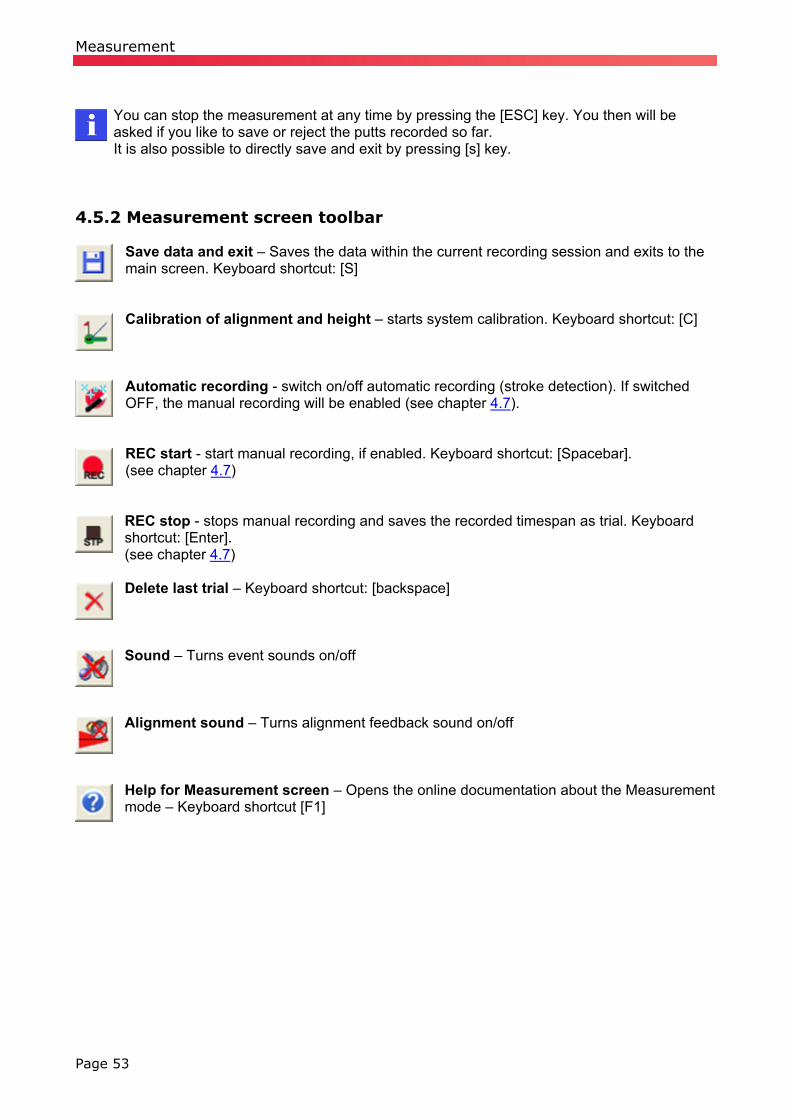
Measurement
You can stop the measurement at any time by pressing the [ESC] key. You then will be asked if you like to save or reject the putts recorded so far. It is also possible to directly save and exit by pressing [s] key.
4.5.2 Measurement screen toolbar
Save data and exit – Saves the data within the current recording session and exits to the main screen. Keyboard shortcut: [S]
Calibration of alignment and height – starts system calibration. Keyboard shortcut: [C]
Automatic recording - switch on/off automatic recording (stroke detection). If switched OFF, the manual recording will be enabled (see chapter 4.7).
REC start - start manual recording, if enabled. Keyboard shortcut: [Spacebar]. (see chapter 4.7)
REC stop - stops manual recording and saves the recorded timespan as trial. Keyboard shortcut: [Enter]. (see chapter 4.7)
Delete last trial – Keyboard shortcut: [backspace]
Sound – Turns event sounds on/off
Alignment sound – Turns alignment feedback sound on/off
Help for Measurement screen – Opens the online documentation about the Measurement mode – Keyboard shortcut [F1]
Page 53

Training
4.6 Training The Training mode is the second possibility to record your putt strokes with SAM PuttLab. In the Training you will get an instant feedback display for your last stroke and can make up to 99 putts in a row. This allows you to work on your strokes continuously with real-time feedback of the desired result output. You can change the result views during a Training session depending on the aspects of your putting you currently want to improve. 4.6.1 Start of a Training session The easiest way to start a Training is to click on the Toolbar icon. Another possibility is over the menu or the keyboard shortcut [T]. In the startup dialog you will be asked to give your Training session a name and description (optional) and to choose the type of training report which will be displayed during the Training session. Depending on which Training report you select you can choose between different result views for the real-time feedback.
In the section Session Report you can define the report to be displayed for the training session. Depending on which Training report you select you can choose between different result views for the real-time feedback. Optional settings can be made in the section Recording Setup: enable video recording In the current software version video recording is only possible for Measurement mode, not for Training. So this option is blocked out.
Page 54

Training
Measurement with HAND sensor attached and Measurement with HEAD sensor attached These options are only available in the Pro edition of the software. If you want to use the additional head or wrist sensor in your Training session you have to activate one of these options.
Be sure to have the additional head/wrist sensor connected to your battery clip when you activate this option – otherwise the system will not be able to record putts! See chapter 5.1.3 for details on working with the additional sensors.
Click the "Start" button and the training screen will open:
Training screen Once you are in the Training screen follow the next steps to execute your stroke recording.
1. Press the button on the battery clip. When you move with your golf club in front of the basic unit the "No Data Signal" field should disappear and you can see the motion of your club in the graphics display.
2. Depending on the calibration method you have chosen in the settings (default = calibration
by countdown timer) you need to calibrate the system like described in chapter 4.4.
Page 55
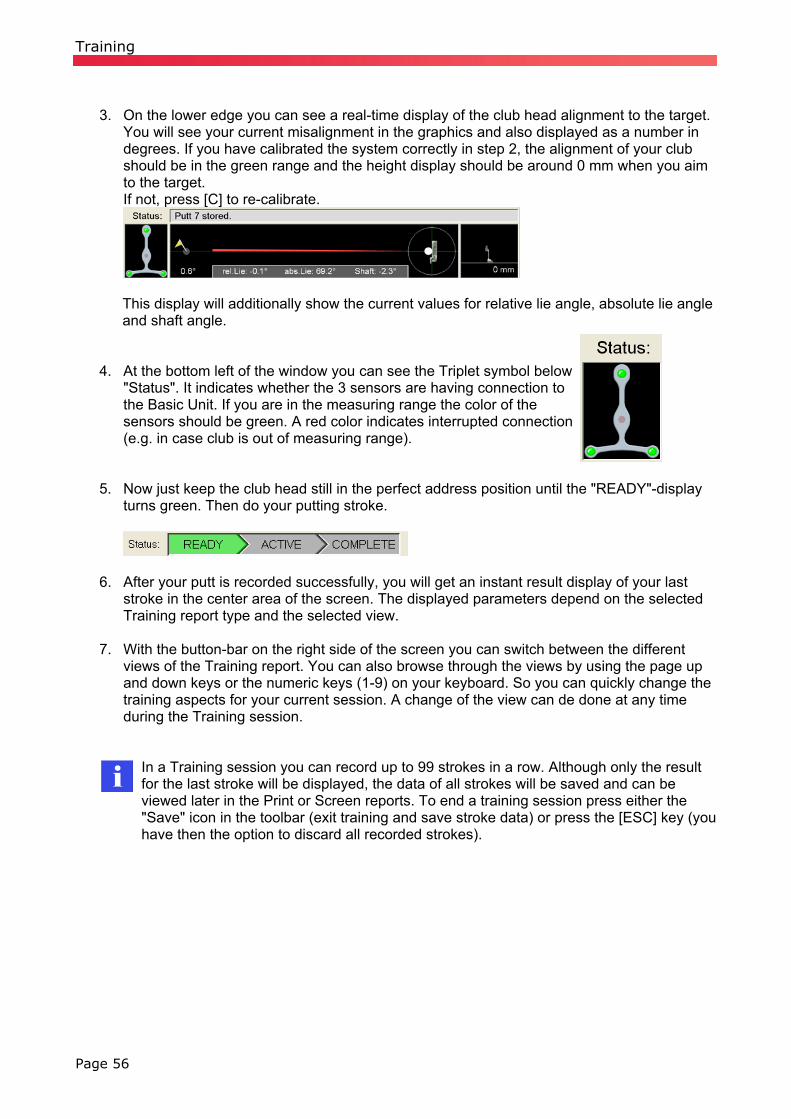
Training
3. On the lower edge you can see a real-time display of the club head alignment to the target.
You will see your current misalignment in the graphics and also displayed as a number in degrees. If you have calibrated the system correctly in step 2, the alignment of your club should be in the green range and the height display should be around 0 mm when you aim to the target. If not, press [C] to re-calibrate.
This display will additionally show the current values for relative lie angle, absolute lie angle and shaft angle.
4. At the bottom left of the window you can see the Triplet symbol below
"Status". It indicates whether the 3 sensors are having connection to the Basic Unit. If you are in the measuring range the color of the sensors should be green. A red color indicates interrupted connection (e.g. in case club is out of measuring range).
5. Now just keep the club head still in the perfect address position until the "READY"-display turns green. Then do your putting stroke.
6. After your putt is recorded successfully, you will get an instant result display of your last stroke in the center area of the screen. The displayed parameters depend on the selected Training report type and the selected view.
7. With the button-bar on the right side of the screen you can switch between the different views of the Training report. You can also browse through the views by using the page up and down keys or the numeric keys (1-9) on your keyboard. So you can quickly change the training aspects for your current session. A change of the view can de done at any time during the Training session.
In a Training session you can record up to 99 strokes in a row. Although only the result for the last stroke will be displayed, the data of all strokes will be saved and can be viewed later in the Print or Screen reports. To end a training session press either the "Save" icon in the toolbar (exit training and save stroke data) or press the [ESC] key (you have then the option to discard all recorded strokes).
Page 56

Training
4.6.2 Training screen toolbar commands
Save data and exit – Saves the data within the current recording session and exits to the main screen. Keyboard shortcut: [S] Calibration of alignment and height – System calibration. Keyboard shortcut: [C] Automatic recording - switch on/off automatic recording (stroke detection). If switched on, the manual recording will be enabled (see chapter 4.7). REC start - start manual recording, if enabled. Keyboard shortcut: [Spacebar]. (see chapter 4.7) REC stop - stops manual recording and saves the recorded timespan as trial. Keyboard shortcut: [Enter]. (see chapter 4.7) Delete last recorded putt – Keyboard shortcut: [backspace] Previous report page – Keyboard shortcut [page-up] Next report page – Keyboard shortcut [page-down] Activate / deactivate training sounds – turns on/off sound output for events (e.g. the beep sound when recording a putt) Open the settings for "Audio Feedback" – opens the settings dialog where you can define the audio feedback parameters and activate/deactivate the audio feedback Open 3D Putt replay – the current putt will be displayed in the 3D replay window. Keyboard shortcut: [D] Display training history – displays the history of values for the current training parameter as a bar chart. This allows a comparison of the values over a certain time of training. Keyboard shortcut: [Ctrl + C]
Page 57

Training
4.6.3 Audio Feedback
Audio Feedback in training mode is a new feature of PuttLab 2008
Overview The audio feedback provides results for your putting stroke as direct feedback in form of specific sound files that are played. Dependant on the current training parameter this can be different audio files in WAV format. Example: Training parameter is: "Face at Impact".
• If your putt stroke is in the good range for this you will hear: "good". • If the clubface is out of the good range in direction closed you will hear: "closed". • If the clubface is out of the good range in direction open you will hear: "open".
Advantage:
• get immediate feedback in training without having to look on the screen • get feedback on two different parameters at the same time, one by visually results on the
screen and one other by audio feedback The audio files to be played for different parameters can be set individually. You can also use your own files in WAV format. Also the limits for good or bad results can be set individually for each of the parameters. Audio Feedback is available for the following parameters:
• Face at address • Face at Impact • Face change (difference between face at address and Face at Impact) • Impact Spot (ball hitting point on the club face) • Direction at Impact • Rise at Impact • Loft at Impact (dynamic loft = shaft angle) • Alignment feedback (permanent feedback to check alignment)
Page 58
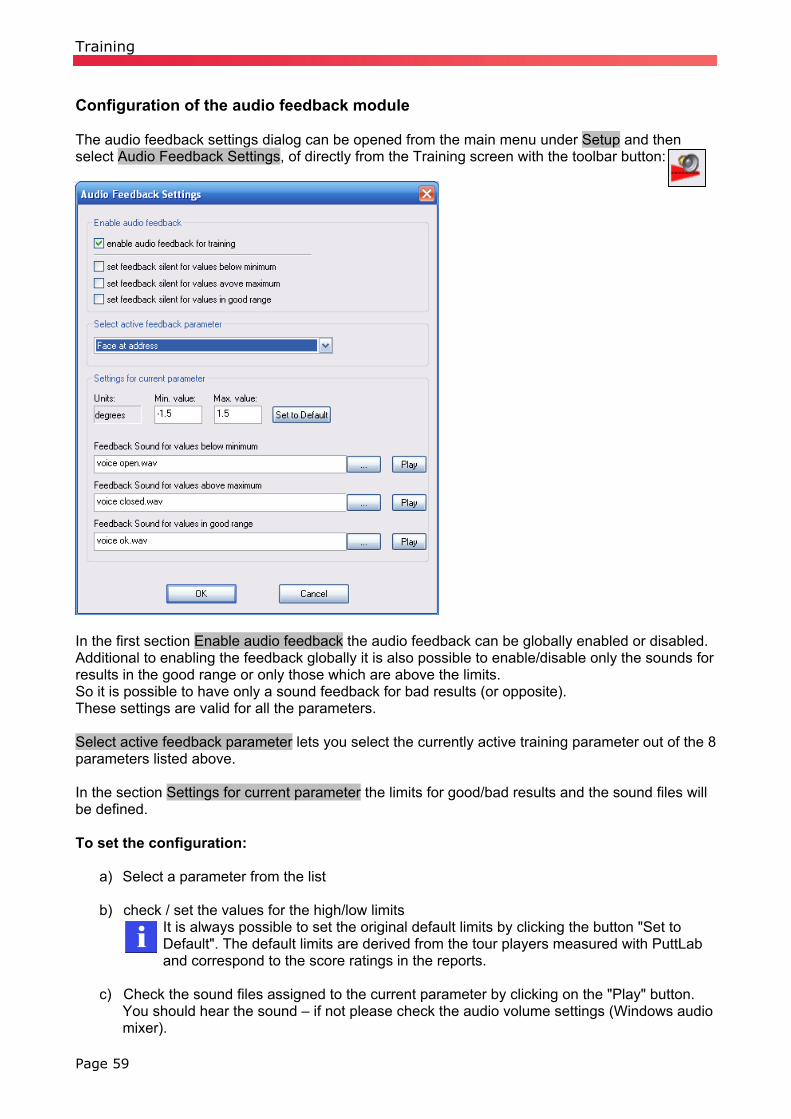
Training
Configuration of the audio feedback module The audio feedback settings dialog can be opened from the main menu under Setup and then select Audio Feedback Settings, of directly from the Training screen with the toolbar button:
In the first section Enable audio feedback the audio feedback can be globally enabled or disabled. Additional to enabling the feedback globally it is also possible to enable/disable only the sounds for results in the good range or only those which are above the limits. So it is possible to have only a sound feedback for bad results (or opposite). These settings are valid for all the parameters. Select active feedback parameter lets you select the currently active training parameter out of the 8 parameters listed above. In the section Settings for current parameter the limits for good/bad results and the sound files will be defined. To set the configuration:
a) Select a parameter from the list
b) check / set the values for the high/low limits It is always possible to set the original default limits by clicking the button "Set to Default". The default limits are derived from the tour players measured with PuttLab and correspond to the score ratings in the reports.
c) Check the sound files assigned to the current parameter by clicking on the "Play" button. You should hear the sound – if not please check the audio volume settings (Windows audio mixer).
Page 59

Training
d) If you like to replace a sound: Click on the button. A file browser will open up and
show you the available sound files. You can also import any WAV sound files from different folders or disks:
The audio files for the feedback tool are in a special location. You can delete audio files from this location and the list by "Delete selected file". Use "Import Audio File (WAV)" to add files to the list from external folders or disks.
Alignment Feedback The last parameter in the list "Alignment Feedback" is a special type of the audio feedback. It is a permanent feedback to indicate if your putter currently is in the right alignment position or not. This is helpful for alignment training e.g. if you step away from address position, return to the position and align – you will directly hear the feedback if you are in the good range or not.
"Tolerance" defines the good range for the alignment. If you hold the putter aligned in this range no sound will be played. If you go out of this range you will hear a periodic sound. The default value is 1 degree, that means the good range is defined as 1 degree open to 1 degree closed compared to the zero line calibration. "Range" will define the range for of your club head alignment to be monitored by the audio feedback. If you are out of this range the sound will be suppressed. This is to prevent the sound from being played all the time even when you are not in the address position at all. Default value is 20°.
The value for Tolerance will also effect the graphical live display for putter alignment in the Measurement and Training screen. Inside the good range the drawing color will be green, outside it will be red. So the display will always be conform to the audio feedback.
Page 60
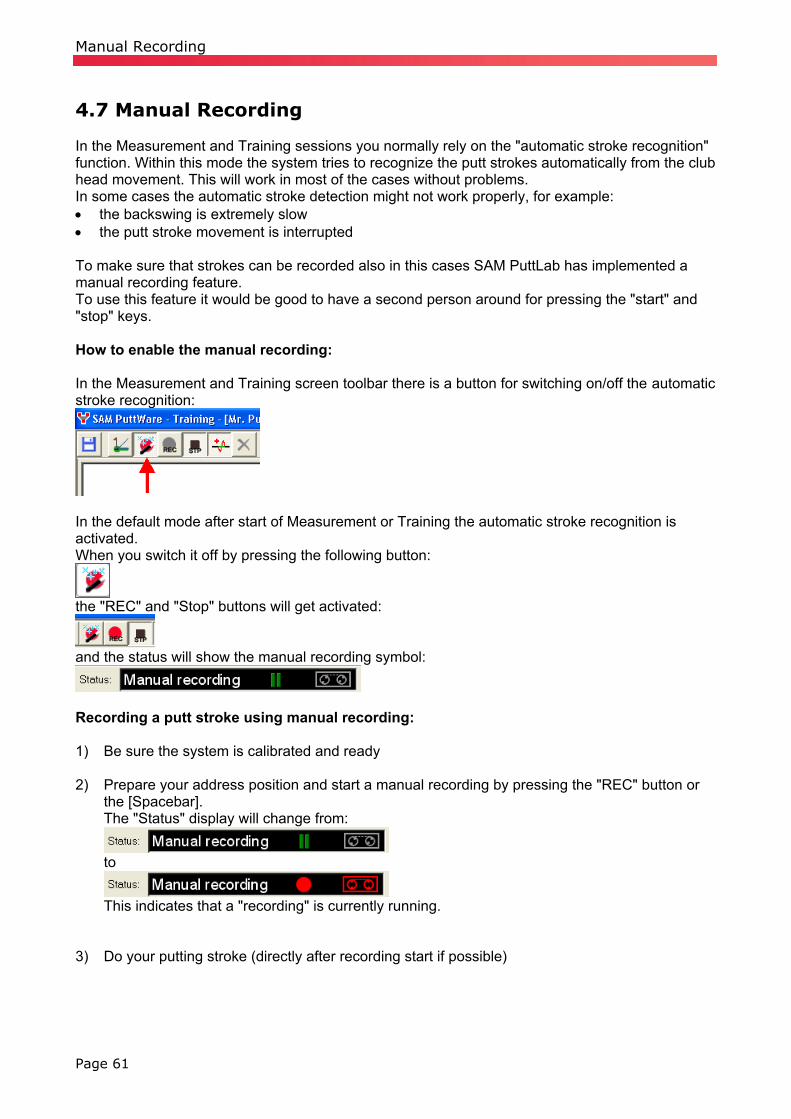
Manual Recording
4.7 Manual Recording In the Measurement and Training sessions you normally rely on the "automatic stroke recognition" function. Within this mode the system tries to recognize the putt strokes automatically from the club head movement. This will work in most of the cases without problems. In some cases the automatic stroke detection might not work properly, for example: • the backswing is extremely slow • the putt stroke movement is interrupted To make sure that strokes can be recorded also in this cases SAM PuttLab has implemented a manual recording feature. To use this feature it would be good to have a second person around for pressing the "start" and "stop" keys. How to enable the manual recording: In the Measurement and Training screen toolbar there is a button for switching on/off the automatic stroke recognition:
In the default mode after start of Measurement or Training the automatic stroke recognition is activated. When you switch it off by pressing the following button:
the "REC" and "Stop" buttons will get activated:
and the status will show the manual recording symbol:
Recording a putt stroke using manual recording: 1) Be sure the system is calibrated and ready
2) Prepare your address position and start a manual recording by pressing the "REC" button or
the [Spacebar]. The "Status" display will change from:
to
This indicates that a "recording" is currently running.
3) Do your putting stroke (directly after recording start if possible)
Page 61

Manual Recording
4) Directly after finishing the stroke stop the recording by pressing the "STP" button in the toolbar
or hit the [Spacebar] once again. The "Status" display will change to:
and one trial will be added to the recorded strokes. In the Training mode the results for the stroke will be displayed immediately.
5) Repeat this sequence for each further stroke you want to record.
It is not possible to record multiple strokes into one trial. So you have to Start and Stop the recording for every single stroke! Make sure to have as less as possible clubhead movements inside a recording before and after the stroke, because this may disturb the stroke analysis.
Page 62
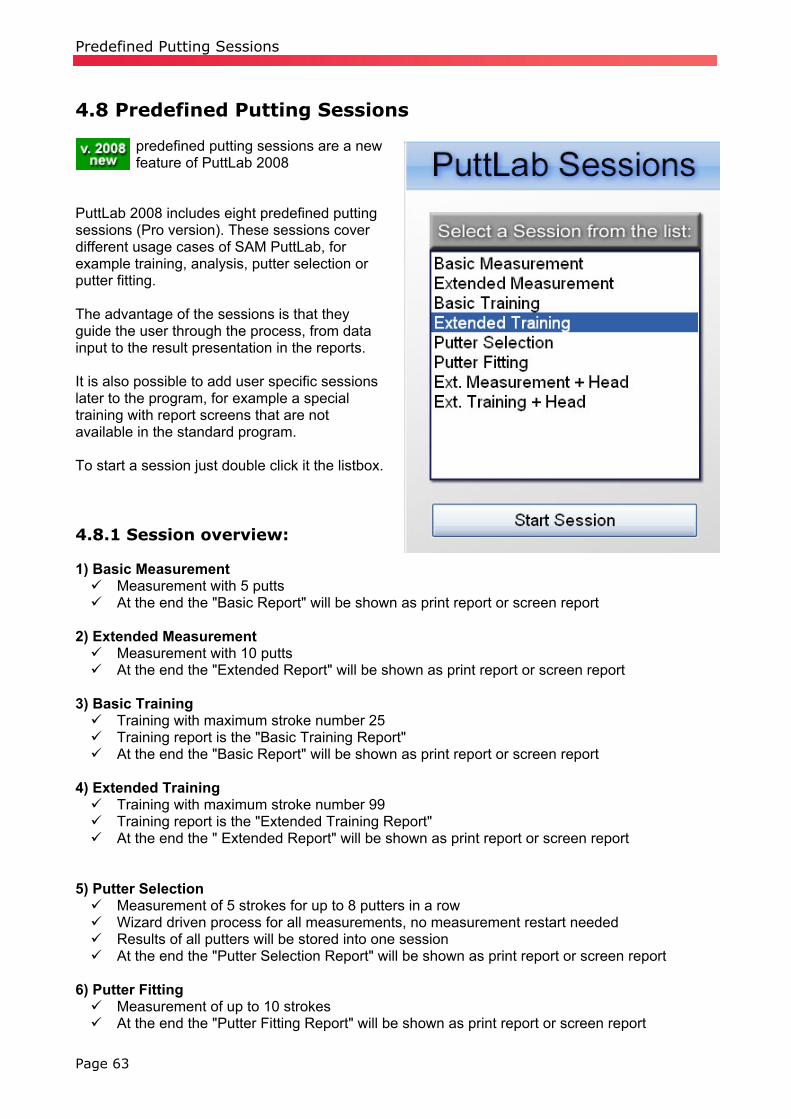
Predefined Putting Sessions
4.8 Predefined Putting Sessions
predefined putting sessions are a new feature of PuttLab 2008
PuttLab 2008 includes eight predefined putting sessions (Pro version). These sessions cover different usage cases of SAM PuttLab, for example training, analysis, putter selection or putter fitting. The advantage of the sessions is that they guide the user through the process, from data input to the result presentation in the reports. It is also possible to add user specific sessions later to the program, for example a special training with report screens that are not available in the standard program. To start a session just double click it the listbox. 4.8.1 Session overview: 1) Basic Measurement Measurement with 5 putts At the end the "Basic Report" will be shown as print report or screen report
2) Extended Measurement Measurement with 10 putts At the end the "Extended Report" will be shown as print report or screen report
3) Basic Training Training with maximum stroke number 25 Training report is the "Basic Training Report" At the end the "Basic Report" will be shown as print report or screen report
4) Extended Training Training with maximum stroke number 99 Training report is the "Extended Training Report" At the end the " Extended Report" will be shown as print report or screen report
5) Putter Selection Measurement of 5 strokes for up to 8 putters in a row Wizard driven process for all measurements, no measurement restart needed Results of all putters will be stored into one session At the end the "Putter Selection Report" will be shown as print report or screen report
6) Putter Fitting Measurement of up to 10 strokes At the end the "Putter Fitting Report" will be shown as print report or screen report
Page 63

Predefined Putting Sessions
7) Ext. Measurement + Head (only available in the Pro Edition) Measurement with 10 putts and additional head sensor Head sensor will be activated automatically, only use if this sensor is attached At the end the "Extended Head Report" will be shown as print report or screen report
8) Ext. Training + Head (only available in the Pro Edition) Training with maximum stroke number 99 and additional head sensor Head sensor will be activated automatically, only use if this sensor is attached Training report is the "Extended Training Head Report" At the end the "Extended Head Report" will be shown as print report or screen report
9) Ext. Measurement + Wrist (only available in the Pro Edition) Measurement with 10 putts and additional wrist sensor Wrist sensor will be activated automatically, only use if this sensor is attached At the end the " Wrist Print Report" will be shown as print report with some specific
information on the wrist movement dynamics. 9) Ext. Training + Wrist (only available in the Pro Edition) Training with maximum stroke number 99 and additional wrist sensor Wrist sensor will be activated automatically, only use if this sensor is attached Training report is the "Extended Training Wrist Report" At the end the " Wrist Print Report" will be shown as print report with some specific
information on the wrist movement dynamics. 4.8.2 How to run a predefined PuttLab Session a) Start a session: To start a session double click the session in the listbox on the right side of the screen or use the "Start Session" button. In the next step the Session start dialog will open:
Page 64
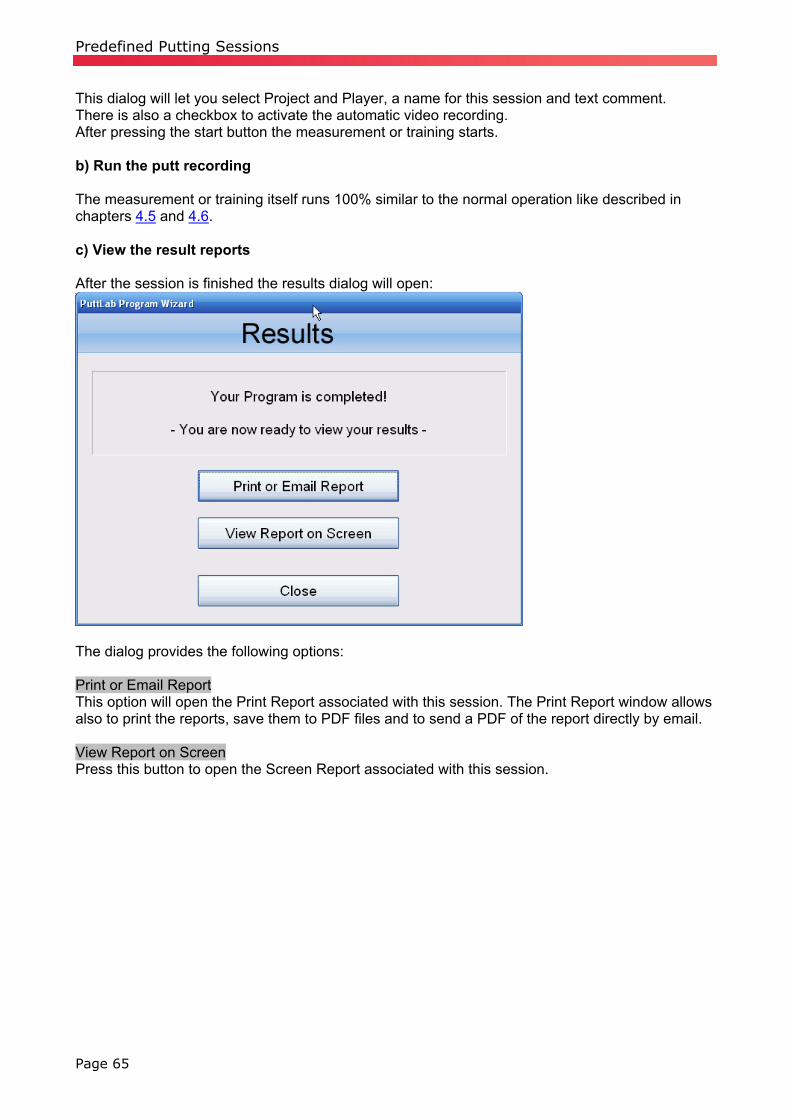
Predefined Putting Sessions
This dialog will let you select Project and Player, a name for this session and text comment. There is also a checkbox to activate the automatic video recording. After pressing the start button the measurement or training starts. b) Run the putt recording The measurement or training itself runs 100% similar to the normal operation like described in chapters 4.5 and 4.6. c) View the result reports After the session is finished the results dialog will open:
The dialog provides the following options: Print or Email Report This option will open the Print Report associated with this session. The Print Report window allows also to print the reports, save them to PDF files and to send a PDF of the report directly by email. View Report on Screen Press this button to open the Screen Report associated with this session.
Page 65

Video
4.9 Video
The video recording and replay module mode is a completely new feature of PuttLab 2008.
4.9.1 Overview The video recording module of SAM PuttLab includes the following features:
• video capturing from any windows compatible camera (WDM driver). These are nearly all DV cameras and a lot of USB camera models.
• recording video clips in parallel to PuttLab data recording. This means that for each recorded putt there is also a video clip available as attachment to the session data.
• replay of videos with different viewing options (still image, slow motion) • saving still images out of video stream to Bitmap or Jpeg files • overlay drawing functions in live view and replay, capturing overlay into recorded videos
The next chapters describe the setup of your video camera and the features of the video module. 4.9.2 Setup your video camera To setup the video camera the PuttLab software provides a Camera Setup Wizard. To start the wizard go to the "Video" section in the main menu and select "Camera Setup Wizard":
Page 66
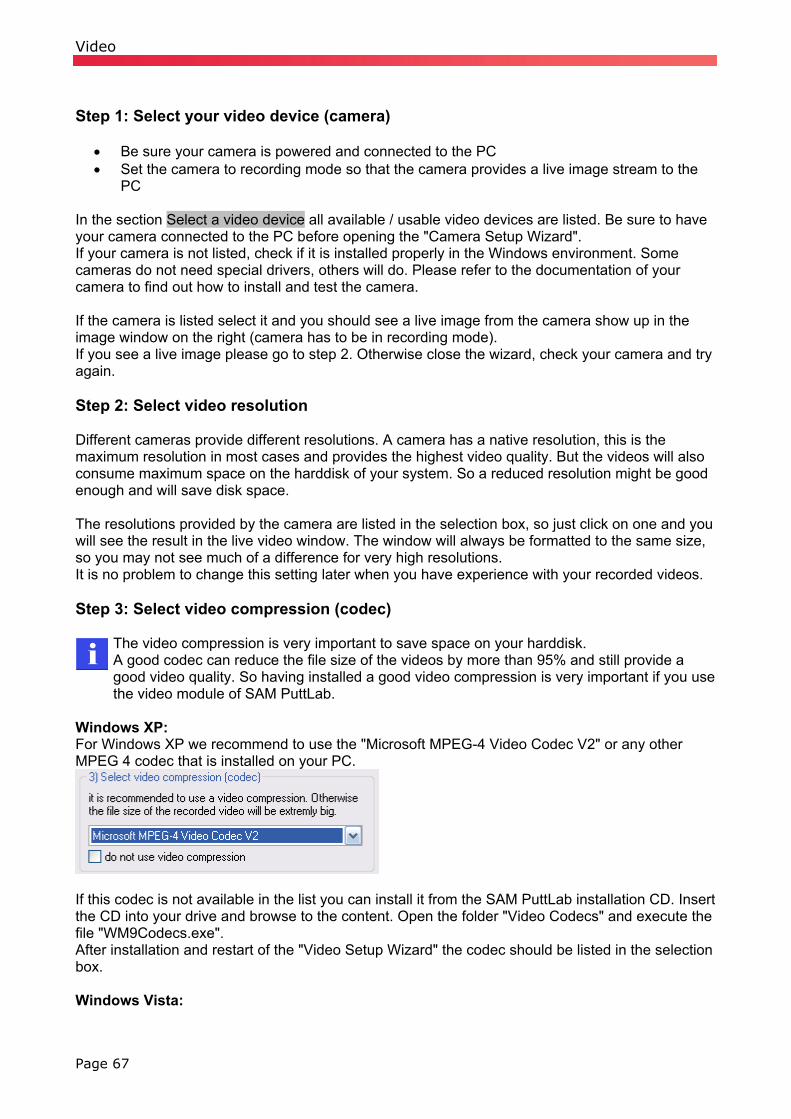
Video
Step 1: Select your video device (camera)
• Be sure your camera is powered and connected to the PC • Set the camera to recording mode so that the camera provides a live image stream to the
PC In the section Select a video device all available / usable video devices are listed. Be sure to have your camera connected to the PC before opening the "Camera Setup Wizard". If your camera is not listed, check if it is installed properly in the Windows environment. Some cameras do not need special drivers, others will do. Please refer to the documentation of your camera to find out how to install and test the camera. If the camera is listed select it and you should see a live image from the camera show up in the image window on the right (camera has to be in recording mode). If you see a live image please go to step 2. Otherwise close the wizard, check your camera and try again. Step 2: Select video resolution Different cameras provide different resolutions. A camera has a native resolution, this is the maximum resolution in most cases and provides the highest video quality. But the videos will also consume maximum space on the harddisk of your system. So a reduced resolution might be good enough and will save disk space. The resolutions provided by the camera are listed in the selection box, so just click on one and you will see the result in the live video window. The window will always be formatted to the same size, so you may not see much of a difference for very high resolutions. It is no problem to change this setting later when you have experience with your recorded videos. Step 3: Select video compression (codec)
The video compression is very important to save space on your harddisk. A good codec can reduce the file size of the videos by more than 95% and still provide a good video quality. So having installed a good video compression is very important if you use the video module of SAM PuttLab.
Windows XP: For Windows XP we recommend to use the "Microsoft MPEG-4 Video Codec V2" or any other MPEG 4 codec that is installed on your PC.
If this codec is not available in the list you can install it from the SAM PuttLab installation CD. Insert the CD into your drive and browse to the content. Open the folder "Video Codecs" and execute the file "WM9Codecs.exe". After installation and restart of the "Video Setup Wizard" the codec should be listed in the selection box. Windows Vista:
Page 67

Video
The codec "Microsoft MPEG-4 Video Codec V2" will not run under Windows Vista, so you need to install a different codec here. We recommend to install the free codec "ffdshow video encoder". To install this codec execute the following steps:
1) Locate the installation program. a) you have a PuttLab 2008 installation CD: - Insert your PuttLab CD and browse to the folder "Video Codecs" - in the folder you should find the file "ffdshow-20051124.exe" - go on with step 2 b) you don't have a PuttLab 2008 installation CD - go the the website www.scienceandmotion.com - go to the section "Service" and "Downloads" - go to the category "Video codecs" - download the "ffdshow" codec installer and go on with step 2
2) Execute the installation program from CD or the folder you downloaded it to
3) Follow the instructions of the installation program, do not change the default settings. After installation of the codec restart the PuttLab software and re-enter the "Video Setup Wizard". Your new installed codec should now be listed in the list for the video compression. Select the codec and uncheck the option "do not use video compression". Step 4: Set video orientation The software provides several options to manipulate the orientation of the video. Normally you would use this for portrait or landscape setting. If you want to record a video in portrait mode you might use the 90° or 270° setting:
If you are in the live mode you will see the result of the settings immediately in the video preview. Step 5: Do a test recording To test the settings it is recommended to do a test recording now. If steps 1 to 4 are set and you see a live video in the preview window press the button:
The software will record a video of 8 seconds length and then compress it automatically (if the compression is not set to OFF, see step 3). Then the video clip is being shown in the preview window. So you will not see live video any more now, you will see the replay of the recorded video with exactly the settings you have set in steps 1 to 4. After successful recording you will also see some information on the recorded video in the info box on the right:
Page 68

Video
Very important here is to check the function of the video compression: Filesize uncompressed will show you the size of the video file in uncompressed mode. The size will be very big also for this very short video clip. Filesize compressed will show you the file size after compression with the selected video codec. The file size should be very much smaller here – the compression factor should be greater than 90. Also the quality should be acceptable, please check the preview.
To go back to live mode and change settings again press the button
This sequence should be repeated until you are satisfied with the recording quality.
If the compression factor is less than 50 or even negative the selected codec does not work for the combination of this software and camera. Try a different codec in this case: a) press the button:
b) select a different codec from the list (step 3) c) repeat the test recording (step 5).
Page 69
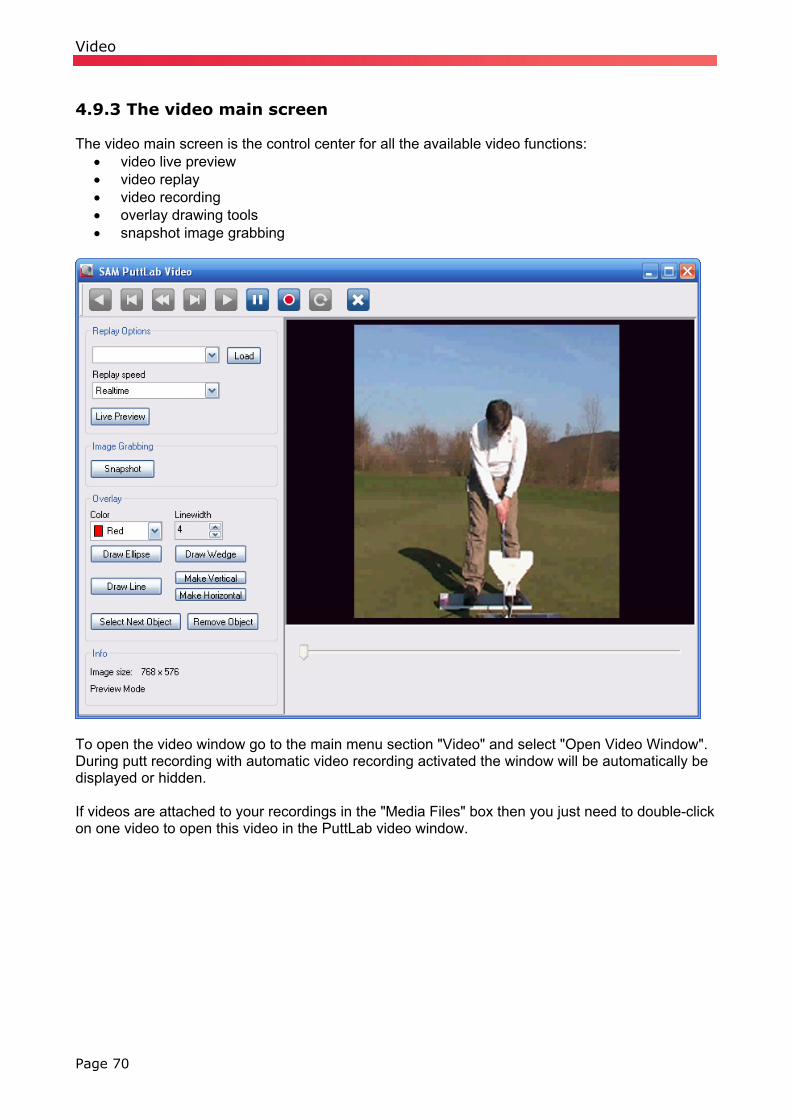
Video
4.9.3 The video main screen The video main screen is the control center for all the available video functions:
• video live preview • video replay • video recording • overlay drawing tools • snapshot image grabbing
To open the video window go to the main menu section "Video" and select "Open Video Window". During putt recording with automatic video recording activated the window will be automatically be displayed or hidden. If videos are attached to your recordings in the "Media Files" box then you just need to double-click on one video to open this video in the PuttLab video window.
Page 70
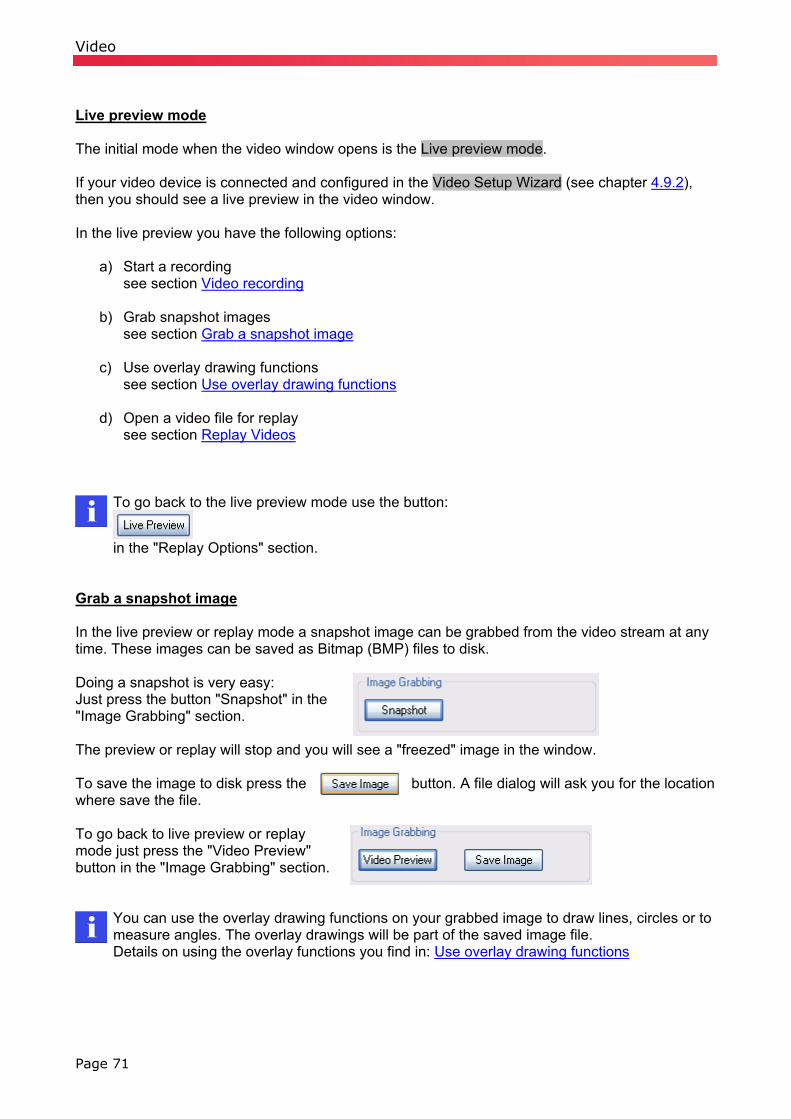
Video
Live preview mode The initial mode when the video window opens is the Live preview mode. If your video device is connected and configured in the Video Setup Wizard (see chapter 4.9.2), then you should see a live preview in the video window. In the live preview you have the following options:
a) Start a recording see section Video recording
b) Grab snapshot images see section Grab a snapshot image
c) Use overlay drawing functions see section Use overlay drawing functions
d) Open a video file for replay see section Replay Videos
To go back to the live preview mode use the button:
in the "Replay Options" section.
Grab a snapshot image In the live preview or replay mode a snapshot image can be grabbed from the video stream at any time. These images can be saved as Bitmap (BMP) files to disk. Doing a snapshot is very easy: Just press the button "Snapshot" in the "Image Grabbing" section. The preview or replay will stop and you will see a "freezed" image in the window. To save the image to disk press the button. A file dialog will ask you for the location where save the file. To go back to live preview or replay mode just press the "Video Preview" button in the "Image Grabbing" section.
You can use the overlay drawing functions on your grabbed image to draw lines, circles or to measure angles. The overlay drawings will be part of the saved image file. Details on using the overlay functions you find in: Use overlay drawing functions
Page 71

Video
Video recording When the Recording start button is activated you can start a recording at any time.
The current video device settings will be used (be sure to have configured and connected your video device, see chapter 4.9.2). After starting the recording the "Recording status bar" should be visible:
The bar shows the current recording status, the length of the video already recorded and the available disk space for the drive where the video is temporarily saved to.
Page 72
To stop the recording press again or the pause button: After the recording is stopped a file dialog will open and ask where to save the final video file. When you press "Save" the video will be compressed and saved to the final location. Depending on the compression settings and the length of the video this may take a while to finish. If the video recording time exceeds the time limit given in the video settings, the recording will be stopped automatically to prevent your disk from running full. The recording will also be stopped if your disk space is low.
You can use the overlay drawing functions in your recorded videos to draw lines, circles or to measure angles. The overlay drawings will be part of the saved video clip. Details on using the overlay functions you find in: Use overlay drawing functions
Replay Videos There are two ways to replay videos with PuttLab:
a) replay videos attached to the putting sessions To replay videos that are attached to the putting sessions just double-click the video file in the "Media Files" box on the PuttLab main screen. One or multiple videos will be loded automatically and the video window will open in replay mode. The available videos will be listed in the list left of the button "Load" (see picture below).
b) Replay any video from disk in AVI or WMV format: To replay a video from disk press the "Load" button in the "Replay Options" section. In the following file dialog browse to your video file and press "Open". The video will be added to the list and the replay should start in the video window.
"Replay Options" section load video file from disk pulldown list of available videos for direct replay replay seep options (slow motion)

Video
Use overlay drawing functions The PuttLab video module provides some overlay drawing functions. The overlay can be used in all modes:
• Live preview • Video recording • Snapshot images • Video replay
The following overlay objects are available:
• lines • ellipses • wedges with angle displayed
overlay objects example How to set overlay objects: The section "Overlay" provides the controls to add, configure and remove the overlay objects. For all objects the color and line width can be set. The Draw Ellipse, Draw Line and Draw Wedge buttons will add an object of the selected type. The last added or edited object will be the active one, this object can be removed by Remove Object. Select Next Object will set the next object active for changing attributes or removing. Page 73
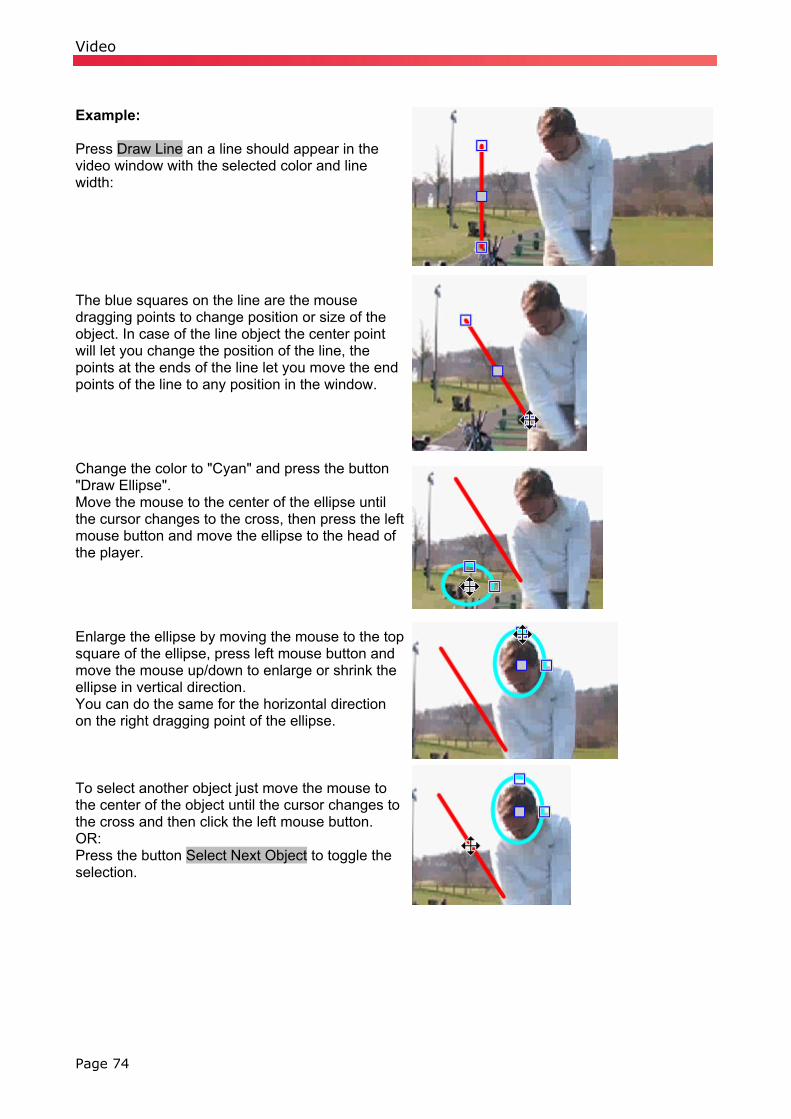
Video
Example: Press Draw Line an a line should appear in the video window with the selected color and line width: The blue squares on the line are the mouse dragging points to change position or size of the object. In case of the line object the center point will let you change the position of the line, the points at the ends of the line let you move the end points of the line to any position in the window. Change the color to "Cyan" and press the button "Draw Ellipse". Move the mouse to the center of the ellipse until the cursor changes to the cross, then press the left mouse button and move the ellipse to the head of the player. Enlarge the ellipse by moving the mouse to the top square of the ellipse, press left mouse button and move the mouse up/down to enlarge or shrink the ellipse in vertical direction. You can do the same for the horizontal direction on the right dragging point of the ellipse. To select another object just move the mouse to the center of the object until the cursor changes to the cross and then click the left mouse button. OR: Press the button Select Next Object to toggle the selection.
Page 74

Video
Ellipses:
• Center dragging point will move complete ellipse • Upper dragging point will stretch/shrink ellipse vertically • Right dragging point will stretch/shrink ellipse horizontally
Lines:
• Center dragging point will move complete line • Dragging points on line ends will move the line end points
and stretch or shrink the line • Button "Make Vertical" will force the line to be 100%
vertical • Button "Make Horizontal" will force the line to be 100%
horizontal Wedges for angle measurement:
• Dragging point above the number display will move the whole wedge object
• Dragging points on the line ends will move the line end points to new positions
• In the text field the angle between the two lines of the wedge will be displayed (0 to 180 degrees)
If there are overlay objects visible in recording mode the overlay will be saved to the recorded video clip. This is also true when you save a snapshot image, the overlay will be saved together with the image. If you want to be sure to save images or video without overlay you have to delete the overlay objects before saving an image or recording a video.
4.9.4 Video recording settings The configuration of the video recording in conjunction with the putt recording is described in chapter 4.3.3.
Page 75

Viewing the Results
4.10 Viewing the Results The results are presented in graphic Reports, there are two main options to present the Reports: 4.10.1 Print Report view Print reports are not available in the SAM PuttWare Basic edition! The Print report view shows the Report as multi page document in portrait format. It is good for direct printout or to save a Report as a PDF file. To open a Print Report click on the "Print" symbol in the toolbar of the main program window:
The report selection dialog will open and let you select one of the available Reports:
After selection of the desired Report and pressing the "OK" button the report will open in the print report view. In the print report view window you can browse between the pages by using the scrollbar or the page up / page down keys. Also it is possible to zoom into the Report. Toolbar function description:
Prints the current Report Shows a print preview page Let you open a second dataset in the same report view. This allows a direct result comparison. Saves the current report to a PDF document
Page 76

Viewing the Results
Creates a "on the fly" PDF document and allows to send this directly by email Switches the mouse to the zoom in cursor – each mouse click on the Report will zoom in then Switches the mouse to the zoom out cursor – each mouse click on the Report will zoom out then Zooms to full page display Zooms to full width display Zoom factor 33% Zoom factor 50% Zoom factor 100% Closes the Report view window
For further details about the content of the report pages and explanations of the graphics please read the document " Reports Manual" or look up the chapter "Reports" in the online help (F1 key).
Page 77

Viewing the Results
4.10.2 Direct Report emailing
Direct emailing of reports is a new feature in SAM PuttLab 2008. In the print report window the currently open report can be directly send by email as a PDF attachment. Press the button with the email symbol to start the process:
If there is already a email address available for the player used in this report this address will be automatically used for the email. If not, a dialog will prompt you for input of a valid email address. A complete email with the report PDF attached should now open up in your email client program. You can add further addresses, change the subject or body text and send the email. Configuring default subject and body text: There are specific settings available to change the default subject and body text of the report email module. So you can use your own texts and even the player's names in your emails. Please go to 4.3.2 to read how to define individual text for the emails.
The report email module will use your installed email client program to send the email. Be sure to have a email client software installed and set up a user account properly. Email Client programs that work with SAM PuttLab are for example: Outlook, Outlook Express, Mozilla Thunderbird and the Windows Email program of Windows Vista. To test if it is possible for SAM PuttLab to send emails via the email client program there is a test function available: Go to the "Setup" section in the main menu and then to the option "Test email client". A dialog opens with a given email address "[email protected]" . You can also use any other valid email address for the test. Press "Test Sendmail via Email Client" and your installed standard email program should open up showing you a pre-configured email. If this does not happen the SAM PuttLab is not able to open your email program and you will not be able to send reports emails. It is recommended to check the functionality of your email client program in this case.
Page 78

Viewing the Results
4.10.3 Screen Report view The Screen report view shows the Reports as single pages in landscape format. The presentation of the results is pretty much the same as in the training screen. This Report view does not have a print function, but the layout is optimized for screen display. To open a Screen Report click on the "Screen" symbol in the toolbar of the main program window:
In the screen report window you can browse between the single report pages by using the buttons on the right screen border. You can also step to the next or previous page by using the arrow up / down keys. The currently visible page can be saved as a bitmap image to the disk drive or copied into the windows clipboard (Ctrl + c). It is also possible to browse through the single putt strokes and even to delete strokes from the current dataset. See the following descriptions for details on how to delete strokes. Toolbar function description:
Saves the current page as bitmap graphics file Copies the current page graphics to the windows clipboard Browse one page up in the report page list Browse one page down in the report page list Shows all available putts from the current dataset Switches the display to only one putt from the current dataset. In this case the following buttons will be enabled and it is possible to browse through the single putts by using the forward / backward buttons or the slider. Step one putt backwards - only active for single putt display Step one putt forwards - only active for single putt display Delete the current visible putt stroke - only active for single putt display. After closing the screen report window you will be asked to confirm the deletion of the putts Opens the 3D putt replay window for the current dataset.
Page 79

Viewing the Results
Opens video clips attached to this dataset. If there are no videos available the button will be disabled. Closes the screen report window
When the single putt mode is activated, the info bar shows information about the current displayed stroke:
Page 80
currently displayed
putt slider bar for easy
putt selection
For further details about the content of the report pages and explanations of the graphics please read the document "Reports Manual" or look up the chapter "Reports" in the online help (F1 key).

Viewing the Results
4.10.4 Competence Profile Reports Profile reports are not available in the SAM PuttWare Basic edition! The program also provides two so called "Competence profile reports". These reports show a rating for the average performance and the consistency for the 8 main parameters. All ratings are in percent and based on the performance of the Science&Motion database of over 100 tour professionals, mainly from the European PGA Tour. At the end of the reports an "over-all rating" will be printed out for the categories Technique, Timing, Consistency and Over-All. This gives a quick overview about the performance. To open a "Competence profile report" click on the "Profile" symbol in the toolbar of the main program window:
There are two competence reports available: • Personal Competence Profile
Shows the profile for the currently selected dataset on one page. • Multi Competence Profile
This allows the direct comparison of up to 8 datasets in one report. This is a great feature to compare players or to use this for putter evaluation and selection.
The profile reports will open in the print report view, see chapter 3.8.1 to learn which features this window offers.
For further details about the content of the report pages and explanations of the graphics please read the document "Reports Manual" or look up the chapter "Reports" in the online help (F1 key).
Page 81

Viewing the Results
4.10.5 Individual report logos
Individual report logos are new in PuttLab 2008 This feature allows to define different logo graphics in bitmap format (BMP) and easily load them to the print reports header area. The logos will automatically be placed in the upper left corner of each report page:
The size of the logo will be 8 cm width and 4 cm height (on the printed page). Features of the SAM PuttLab 2008 report logo module:
• Storage of unlimited number of different logos in the software for later usage • Logo import function with preview and quality check • Easily selection of currently active logo with preview
How to create report logos: The logos have to be in the Windows bitmap format (BMP). Any graphics program like Windows Paint, Corel PhotoPaint many others can save graphics in this format. To get a good printing quality the graphics should be in 300 dpi resolution. For the size of 8 x 4 cm (or 3 x 1.5 inches) this means the ideal size in pixel would be: 945 x 471 (width x height). The ratio of width to height should be 2 to 1 for optimum display size. Page 82
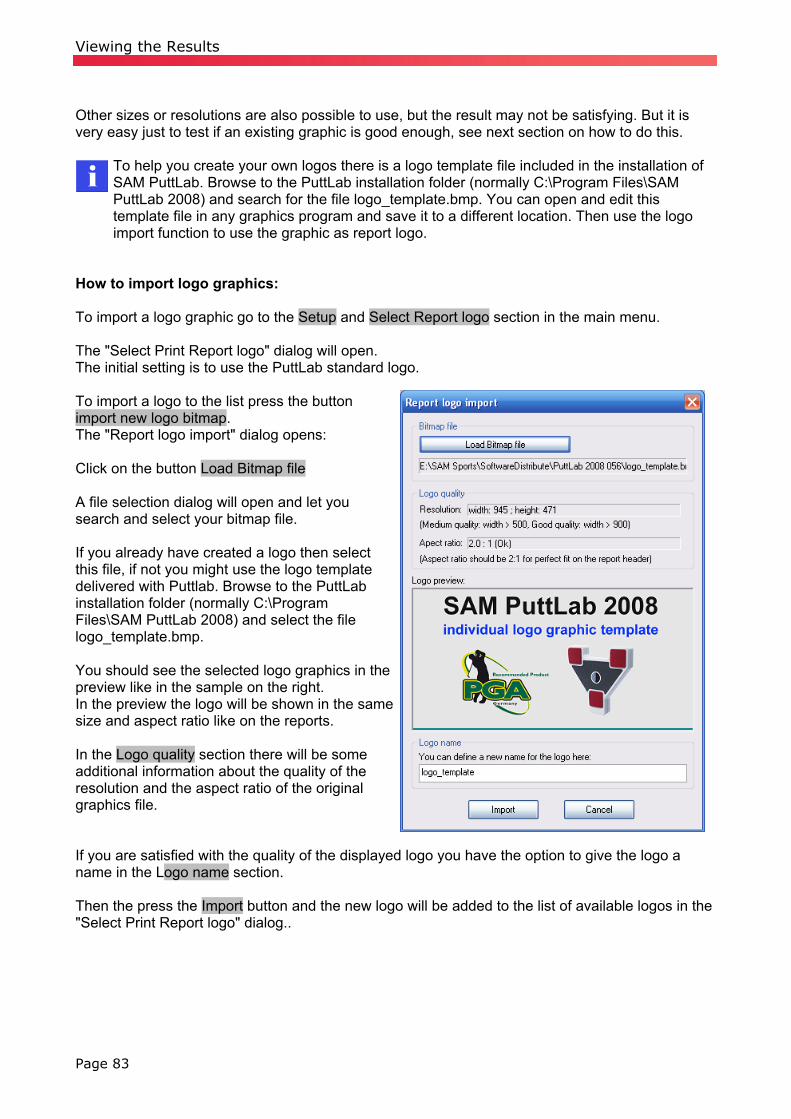
Viewing the Results
Other sizes or resolutions are also possible to use, but the result may not be satisfying. But it is very easy just to test if an existing graphic is good enough, see next section on how to do this.
To help you create your own logos there is a logo template file included in the installation of SAM PuttLab. Browse to the PuttLab installation folder (normally C:\Program Files\SAM PuttLab 2008) and search for the file logo_template.bmp. You can open and edit this template file in any graphics program and save it to a different location. Then use the logo import function to use the graphic as report logo.
How to import logo graphics: To import a logo graphic go to the Setup and Select Report logo section in the main menu. The "Select Print Report logo" dialog will open. The initial setting is to use the PuttLab standard logo. To import a logo to the list press the button import new logo bitmap. The "Report logo import" dialog opens: Click on the button Load Bitmap file A file selection dialog will open and let you search and select your bitmap file. If you already have created a logo then select this file, if not you might use the logo template delivered with Puttlab. Browse to the PuttLab installation folder (normally C:\Program Files\SAM PuttLab 2008) and select the file logo_template.bmp. You should see the selected logo graphics in the preview like in the sample on the right. In the preview the logo will be shown in the same size and aspect ratio like on the reports. In the Logo quality section there will be some additional information about the quality of the resolution and the aspect ratio of the original graphics file. If you are satisfied with the quality of the displayed logo you have the option to give the logo a name in the Logo name section. Then the press the Import button and the new logo will be added to the list of available logos in the "Select Print Report logo" dialog.. Page 83
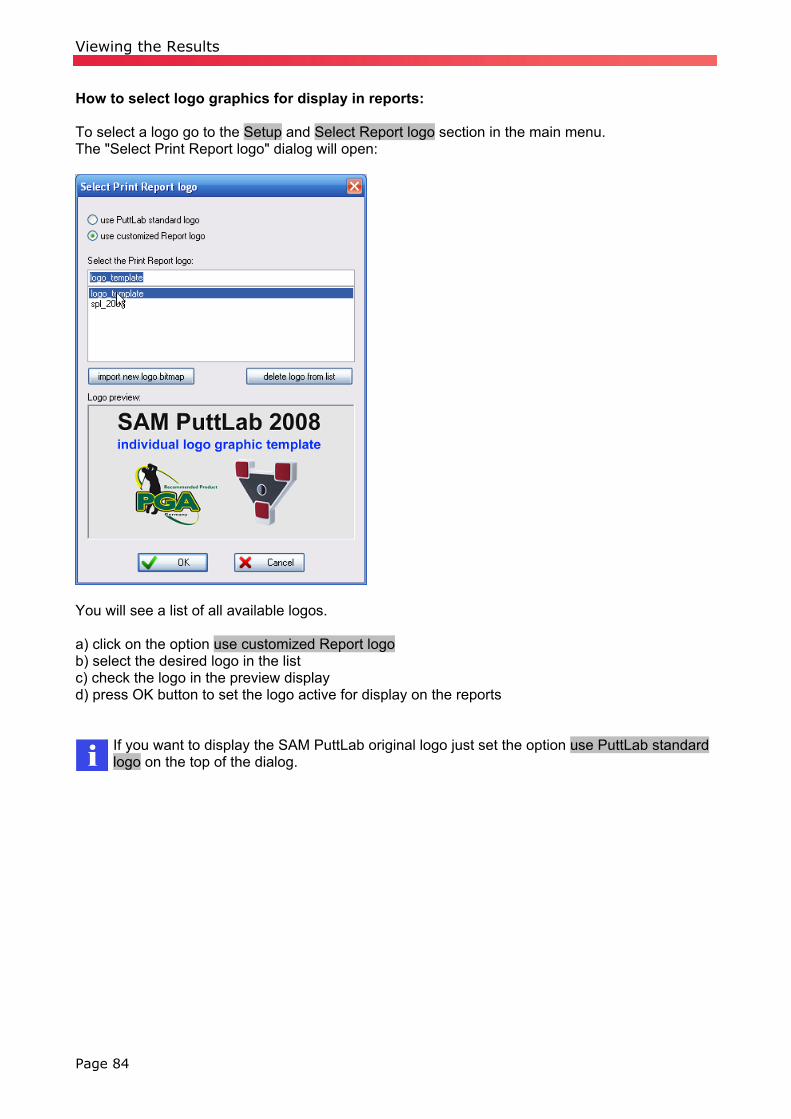
Viewing the Results
How to select logo graphics for display in reports: To select a logo go to the Setup and Select Report logo section in the main menu. The "Select Print Report logo" dialog will open:
You will see a list of all available logos. a) click on the option use customized Report logo b) select the desired logo in the list c) check the logo in the preview display d) press OK button to set the logo active for display on the reports
If you want to display the SAM PuttLab original logo just set the option use PuttLab standard logo on the top of the dialog.
Page 84

Games
4.11 Games Games are not available in the SAM PuttWare Basic edition!
Three games come with SAM PuttWare. They can be accessed via the "Games" icon in the toolbar or in the main menu under "Tools".
After starting the game module you will see the Games-Startup dialog:
Games-Startup screen Under "Game" you can choose between the three games "Sweetspot-Challenge", "Robin-Hood" and "Square it up". On the right side you can select how many players take part on the game and set their names. In the "Gameinfo" box you can see the Hi-Score list for the selected game. You can reset the Hi-Scores by clicking the "Reset Hi-Scores"-button.
Page 85
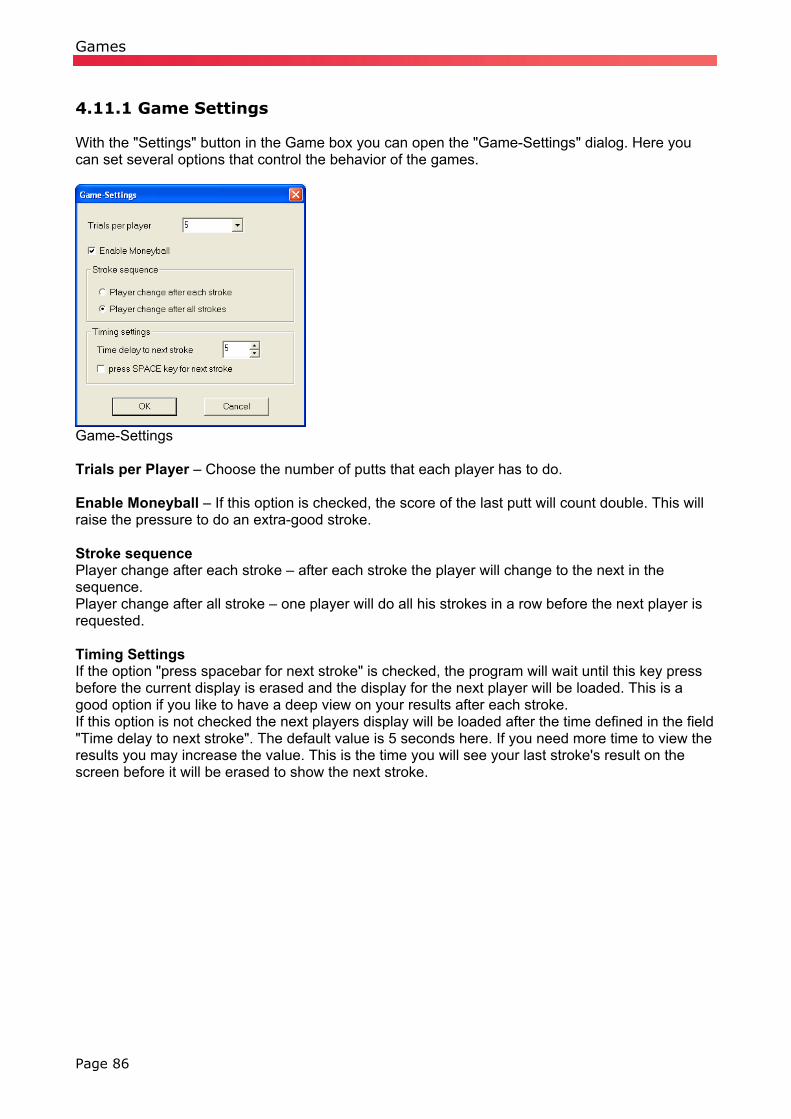
Games
4.11.1 Game Settings With the "Settings" button in the Game box you can open the "Game-Settings" dialog. Here you can set several options that control the behavior of the games.
Game-Settings Trials per Player – Choose the number of putts that each player has to do. Enable Moneyball – If this option is checked, the score of the last putt will count double. This will raise the pressure to do an extra-good stroke. Stroke sequence Player change after each stroke – after each stroke the player will change to the next in the sequence. Player change after all stroke – one player will do all his strokes in a row before the next player is requested. Timing Settings If the option "press spacebar for next stroke" is checked, the program will wait until this key press before the current display is erased and the display for the next player will be loaded. This is a good option if you like to have a deep view on your results after each stroke. If this option is not checked the next players display will be loaded after the time defined in the field "Time delay to next stroke". The default value is 5 seconds here. If you need more time to view the results you may increase the value. This is the time you will see your last stroke's result on the screen before it will be erased to show the next stroke.
Page 86
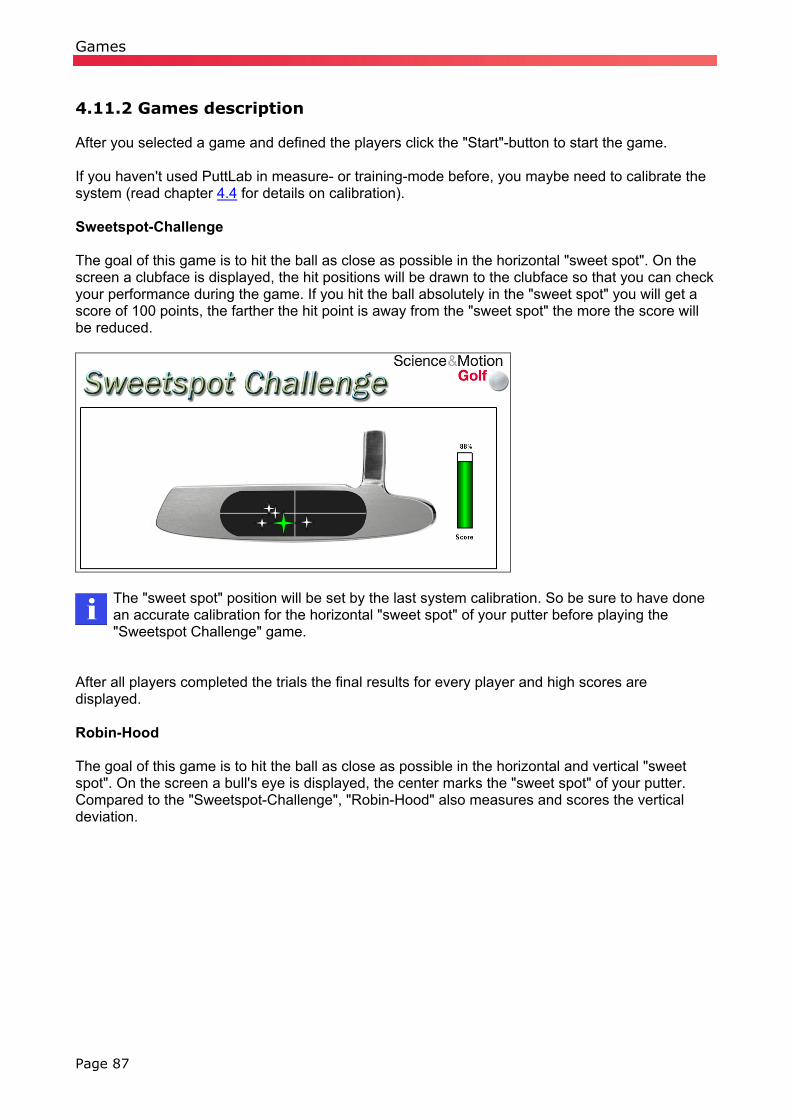
Games
4.11.2 Games description After you selected a game and defined the players click the "Start"-button to start the game. If you haven't used PuttLab in measure- or training-mode before, you maybe need to calibrate the system (read chapter 4.4 for details on calibration). Sweetspot-Challenge The goal of this game is to hit the ball as close as possible in the horizontal "sweet spot". On the screen a clubface is displayed, the hit positions will be drawn to the clubface so that you can check your performance during the game. If you hit the ball absolutely in the "sweet spot" you will get a score of 100 points, the farther the hit point is away from the "sweet spot" the more the score will be reduced.
The "sweet spot" position will be set by the last system calibration. So be sure to have done an accurate calibration for the horizontal "sweet spot" of your putter before playing the "Sweetspot Challenge" game.
After all players completed the trials the final results for every player and high scores are displayed. Robin-Hood The goal of this game is to hit the ball as close as possible in the horizontal and vertical "sweet spot". On the screen a bull's eye is displayed, the center marks the "sweet spot" of your putter. Compared to the "Sweetspot-Challenge", "Robin-Hood" also measures and scores the vertical deviation.
Page 87
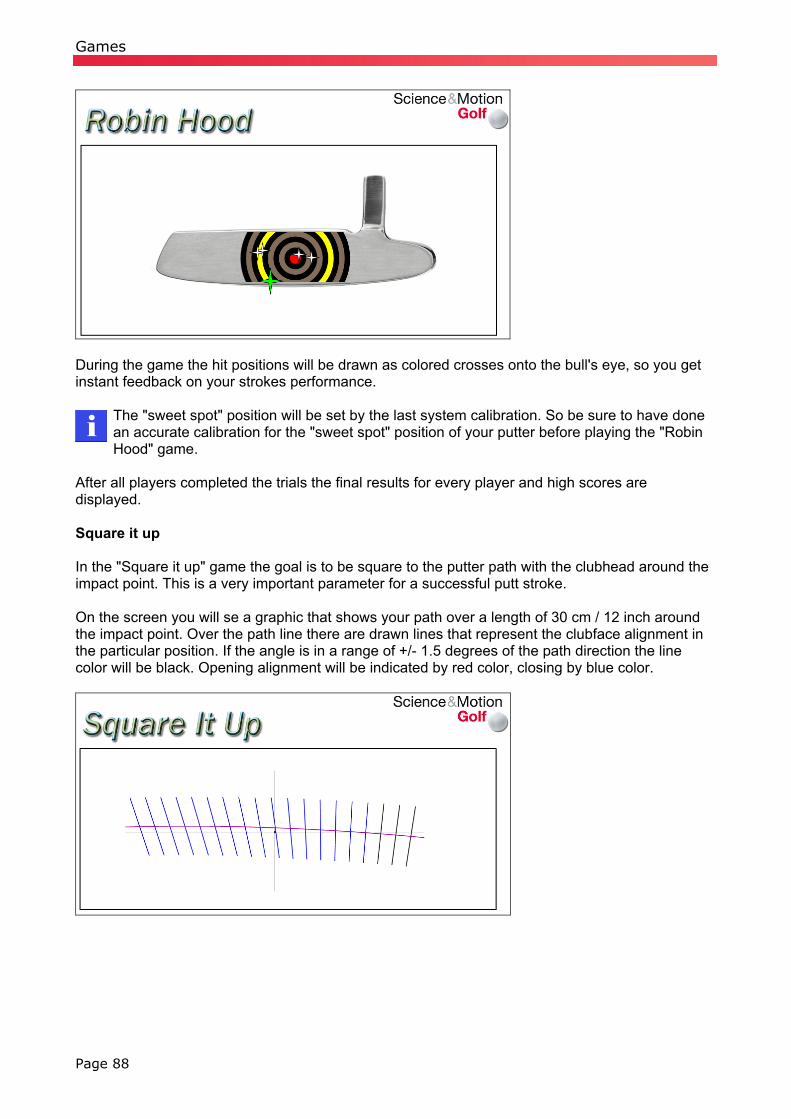
Games
During the game the hit positions will be drawn as colored crosses onto the bull's eye, so you get instant feedback on your strokes performance.
The "sweet spot" position will be set by the last system calibration. So be sure to have done an accurate calibration for the "sweet spot" position of your putter before playing the "Robin Hood" game.
After all players completed the trials the final results for every player and high scores are displayed. Square it up In the "Square it up" game the goal is to be square to the putter path with the clubhead around the impact point. This is a very important parameter for a successful putt stroke. On the screen you will se a graphic that shows your path over a length of 30 cm / 12 inch around the impact point. Over the path line there are drawn lines that represent the clubface alignment in the particular position. If the angle is in a range of +/- 1.5 degrees of the path direction the line color will be black. Opening alignment will be indicated by red color, closing by blue color.
Page 88
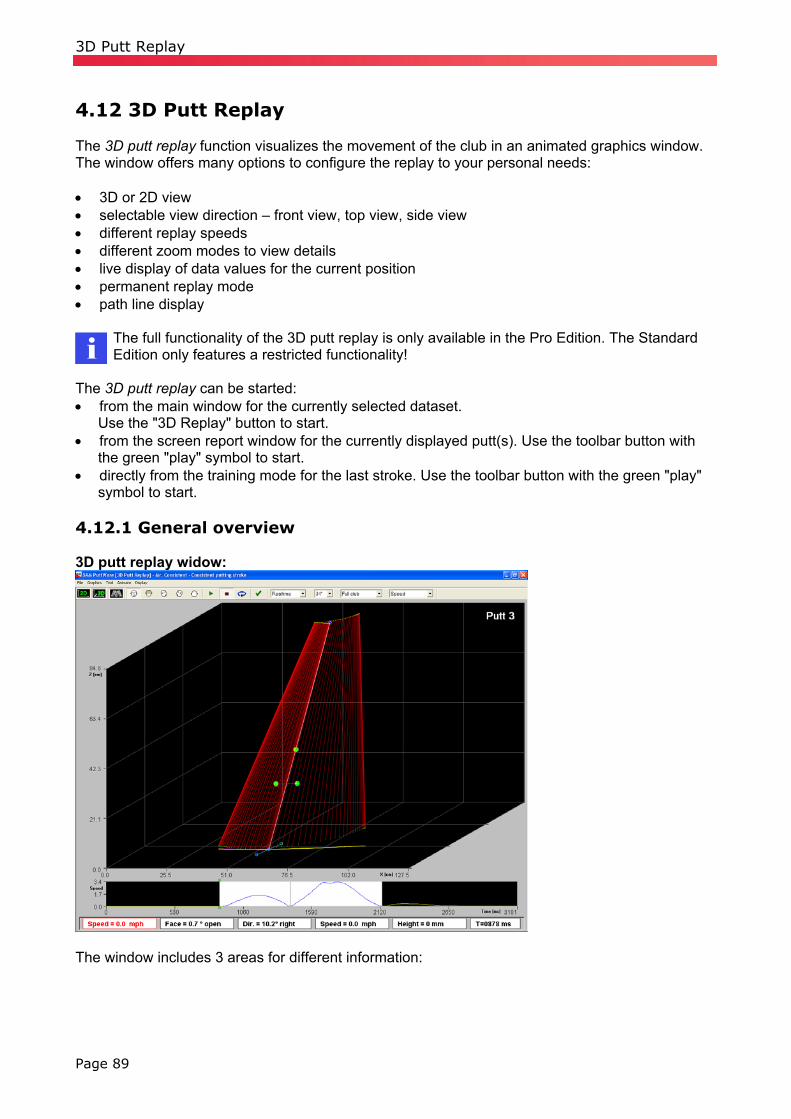
3D Putt Replay
4.12 3D Putt Replay The 3D putt replay function visualizes the movement of the club in an animated graphics window. The window offers many options to configure the replay to your personal needs: • 3D or 2D view • selectable view direction – front view, top view, side view • different replay speeds • different zoom modes to view details • live display of data values for the current position • permanent replay mode • path line display
The full functionality of the 3D putt replay is only available in the Pro Edition. The Standard Edition only features a restricted functionality!
The 3D putt replay can be started: • from the main window for the currently selected dataset.
Use the "3D Replay" button to start. • from the screen report window for the currently displayed putt(s). Use the toolbar button with
the green "play" symbol to start. • directly from the training mode for the last stroke. Use the toolbar button with the green "play"
symbol to start. 4.12.1 General overview 3D putt replay widow:
The window includes 3 areas for different information:
Page 89
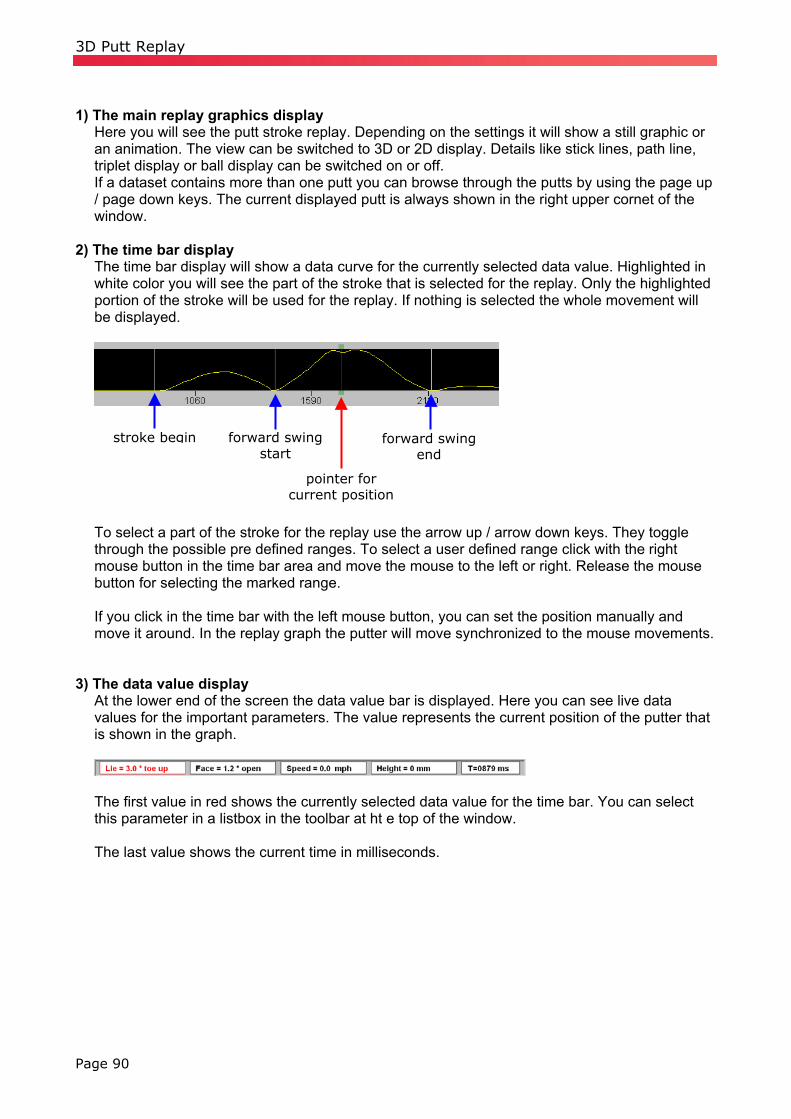
3D Putt Replay
1) The main replay graphics display
Here you will see the putt stroke replay. Depending on the settings it will show a still graphic or an animation. The view can be switched to 3D or 2D display. Details like stick lines, path line, triplet display or ball display can be switched on or off. If a dataset contains more than one putt you can browse through the putts by using the page up / page down keys. The current displayed putt is always shown in the right upper cornet of the window.
2) The time bar display The time bar display will show a data curve for the currently selected data value. Highlighted in white color you will see the part of the stroke that is selected for the replay. Only the highlighted portion of the stroke will be used for the replay. If nothing is selected the whole movement will be displayed.
n forward swing forward swing
Tothmbu If m
3) ThAtvais
Thth Th
Page
stroke begi
start endpointer for current position
select a part of the stroke for the replay use the arrow up / arrow down keys. They toggle rough the possible pre defined ranges. To select a user defined range click with the right ouse button in the time bar area and move the mouse to the left or right. Release the mouse tton for selecting the marked range.
you click in the time bar with the left mouse button, you can set the position manually and ove it around. In the replay graph the putter will move synchronized to the mouse movements.
e data value display the lower end of the screen the data value bar is displayed. Here you can see live data lues for the important parameters. The value represents the current position of the putter that shown in the graph.
e first value in red shows the currently selected data value for the time bar. You can select is parameter in a listbox in the toolbar at ht e top of the window.
e last value shows the current time in milliseconds.
90

3D Putt Replay
4.12.2 Functional description Toolbar options:
Switch to 2D view Switch to 3D view Activate stick lines – lines for the putter positions will stay visible to show the whole movement pattern. Front view – look from position in front of the player Back view – look from position behind the player Side view right – look from position right of the player Only available in Pro Edition Side view left – look from position left of the player Only available in Pro Edition Top view – look from position above the player Only available in Pro Edition Start replay animation Stop replay animation Activate endless play mode – replay will start again until "Stop" is pressed. Close the 3D replay window.
Page 91

3D Putt Replay
Description of the listbox options 1) Replay speed
Here you can specify the replay speed of the animation. "Realtime" means this is the original speed of the putt – in most cases this would be too fast to see what really is happening during the stroke. The default setting is "Slow".
2) Putter length
To ensure a realistic display of the putter you can select the shaft length in this listbox.
3) Zoom mode Only available in Pro Edition
In this selection you can specify the zoom mode for the replay display. "Full Club" means that the putter is displayed in full shaft length. "Half club" will show only the half of the shaft length – you will see a bigger view of the club head in this case. "Club head" means that the display is reduced to the club head and a very small portion of the shaft – very detailed view of the club head. "Double club" – this is a special view where the shaft is virtually extended to double length. The crossing of the lines will show if the putt stroke has a pendulum characteristic or if the putter movement is more a "shift" from left to right.
4) data value selection Only available in Pro Edition
One parameter value out of this list can be selected for additional display in the "data value display".
Page 92
You will then see the actual value for this parameter in the leftmost field of the data value display line. Additionally the selected parameter wilöl be printed as data curve to the "time bar display".

Data management
Page 93
4.13 Data management Data management is very important if multiple people are using one SAM PuttLab, for example for long term training purposes. With a proper data management setup it will be easy to analyze, compare or printout data taken from several Players over the time. The data management in SAM PuttWare consists of four main data levels:
1. Projects: This is the top level layer of the Data Management. A Project can hold multiple Players. You need to create Projects to separate different sets of Players.
2. Players: Players will contain all the data recorded during measurement- and training sessions. So every measurement or a training session will be assigned to the currently selected Player (and Project).
3. Sessions: A Session is a container for putting data and attachments. So it is possible to bundle together putting data with files and information. The attached files can be videos, audio files, PDF files, pictures or just text documents. Sessions will be started automatically on start of a measurement or training – so the user does not have to deal with creating sessions.
4. Measurement data sets: One Player can hold up to 999 data sets of measurement or training sessions. Every data set can hold up to 99 strokes, so it is possible to store over 98000 putt strokes for one Player. The content of the data sets can be viewed on the screen or printed out (via reports) and exported (to a PDF document or database).
So it's easy to keep an overview of all the data you recorded during weeks or months of training if you know how to set up your data management in an effective way. The "SAM Wizard" helped you to create your first Project and Player when you started SAM PuttWare for the first time. Now it's time to manage everything by yourself… 4.13.1 How to set up the data management in a practical way The main rule is to create a Player for every person that should be working with SAM PuttLab. All the data from the recordings of this person are stored into this Player (if it is selected before). It is possible to create all persons in one Project, but there are some reasons why it may be better to split the data to multiple Projects:
• Special events – If you use the SAM PuttLab for a special event, like a presentation or a tournament it might be good to have the data of this event inside one separated Project.
• Big amount of Players – If you plan to record data from over 100 Players it would make
sense to split these Players to multiple Projects because otherwise the data handling will be very complex (e.g. very long listbox for Player selection).

Data management
• Multiple instructors – If multiple instructors use the system for their training it will make sense to have at least one Project for every instructor to avoid mixing up of the data. In this case the Project name can be the name of the instructor, so it will be a clear structure.
So the setup of the data management depends also on how the system is used. It is possible to have the same Player names in different Projects, but these Players are then completely independent from each other. 4.13.2 Media file attachments
Media file attachments are a new feature of SAM PuttLab 2008. The "Media File Attachment" feature allows to add and archive any media or document files to your putt sessions easily. The different types of files will be detected automatically and can be opened just by clicking with the mouse. The files can be: • Video files (avi, wmv, mpeg etc.) • Audio files (wav, mp3) • Pictures (jpg, bmp, etc.) • Documents (pdf, doc, txt) • Any other files you like to archive with your putting sessions Examples how to use the feature: • Easily add text comments or pictures to your training sessions This will be a great help
remembering players and situations when you look up the data later in the future. • Add videos for each putt and also get information on body movement together with the PuttLab
recorded data. Screenshot of "Media Files" section:
Page 94
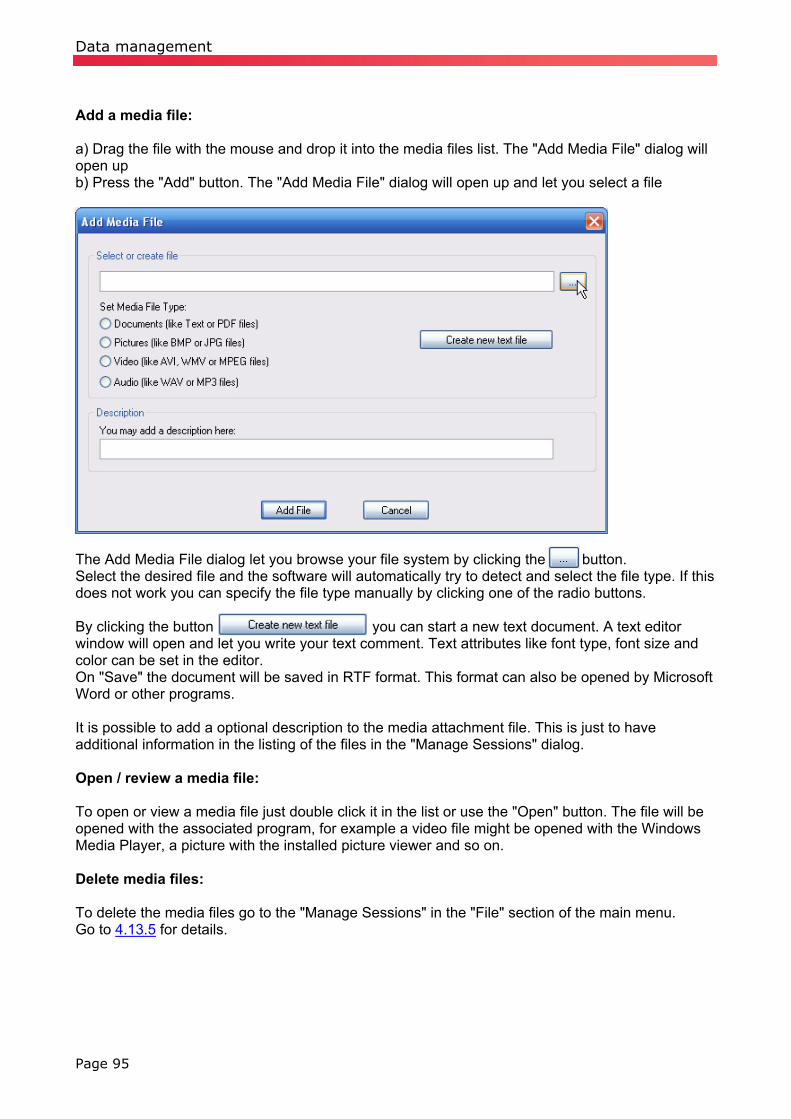
Data management
Add a media file: a) Drag the file with the mouse and drop it into the media files list. The "Add Media File" dialog will open up b) Press the "Add" button. The "Add Media File" dialog will open up and let you select a file
The Add Media File dialog let you browse your file system by clicking the button. Select the desired file and the software will automatically try to detect and select the file type. If this does not work you can specify the file type manually by clicking one of the radio buttons. By clicking the button you can start a new text document. A text editor window will open and let you write your text comment. Text attributes like font type, font size and color can be set in the editor. On "Save" the document will be saved in RTF format. This format can also be opened by Microsoft Word or other programs. It is possible to add a optional description to the media attachment file. This is just to have additional information in the listing of the files in the "Manage Sessions" dialog. Open / review a media file: To open or view a media file just double click it in the list or use the "Open" button. The file will be opened with the associated program, for example a video file might be opened with the Windows Media Player, a picture with the installed picture viewer and so on. Delete media files: To delete the media files go to the "Manage Sessions" in the "File" section of the main menu. Go to 4.13.5 for details.
Page 95

Data management
4.13.3 Project management To enter the "Manage projects"-windows just press [F2] or access it from the main menu by
choosing "File" and "Manage projects". Manage Projects window Explanation of the Project view: In the table view you will see a list of all your available Projects. Project Name of the Project Description Description of the Project # Players Number of Players within this Project Password no: the project is not password protected, yes: the Project is password protected
Add / Create a new Project By clicking on the "Add" button you can create a new Project. The following window appears:
Give your Projects a meaningful name in order to easily find players or data sets later. Good Project management is essential, especially in training schools. Additionally, you can give your new Project a short description (optional).
Create new project
Page 96
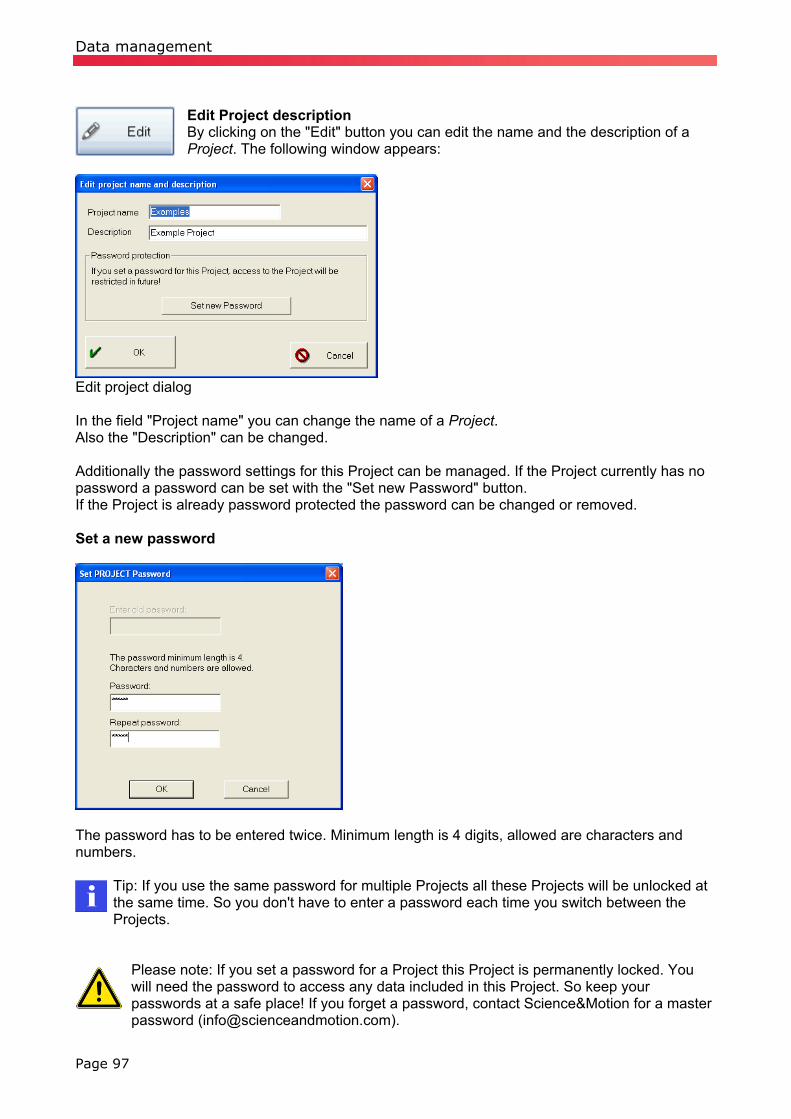
Data management
Edit Project description By clicking on the "Edit" button you can edit the name and the description of a Project. The following window appears:
Edit project dialog In the field "Project name" you can change the name of a Project. Also the "Description" can be changed. Additionally the password settings for this Project can be managed. If the Project currently has no password a password can be set with the "Set new Password" button. If the Project is already password protected the password can be changed or removed. Set a new password
The password has to be entered twice. Minimum length is 4 digits, allowed are characters and numbers.
Tip: If you use the same password for multiple Projects all these Projects will be unlocked at the same time. So you don't have to enter a password each time you switch between the Projects.
Please note: If you set a password for a Project this Project is permanently locked. You will need the password to access any data included in this Project. So keep your passwords at a safe place! If you forget a password, contact Science&Motion for a master password ([email protected]).
Page 97

Data management
Change or remove a Project password To change or remove a password go to the Project Management, select the Project and choose "Edit". The following dialog will open:
To change the password first enter the old password and then two times the new password. Minimum length is 4 digits, allowed are characters and numbers. To remove a password enter the old password and leave the fields for the new password empty. Then press OK and the password is removed.
Delete a Project
With this button you can delete Projects. Projects must be empty before you can delete them. In the "Manage projects" window you can see how many Players are in a Project by means of the value below the "<#>"-symbol.
Close window
By clicking this button you will select the highlighted Project and return to the main menu.
Page 98
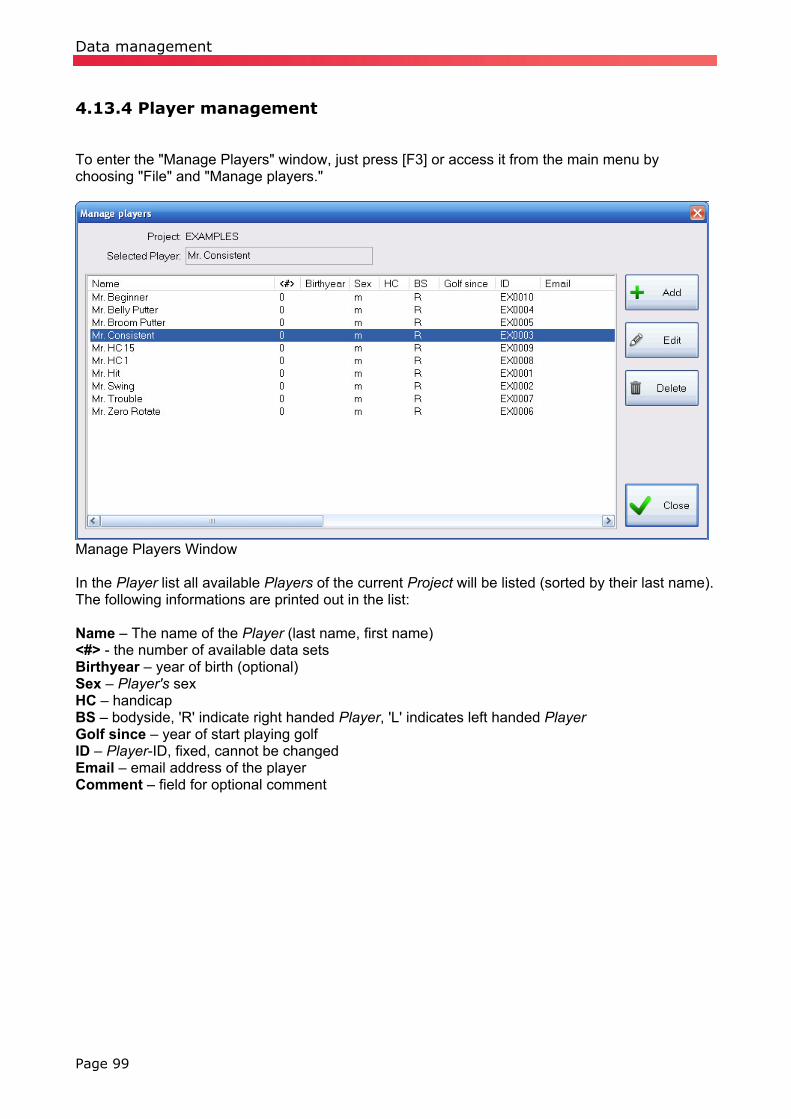
Data management
4.13.4 Player management To enter the "Manage Players" window, just press [F3] or access it from the main menu by choosing "File" and "Manage players."
Manage Players Window In the Player list all available Players of the current Project will be listed (sorted by their last name). The following informations are printed out in the list: Name – The name of the Player (last name, first name) <#> - the number of available data sets Birthyear – year of birth (optional) Sex – Player's sex HC – handicap BS – bodyside, 'R' indicate right handed Player, 'L' indicates left handed Player Golf since – year of start playing golf ID – Player-ID, fixed, cannot be changed Email – email address of the player Comment – field for optional comment
Page 99

Data management
Add / Create a new Player
By clicking on the "Add" button you can create a new Player. The following window appears:
"Create a new player" window In this window you can specify the name of the Player, sex, handicap, birth year, years playing and an additional comment. New fields specify some attributes of the putter: Shaft length, putter loft and putter lie.
The value for the putter loft is important because it is used in the calculation of the "ball spin" and launch conditions. If you do no input in this value on creating a new player the default value of 3 degrees putter loft will be used!
While creating a Player you also define if the Player is left-handed by checking the box "Lefthanded Player". In training and measurement the stroke recognition will be automatically flipped when you select a left-handed Player.
After you fill out the form, click "OK" to create the Player or to take over the changes.
Page 100
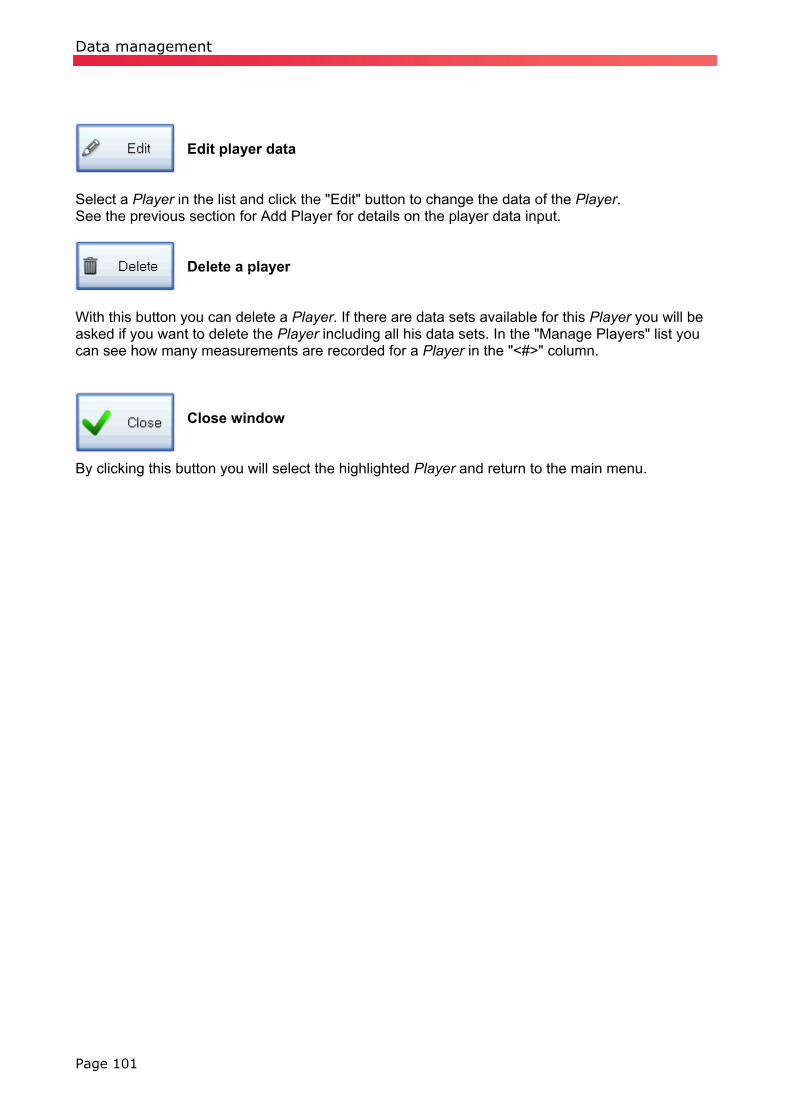
Data management
Edit player data
Select a Player in the list and click the "Edit" button to change the data of the Player. See the previous section for Add Player for details on the player data input.
Delete a player
With this button you can delete a Player. If there are data sets available for this Player you will be asked if you want to delete the Player including all his data sets. In the "Manage Players" list you can see how many measurements are recorded for a Player in the "<#>" column.
Close window
By clicking this button you will select the highlighted Player and return to the main menu.
Page 101

Data management
4.13.5 Session management
Sessions are containers to hold the putting data (measurements) and additional information like file media file attachments Measurements are the result data records that are generated in the Measurement and Training sessions. One Measurement can include result data from multiple strokes (up to 99).
To enter the "Manage Sessions" window just press [F4] or access it over the main menu by choosing "File" and "Manage Sessions."
"Manage Sessions" window
Page 102

Data management
The "Manage Sessions" dialog is splitted into 3 areas: a) Recording Sessions Recording Sessions itself can be edited or deleted.
Edit Session name or description
Delete selected Session including all measurement data and attachments.
b) Included Measurements Lists all Measurements included in the currently selected Session. Measurements can be edited or be deleted
Edit Measurement name and description. Also allows to change the value of the putter loft for this measurement subsequently:
The value for the putter loft is originally taken from the player data for each measurement and will then be stored into the measurement data. The value attached to the measurement data will be used for the calculation of the ball spin and launch in the side view report.
Delete selected measurement record.
c) Included Media Files Lists all Media Files attached to the currently selected Session. Files can be reviewed or deleted. Also new files can be added.
Page 103

Data management
4.13.6 Export result records The data export module of SAM PuttLab allows to export selected data sets into compressed ZIP files. This functionality can be used to either transfer data to different PuttLab installations or to backup data for later usage or recovery. There are 3 levels of data export available:
• Complete projects (including all data and attachments) • Complete players (including all data and attachments) • Single data sessions
How to export result records: Go to the section "Export data" in the main menu section "File". A dialog window will open up:
You have to choose what kind of data export you like to perform. a) export of complete projects
Page 104

Data management
In the left list you see all available projects. You can select projects and add one by one or you can select multiple projects in the left list and add all selected projects by "Add all". When you now press "Export" a "Save as" dialog will open up to let you define a file name and location for the resulting ZIP archive file. All player data included in the exported projects will be copied to this compressed file and can be restored later on the same or a different PuttLab installation (SAM Puttlab 2008 or newer).
Depending on the amount of measurements and also the number and size of attached media files the total size of all files to export may be very big. In this case you will see a warning that the export process may take a while to finish. The export process cannot be cancelled once it has started. So please be patient and wait until the process is finished!
b) export of complete players
In the left list you see all available players of the currently selected project. You can select players and add them one by one or you can select multiple players in the left list and add them all together by "Add all". When you now press "Export" a "Save as" dialog will open up to let you define a file name and location for the resulting ZIP archive file. All data of all players listed on the right side will be exported to this compressed file and can be restored later on the same or a different PuttLab installation (SAM Puttlab 2008 or newer).
Depending on the amount of measurements and also the number and size of attached media files the total size of all files to export may be very big. In this case you will see a warning that the export process may take a while to finish. The export process cannot be cancelled once it has started. So please be patient and wait until the process is finished!
Page 105

Data management
Exporting complete projects is the best way to backup your data. It is easy to even export all available projects into one export archive for easy full backup. It may be good to split into one file per project if there is a big amount of data available over time. So one file would be too big to hold all the data.
b) export selected data sessions
In the left list you see all available sessions of the currently selected project and player. You can select sessions and add them one by one or you can select multiple sessions in the left list and add them all together by "Add all". When you now press "Export" a "Save as" dialog will open up to let you define a file name and location for the resulting ZIP archive file. All data of all players listed on the right side will be exported to this compressed file and can be restored later on the same or a different PuttLab installation (SAM Puttlab 2008 or newer). The information to which project and player these sessions belong is also saved in the export file and can be recovered during the import process.
Depending on the amount of measurements and also the number and size of attached media files the total size of all files to export may be very big. In this case you will see a warning that the export process may take a while to finish. The export process cannot be cancelled once it has started. So please be patient and wait until the process is finished!
Please refer to 4.13.7 for information how to import data out of existing data export files.
Page 106

Data management
4.13.7 Import result records The result records import function allows to import result records out of previously created export files in the "cabinet" format. The import process will import the results contained in the file and also the original Player. The result records can be imported to an existing Project or to a new Project. How to import results: Go to the option "Import result records" in the main menu section "Tools". A dialog window will open up:
At the top of the dialog you can select the file to import:
Press the button and select a SAM Puttlab data export file (ZIP). Once a valid file is selected the software will analyse the content of the import file. This may take a while depending on the number of data files included in the archive. After this is finished you will see the content of the import archive in the fields for projects, players and sessions.
Page 107

Data management
Select projects to be imported: If there a projects available in the archive then they are listed in the left upper list field. If you click on one project you will see the included players in the players field on the right. If you select multiple projects on the left side you will not see any players, because in this case all the selected projects and the included players will be imported completely. So you always have the option to select portions of the data like single players or sessions for the import process. But you can also just select everything (all projects) that are included in the archive. Press "Import" to finally import the selected projects into your current SAM PuttLab installation.
Recovering all projects contained in a PuttLab data archive is very easy: Just click on "Select All" below the projects box on the top left and then press the "Import" button. This will exactly recover the complete content of the archive to your current PuttLab data.
Select players to be imported: If you click on one project in the left upper box you will see the included players in the players box on the right. You can choose to import all the available players including their data (Select All) or you can just select one or any number of players by clicking with the mouse. Press "Import" to finally import the selected players into your current SAM PuttLab installation. Select sessions to be imported: It is also possible to import one or multiple sessions. To do this select the project and the player containing the session. You should then see the available sessions listed in the session box. Select the desired session for import there. Then press the "Import" button and only the selected session will be imported. Import data to different projects By default the imported data will be added to the same project as the data was originally was associated with. But it is possible to add imported data to a different or newly created project also. Use the following option if you like to do this:
Check the box "Import the data to a different PROJECT" and select one project from the list or create a new project with the "Create new project" button. All the selected data will then be added to this project instead of the originally associated project.
If you selected an existing Project as target and the Player is already existing in this Project you will get a warning message. You can add the data records to this Player anyhow if you like to do this.
After the import process has finished, you can access the new imported result records in the "Data selection" bar.
Page 108

Keyboard-Shortcuts
Page 109
4.14 Keyboard-Shortcuts The Keyboard shortcuts can be used to navigate through SAM PuttWare without having to use a mouse. Main Menu N – create a new player M – start a Measurement T – start a Training F1 – display Online Help F2 – Project management F3 – Player management F4 – Session management F5 – start a Measurement F6 – start a Training F7 – open Screen Report dialog F8 – open Print Report dialog F9 – directly opens AM Print Report F10 – directly opens PRO Print Report Measurement / Training screen C – system calibration I – display Measurement log S – save data & exit Measurement Ctrl + F – switch Feedback sound on/off Backspace – delete last stroke Spacebar – start manual recording Enter – stop manual recording ESC – abort Measurement, discard recorded data Within the Training you can switch between the result views directly using the numerals 1 to 9 or browse through the views with the page up / page down or up / down keys.
Head and Wrist Measurement
5 SAM PuttLab Pro Features Features described in this chapter are only available in the SAM PuttLab Pro product edition! The Pro edition of SAM PuttLab includes the following extra features that will be described in this chapter: • additional data channel (for wrist or head movement measurement) • very detailed data analysis functions • data export to database file (dBase format) 5.1 Head and Wrist Measurement The additional sensor delivered with the SAM PuttLab Pro enables an additional data channel for measurements. By default there are 3 channels available on the Triplet to record the movement of the club. Since version 2.0 of the SAM PuttLab the additional sensor can be used for wrist/hand or head movement measurements. The next sections describes how to attach the sensor, how to execute measurement or training and how to open the special result reports for wrist and head measurement.
Attention: The sensor and the cable are build with extreme light weight materials, so be very careful in handling these parts. Never pull the sensor cable !
Page 110
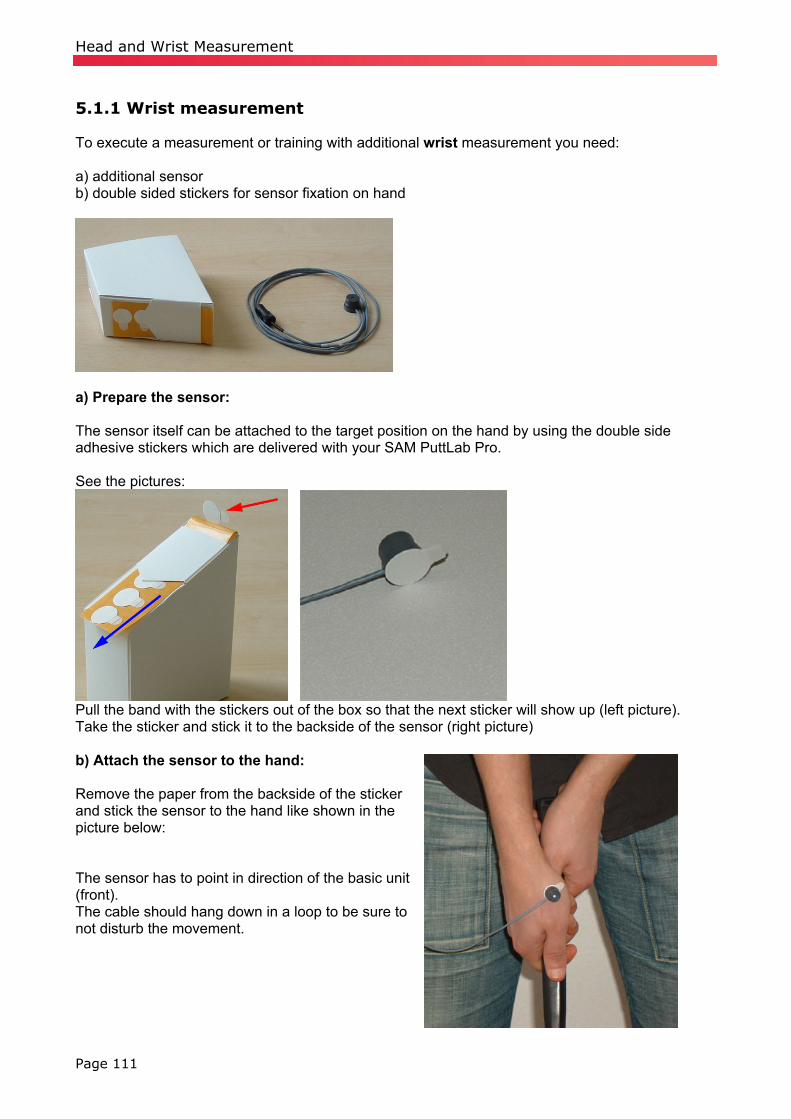
Head and Wrist Measurement
5.1.1 Wrist measurement To execute a measurement or training with additional wrist measurement you need: a) additional sensor b) double sided stickers for sensor fixation on hand
a) Prepare the sensor: The sensor itself can be attached to the target position on the hand by using the double side adhesive stickers which are delivered with your SAM PuttLab Pro. See the pictures:
Pull the band with the stickers out of the box so that the next sticker will show up (left picture). Take the sticker and stick it to the backside of the sensor (right picture) b) Attach the sensor to the hand: Remove the paper from the backside of the sticker and stick the sensor to the hand like shown in the picture below: The sensor has to point in direction of the basic unit (front). The cable should hang down in a loop to be sure to not disturb the movement.
Page 111

Head and Wrist Measurement
c) Connect sensor to battery clip: The plug at the other end of the sensor cable has to be plugged into the jack on the topside of the battery clip. See the following pictures:
Attention: When you remove the plug from the battery clip do not pull the cable itself. Only pull the plastic plug!
If the cable is too long, you can loop it around the battery clip one or two times like shown in the next picture:
Page 112

Head and Wrist Measurement
5.1.2 Head measurement To execute a measurement or training with additional head measurement you need: • additional sensor • SAM head band • double sided stickers for sensor fixation on head band
a) Prepare the sensor: The sensor itself should be attached to the target position on the head band by using the double side adhesive stickers which are delivered with your SAM PuttLab Pro. See the pictures:
Pull the band with the stickers in direction of the blue arrow until the next sticker shows up (left picture). Take the sticker and stick it to the backside of the sensor (right picture) Do not touch the adhesive area of the sticker to avoid poor sticking. b) Prepare the head band: The head band has a plastic plate which holds the sensor. On the side the band has three loops that hold the cable and lead it to the back of the head. The first step is to pull the cable through the loops so that the sensor is on the side of the plastic plate at the end.
Page 113

Head and Wrist Measurement
See the following picture:
Pull the cable through the two other loops as well:
Remove the paper from the backside of the sticker that is already attached to the sensor head and stick the sensor head onto the plastic plate like shown in the next picture:
Page 114
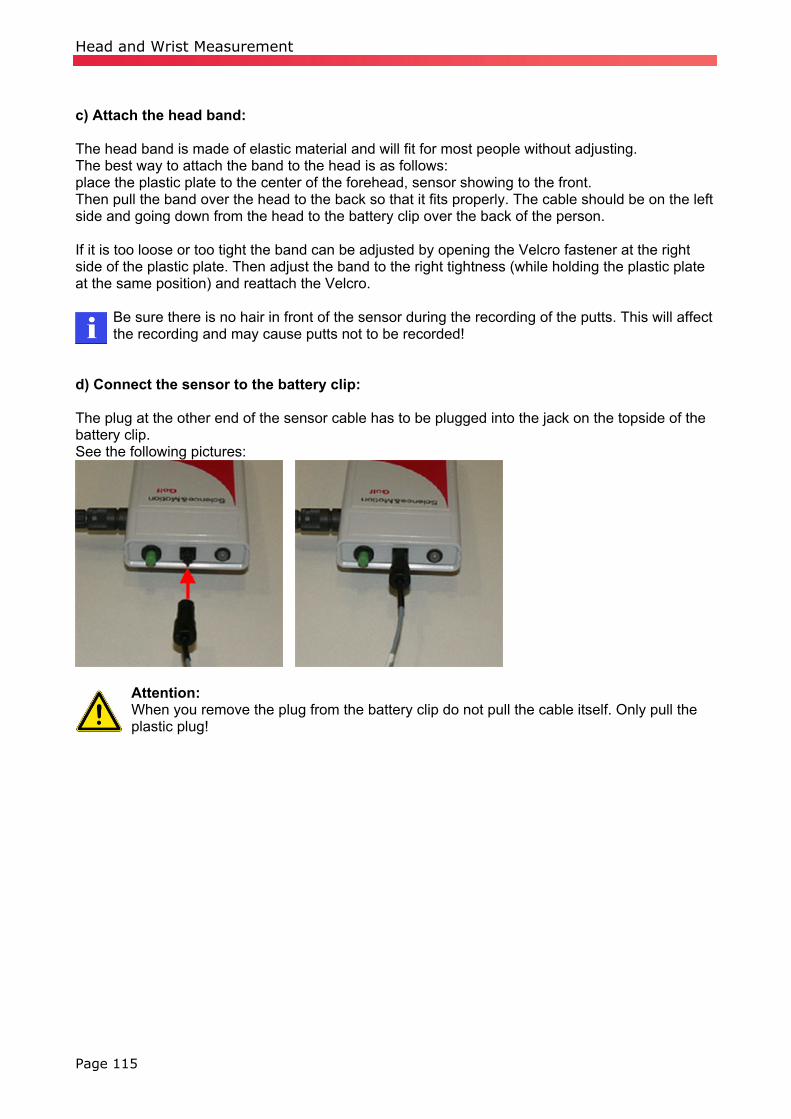
Head and Wrist Measurement
c) Attach the head band: The head band is made of elastic material and will fit for most people without adjusting. The best way to attach the band to the head is as follows: place the plastic plate to the center of the forehead, sensor showing to the front. Then pull the band over the head to the back so that it fits properly. The cable should be on the left side and going down from the head to the battery clip over the back of the person. If it is too loose or too tight the band can be adjusted by opening the Velcro fastener at the right side of the plastic plate. Then adjust the band to the right tightness (while holding the plastic plate at the same position) and reattach the Velcro.
Be sure there is no hair in front of the sensor during the recording of the putts. This will affect the recording and may cause putts not to be recorded!
d) Connect the sensor to the battery clip: The plug at the other end of the sensor cable has to be plugged into the jack on the topside of the battery clip. See the following pictures:
Attention: When you remove the plug from the battery clip do not pull the cable itself. Only pull the plastic plug!
Page 115
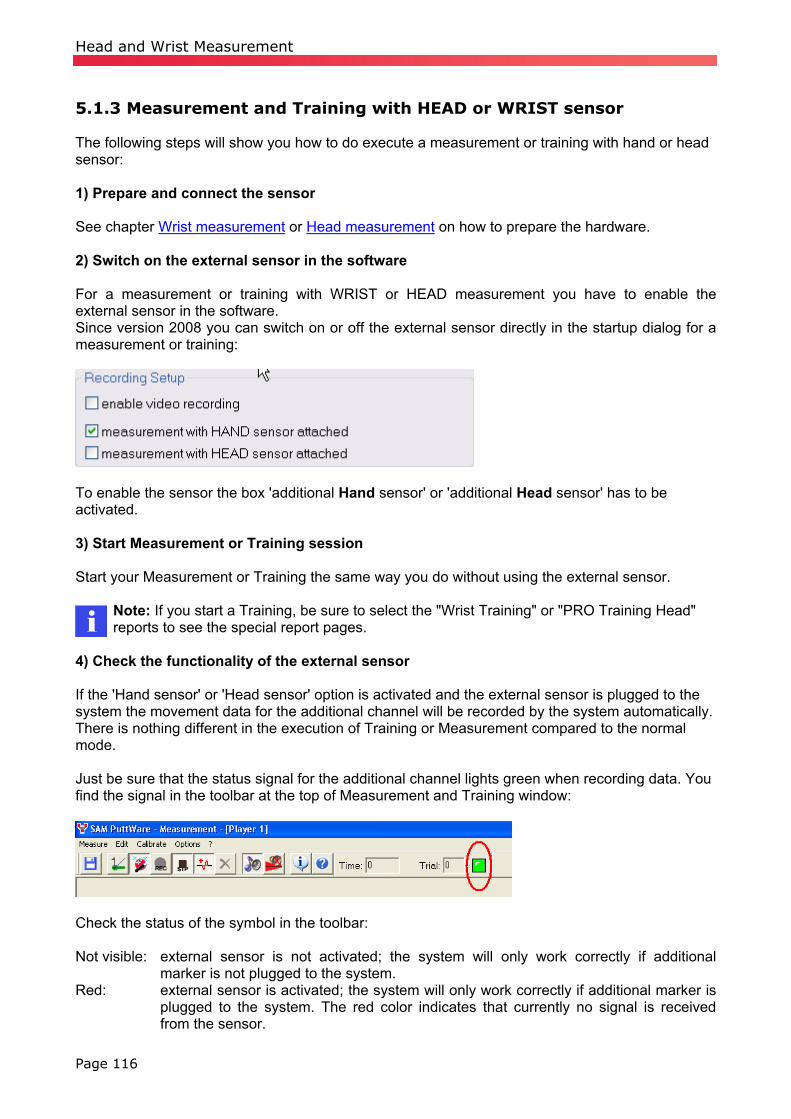
Head and Wrist Measurement
5.1.3 Measurement and Training with HEAD or WRIST sensor The following steps will show you how to do execute a measurement or training with hand or head sensor: 1) Prepare and connect the sensor See chapter Wrist measurement or Head measurement on how to prepare the hardware. 2) Switch on the external sensor in the software For a measurement or training with WRIST or HEAD measurement you have to enable the external sensor in the software. Since version 2008 you can switch on or off the external sensor directly in the startup dialog for a measurement or training:
To enable the sensor the box 'additional Hand sensor' or 'additional Head sensor' has to be activated. 3) Start Measurement or Training session Start your Measurement or Training the same way you do without using the external sensor.
Note: If you start a Training, be sure to select the "Wrist Training" or "PRO Training Head" reports to see the special report pages.
4) Check the functionality of the external sensor If the 'Hand sensor' or 'Head sensor' option is activated and the external sensor is plugged to the system the movement data for the additional channel will be recorded by the system automatically. There is nothing different in the execution of Training or Measurement compared to the normal mode. Just be sure that the status signal for the additional channel lights green when recording data. You find the signal in the toolbar at the top of Measurement and Training window:
Check the status of the symbol in the toolbar: Not visible: external sensor is not activated; the system will only work correctly if additional
marker is not plugged to the system. Red: external sensor is activated; the system will only work correctly if additional marker is
plugged to the system. The red color indicates that currently no signal is received from the sensor.
Page 116
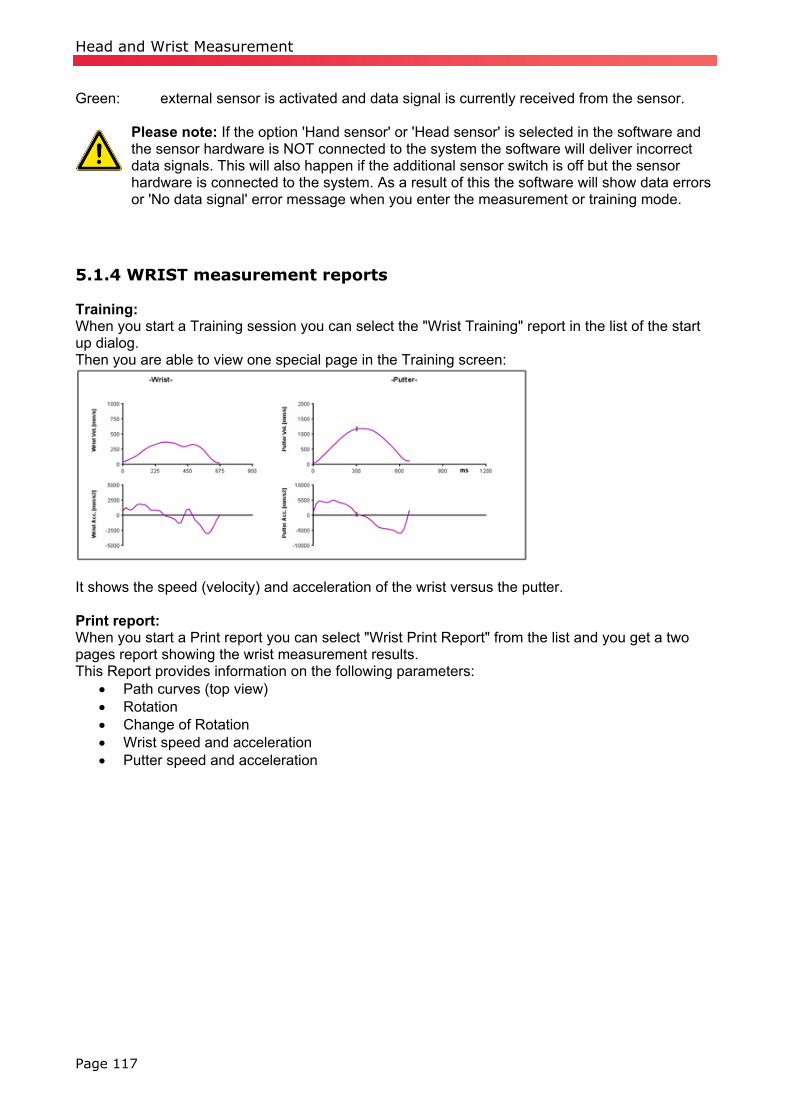
Head and Wrist Measurement
Green: external sensor is activated and data signal is currently received from the sensor.
Please note: If the option 'Hand sensor' or 'Head sensor' is selected in the software and the sensor hardware is NOT connected to the system the software will deliver incorrect data signals. This will also happen if the additional sensor switch is off but the sensor hardware is connected to the system. As a result of this the software will show data errors or 'No data signal' error message when you enter the measurement or training mode.
5.1.4 WRIST measurement reports Training: When you start a Training session you can select the "Wrist Training" report in the list of the start up dialog. Then you are able to view one special page in the Training screen:
It shows the speed (velocity) and acceleration of the wrist versus the putter. Print report: When you start a Print report you can select "Wrist Print Report" from the list and you get a two pages report showing the wrist measurement results. This Report provides information on the following parameters:
• Path curves (top view) • Rotation • Change of Rotation • Wrist speed and acceleration • Putter speed and acceleration
Page 117
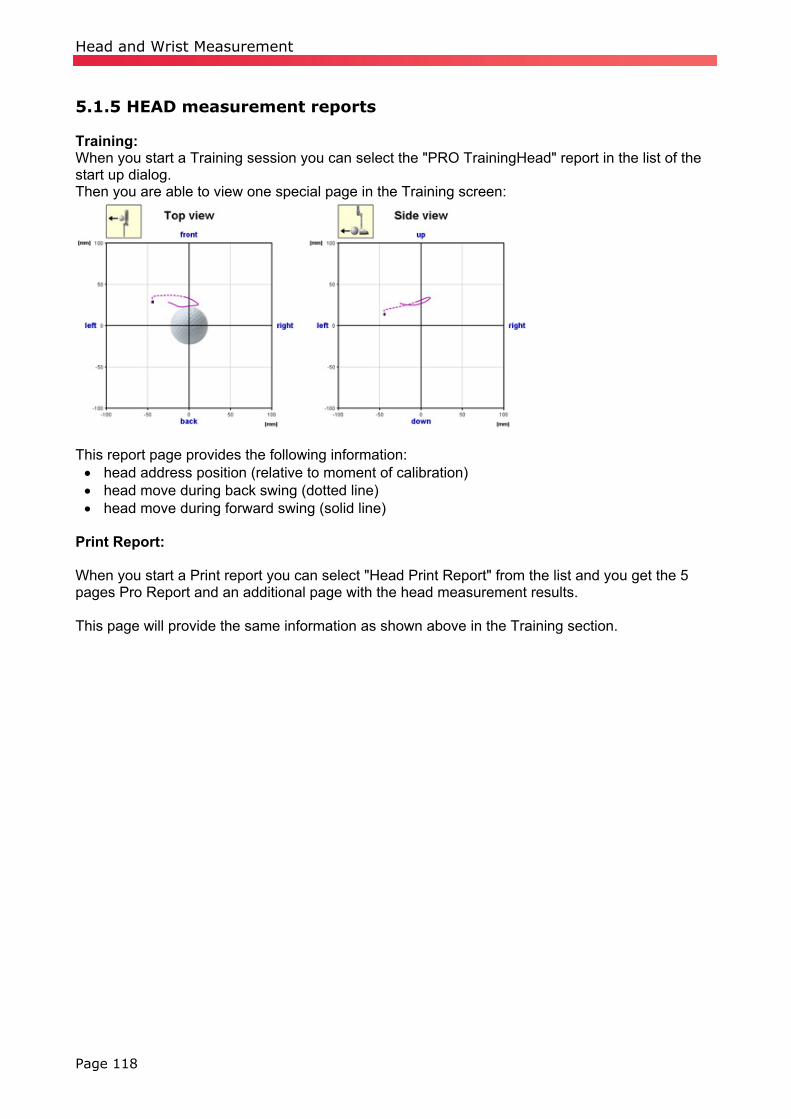
Head and Wrist Measurement
5.1.5 HEAD measurement reports Training: When you start a Training session you can select the "PRO TrainingHead" report in the list of the start up dialog. Then you are able to view one special page in the Training screen:
This report page provides the following information:
• head address position (relative to moment of calibration) • head move during back swing (dotted line) • head move during forward swing (solid line)
Print Report: When you start a Print report you can select "Head Print Report" from the list and you get the 5 pages Pro Report and an additional page with the head measurement results. This page will provide the same information as shown above in the Training section.
Page 118
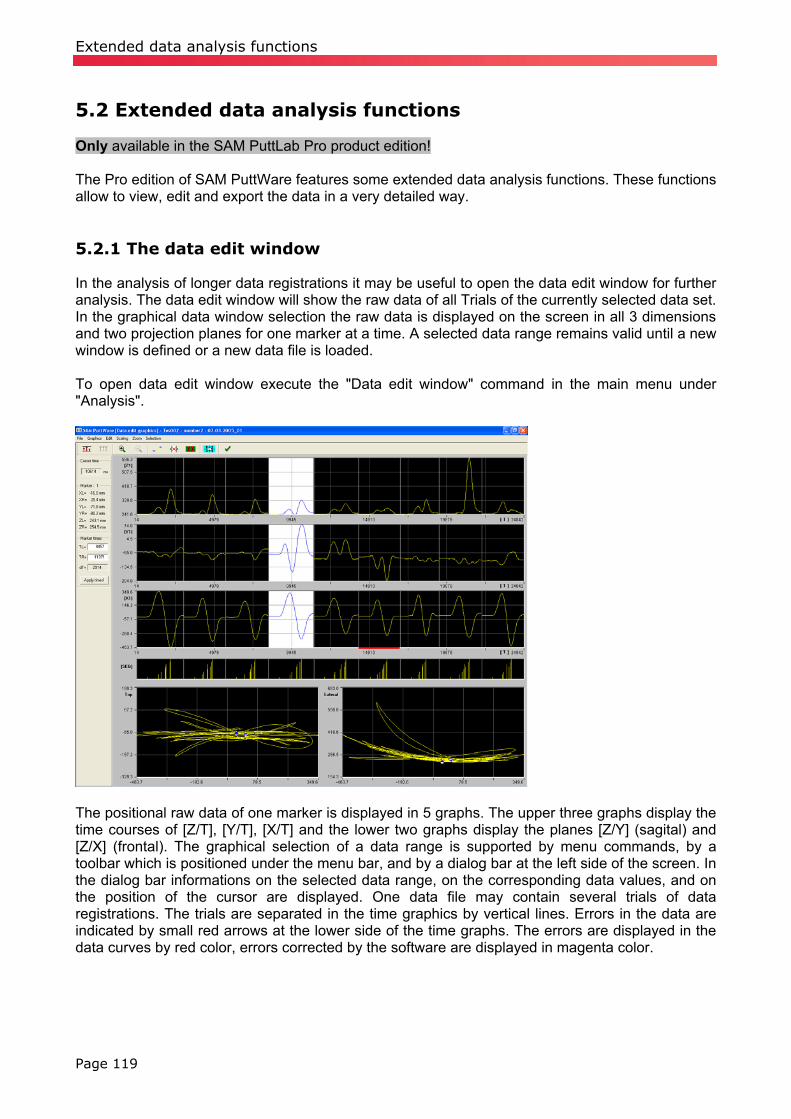
Extended data analysis functions
5.2 Extended data analysis functions Only available in the SAM PuttLab Pro product edition! The Pro edition of SAM PuttWare features some extended data analysis functions. These functions allow to view, edit and export the data in a very detailed way. 5.2.1 The data edit window In the analysis of longer data registrations it may be useful to open the data edit window for further analysis. The data edit window will show the raw data of all Trials of the currently selected data set. In the graphical data window selection the raw data is displayed on the screen in all 3 dimensions and two projection planes for one marker at a time. A selected data range remains valid until a new window is defined or a new data file is loaded. To open data edit window execute the "Data edit window" command in the main menu under "Analysis".
The positional raw data of one marker is displayed in 5 graphs. The upper three graphs display the time courses of [Z/T], [Y/T], [X/T] and the lower two graphs display the planes [Z/Y] (sagital) and [Z/X] (frontal). The graphical selection of a data range is supported by menu commands, by a toolbar which is positioned under the menu bar, and by a dialog bar at the left side of the screen. In the dialog bar informations on the selected data range, on the corresponding data values, and on the position of the cursor are displayed. One data file may contain several trials of data registrations. The trials are separated in the time graphics by vertical lines. Errors in the data are indicated by small red arrows at the lower side of the time graphs. The errors are displayed in the data curves by red color, errors corrected by the software are displayed in magenta color.
Page 119

Extended data analysis functions
Setting time marks A data range is selected by marking a data area with the mouse cursor. Therefore the mouse cursor has to be positioned in one of the upper time courses Z/T, Y/T or X/T. The selection mode can be switched between cursor selection and trial selection. Cursor selection A data window is marked by pressing the left mouse button at the start of the data range and then moving the mouse cursor with pressed mouse button to the end of the data range. The selected data range is displayed in an inverted color. In the two lower curves the position of the time marks are displayed by small circles. If the mouse cursor is moved over a selected data range, the selection can be adjusted by moving the mouse cursor with the left mouse button pressed. If the mouse cursor is displayed as a cross, the whole data range is moved, if the mouse cursor is displayed as a horizontal arrow, only the corresponding time mark is moved. Trial selection A complete trial is selected if the right mouse is clicked into the trial. Cancel selection A selected data window can be canceled by pressing the right mouse button or by clicking in an area besides of the selected data window.
If the data file contains only one trial, at start of the data window selection the complete data is selected. To cancel the selection the right mouse cursor has to be clicked into the lower plots.
Scaling Normally all three time curves are scaled to their maxima. The setting "ScaleEqual" sets all three time curves to an equal scaling. The equal scaling allows to easily to identify the main movement direction. Interpolation A linear interpolation can be applied to the data to exclude data errors from the analysis. Before interpolating the data the errors have to be selected as data window. For few data points the zoom function may be used. Then the interpolation button is pressed. The interpolated data is marked as data errors.
A linear interpolation is not a good error correction, as the behavior in the velocity and in the acceleration signals is not controlled. However, the linear interpolation can limit the errors and keeps the automatic scaling in the range of the movement.
Zoom If a valid data window is selected, the data window can be zoomed in the time graphs. In the zoomed display mode all window functions are accessible, like interpolation, further zooming, or the selection of a data window. The zoomed display can be reset with the “UnZoom” button. Time values The time values of the data window selection are displayed in the left dialog bar in ms. In the upper part of the dialog bar the time value that corresponds to the actual cursor position is displayed independently of the data window selection. Numerical time selection The position of the time marks can also be set numerically. First the times have to be entered into the two time value fields in the dialog bar. If the button [Apply times] is pressed, the time marks will jump to the positions that correspond to the defined time values.
Page 120
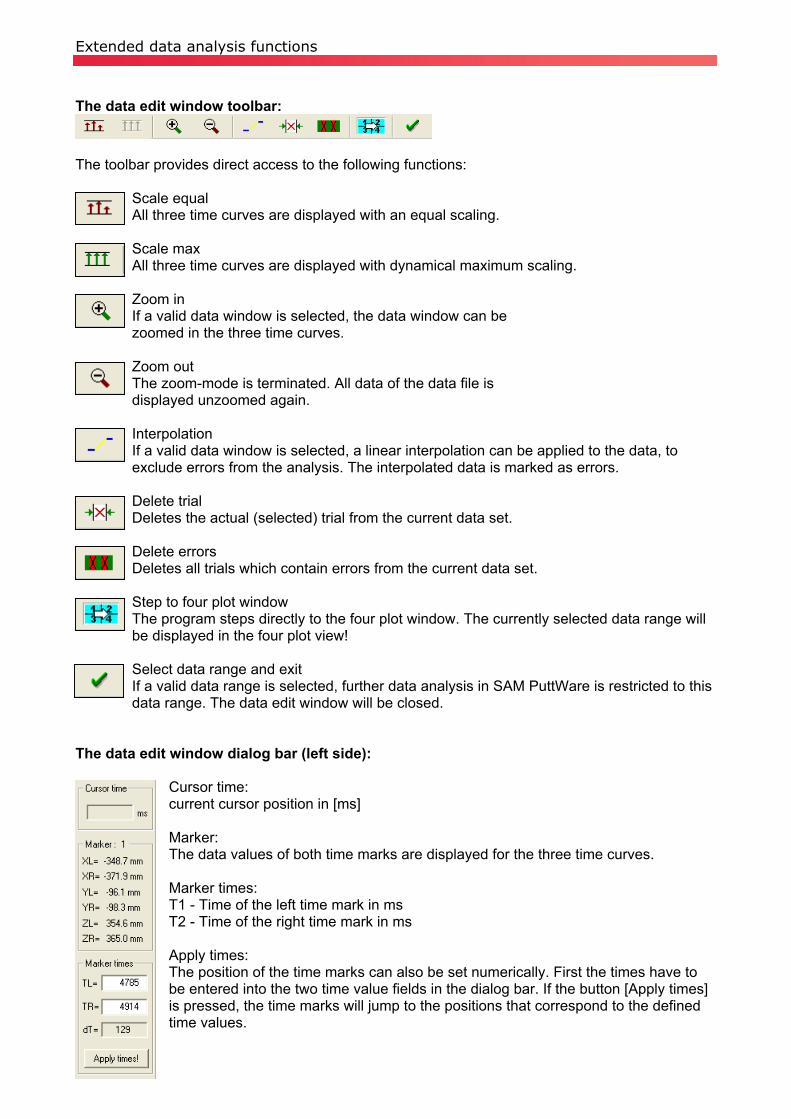
Extended data analysis functions
The data edit window toolbar:
The toolbar provides direct access to the following functions:
Scale equal
Page 121
All three time curves are displayed with an equal scaling.
Scale max All three time curves are displayed with dynamical maximum scaling.
Zoom in If a valid data window is selected, the data window can be zoomed in the three time curves.
Zoom out The zoom-mode is terminated. All data of the data file is displayed unzoomed again.
Interpolation If a valid data window is selected, a linear interpolation can be applied to the data, to exclude errors from the analysis. The interpolated data is marked as errors.
Delete trial Deletes the actual (selected) trial from the current data set.
Delete errors Deletes all trials which contain errors from the current data set.
Step to four plot window The program steps directly to the four plot window. The currently selected data range will be displayed in the four plot view!
Select data range and exit If a valid data range is selected, further data analysis in SAM PuttWare is restricted to this data range. The data edit window will be closed.
The data edit window dialog bar (left side):
Cursor time: current cursor position in [ms] Marker: The data values of both time marks are displayed for the three time curves. Marker times: T1 - Time of the left time mark in ms T2 - Time of the right time mark in ms Apply times: The position of the time marks can also be set numerically. First the times have to be entered into the two time value fields in the dialog bar. If the button [Apply times] is pressed, the time marks will jump to the positions that correspond to the defined time values.

Extended data analysis functions
5.2.2 The four plot window In the four plot window up to 4 data curves are displayed at a time. In the upper left plot two variables (no time courses) can be plotted against each other (movement traces or phase plots, i.e. acceleration Y1 / velocity Y1). The other three plots display time courses of a variable. Time marks can be set in the graphs and can be simultaneously moved. All corresponding data values are displayed and can be stored in a result file. For detail analysis a data window can be selected and be zoomed. Especially the display of four plots at the same time allows exact analysis of the relations between the movement properties and the corresponding velocity and acceleration signals. To inspect the place with of the highest velocity, the maximum in the velocity curve is clicked with the left mouse cursor. In all time curves a synchronous time mark is now inserted. In the movement trace or in a phase plot the corresponding position can be identified by a small colored circle. The systematic search for places with a zero velocity is also very useful, because here the movement direction is inverted (not in the absolute velocity). If the acceleration is "0", the velocity is inverted. To identify the zero crossings better zero lines are inserted into the plots. To open the four plot view execute the "Four plot window" command in the main menu under "Analysis". Each time the four plot window is started the settings dialog will open up:
This is a quite complex dialog which controls the behaviour of the four plot window: Plot 1 Selection of two variables for a X/Y graph. This can be the projection of the movement trace of a marker (i.e. sagital projection Z1/Y1) or a phase plot (i.e. V1/A1). If the scaling mode is set to "fix" or the bandwidth selection is set to "manual" the corresponding data fields are activated. Plot 2-4 Selection of the three variables for the time graphs. At the X-axis always the time is displayed. Bandwidths • Manual - The bandwidths of the selected variables are defined manually. The corresponding
data fields are activated. • Auto - The bandwidths of the selected variables are defined automatically.
Scaling • Fix - The graphs are scaled with fix scaling. The corresponding data fields are activated. "MIN"
or "MAX" identify the minimum or the maximum of a variable.
Page 122

Extended data analysis functions
• Min/Max - All axes are scaled to their maximum. Layout • Load layout - A complete four plot graphics configuration can be loaded from file. • Save layout - The actual four plot graphics configuration can be stored in a layout file. All
informations on variables, bandwidth, and scaling will be set. OK The four plot graphics are displayed. Cancel The setting changes will be discarded, no four plot window will be opened. The four plot window:
In this four plot graphics 4 different data curves are displayed for putting stroke. In the upper left plot the sagital projection [Z/X] is displayed. To the right you see the backswing, to the left you see the forward swing. In the lower left plot the data segmentation signals are displayed. In the upper right plot the velocity of marker 3 (club head) and in the lower right plot the acceleration of marker 3 are displayed. In the upper left sagital projection the positions of the time marks are indicated by small circles. Corresponding data values for additional time marks set with the mouse cursor are displayed. Setting time marks Two vertical time mark lines can be set and moved in the graphs using the left and right mouse button. The mouse cursor has to be positioned inside one of the three time graphs. At the position clicked synchronous vertical time marks are inserted. In the upper left plot the corresponding position in the movement trace is indicated by small circles. The data values of each variable at the marked times are displayed below each graph. If both mouse buttons are used data differences can be determined directly.
Page 123

Extended data analysis functions
Data values The data values of the marked data points and the data differences are displayed below each graph. The units are [mm] for trace, [mm/s] for velocity and [mm/s²] for acceleration. For angles the units are [°], [°/s] and [°/s²]. Step functions If the cursor line mode is selected the cursor jump functions help to find significant data points. Functions are step to the next minimum, maximum, zero crossing, or to the next event. The jump is always applied to the time mark which has been last moved in the graph which has been last clicked on. Zoom The time axis of all displayed data is zoomed to the data window defined by the two time marks. In the three time graphs the time axis is zoomed directly, the upper left plot is not zoomed but displays only the data for the zoomed time. In the zoomed display the complete four plot window functionality is available. The scaling of the graphs remains unchanged. If no time marks are set, the zoom command zooms the time axis to half size. Select data window If two valid time marks are set (or if a valid data window is marked) this data window can be selected for further analysis. This can be sensible if information revealed from the derivatives is necessary to select a data window (i.e. if creating a standard graphic report with centered movements). The four plot graphics are closed. The four plot window toolbar:
The toolbar provides direct access to the following functions:
Zoom in The time axis of all displayed data is zoomed to the data window defined by the two time marks. In the three time graphs the time axis is zoomed directly. The upper left graph is not zoomed but displays only the data for the zoomed time window.
Zoom out The time axes are zoomed out. The complete data is displayed again. Cut to selection The data window is set to the actual time marks. The data is recalculated. The new data window is displayed in the graphs. In contrast to the zoom function the data window is kept after the fourplot function is closed. Save All displayed data values displayed inclusive the variable names can be stored into a dBase file for further statistical analysis. The name of the result file is "FPDAT.DBF" and is always created on the current data path.
Step to data edit window The program steps directly to the data edit window function. Select If two valid time marks are set (or if a valid data window is marked) this data window can be selected for further analysis. The four plot graphics will be closed.
Page 124
Extended data analysis functions
Page 125
5.2.3 Stroke statistics With this result data export function it is possible to export the average values and standard deviation values of all relevant data values of the strokes from one measurement into a database table. This table will be displayed on the screen and can be saved to disk in different file formats. One line in the data table will represent one Measurement/Training session. The data values that are shown belong to the current selected Project and Player. The function can be executed from the main menu: Results – Stroke statistics The data viewer window will open and will show the data values of the strokes line by line in a table view. You can find more information about the data viewer window in chapter 5.2.7. A description of the data values can be found in chapter 5.2.6. 5.2.4 Stroke parameter With this result data export function it is possible to export all relevant raw data values of the single strokes from one measurement into a database table. This table will be displayed on the screen and can be saved to disk in different file formats. One line in the data table will represent one single stroke. The data values that are shown belong to the current selected Project, Player and Measurement. The function can be executed from the main menu: Results – Stroke parameter The data viewer window will open and will show the data values of the strokes line by line in a table view. You can find more information about the data viewer window in chapter 5.2.7. A description of the data values can be found in chapter 5.2.6. 5.2.5 Player statistics With this result data export function it is possible to export the key data values of the putt strokes of a selected Players to a database file in dBase format. This file can be viewed or edited by many software programs like any database or spreadsheet programs (e.g. Microsoft Excel). The data export function can be executed from the main menu: Results – Player statistics

Extended data analysis functions
In the configuration dialog you can add Players to the listbox on the right side. Data from the Players listed in this box will be added to the export file. Project here you can select the Project from which data should be exported. It is possible to add Players from Project A first, then switch to Project B and add also Players from this Project. Data selection Here you can define if only one trial number will be added to the export file or if all available trials of the selected Players should be used. Player This listbox will show all Players from the current selected Project. By selecting Players and executing "Add" the Players can be added to the right list for export. Apply Start the data export process. The data viewer window will open and will show the data values of the Players line by line in a table view. You can find more information about the data viewer window in chapter 5.2.7. A description of all the listed data values can be found in chapter 5.2.6.
Page 126

Extended data analysis functions
5.2.6 List of data values The following list shows all data values that are exported by the functions in the menu "Results". The column "Variable" will represent the entry in the header line of the data table. In the column "Description" you will find a brief description of the parameter.
If the exported data shows average values of multiple strokes in one line, for each variable there is a second entry with the prefix "SD". This will show the standard deviation value for this parameter. Example: BSTIME = average Backswing time of strokes in Measurement; SDBSTIME = standard deviation of Backswing time.
Header information No. Variable Description 1 PROJECT Project code 2 P_ID Player code (internal use) 3 PLAYER Player name 4 MEAS Measurement number 5 TRIAL(S) Number of / Index of putt(s) Data values No. Variable Description 1 BSTIME BackSwing (BS) time 2 FSTIME ForwardSwing (FS) time 3 BSRATIO Relation of BS / FS time 4 TAMAX Time of maximum Acceleration in FS 5 TVMAX Time of maximum Velocity in FS 6 TIMP Time of impact in FS 7 TAMIN Time of minimum acceleration in FS 8 TEND Time for impact to end of FS 9 RHYTHM Relation of BS time / Impact time 10 TIMING Relation of Impact time / FS time 11 VSYM Relation of time to VMAX 12 XADR Position [X] at address 13 YADR Position [Y] at address 14 ZADR Position [Z at address (height) 15 XSTART Position [X] at beginning of FS 16 XIMP Position [X] at impact 17 XEND Position [X] at end of FS 18 BSPATH Length of BS 19 FSPATH Length of FS 20 PATHSYM Relation of BS path / FS path 21 SPOTADR Horizontal address Spot 22 SPOTIMP Horizontal impact Spot 23 HEIGHTADR Height of ground at address 24 HEIGHTIMP Height of ground at impact 25 VMAX Maximum velocity 26 VIMP Impact velocity 27 AMAX Maximum acceleration in FS 28 AIMP Acceleration at impact 29 AREL Acceleration after impact 30 AMIN Minimum acceleration in FS 31 FACEADR Club face angle at address 32 FACESTART Club face angle at begin of FS
Page 127

Extended data analysis functions
Page 128
33 FACEIMP Club face angle at impact 34 FACECHANGE Face change from address to impact 35 FACEEND Club face angle at end of FS 36 ROTIMP Face rotation from begin of FS to impact 37 ROTEND Face rotation from impact to end of FS 38 ROTTOT Total rotation in FS 39 ROTRATE Dynamic change of rotation at impact 40 WBEFORE Face angle 10cm before impact 41 WAFTER Face angle 10cm after impact 42 WTOBEFORE Impact zone rotation before impact 43 WTOAFTER Impact zone rotation after impact 44 FACEBREAK Ratio of WTOAFTER / WTOBEFORE 45 SHAFTADR Vertical shaft angle at address 46 SHAFTIMP Vertical shaft angle at impact 47 LIEADR Lie angle at address 48 LIEIMP Lie angle at impact 49 DIRECT Swing path direction at impact 50 RISE Rise angle of path at impact 51 FACEPATH Face angle relative to path direction at impact 52 DYNLOFT Dynamic Loft at impact (static loft + shaft at impact) 53 LAUNCH Predicted launch angle (83% Loft + 17% Rise angle) 54 BALLDIR Predicted ball direction (83% Face and 17% Path angle) 55 RATING1 Score rating for TECHNIQUE 56 RATING2 Score rating for TIMING 57 RATING3 Score rating for CONSISTENCY 58 RATINGALL Overall Score rating

Extended data analysis functions
5.2.7 The data viewer window The data viewer window will open up after one of the result export functions in the "Results" menu are executed. The window will show the data in a table view. To see all data it is possible to scroll the view horizontal and vertical. There are export functions available to export the data into different file formats. These functions can be executed by the toolbar icons or from the menu "File":
a) data export into dBase format file This option will generate a dBase format database file from the currently displayed data. This file can be opened by any database or spreadsheet program to do further analysis later on. b) data export into CSV format file This option will generate a CSV-formatted text file from the currently displayed data. This file can be opened by any editor, the data columns are separated by colons. Many software programs are able to import files in CSV format (e.g. Microsoft Excel). c) data export into formatted text file This option will generate a formatted text file from the currently displayed data. This file can be opened by any editor and is optimized for viewing the data in a normal text editor like Notepad or Wordpad. This format is not suitable for later import of the data to another program.
Page 129

Extended data analysis functions
a. Technical Troubleshooting 1. I've calibrated the system correctly, but why are my strokes not recorded during training- or measure-mode? SAM PuttLab uses motion detection to determine if you made a stroke. Try to make a complete putt motion including back- and forward-swing. Don't forget to keep the club head quiet before each stroke until the "Ready" LED on the screen turns green. 2. My strokes are not recorded because of "Data Spikes." What's the reason for that? Because the system uses ultra-sonic signals to determine the position of your golf club, these signals can be reflected on flat surfaces and walls nearby. Position your SAM PuttLab away from flat surfaces and walls. 3. I hit the golf ball exactly in the sweet spot, but PuttLab shows me it's beneath it. The system wasn't calibrated accurately enough. Hold the club head exactly in the "sweet spot" directly and align exactly with the target hole during the calibration. 4. I get the following error message indicating a missing database driver:
Some functions of the SAM PuttWare Pro edition need the Microsoft DAO database drivers. On many systems this drivers are installed by default. If this is not the case on your system you will be prompted the message shown above. Press "Yes" to automatically start the installation process of the driver. A setup program will open, leave all the options as default and answer all questions with "Next". After finishing the installation the database functions should run successfully.
Page 130
Extended data analysis functions
Page 131
Appendix
b. Technical Data Basic Unit Dimensions: 260 x 250 x 50 mm (W x H x D) Weight: approx. 0.56 kg Max. number of marker channels: 4 Buffer memory: 60 KB Digital entrances: 1 Interface to PC: USB Measurement rate: max. 210 Hz / 70 Hz per sensor Measurement distance: up to 1.5 m Marker entrances: 4 singles, 1x 4 complete Power supply: supplied via USB cable Power consumption: < 2 W Range of temperature for operation: 10 - 35°C Storage temperature: -10 - +60°C Operating conditions: Lab PC port: USB port Display: green status-LED Control elements: None, on/off control via USB The calculation of the measuring coordinates and further measuring parameters as well as the disturbance-variable compensation is effected in the evaluation programs. The maximum measuring error of relative paths is 2.5 per thousand of the absolute paths. Triplet Dimensions: 160 x 109 x 12 mm (W x H x D) Weight: approx. 55 g with cable Standard cable lengths: 900 mm Power supply: ONLY via Battery Clip Frequency: approx. 40 kHz This triplet is designed for measurement of general movements as well as in the field of movement disorders. Battery Clip Dimensions: 105 x 61 x 28 mm (W x H x D) Weight: approx. 75 g (without batteries) Power supply: 2x AA-LR6, 1.5 V batteries Battery duration: 4 – 6 hours Control elements: Trigger for "on" control

Extended data analysis functions
Page 132
c. FAQ Which possibilities does SAM PuttLab provide to improve my golf game? With SAM PuttLab you have THE opportunity to improve your short game. Compared to other PC-based golf training products SAM PuttLab provides you with unprecedented analytical precision and interpretation of your putting performance. Which operating system do I need on my PC? You need Windows Windows XP or Windows Vista installed on your PC/laptop to run SAM PuttLab 2008. Can I use my own putter(s)? You can use any kind of putter, because the triplet easily fits on most commercial club shafts. Via state-of-the-art wireless technology your stroke-movement data will be transmitted to the basic unit. How accurate is the measurement of PuttLab? More than 210 data points per second are recorded to determine the position of your club with a precision of 1/10 millimeter for position and 1/10 degree for alignment. Do I need batteries? Yes. The triplet uses 2 AA-size batteries. They last about 8 hours. Rechargeable batteries can be used instead. How easily can I transport the SAM PuttLab-system? SAM PuttLab comes in an easy-to-transport and shock resistant case. The system is ready for daily mobile indoor and outdoor use. How do I recognize that the batteries are low or empty? If the battery power is low the LED on the top of the battery clip will blink in red color. If the batteries are empty the LED will not light up and you will get get no data signal from your club movement. If you press the start button on the clip it will not activate or only be active for a short time. One pair of batteries will last 5 to 8 hours depending on use of the system. High capacity rechargeable batteries can be used as well. Does SAM PuttLab provide support for left-handed Players? Yes, for version 1.1 or higher of the software there is a full featured lefthand mode available. In the Player settings you can set a checkbox for left handed players and the stroke recognition and result display will be adapted.
Extended data analysis functions
Page 133
Where can I use SAM PuttLab? You can use SAM indoors, for example for training purposes, without any limitations. Through the integrated power supply through the USB-cable you also can take your exercises outdoors and use a notebook to analyze your data. Can SAM PuttLab be used under every weather conditions? No. Due to the employment of modern technology SAM Motion Analyzer hardware components have to be protected from direct rain and sprinkling water. Stormy winds may impact the measurement accuracy. Is it possible to place more than one SAM PuttLab system in the same area, for example for training purposes? Yes, it is possible. But multiple systems should be placed about 5 meters apart from each other in order to avoid interferences between adjacent systems.