Salt Lake Inland Port Market Assessment
28
Table of Contents Executive Summary 1 Background and History 5 Research Scope and Limitations 6 Essential Characteristics of an Inland Port 6 Key Findings from Scoping Interviews 7 Port Governance 9 Public Incentives 11 Market Characteristics 12 Foreign Trade Zone Status and Privileges 14 Right to Work Laws 14 Labor Market Conditions 15 Required Infrastructure Improvements and off-site Improvement Costs 16 Next Steps 18 REFERENCES 19 APPENDIX A 20 Summary of past studies APPENDIX B 21 History of inland port policy discussion in Utah APPENDIX C 22 Salt Lake County Global Cities Initiative and Regional Export Plan APPENDIX D 23 Summary of selected inland ports APPENDIX E 27 Contributors Executive Summary The World Trade Center Utah contracted with the Kem C Gardner Policy Institute to prepare a preliminary as- sessment of the practicality and market context for the development of an inland port in Salt Lake County The Gardner Policy Institute researched background informa- tion, reviewed past local studies, inventoried inland ports of interest, conducted scoping interviews, and prepared summary information on the technical feasibility of cre- ating an inland port in Salt Lake County This Executive Summary includes a summary of the key findings from the data, research, and interviews Key Findings Our research confirmed that Salt Lake County meets many of the essential criteria for developing an inland port However, there are numerous issues that will require additional data collection, analysis, public discussion, and, ultimately, investment We have distilled our research down into 17 key findings: 1 Significant nationwide interest in inland port de- velopment—Logistics hubs that combine container- ized rail, trucking interchange, and warehousing and distribution activity are experiencing notable growth US rail intermodal volume reached a record 137 mil- lion containers and trailers in 2015 2 Driven in a large way by globalization, e-commerce, and environmen- tal sensibilities, transportation investments that re- duce costs, save time, and minimizes the impact on the environment are becoming more and more at- tractive Salt Lake Inland Port Market Assessment Research Brief August 2016 Authored by: Natalie Gochnour I Director, Kem C. Gardner Policy Institute Kem C Gardner Policy Institute I 411 East South Temple Street, Salt Lake City, Utah 84111 I 801-585-5618 I gardnerutahedu AN INITIATIVE OF THE DAVID ECCLES SCHOOL OF BUSINESS
Transcript of Salt Lake Inland Port Market Assessment

Table of ContentsExecutive Summary . . . . . . . . . . . . . . . . . . . . . . . . . . . . . . . . . . . 1Background and History . . . . . . . . . . . . . . . . . . . . . . . . . . . . . . . 5Research Scope and Limitations . . . . . . . . . . . . . . . . . . . . . . . 6Essential Characteristics of an Inland Port . . . . . . . . . . . . . . 6Key Findings from Scoping Interviews . . . . . . . . . . . . . . . . . 7Port Governance . . . . . . . . . . . . . . . . . . . . . . . . . . . . . . . . . . . . . . 9Public Incentives . . . . . . . . . . . . . . . . . . . . . . . . . . . . . . . . . . . . .11Market Characteristics . . . . . . . . . . . . . . . . . . . . . . . . . . . . . . . .12Foreign Trade Zone Status and Privileges . . . . . . . . . . . . .14Right to Work Laws . . . . . . . . . . . . . . . . . . . . . . . . . . . . . . . . . . .14Labor Market Conditions . . . . . . . . . . . . . . . . . . . . . . . . . . . . .15Required Infrastructure Improvements
and off-site Improvement Costs . . . . . . . . . . . . . . . . . . . . 16Next Steps . . . . . . . . . . . . . . . . . . . . . . . . . . . . . . . . . . . . . . . . . . .18
REFERENCES . . . . . . . . . . . . . . . . . . . . . . . . . . . . . . . . . . . . . . . . 19APPENDIX A . . . . . . . . . . . . . . . . . . . . . . . . . . . . . . . . . . . . . . . . 20
Summary of past studiesAPPENDIX B . . . . . . . . . . . . . . . . . . . . . . . . . . . . . . . . . . . . . . . . 21
History of inland port policy discussion in UtahAPPENDIX C . . . . . . . . . . . . . . . . . . . . . . . . . . . . . . . . . . . . . . . . 22
Salt Lake County Global Cities Initiative and Regional Export Plan
APPENDIX D . . . . . . . . . . . . . . . . . . . . . . . . . . . . . . . . . . . . . . . . 23 Summary of selected inland ports
APPENDIX E . . . . . . . . . . . . . . . . . . . . . . . . . . . . . . . . . . . . . . . . . 27 Contributors
Executive SummaryThe World Trade Center Utah contracted with the Kem C . Gardner Policy Institute to prepare a preliminary as-sessment of the practicality and market context for the development of an inland port in Salt Lake County . The Gardner Policy Institute researched background informa-tion, reviewed past local studies, inventoried inland ports of interest, conducted scoping interviews, and prepared summary information on the technical feasibility of cre-ating an inland port in Salt Lake County . This Executive Summary includes a summary of the key findings from the data, research, and interviews .
Key Findings
Our research confirmed that Salt Lake County meets many of the essential criteria for developing an inland port . However, there are numerous issues that will require additional data collection, analysis, public discussion, and, ultimately, investment .
We have distilled our research down into 17 key findings:
1 . Significant nationwide interest in inland port de-velopment—Logistics hubs that combine container -ized rail, trucking interchange, and warehousing and distribution activity are experiencing notable growth . U .S . rail intermodal volume reached a record 13 .7 mil-lion containers and trailers in 2015 .2 Driven in a large way by globalization, e-commerce, and environmen-tal sensibilities, transportation investments that re-duce costs, save time, and minimizes the impact on the environment are becoming more and more at-tractive .
Salt Lake Inland Port Market Assessment
Research BriefAugust 2016
Authored by: Natalie Gochnour I Director, Kem C. Gardner Policy Institute
Kem C . Gardner Policy Institute I 411 East South Temple Street, Salt Lake City, Utah 84111 I 801-585-5618 I gardner .utah .edu
A N I N I T I A T I V E O F T H E D A V I D E C C L E S S C H O O L O F B U S I N E S S

I N F O R M E D D E C I S I O N S TM 2 gardner .utah .edu
2 . Salt Lake City favorably positioned—Salt Lake City is favorably positioned both geographically and eco-nomically . In terms of location, Salt Lake City sits at the center of the interior west and ties together the Intermountain West, central plains, northern pla-teaus, and west coast . The area benefits from direct rail connection to all major west coast terminals and access to major interstates in all directions (I-80 and I-70 East-West, and I-84 Northwest) .
Economically, Salt Lake City offers economic advan-tages for freight movement such as lower wage costs . Business leaders also referenced Salt Lake City’s com-petitive rates for trans loading, faster clearance of car-go, cheaper holding costs at warehouse facilities, tax advantages compared to California, and the potential for faster deliveries .
3 . Recent land use decisions make development of an inland port more attractive—The decision to relocate the Utah State Prison to Salt Lake City’s northwest quadrant creates additional potential for government entities to collaborate and invest in infrastructure that services the prison and new economic development options like an inland port . In many ways, the development of a prison and inland port are complementary .
4 . Transportation infrastructure investments are supportive; additional investment is needed —The $2 .6 billion rebuild of the Salt Lake City International Airport and more than decade-long surge of trans-portation investment in the greater Salt Lake area’s road system provide advantages to the development of an inland port . More investment is needed .
The current epicenter for freight movement is the Union Pacific Intermodal Terminal . Although located in close proximity to I-80, S .R . 201 and I-215, for trucks to access these routes they must do so via 5600 West (S .R . 172), which is a narrow two-lane rural road with an at-grade crossing over the railroad at the busy west end of the intermodal terminal . Trucks and other highway traffic can be delayed up to 30 minutes when lengthy intermodal trains arrive or depart at their federally-mandated terminal speed of 10 MPH . This can result in back-ups of more than 500 vehicles extending north to I-80 and south to S .R . 201 .
In addition, the Utah Department of Transportation reports that S .R . 172 (5600 West) between I-80 and SR-201 needs to be upgraded to a five-lane facility with full 10-foot shoulders for trucks, with realigned and more
efficient access points at upgraded intersections, and grade separation over the Union Pacific tracks . Such a rebuilding will allow much faster and more efficient access not only to the intermodal terminal and its potential role as Utah’s Inland Port, but to all the other warehouses and businesses that must use 5600 West .
5 . Supply chain—Salt Lake City’s northwest quadrant has emerged as a regional supply chain hub . That emergence is a result of a greatly diverse economy, large manufacturing base, and proximity to the regional population . The Mountain States and some coastal markets are accessible from Salt Lake City within the allowable National Transportation Safety Board window for a single driver shift . This proximity has driven advancements in the logistical coordination of packaging, over-the-road freight, air carriers, and rail access, and made Salt Lake City a critical component of the supply chain in the interior western United States .
While Salt Lake City’s immediate access to air, ground, and rail transportation provides the multi-modal options which today’s supply chain professionals seek, to remain attractive will require ongoing investment . Transportation modalities must remain competitive . This means critical investment in, and connectivity among, the major nodes for each transportation modality . Any major infrastructure investment in a node itself (such as an inland port or airport) must see the accompanying investment in arterial thoroughfares and surface roads for the connectivity to happen . The ultimate benefit comes when a freight consumer has as many options as possible to avoid supply chain bottlenecks . As efficiency is the “name of the game,” businesses will be focused on markets where multimodal transportation is not just available, but reliable, affordable, and in proximity to growing bases of population .
6 . The location of a major shipping carrier in South Jordan is helpful—The presence and market influence of Orient Overseas Container Line (OOCL) could be a key building block to making Salt Lake County a primary catchment area for shipping in the interior western United States . OOCL opened an office in South Jordan, Utah in 2013, which serves as their North American headquarters . OOCL is one of the top ten global container shipping companies in the world with 270 offices in 70 countries . They are members of the Ocean Alliance, which also includes

China’s Cosco Group and France’s CMA CGM . OOCL employs approximately 200 people in Utah, with plans to grow, and provide a vital link to world trade .
7 . Potential to become a jobs center—The creation of an inland port could provide significant job opportunities with attractive wages to residents .3 It would encourage additional inbound trade, “last piece” manufacturing, warehousing and distribution jobs, local trucking and freight jobs, third-party logistic providers, freight forwarders and courier jobs, and other job opportunities . The full impact of these spinoff effects and how it relates to alternative economic development opportunities, tax revenue, and public expenditure is an area ripe for additional study .
8 . Labor market conditions—Labor market conditions in Salt Lake City and Utah are favorable to an inland port, but present some challenges .4 The Salt Lake City and Utah economies continue to out-perform the national economy . Job growth is strong and unemployment rates are low . Wages are notably lower than many inland port cities, particularly California port cities . While wage rates are attractive to employers, Utah’s low unemployment rate creates a labor supply challenge for many industries .
9 . Rural Utah economic development—Rural Utah depends on transportation connections for the agri-culture, mining, and manufactured products grown, mined, or assembled there . Rural Utah is also a natural location to relieve some of the growth pressures in ur-ban Utah . An inland port facility could be an import-ant rural Utah economic development asset .
10 . Master planning Salt Lake City’s Northwest Quadrant—The vision and land use decisions in the northwest quadrant of Salt Lake City are of critical importance to the potential development of an inland port . This is an area of urgent concern because Salt Lake City recently adopted a new master plan for this area . The northwest quadrant includes approximately 19,000 acres west of Salt Lake City International Airport, from 4000 West to approximately 8800 West and from 2100 South to the north city limits . This vital area of real estate includes Salt Lake City’s International Center, the Union Pacific Intermodal Hub, and portions of Interstate 80 . It would also be the likely location of an inland port .
11 . Investment and collaboration—The development of an inland port would require significant transportation investments and collaboration . These include land
for increased intermodal lift capacity, trans-loading facility, highway improvements to provide access to lift facilities, support facilities for trucks and personnel to provide off loading and re-loading, short-haul rail capacity, and additional investments . In addition, formal and informal collaboration among the airport, air freight operators, and railroads would be essential . One community leader suggested the inland port could be used as a catalyst to bind state and local government together in productive ways .
12 . Address warehousing and processing needs—An inland port would be advantaged by a set aside of land for a new warehousing district (zoning and dedicated use) and infrastructure to support a large warehousing district (roads, water, sewer, and utilities) .
13 . Role of Salt Lake City Redevelopment Agency—Tax increment would provide a significant source of funding for infrastructure improvements and incentives to support the creation and development of an inland port . The Redevelopment Agency of Salt Lake City has commenced the process of creating a Community Reinvestment Project Area within the portion of the Northwest Quadrant located north of Interstate 80 . It is anticipated that a project area could be established by early 2017 .
14 . Governance and JPAs—There are many forms of port governance and studies on the topic indicate that there is no right, “one-size-fits-all,” way to govern a port . Local, regional, and statewide circumstances, along with the port’s strategic objectives, are key determinants . Every port governing body must consider and balance the needs of government regulators (or owners), port customers, community stakeholders, and managers (or shareholders) .
15 . Tax incentives—U .S . Port Authorities, despite governance structure type, generally offer public incentives, including tax credits, tax exemptions, and financing options .6 Performance-based tax credits, job tax credits, investment tax credits, sales and use tax exemptions, property tax exemptions, tax increment financing, industrial revenue bonds, education and training grants, and other funding options are among the incentives used to support port development .
16 . Environmental impact—Many of the people interviewed suggested that enhanced rail freight will result in fewer trucks, less pollution and a reduced carbon footprint . Others noted the potential for
I N F O R M E D D E C I S I O N S TM 3 gardner .utah .edu
increased highway congestion .The Gardner Policy Institute did not analyze these issues, but notes the comments of many of the subject matter experts involved . Because of the state of Utah and Salt Lake City’s commitment to improving air quality, the environmental impact of a proposed inland port deserves in-depth research and analysis .
17 . Additional issues raised during the scoping process—These include the following:
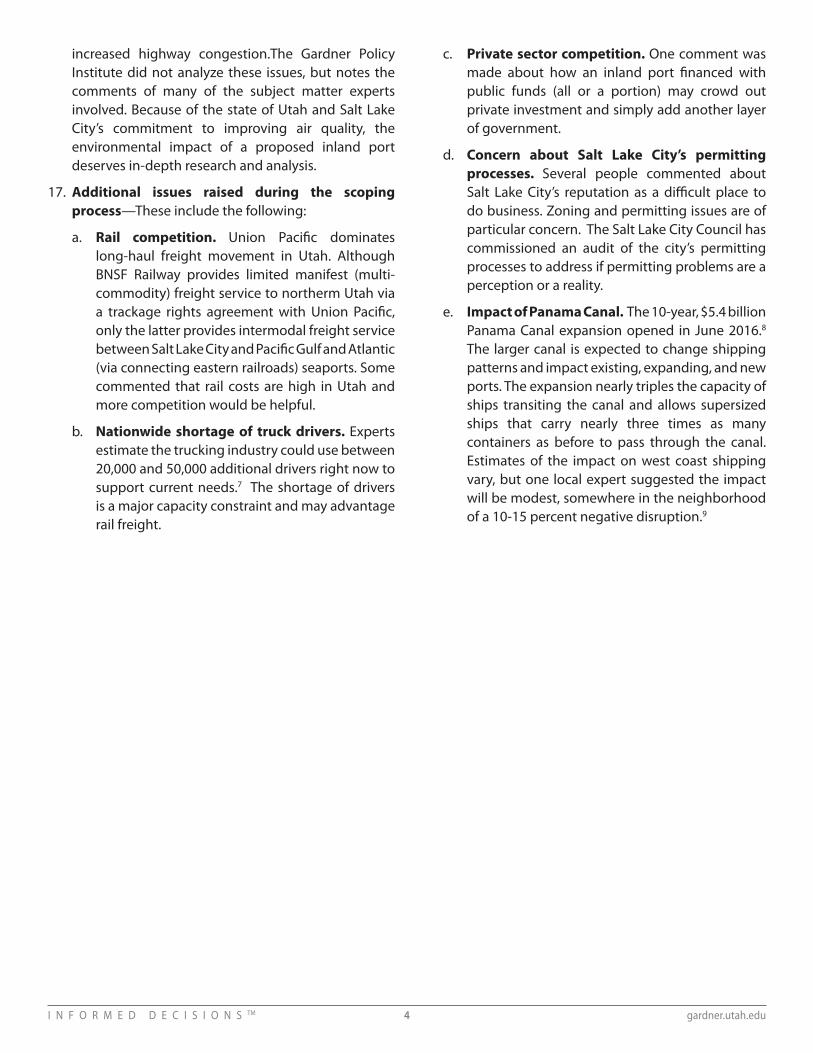
a . Rail competition. Union Pacific dominates long-haul freight movement in Utah . Although BNSF Railway provides limited manifest (multi-commodity) freight service to northerm Utah via a trackage rights agreement with Union Pacific, only the latter provides intermodal freight service between Salt Lake City and Pacific Gulf and Atlantic (via connecting eastern railroads) seaports . Some commented that rail costs are high in Utah and more competition would be helpful .
b . Nationwide shortage of truck drivers. Experts estimate the trucking industry could use between 20,000 and 50,000 additional drivers right now to support current needs .7 The shortage of drivers is a major capacity constraint and may advantage rail freight .
c . Private sector competition. One comment was made about how an inland port financed with public funds (all or a portion) may crowd out private investment and simply add another layer of government .
d . Concern about Salt Lake City’s permitting processes. Several people commented about Salt Lake City’s reputation as a difficult place to do business . Zoning and permitting issues are of particular concern . The Salt Lake City Council has commissioned an audit of the city’s permitting processes to address if permitting problems are a perception or a reality .
e . Impact of Panama Canal. The 10-year, $5 .4 billion Panama Canal expansion opened in June 2016 .8 The larger canal is expected to change shipping patterns and impact existing, expanding, and new ports . The expansion nearly triples the capacity of ships transiting the canal and allows supersized ships that carry nearly three times as many containers as before to pass through the canal . Estimates of the impact on west coast shipping vary, but one local expert suggested the impact will be modest, somewhere in the neighborhood of a 10-15 percent negative disruption .9
I N F O R M E D D E C I S I O N S TM 4 gardner .utah .edu

Background and historyFor several decades, business, community and govern-mental leaders in Utah have considered the feasibility of constructing an inland port in the greater Salt Lake area . Among other assets, Salt Lake City’s central location in the interior western United States, favorable labor costs, in-vestment in transportation infrastructure, and outstand-ing rail connectivity have inspired these discussions .
Interest in an inland port accelerated in recent years be-cause of the construction of Union Pacific’s intermodal hub in 2006, founding of the World Trade Center Utah in 2006, reactivation of the Foreign Trade Zone in 2009, the $2 .6 bil-lion rebuild of the Salt Lake City International Airport that started in 2014, the decision in 2014 to relocate the Utah State Prison, and the Salt Lake County Global Cities Initia-tive (in partnership with the Brookings Institute) in 2014 .
The World Trade Center Utah commissioned this research to assess the market context for developing an inland port in Salt Lake County and to determine recommended next steps for decision makers .
History of inland port discussions in Utah
In 1974, the Utah Legislature unanimously passed a bill in both the Senate and House that authorized port au-thorities throughout the state .9 The bill granted the State or any political entity or combination of entities the au-thority to establish port authorities within or outside (or a combination of both) municipal boundaries and extend-ing police power to the port authority . The bill also au-thorized port authorities to be established, constructed, operated, and maintained using public funds .
Despite the passage of this legislation little else was done to create an Inland Port Authority or a Port District in Salt Lake County until 1987 when the County created an In-land Port Task Force . The task force was created to identi-fy weaknesses in trade and transportation and to propose means for overcoming those weaknesses . The task force was granted funding to perform the feasibility study, which was completed in 1990 .
Among the findings of the study were these:
• The need for a port authority was recognized in 1974 when S .B . 25 passed;
• There was no current centralized entity responsible for freight transport;
• The current transportation infrastructure was expansive;
• Trade and transportation potential was not being fully realized;
• More than 80 industrial parks were under-utilized;
• Utah lagged behind in business climate ratings;
• Foreign Trade Zone facilities were under-utilized;
• 14 local freight forwarders were limited by both small volumes of local cargo and distances to major western markets;
• There was little cooperation within the region be-tween coast and inland relations;
• The 1980s saw a shift in trade patterns in which inter-modal far-east traffic experienced dramatic growth;
• 70 percent of freight markets were now international and most of these were trans-pacific;
• Businesses needed assistance with exporting activ-ities, especially market research and transportation; and,
• No current economic development strategies included freight transportation .
In response to these findings, the task force recommend-ed the establishment of an Inland Port Authority in three phases . The first phase of implementation, which would take place over the first six months of 1990, was to im-plement a Port Authority within the County government structure . Once implemented within the government sys-tem, the next 18 months would see the establishment of a quasi-independent Port Authority . During this second phase of implementation, a private, non-profit organiza-tion would be selected to assume responsibility for the Port Authority and activities and services currently of-fered through the County would be shifted to the Port Authority . The third and final phase, which would take a maximum of three years, would transition to a self-sup-porting quasi-independent Port Authority .
The Port Authority and County would establish fee struc-tures and hourly rate schedules for services and facilities offered and would implement an evaluation procedure for the Port Authority . The task force hoped that through this three phase establishment of a Port Authority, they would see increased job creation within the region, en-hanced statuses for ports of entry and Foreign Trade Zone, and improved levels of service and competition among transportation providers . They also expected that the
I N F O R M E D D E C I S I O N S TM 5 gardner .utah .edu
Inland Port Authority would serve the role of facilitator: facilitating the development of transportation of goods, supporting economic development efforts, facilitating in-creased trade in the region, and coordinating trade-relat-ed opportunities to export Utah products internationally .
A Port Authority was established, but lacked the funds to be fully functional . State and Salt Lake County econom-ic development officials petitioned the Legislature for $150,000 to establish the Inland Port Authority . Salt Lake County committed $300,000 to the Port Authority, but in October of 1991, a panel of 19 members failed to agree on whether a statewide Inland Port Authority would be
beneficial to the State’s economy . Some thought that Port Authorities would be more beneficial at the local level, as opposed to a state level . One point of agreement, howev-er, was that the issue deserved more study .
In 2014, as part of the Global Cities Initiative established by the Brookings Institute and Salt Lake County’s over-all commitment to regional economic development, the County once again has made the study of an inland port a priority . The Governor’s Office of Economic Development and World Trade Center Utah have joined them in this ef-fort and funded this assessment .
Research scope and limitationsThis research presents important context for decisions makers as they consider whether an inland port is a wise economic development strategy for Utah . The scope in-cludes a review of past local studies, an inventory of in-land ports of interest nationwide, scoping interviews with subject matter experts, and research on vital components of an inland port economic development strategy . We paid particular attention to these areas of interest:
· Essential characteristics of an inland port,· Governing structures at other ports,· Types of public incentives offered,· Information on market proximity and rail connections
to seaports and other inland ports,· Foreign trade zone status and privileges,· Right-to-work laws,· Labor market conditions, and· Required infrastructure improvements .
The research presents key findings and potential next steps for decision makers, but is not a feasibility study . Rather, the research is limited to an exploration of the market context and pertinent data points for potentially developing an inland port . Additional research will need to be commissioned, including a thorough assessment of potential sites and a comprehensive feasibility study with an evaluation of the technical, economic, legal, and finan-cial feasibility of developing an inland port in Utah .
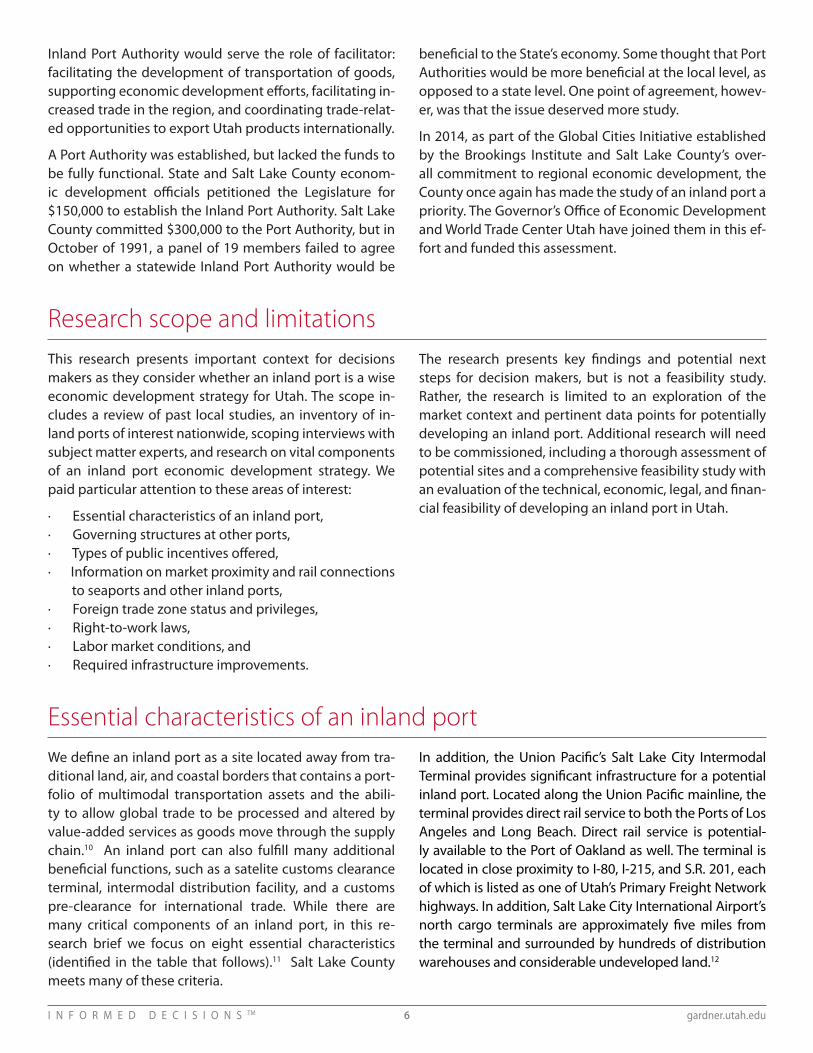
Essential characteristics of an inland portWe define an inland port as a site located away from tra-ditional land, air, and coastal borders that contains a port-folio of multimodal transportation assets and the abili-ty to allow global trade to be processed and altered by value-added services as goods move through the supply chain .10 An inland port can also fulfill many additional beneficial functions, such as a satelite customs clearance terminal, intermodal distribution facility, and a customs pre-clearance for international trade . While there are many critical components of an inland port, in this re-search brief we focus on eight essential characteristics (identified in the table that follows) .11 Salt Lake County meets many of these criteria .
In addition, the Union Pacific’s Salt Lake City Intermodal Terminal provides significant infrastructure for a potential inland port . Located along the Union Pacific mainline, the terminal provides direct rail service to both the Ports of Los Angeles and Long Beach . Direct rail service is potential-ly available to the Port of Oakland as well . The terminal is located in close proximity to I-80, I-215, and S .R . 201, each of which is listed as one of Utah’s Primary Freight Network highways . In addition, Salt Lake City International Airport’s north cargo terminals are approximately five miles from the terminal and surrounded by hundreds of distribution warehouses and considerable undeveloped land .12
I N F O R M E D D E C I S I O N S TM 6 gardner .utah .edu

Table 1 Essential characteristics of an inland port
Characteristic Does Salt Lake County qualify?Population—Market proximity to at least 3 million people within 200 miles . Yes
Class I railroad—A major, direct connection to an American seaport via a Class I railroad . Yes
FTZ—Foreign Trade Zone (FTZ) status and privileges . Yes, but needs improvement
Labor—An abundance of reasonably priced labor (relative to coastal ports) and commercial real estate for warehousing and distribution . Yes
Commodity scope—A scope of commodities of natural resources, agricultural products, chemical products, or other commodities that make an inland port attractive . Yes
Infrastructure—Land for intermodal lift capacity, a transloading facility, highway improvements to provide access to lift facilities, support facilities for trucks and personnel to provide off-loading and re-loading, short-haul rail capacity, and additional investments .
Requires investment
Governing body—An overall governing body or consortium of stakeholders collaborating on a cohesive management plan for the overall effectiveness of the inland port .
Open for discussion
Government partnership—A state and local government climate that is enthusiastic about inland port development and willing to offer meaningful incentives to participants .
Open for discussion
Sources: “The emergence of the inland port,” Spring 2011, Jones Lang LaSalle; and the Kem C . Gardner Policy Institute .
Key Findings from Scoping InterviewsStaff from the Gardner Policy Institute met with individ-uals with varying levels of familiarity and expertise with freight movement and economic development to learn about the key issues, opportunities, and concerns associ-ated with developing an inland port in Salt Lake . Appen-dix A includes a list of people interviewed . These inter-views yielded several instructive findings:
Significant nationwide interest in inland port devel-opment—Logistics hubs that combine containerized rail, trucking interchange, and warehousing and distribution activity are experiencing notable growth . U .S . rail inter-modal volume reached a record 13 .7 million containers and trailers in 2015 .13 Driven in a large way by globaliza-tion, e-commerce, and environmental sensibilities, trans-portation investments that reduce costs, save time, and minimizes the impact on the environment are becoming more and more attractive .
Salt Lake City favorably positioned—Salt Lake City is favorably positioned both geographically and economi-cally . In terms of location, Salt Lake City sits at the center of the interior west and ties together the Intermountain West, central plains, northern plateaus, and west coast . The area benefits from direct rail connection to all major west coast terminals and access to major interstates in all directions (I-80 and I-70 East-West, and I-84 Northwest) .
Economically, Salt Lake City offers economic advantages for freight movement such as lower wage costs . Business leaders also referenced Salt Lake City’s competitive rates
for trans loading, faster clearance of cargo, cheaper hold-ing costs at warehouse facilities, tax advantages com-pared to California, and the potential for faster deliveries .
Recent land use decisions make development of an inland port even more attractive—The decision to re-locate the Utah State Prison to Salt Lake City’s northwest quadrant creates additional potential for government en-tities to collaborate and invest in infrastructure that ser-vices the prison and new economic development options like an inland port . In many ways, the development of a prison and inland port are complementary .
Transportation infrastructure investments are sup-portive; additional investment is needed—The $2 .6 billion rebuild of the Salt Lake City International Airport and more than decade-long surge of transportation in-vestment in the greater Salt Lake area’s road system pro-vide advantages to the development of an inland port .
The current epicenter for freight movement is the Union Pacific Intermodal Terminal . Although located in close proximity to I-80, S .R . 201 and I-215, for trucks to access these routes they must do so via 5600 West (S .R . 172), which is a narrow two-lane rural road with an at-grade crossing over the UP at the busy west end of the intermodal termi-nal . Trucks and other highway traffic can be delayed up to 30 minutes when lengthy intermodal trains arrive or depart at their federally-mandated terminal speed of 10 MPH . This can result in back-ups of more than 500 vehicles extending north to I-80 and south to S .R . 201 .
I N F O R M E D D E C I S I O N S TM 7 gardner .utah .edu

In addition, the Utah Department of Transportation be-lieves S .R . 172 (5600 West) between I-80 and SR-201 needs to be upgraded to a five-lane facility with full 10-foot shoulders for trucks, with realigned and more efficient ac-cess points at upgraded intersections, and most import-ant being grade-separated over the Union Pacific . Such a rebuilding will allow much faster and more efficient ac-cess not only to the intermodal terminal and its potential role as Utah’s Inland Port, but to all the other warehouses and businesses that must use 5600 West .
Supply chain—Salt Lake City’s northwest quadrant has emerged as a regional supply chain hub . That emergence is a result of a greatly diverse economy, large manufacturing base, and proximity to the regional population . The Moun-tain States and some coastal markets are accessible from Salt Lake City within the allowable National Transportation Safety Board window for a single driver shift . This proximity has driven advancements in the logistical coordination of packaging, over-the-road freight, air carriers, and rail ac-cess, and made Salt Lake City a critical component of the supply chain in the interior western United States .
While Salt Lake City’s immediate access to air, ground, and rail transportation provides the multi-modal options which today’s supply chain professionals seek, to remain attractive will require ongoing investment . Transporta-tion modalities must remain competitive . This means crit-ical investment in, and connectivity among, the major nodes for each transportation modality . Any major infra-structure investment in a node itself (such as an inland port or airport) must see the accompanying investment in arte-rial thoroughfares and surface roads for the connectivity to happen . The ultimate benefit comes when a freight con-sumer has as many options as possible to avoid supply chain bottlenecks . As efficiency is the “name of the game,” businesses will be focused on markets where multimodal transportation is not just available, but reliable, affordable, and in proximity to growing bases of population .
The location of a major shipping carrier in South Jor-dan is helpful—The presence and market influence of Orient Overseas Container Line (OOCL) could be a key building block to making Salt Lake County a primary catchment area for shipping in the interior western Unit-ed States . OOCL opened an office in South Jordan, Utah in 2013, which serves as their North American headquar-ters . OOCL is one of the top ten global container shipping companies in the world with 270 offices in 70 countries . They are members of the Ocean Alliance, which also in-cludes China’s Cosco Group and France’s CMA CGM . OOCL employs approximately 200 people in Utah, with plans to grow, and provide a vital link to world trade .
Potential to become a jobs center—The creation of an inland port could provide significant job opportunities with attractive wages to residents .14 It would encourage additional inbound trade, “last piece” manufacturing, warehousing and distribution jobs, local trucking and freight jobs, third-party logistic providers (freight for-warders and courier companies), and other job opportu-nities . The full impact of these spinoff effects and how it relates to alternative economic development opportuni-ties, tax revenue, and public expenditure is an area ripe for additional study .
Rural Utah economic development—Rural Utah de-pends on transportation connections for the agriculture, mining, and manufactured products grown, mined, or assembled there . Rural Utah is also a natural location to relieve some of the growth pressures in urban Utah . An inland port facility could be an important rural Utah eco-nomic development asset .
Master planning Salt Lake City’s Northwest Quad-rant—The vision and land use decisions in the northwest quadrant of Salt Lake City are of critical importance to the potential development of an inland port . This is an area of urgent concern because Salt Lake City is in the final stages of adopting a new master plan for this area . The northwest quadrant includes approximately 19,000 acres west of Salt Lake City International Airport, from 4000 West to approximately 8800 West and from 2100 South to the north city limits . This vital area of real estate includes Salt Lake City’s International Center, the Union Pacific In-termodal Hub, and portions of Interstate 80 . It would also be the likely location of an inland port .
Investment and collaboration—The development of an inland port would require significant transportation investments and collaboration . These include land for increased intermodal lift capacity, trans-loading facility, highway improvements to provide access to lift facilities, support facilities for trucks and personnel to provide off loading and re-loading, short-haul rail capacity, and ad-ditional investments . In addition, formal and informal col-laboration among the airport, air freight operators, and railroads would be essential . One community leader sug-gested the inland port could be used as a catalyst to bind state and local government together in productive ways .
Address warehousing and processing needs—An in-land port would be advantaged by a set aside of land for a new warehousing district (zoning and dedicated use) and infrastructure to support a large warehousing district (roads, water, sewer,and utilities) .
I N F O R M E D D E C I S I O N S TM 8 gardner .utah .edu

Role of Salt Lake City Redevelopment Agency—Tax in-crement would provide a significant source of funding for infrastructure improvements and incentives to support the creation and development of an inland port . The Re-development Agency of Salt Lake City has commenced the process of creating a Community Reinvestment Proj-ect Area within the portion of the Northwest Quadrant located north of Interstate 80 . It is anticipated that a proj-ect area could be established by early 2017 .
Environmental impact—Many believe that enhanced rail freight will result in fewer trucks, less pollution, and a reduced carbon footprint . The Gardner Policy Institute did not analyze this, but notes the comments of many of the subject matter experts interviewed . Because of the state of Utah and Salt Lake City’s commitment to improving air quality the environmental impact of a proposed inland port deserves in-depth research and analysis .
Other Findings
In addition to these finding, participants in the roundta-ble discussion and scoping interviews commented on the value of having increased rail competition . Union Pacific dominates long-haul freight movement in Utah . BNSF has rail operating rights here, but a relatively small presence .
Some commented that rail costs are high in Utah and more competition would be helpful .
Participants also shared concerns about Salt Lake City’s permitting processes and reputation as a difficult place to do business . Zoning and permitting issues are of particu-lar concern . The Salt Lake City Council has commissioned an audit of the city’s permitting processes to address if this is a perception or a reality .
One comment was made about how an inland port financed with public funds (all or a portion) may crowd out private in-vestment and simply add another layer of government .
Finally, a few brought up the impact of the Panama Ca-nal expansion . The 10-year, $5 .4 billion Panama Canal expansion opened in June 2016 .15 The larger canal is ex-pected to change shipping patterns and impact existing, expanding, and new ports . The expanded canal nearly tri-ples the capacity of ships transiting the canal and allows supersized ships that carry nearly three times as many containers as before to pass through the canal . Estimates of the impact on west coast shipping vary, but are likely to be modest, somewhere in the neighborhood of a 10-15 percent disruption .16
Port GovernanceGlobally, ports are governed in a variety of ways from cen-tral government owned, managed, and controlled, to ful-ly privately owned, managed, and controlled . In the U .S ., port governance is highly diverse and most often public in nature .17
Compared to ports overseas, U .S . ports are much more financially dependent on government and tax-exempt bonds . At the same time, however, private sector involve-ment is significant and private sector activity is common among publicly-governed U .S . ports . An example would be a State Port Authority that subcontracts with a private container company . Also, in comparison to U .S . seaport governance, inland port governance sometimes involves additional actors, including rail operators and logistic ser-vices providers .18 One study summarized U .S . port gover-nance, as follows:
The framework of port governance in the U .S . is ‘complex and fragmented’ with a web of public and private organizations involved in management at national, regional and local levels, each with differ-ing priorities, requirements, and procedures .19
According to a 2002 comprehensive assessment of sea-port governance in the U .S . and Canada, a port’s governing body is meant to serve the public interest of a state, region, or locality .20 Port Authorities are usually empowered to ex-ercise “eminent domain,” conduct studies, issue bonds, ap-ply for federal grants, and develop plans . Port Authorities might even govern airports, bridges, tunnels, commuter rail systems, industrial parks, FTZs, World Trade Centers, or have policing (security) and regulatory powers .
While U .S . ports differ widely by region, state, and munic-ipality, they can often be defined as Joint Power Author-ities (JPAs) . A JPA is created when “public officials of two or more agencies agree to create another legal entity or establish a joint approach to work on a common problem, fund a project, or act as a representative body for a specific activity .” 21 For instance, in the U .S ., some port governing boards might be jointly appointed by a governor, a mayor, and a board of county commissioners, while others might be appointed by a city council and county board . In other words, there is no standardized model or models of port governance in the U .S .
I N F O R M E D D E C I S I O N S TM 9 gardner .utah .edu
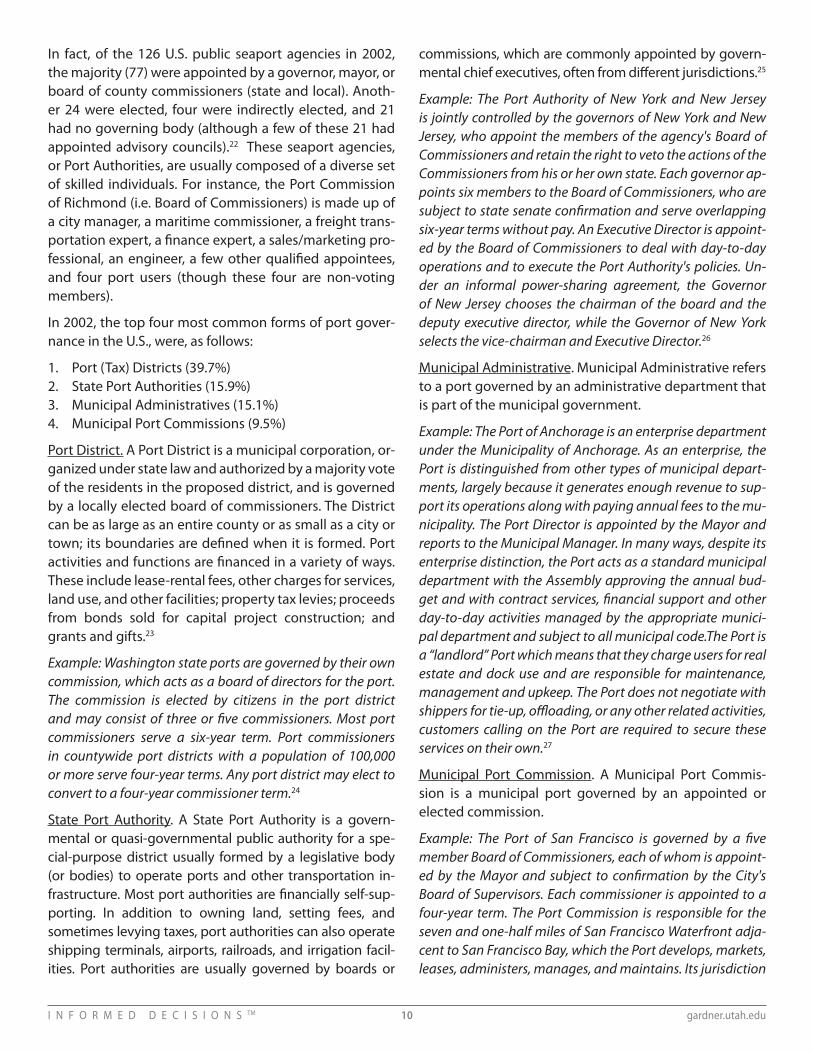
In fact, of the 126 U .S . public seaport agencies in 2002, the majority (77) were appointed by a governor, mayor, or board of county commissioners (state and local) . Anoth-er 24 were elected, four were indirectly elected, and 21 had no governing body (although a few of these 21 had appointed advisory councils) .22 These seaport agencies, or Port Authorities, are usually composed of a diverse set of skilled individuals . For instance, the Port Commission of Richmond (i .e . Board of Commissioners) is made up of a city manager, a maritime commissioner, a freight trans-portation expert, a finance expert, a sales/marketing pro-fessional, an engineer, a few other qualified appointees, and four port users (though these four are non-voting members) .
In 2002, the top four most common forms of port gover-nance in the U .S ., were, as follows:
1 . Port (Tax) Districts (39 .7%)2 . State Port Authorities (15 .9%)3 . Municipal Administratives (15 .1%)4 . Municipal Port Commissions (9 .5%)
Port District . A Port District is a municipal corporation, or-ganized under state law and authorized by a majority vote of the residents in the proposed district, and is governed by a locally elected board of commissioners . The District can be as large as an entire county or as small as a city or town; its boundaries are defined when it is formed . Port activities and functions are financed in a variety of ways . These include lease-rental fees, other charges for services, land use, and other facilities; property tax levies; proceeds from bonds sold for capital project construction; and grants and gifts .23
Example: Washington state ports are governed by their own commission, which acts as a board of directors for the port. The commission is elected by citizens in the port district and may consist of three or five commissioners. Most port commissioners serve a six-year term. Port commissioners in countywide port districts with a population of 100,000 or more serve four-year terms. Any port district may elect to convert to a four-year commissioner term.24
State Port Authority . A State Port Authority is a govern-mental or quasi-governmental public authority for a spe-cial-purpose district usually formed by a legislative body (or bodies) to operate ports and other transportation in-frastructure . Most port authorities are financially self-sup-porting . In addition to owning land, setting fees, and sometimes levying taxes, port authorities can also operate shipping terminals, airports, railroads, and irrigation facil-ities . Port authorities are usually governed by boards or
commissions, which are commonly appointed by govern-mental chief executives, often from different jurisdictions .25
Example: The Port Authority of New York and New Jersey is jointly controlled by the governors of New York and New Jersey, who appoint the members of the agency's Board of Commissioners and retain the right to veto the actions of the Commissioners from his or her own state. Each governor ap-points six members to the Board of Commissioners, who are subject to state senate confirmation and serve overlapping six-year terms without pay. An Executive Director is appoint-ed by the Board of Commissioners to deal with day-to-day operations and to execute the Port Authority's policies. Un-der an informal power-sharing agreement, the Governor of New Jersey chooses the chairman of the board and the deputy executive director, while the Governor of New York selects the vice-chairman and Executive Director.26
Municipal Administrative . Municipal Administrative refers to a port governed by an administrative department that is part of the municipal government .
Example: The Port of Anchorage is an enterprise department under the Municipality of Anchorage. As an enterprise, the Port is distinguished from other types of municipal depart-ments, largely because it generates enough revenue to sup-port its operations along with paying annual fees to the mu-nicipality. The Port Director is appointed by the Mayor and reports to the Municipal Manager. In many ways, despite its enterprise distinction, the Port acts as a standard municipal department with the Assembly approving the annual bud-get and with contract services, financial support and other day-to-day activities managed by the appropriate munici-pal department and subject to all municipal code.The Port is a “landlord” Port which means that they charge users for real estate and dock use and are responsible for maintenance, management and upkeep. The Port does not negotiate with shippers for tie-up, offloading, or any other related activities, customers calling on the Port are required to secure these services on their own.27
Municipal Port Commission . A Municipal Port Commis-sion is a municipal port governed by an appointed or elected commission .
Example: The Port of San Francisco is governed by a five member Board of Commissioners, each of whom is appoint-ed by the Mayor and subject to confirmation by the City's Board of Supervisors. Each commissioner is appointed to a four-year term. The Port Commission is responsible for the seven and one-half miles of San Francisco Waterfront adja-cent to San Francisco Bay, which the Port develops, markets, leases, administers, manages, and maintains. Its jurisdiction
I N F O R M E D D E C I S I O N S TM 10 gardner .utah .edu

stretches along the waterfront from Hyde Street Pier on the north to India Basin on the south.28
As there is no “one-size-fits-all” form of U .S . port gover-nance, deciding on the right type of port governance comes down to local, regional, and statewide circum-stances, and, most importantly, the port’s strategic ob-jectives . Objectives that might be considered by a port’s governing body are as follows, with number four being the most frequently chosen objective in the U .S . 29
1) Maximizing profits for shareholders 2) Maximizing return on investment for government3) Maximizing traffic throughput subject to a maximum
allowable operating deficit4) Optimizing economic development prospects (local,
regional, statewide, national)5) Planning and regulation objectives (i .e . policy objec-
tives related to sustainability)
Whatever objective or objectives a port’s governing body chooses as paramount, every port governing body must consider and balance the needs of government regula-tors (or owners), port customers, community stakehold-ers, and managers (or shareholders) .
When considering the formation of inland port gover-nance in Utah, a possible option would be to create a Joint Powers Authority (JPA), which would have tax increment authority and the ability to cross geographic boundaries . For example, the Governor of Utah could form a JPA with the Mayors of both Salt Lake County and Salt Lake City . The Governor, County Mayor, and City Mayor might mutually appoint a Board of Commissioners who would oversee the day to day operations of the port and execute its policies . The JPA’s main objective could be optimizing economic de-velopment on a local, regional, and statewide basis .
Public Incentives U .S . Port Authorities, despite governance structure type, generally offer public incentives, including tax credits, tax exemptions, and financing options .30 An example of dif-ferent types of public incentives offered by U .S . ports are, as follows:
1 . Tax credits—Tax credits may be issued by a Port Au-thority to the following:
a . Taxpaying companies that increase port business by a certain percentage over the prior taxable year (e .g . performance-based tax credit) .
b . Taxpaying companies that create new jobs in a re-lated port business or industry (e .g . job tax credit) .
c . Taxpaying companies that provide capital invest-ment in a related port business (e .g . investment tax credit) .
2 . Tax exemptions—Sales and use tax exemptions may be given for qualifying manufacturers, processors for hire, and research and development investments . Property tax exemptions could also be provided for qualifying manufacturers .
3 . Funding—There are a variety of funding options port authorities provide, including the following:
a . Tax Increment Financing (e .g . Cincinnati Port)
b . Conduit Financing (e .g . Cincinnati Port)
c . Lease Financing (Capital Lease, Operating Lease, etc .)
d . Bonds (e .g . Industrial Development Revenue Bonds, Port of Chehalis)
e . Grants or Loans (for qualifying public facility/in-frastructure improvements that serve the indus-try)
f . Education and Training Grants (for recruitment and training of new industry workers)
g . Clean Energy Financing (e .g . provide funding to qualifying companies who improve facility infra-structure by increasing energy efficiency, etc .)
I N F O R M E D D E C I S I O N S TM 11 gardner .utah .edu
Market CharacteristicsInland ports rely on warehousing and distribution space in close proximity and rail connections to major seaports . Of particular importance are industrial parks and rail con-nections .
Industrial parks
Here is the market proximity and population served by Utah’s five largest industrial parks:31
i . Landmark/Ninigret/Centennial Business Parks (NW Quadrant, Salt Lake County)
17,644,328 sq . ft . (1,792,997 sq . ft . planned) Portions rail served 7 minutes from Salt Lake City International Airport Adjacent to Union Pacific Intermodal Hub
ii . Salt Lake International Center (NW Quadrant, Salt Lake County)
10,849,670 sq . ft . (502,749 sq . ft . planned) Portions rail served Directly west of Salt Lake City International Airport 5 minutes north of Union Pacific Intermodal Hub
iii . Freeport Center (Davis County): 7,979,043 sq . ft . Rail served 30 minutes from Salt Lake City International Airport/
Union Pacific Intermodal Hub
iv . Business Depot Ogden (Weber County) 7,032,000 sq . ft . Rail served 40 minutes from Salt Lake City International Airport/
Union Pacific Intermodal Hub
v . Ninigret Depot (Tooele County) 4,500,000 sq . ft . Rail served 30 minutes from Salt Lake City International Airport/
Union Pacific Intermodal Hub
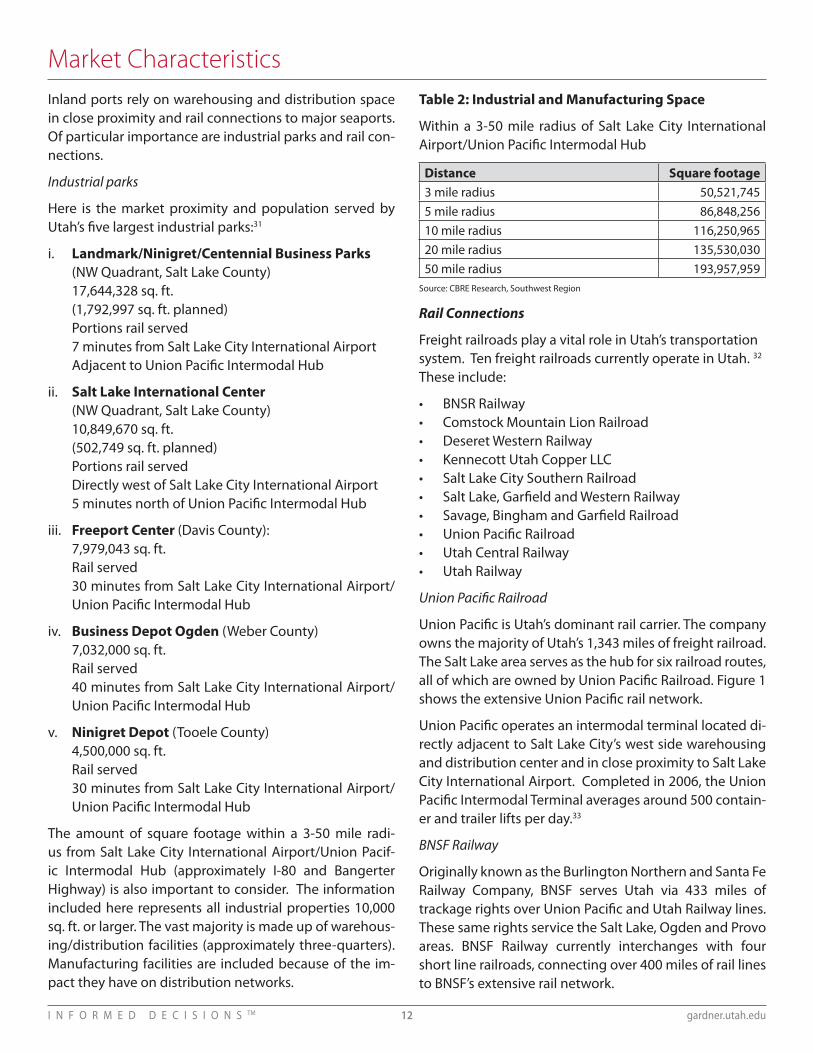
The amount of square footage within a 3-50 mile radi-us from Salt Lake City International Airport/Union Pacif-ic Intermodal Hub (approximately I-80 and Bangerter Highway) is also important to consider . The information included here represents all industrial properties 10,000 sq . ft . or larger . The vast majority is made up of warehous-ing/distribution facilities (approximately three-quarters) . Manufacturing facilities are included because of the im-pact they have on distribution networks .
Table 2: Industrial and Manufacturing Space
Within a 3-50 mile radius of Salt Lake City International Airport/Union Pacific Intermodal Hub
Distance Square footage3 mile radius 50,521,7455 mile radius 86,848,25610 mile radius 116,250,96520 mile radius 135,530,03050 mile radius 193,957,959
Source: CBRE Research, Southwest Region
Rail Connections
Freight railroads play a vital role in Utah’s transportation system . Ten freight railroads currently operate in Utah . 32 These include:
• BNSR Railway• Comstock Mountain Lion Railroad• Deseret Western Railway• Kennecott Utah Copper LLC• Salt Lake City Southern Railroad• Salt Lake, Garfield and Western Railway• Savage, Bingham and Garfield Railroad• Union Pacific Railroad• Utah Central Railway• Utah Railway
Union Pacific Railroad
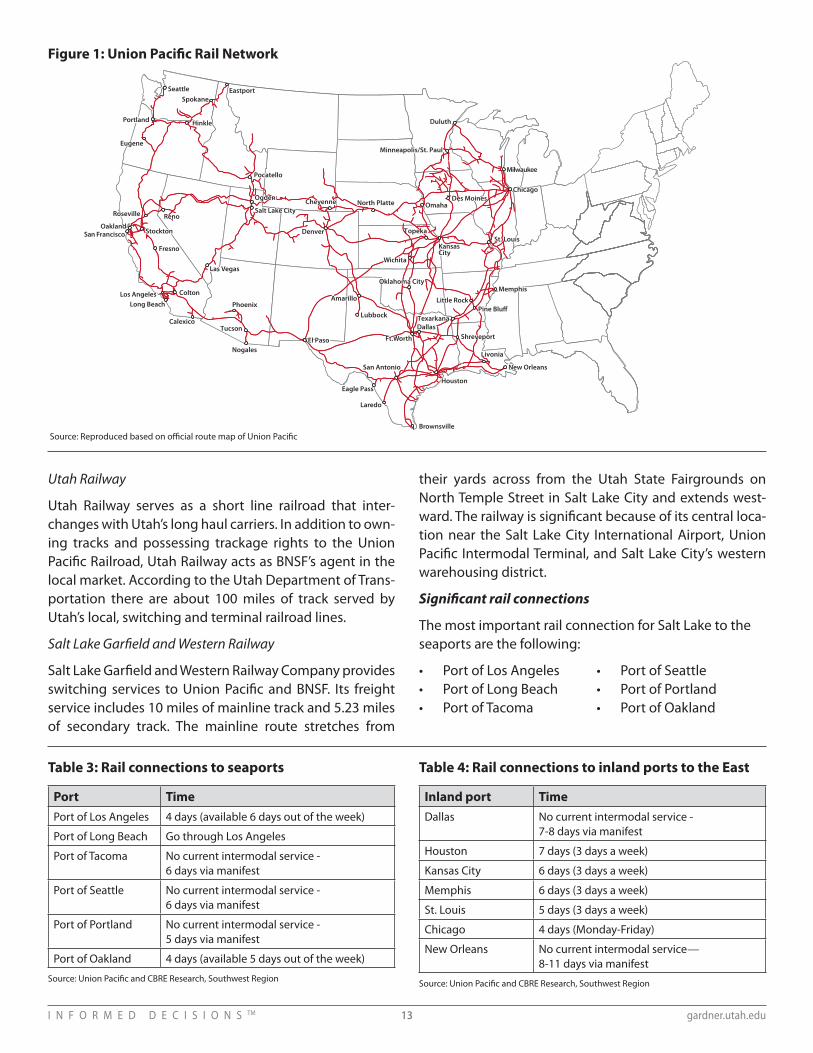
Union Pacific is Utah’s dominant rail carrier . The company owns the majority of Utah’s 1,343 miles of freight railroad . The Salt Lake area serves as the hub for six railroad routes, all of which are owned by Union Pacific Railroad . Figure 1 shows the extensive Union Pacific rail network .
Union Pacific operates an intermodal terminal located di-rectly adjacent to Salt Lake City’s west side warehousing and distribution center and in close proximity to Salt Lake City International Airport . Completed in 2006, the Union Pacific Intermodal Terminal averages around 500 contain-er and trailer lifts per day .33
BNSF Railway
Originally known as the Burlington Northern and Santa Fe Railway Company, BNSF serves Utah via 433 miles of trackage rights over Union Pacific and Utah Railway lines . These same rights service the Salt Lake, Ogden and Provo areas . BNSF Railway currently interchanges with four short line railroads, connecting over 400 miles of rail lines to BNSF’s extensive rail network .
I N F O R M E D D E C I S I O N S TM 12 gardner .utah .edu
Utah Railway
Utah Railway serves as a short line railroad that inter-changes with Utah’s long haul carriers . In addition to own-ing tracks and possessing trackage rights to the Union Pacific Railroad, Utah Railway acts as BNSF’s agent in the local market . According to the Utah Department of Trans-portation there are about 100 miles of track served by Utah’s local, switching and terminal railroad lines .
Salt Lake Garfield and Western Railway
Salt Lake Garfield and Western Railway Company provides switching services to Union Pacific and BNSF . Its freight service includes 10 miles of mainline track and 5 .23 miles of secondary track . The mainline route stretches from
their yards across from the Utah State Fairgrounds on North Temple Street in Salt Lake City and extends west-ward . The railway is significant because of its central loca-tion near the Salt Lake City International Airport, Union Pacific Intermodal Terminal, and Salt Lake City’s western warehousing district .
Significant rail connections
The most important rail connection for Salt Lake to the seaports are the following:
• Port of Los Angeles• Port of Long Beach• Port of Tacoma
• Port of Seattle• Port of Portland• Port of Oakland
I N F O R M E D D E C I S I O N S TM 13 gardner .utah .edu
T
Wichita
opeka
Laredo
San Antonio
Brownsville
Houston
New Orleans
Memphis
Little Rock
KansasCity
Chicago
Ft.Worth
Dallas
St. Louis
Omaha
Duluth
Milwaukee
Oklahoma City
Des Moines
Lubbock
Eagle Pass
Pine Blu� Texarkana
Livonia
Ogden
Roseville
Phoenix
Seattle
Salt Lake City
Portland
Spokane
Denver
El Paso
North Platte Cheyenne
Oakland
Los Angeles
Reno
Las Vegas
Pocatello
Minneapolis/St. PaulEugene
San Francisco Stockton
ColtonAmarillo
Tucson
Eastport
Long Beach
Nogales
Hinkle
Fresno
Calexico
Shreveport
Figure 1: Union Pacific Rail Network
Source: Reproduced based on official route map of Union Pacific
Table 3: Rail connections to seaports
Port TimePort of Los Angeles 4 days (available 6 days out of the week)
Port of Long Beach Go through Los Angeles
Port of Tacoma No current intermodal service - 6 days via manifest
Port of Seattle No current intermodal service - 6 days via manifest
Port of Portland No current intermodal service - 5 days via manifest
Port of Oakland 4 days (available 5 days out of the week)
Source: Union Pacific and CBRE Research, Southwest Region
Table 4: Rail connections to inland ports to the East
Inland port TimeDallas No current intermodal service -
7-8 days via manifest
Houston 7 days (3 days a week)
Kansas City 6 days (3 days a week)
Memphis 6 days (3 days a week)
St . Louis 5 days (3 days a week)
Chicago 4 days (Monday-Friday)
New Orleans No current intermodal service— 8-11 days via manifest
Source: Union Pacific and CBRE Research, Southwest Region

In addition, there are rail connections to inland ports east of Utah, such as the Mississippi and Missouri River water-way ports, Oklahoma and Texas inland ports, and Great lakes ports .
As is the case with any mode of transportation, travel times are subject to change based on a variety of factors . Ship-ping by rail is no different and the transit times listed in Ta-bles 3 and 4 are estimates and subject to change . The esti-mates are based on service levels today for intermodal and
manifest shipping (manifest is a rail term used to describe product shipped using a variety of rail cars and do not use intermodal ramps) . We include manifest shipping because several cities in the specified list do not have intermodal service connections with Salt Lake City at the present time . This is not to say that those cities do not have intermodal ramps, but rather there is not enough volume to justify an intermodal train for those specific lanes .
Foreign Trade Zone Status and PrivilegesForeign Trade Zones (FTZs) are federally-designated se-cure locations in the country that are considered outside of the commerce of the United States . Merchandise ad-mitted to a FTZ is treated as though it were located out-side the country for customs duty purposes .
There are many benefits of locating within a FTZ:
• Firms can warehouse, assemble, manufacture, package, test, grade, clean, mix, process, and exhibit merchandise in the FTZ . Duties are paid only when goods are shipped from the FTZ to U .S . destinations .
• No Customs duty is assessed when re-exporting goods from the FTZ to foreign countries .
• Processing goods within the FTZ can eliminate or lower tariffs .
• FTZ users may submit one Customs Entry per week rather than submitting one Customs Entry per ship-ment . This can result in significant cost savings .
• FTZ users may also receive permission from Customs to move imported items directly from ports to the FTZ, thereby avoiding delays at congested ports .
Companies that import goods with a high duty rate; add value to goods via assembly, manufacturing, and packag-ing; and/or combine foreign and domestic goods all ben-efit from a FTZ .
Salt Lake City’s Foreign Trade Zone was established in 1977 and was operational until 1996, when it was deactivated due to lack of use . In 2006, Salt Lake City partnered with the Rockefeller Group to reactivate the FTZ . The reactivation was approved in 2009, and in 2013 the FTZ was completed . A Memorandum to the Salt Lake City Council dated Febru-ary 26, 2015 outlined the application for expansion of the FTZ through the creation of two “subzones”, which fall out-side the existing foreign trade zone . These subzones would be located at the sites of two company expansion sites in Salt Lake City: one at the Red Wing Shoes facility and one at the Oemeta facility . These discussions remain ongoing, and the business leaders interviewed for this assessment encouraged Salt Lake City to be strategic and careful about how they master plan the remaining space .
Right-to-Work LawsUtah is a right-to-work state . Utah Code Annotated 34-34-2 reads:
It is hereby declared to be the public policy of the state of Utah that the right of persons to work, whether in private employment or for the state, its counties, cities, school dis-tricts, or other political subdivisions, shall not be denied or abridged on account of membership or nonmembership in any labor union, labor organization or any other type of as-sociation; and further, that the right to live includes the right
to work. The exercise of the right to work must be protected and maintained free from undue restraints and coercion. (Enacted 1955.)
Right-to-work states protect workers from being required to join a union . According to Thomson Reuters, right-to-work laws prohibit many activities and subject violators to a variety of potential penalties . Tables 5 and 6 present these prohibitions and penalties .
I N F O R M E D D E C I S I O N S TM 14 gardner .utah .edu

Table 5: Right-to-work law prohibitions
Utah’s “right to work” law prohibits any of the following activities:
Any agreement, understanding, or practice denying a person work based on membership in a labor organization .
Although unions can peacefully recruit members including for lockouts, boycotts, or work stoppages, any person, company, or union can’t force others to violate these laws .
Compelling a person to join or not join a labor or other organization .
An employer can’t require union membership or require not joining union, nor require paying union dues or fees as a condition of employment .
Source: FindLaw, Thomson Reuters . See http://statelaws .findlaw .com/utah-law/utah-right-to-work-laws .html
Table 6: Right-to-work law penalties
The possible penalties for violating the “right to work” laws are:
An injunction preventing the continued violation of the law .
Damages or payment of financial losses for the denial of employ-ment or continued employment in violation of this law .
Each day of violating this act is a separate misdemeanor and a misdemeanor can, at most, can be punished by a year in jail and a $2,500 fine .
Source: FindLaw, Thomson Reuters . See http://statelaws .findlaw .com/utah-law/utah-right-to-work-laws .html
Labor market conditionsLabor market conditions in the Salt Lake area and Utah are favorable to an inland port, but present some challenges . Mean hourly wages are competitive compared to other inland ports we examined, but the unemployment rate is lower suggesting a tighter labor market . Wages are no-tably lower than major California port cities . While wage rates are attractive to employers, the low unemployment rate creates a labor supply problem for many industries and wages in Utah are rising . Table 7 provides labor mar-ket conditions in selected port cities .
Inland port-related wage rates
Inland ports generate jobs in the the manufacturing and transportation and warehousing industries . These in-clude many jobs associated with inbound trade such as “last piece” manufacturing, warehousing and distribution, local trucking and freight, third-party logistic providers, freight forwarders, courier companies, and other oppor-tunities .
Wage rates for these jobs are generally higher than the state average wage and, in the case of rail and air trans-portation, competitive with wage rates in the high-pay-ing information and finance and insurance sectors . Jobs in the truck transportation sector pay slightly lower than the state average wage .
Table 8 provides employment and wage data for selected inland port-related industries . For comparison purposes, data are also shown for the information and finance and insurance sectors .
Table 9 provides wage data for selected inland port-relat-ed occupations . Sectors related to inland port activities have, on average, higher monthly wages than the total average monthly wage for all industries, with only truck transportation averaging lower than $3,877 .
I N F O R M E D D E C I S I O N S TM 15 gardner .utah .edu
Table 7: Labor Market Conditions: Selected Port Cities
City Unemployment Rate (May 2016)
Median Hourly Wages
Mean Hourly Wages
Annual Mean Wage
Avg. Job Growth* (May 2016)
Denver 3 .3% $19 .83 $26 .18 $54,450 3 .1%
Greer, SC** 4 .3% $15 .00 $19 .72 $41,010 2 .3%
Kansas City 4 .1% $17 .72 $22 .90 $47,640 1 .3%
Los Angeles 4 .3% $18 .54 $25 .90 $53,870 2 .4%
Oakland 3 .9% $22 .74 $29 .73 $61,840 2 .3%
Salt Lake City 3.6% $17.45 $22.88 $47,590 3.0%
Tacoma 6 .1% $19 .04 $23 .23 $48,320 2 .9%
*Job growth is based off 12-month percent change in total nonfarm wage and salary employment .** Greer, South Carolina figures are based on the Greenville-Mauldin-Easley metropolitan area . Source: U .S . Bureau of Labor Statistics

Required infrastructure improvements and off-site improvement costsDevelopment of an inland port would require signifi-cant infrastructure improvements both on- and off-site .34
Development costs are variable and dependent upon a multitude of factors . In terms of construction, hard costs (materials and labor) would likely range from $40 - $80 per sq . ft ., depending upon building systems, mechanical capabilities and other building characteristics . Soft costs such as legal, marketing, financing, and permits could add another 25 percent to 30 percent to a project’s total cost . In addition, land costs would need to be included . It
is important to note that this is just an estimate for a “typi-cal” large project (100,000 sq . ft . or more in size) and could vary greatly .
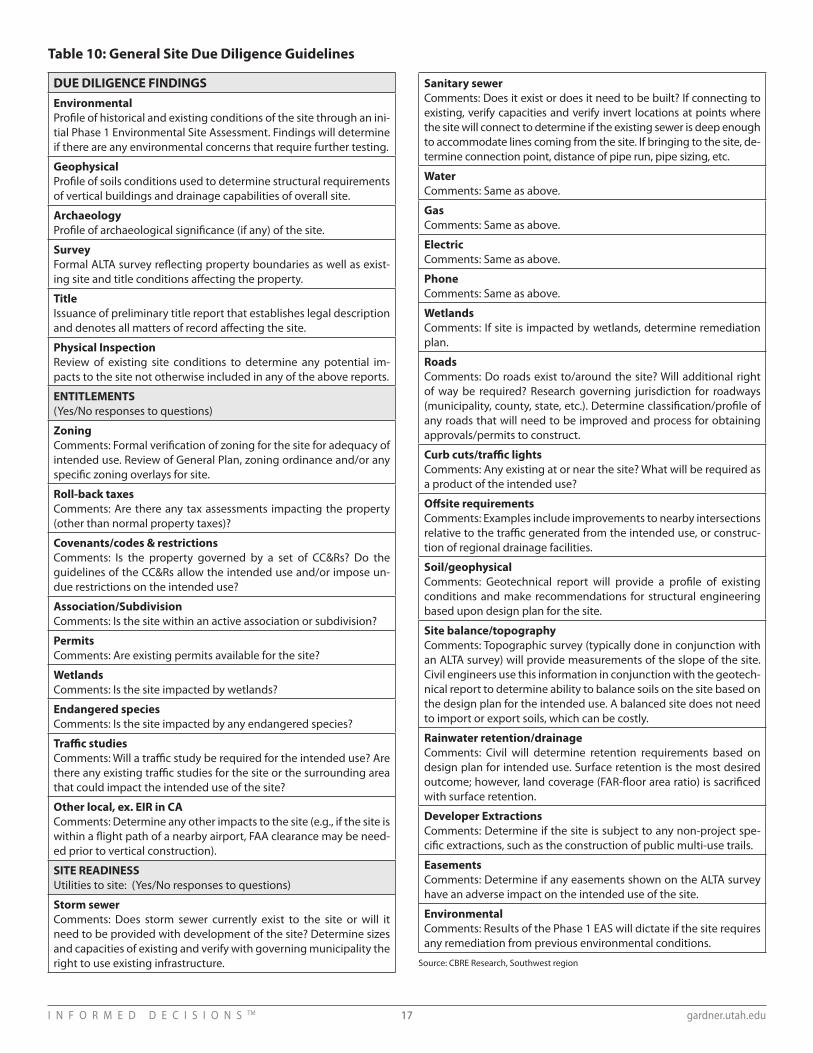
Although cost estimates are difficult to create without knowing and considering major variables, the process of evaluation from site to site is similar . Table 10 provides an outline of the general site due diligence guidelines used by CBRE’s development arm (Trammell Crow Company) . These can be used to evaluate project costs .
I N F O R M E D D E C I S I O N S TM 16 gardner .utah .edu
Table 8: Utah Average Monthly Wage by Sector—Fourth Quarter 2015
Industry SectorNAICS Sector
Average Employment
Average Monthly Wage
Percent (%) of State Average Monthly Wage
All Industries 1,410,626 $3,877 100%
Manufacturing 31-33 124,870 $4,867 125 .5%
Transportation and Warehousing 48 65,078 $3,989 102 .9%
Air Transportation 481 6,278 $5,741 148 .1%
Rail Transportation 482 1,468 $5,964 153 .8%
Truck Transportation 484 21,965 $3,775 97 .4%
Information 51 36,896 $5,657 146%
Finance and Insurance 52 62,473 $6,262 161 .5%
Source: Utah Department of Workforce Services
Table 9: Utah Inland Port-Related Occupation Information—April 2015
OccupationNAICS Sector
Annual Utah Median Per-Capita Income
Annual U.S. Median Per-Capita Income
Percent (%) of Utah Median Per-Capita Income
All Occupations $39,045 $47,669 100%
Aircraft Cargo Handling Supervisors 531011 $35,950 $47,760 92 .1%
Cargo and Freight Agents 435011 $35,540 $41,380 91%
Transportation, Storage, and Distribution Managers
113071 $82,630 $85,400 211 .6%
Transportation Workers, All Other 536099 $52,220 $33,790 133 .7%
Tank Car, Truck, and Ship Loaders 537121 $41,180
Shipping, Receiving, and Traffic Clerks 435071 $27,650 $29,930 70 .8%
Rail Transportation Workers, All Other 534099 $59,480
Mechanical Engineers 172141 $76,450 $83,060 195 .8%
Maintenance and Repair Workers, General
499071 $33,610 $36,170 86 .1%
Locomotive Engineers 534011 $54,500
Light Truck or Delivery Services Drivers 533033 $26,960 $29,570 69%
Laborers and Freight, Stock, and Material Movers, Hand
537062 $24,720 $24,430 63 .3%
Industrial Engineering Technicians 173026 $55,180 $53,370 141 .3%
Construction Laborers 472061 $28,810 $31,090 73 .8%
Source: Utah Department of Workforce Services; Bureau of Economic Analysis
I N F O R M E D D E C I S I O N S TM 17 gardner .utah .edu
Table 10: General Site Due Diligence Guidelines
DUE DILIGENCE FINDINGSEnvironmentalProfile of historical and existing conditions of the site through an ini-tial Phase 1 Environmental Site Assessment . Findings will determine if there are any environmental concerns that require further testing .
GeophysicalProfile of soils conditions used to determine structural requirements of vertical buildings and drainage capabilities of overall site .
ArchaeologyProfile of archaeological significance (if any) of the site .
SurveyFormal ALTA survey reflecting property boundaries as well as exist-ing site and title conditions affecting the property .
TitleIssuance of preliminary title report that establishes legal description and denotes all matters of record affecting the site .
Physical InspectionReview of existing site conditions to determine any potential im-pacts to the site not otherwise included in any of the above reports .
ENTITLEMENTS (Yes/No responses to questions)
ZoningComments: Formal verification of zoning for the site for adequacy of intended use . Review of General Plan, zoning ordinance and/or any specific zoning overlays for site .
Roll-back taxesComments: Are there any tax assessments impacting the property (other than normal property taxes)?
Covenants/codes & restrictionsComments: Is the property governed by a set of CC&Rs? Do the guidelines of the CC&Rs allow the intended use and/or impose un-due restrictions on the intended use?
Association/SubdivisionComments: Is the site within an active association or subdivision?
PermitsComments: Are existing permits available for the site?
WetlandsComments: Is the site impacted by wetlands?
Endangered speciesComments: Is the site impacted by any endangered species?
Traffic studiesComments: Will a traffic study be required for the intended use? Are there any existing traffic studies for the site or the surrounding area that could impact the intended use of the site?
Other local, ex. EIR in CAComments: Determine any other impacts to the site (e .g ., if the site is within a flight path of a nearby airport, FAA clearance may be need-ed prior to vertical construction) .
SITE READINESS Utilities to site: (Yes/No responses to questions)
Storm sewerComments: Does storm sewer currently exist to the site or will it need to be provided with development of the site? Determine sizes and capacities of existing and verify with governing municipality the right to use existing infrastructure .
Sanitary sewerComments: Does it exist or does it need to be built? If connecting to existing, verify capacities and verify invert locations at points where the site will connect to determine if the existing sewer is deep enough to accommodate lines coming from the site . If bringing to the site, de-termine connection point, distance of pipe run, pipe sizing, etc .
WaterComments: Same as above .
GasComments: Same as above .
ElectricComments: Same as above .
PhoneComments: Same as above .
WetlandsComments: If site is impacted by wetlands, determine remediation plan .
RoadsComments: Do roads exist to/around the site? Will additional right of way be required? Research governing jurisdiction for roadways (municipality, county, state, etc .) . Determine classification/profile of any roads that will need to be improved and process for obtaining approvals/permits to construct .
Curb cuts/traffic lightsComments: Any existing at or near the site? What will be required as a product of the intended use?
Offsite requirementsComments: Examples include improvements to nearby intersections relative to the traffic generated from the intended use, or construc-tion of regional drainage facilities .
Soil/geophysicalComments: Geotechnical report will provide a profile of existing conditions and make recommendations for structural engineering based upon design plan for the site .
Site balance/topographyComments: Topographic survey (typically done in conjunction with an ALTA survey) will provide measurements of the slope of the site . Civil engineers use this information in conjunction with the geotech-nical report to determine ability to balance soils on the site based on the design plan for the intended use . A balanced site does not need to import or export soils, which can be costly .
Rainwater retention/drainageComments: Civil will determine retention requirements based on design plan for intended use . Surface retention is the most desired outcome; however, land coverage (FAR-floor area ratio) is sacrificed with surface retention .
Developer ExtractionsComments: Determine if the site is subject to any non-project spe-cific extractions, such as the construction of public multi-use trails .
EasementsComments: Determine if any easements shown on the ALTA survey have an adverse impact on the intended use of the site .
EnvironmentalComments: Results of the Phase 1 EAS will dictate if the site requires any remediation from previous environmental conditions .
Source: CBRE Research, Southwest region

I N F O R M E D D E C I S I O N S TM 18 gardner .utah .edu
Next stepsThis assessment has laid the groundwork for additional steps that decision makers may want to consider to com-prehensively explore the economic and financial feasibil-ity of developing an inland port in the greater Salt Lake area . We present the following ideas for consideration:
• Exploratory team—Form an exploratory economic development team whose purpose is to guide poten-tial next steps in evaluating the development of an inland port . This would be a collective effort designed to bring people together to address opportunities and challenges . The team would participate in site vis-its, meet with critical partners, consult with the Utah Legislature, and work with business and community leaders to commission additional research . Suggest-ed representation includes the following:
a . Governor’s Office of Economic Developmentb . World Trade Center Utahc . Legislatorsd . Salt Lake Countye . Salt Lake Cityf . Salt Lake Chamberg . Freight forwarderh . Orient Overseas
Container Linei . Union Pacificj . Trucking companyk . Commercial real
estate broker(s)l . Flex and industrial developersm . Import/customs broker
2 . Domestic trade missions and entity visits—Visit ports of interest to learn more about relevant issues . While there are many potential areas to visit, we suggest the inland port in Greer, South Carolina and the Port of Long Beach as two ports of interest—Long Beach for its proximity and size and Greer for its size and recent development .
The inland port exploratory team may also want to visit with senior executives from Union Pacific, BNSF Railway, Delta Airlines, and the Salt Lake City International Airport to explore mutually beneficial steps toward the development of an inland port in Salt Lake County .
• Northwest Quadrant and Utah State Prison Relo-cation—Engage with Salt Lake City on the Redevel-opment Agency of Salt Lake’s formation of a project area plan, with a particular emphasis on how the cre-ation of a tax increment collection area could serve the interests of creating an inland port . Issues that could be addressed include establishing realistic projections for buildout, determining infrastructure requirements, identifying and addressing environ-mental impediments to development, and defining appropriate uses of tax increment financing . Similar-ly, the plans for development of the new prison site in Salt Lake City can be optimized to complement inland port development . Consider active engagement with the Utah Legislature and Salt Lake City on the Utah State Prison development .
• Site assessment and due diligence—Commission a study to identify or narrow down options for a poten-tial site for an inland port . General site due diligence would include an evaluation of environmental, geo-physical, archaeological, property boundary survey lines, title and other issues . The site assessment should also evaluate entitlements (zoning, permitting, traffic studies, roll-back taxes, etc .) and site readiness (such as utilities, easements, and soils) . The goal would be to narrow site locations down so that a formal feasi-bility study—complete with on- and off-site improve-ment costs—could be conducted .
• Feasibility study—Commission a comprehensive feasibility study once a site(s) is selected . Since development of an inland port would serve a statewide economic interest and impact multiple jurisdictions, the Utah Legislature would likely be the right entity to oversee a feasibility study . The feasibility study would ideally include an evaluation of the technical, economic, legal, and financial feasibility of developing an inland port . It would be helpful for the study to include a full economic and fiscal impact analysis that allows decision makers to evaluate the return on investment . This study could be funded privately, publicly or jointly .

I N F O R M E D D E C I S I O N S TM 19 gardner .utah .edu
References1 . See “Rail Intermodal Keeps America Moving,” Association of
American Railroads, May 2016 .
2 . See analysis of labor market conditions on pages 15 and 16 .
3 . Ibid.
4 . Sherman, R . (2002) . Seaport Governance in the United States and Canada .
5 . See the following sources: http://www .cincinnatiport .org/public-finance/incentives/; http://www .portofchehalis .com/index .php/incentives; http://www .georgia .org/competitive-advantages/tax-credits/port-tax-credit-bonus/; http://www .portofvirginia .com/tools/tax-and-grant-incentives/; http://sfport .com/tax-incentives
6 . “Special Trucking Report: Collaboration is the game,” John D . Schulz, Logistics Management, August 2, 2014
7 . “Bigger ships: Panama celebrates opening its expanded canal,” Rick Jervis, USA Today, June 27, 2016 .
8 . Interview with Paul Devine, Orient Overseas Container Line .
9 . The bill (S .B . 25) defined a port authority as “a commission established with authority to designate a port district and to plan, finance, develop, operate or regulate transportation, distribution or other facilities, including manufacturing or assembling all types of personal property, which promote and protect commerce .”
10 . See “The Identification and Classification of Inland Ports,” Leitner, S . and R .H . Harrison, Center for Transportation Research, The University of Texas at Austin . Research Report 0- 4083-1, Texas Department of Transportation, August 2001 .
11 . See Jones Lang LaSalle . “The emergence of the inland port,” Spring 2011 .
12 . Information provided by Utah Department of Transportation .
13 . See “Rail Intermodal Keeps America Moving,” Association of American Railroads, May 2016 .
14 . Labor market data provided by the U .S . Bureau of Labor Statistics and sources are shared in the companion research brief: Salt Lake Inland Port Research Brief, August 2016, Kem C . Gardner Policy Institute .
15 . “Bigger ships: Panama celebrates opening its expanded canal,” Rick Jervis, USA Today, June 27, 2016 .
16 . Interview with Paul Devine, Orient Overseas Container Line .
17 . Fawcett, James A . (2007) . “Port Governance and Privatization in the United States: Public Ownership and Private Operation” in Devolution, Port Governance and Port Performance Research in Transportation Economics, Volume 17, 207–235 .
18 . Rodrigue, J .P ., Debrie, J ., Fremont, A ., Gouvernal, E . (2010) . “Functions and Actors of Inland Ports: European and North American Dynamics .”
19 . Brooks M . R ., Pallis A . A . (2008) . “Assessing port governance models: process and performance components” in Maritime Policy Management, vol . 35, no . 4, pp . 411-432 .
20 . Sherman, R . (2002) . Seaport Governance in the United States and Canada .
21 . Cypher, T ., Grinnell, C ., & California . (2007) . Governments working together: A citizen’s guide to joint powers agreements . Sacramento, CA: California State Legislature, Senate Local Government Committee .
22 . Sherman, R . (2002) .
23 . See Port of Pasco at http://www .portofpasco .org/inside-the-port/what-is-a-port .
24 . Ibid.
25 . See the helpful description of port authorities in this wiki: https://en .wikipedia .org/wiki/Port_authority .
26 . See https://en .wikipedia .org/wiki/Port_Authority_of_New_York_and_New_Jersey .
27 . See http://www .portofanc .com/about-us/municipal-enterprise/ .
28 . See http://sfport .com/about .
29 . Brooks M . R ., Pallis A . A . (2008) . “Assessing port governance models: process and performance components” in Maritime Policy Management, vol . 35, no . 4, pp . 411-432 .
30 . See the following sources: http://www .cincinnatiport .org/public-finance/incentives/; http://www .portofchehalis .com/index .php/incentives; http://www .georgia .org/competitive-advantages/tax-credits/port-tax-credit-bonus/; http://www .portofvirginia .com/tools/tax-and-grant-incentives/; http://sfport .com/tax-incentives .
31 . Information provided by Darin Mellott, Director, Research and Analysis, CBRE, Southwest Region .
32 . See Utah State Rail Plan, April 2015, Utah Department of Transportation .
33 . Ibid.
34 . These costs and the due diligence guidelines provided by CBRE Research/Trammell Crow Company .

I N F O R M E D D E C I S I O N S TM 20 gardner .utah .edu
Appendix A: Summary of Past Utah Inland Port-Related StudiesBureau of Economic and Business Research Study, 1974.
In their 1974 Utah Economic and Business Review article, “Overland/OCP Transit Privileges for Utah,” the Universi-ty of Utah’s Bureau of Economic and Business Research (BEBR) assessed the history, concept, function, and ram-ifications of Overland and Overland Common Point (OCP) tariffs (aka “freight weights”) .* In essence, U .S . West Coast steamship companies in conjunction with western rail-roads implemented Overland/OCP tariffs on freight arriv-ing in the U .S . via Pacific Coast ports as a way to compete with Gulf Coast and East Coast ports . For this reason, tar-iffs charged to importers on freight traveling to “Over-land/OCP Territory,” which includes North Dakota, South Dakota, Nebraska, Colorado, New Mexico, and all states eastward, are lower than tariffs on freight traveling to “Lo-cal Territory,” which includes Utah .
Because Overland/OCP tariffs could affect Utah’s feasibil-ity as an inland port, BEBR discussed the importance of “transit privileges .” Transit privileges, or “the permission granted a shipper by a carrier to stop a shipment some-where between point of origin and destination,” were granted by steamship and rail companies on Overland exports; however, transit privileges had not been extend-ed to OCP imports at the time of BEBR’s 1974 study . As a result, BEBR stressed the importance of acquiring transit privilege on imports in order for Utah to become a “via-ble inland port transit station .” While the study raised the question of whether there was a sufficient flow of export and import shipments to justify Utah as an inland port, it indicated that Utah met seven “critical elements” for a fea-sible and successful inland port: storage cost and space; labor and management costs/productivity; inventory tax-es; customs facilities; centralized location; accounting sys-tem; and sufficient rail, highway, and air services .
Salt Lake County Inland Port Authority Feasibility Study, 1990.
In January 1990, Leeper, Cambridge & Campbell, Inc ., (LCC Inc .) submitted a study to the Salt Lake County Division of Job Training and Development regarding the feasi-bility of establishing an Inland Port Authority in Utah . In their study, LLC Inc . referred to 1974 State Legislation that granted the “authority of state or political subdivisions to establish port authority .”
Prior to LLC Inc’s study, Salt Lake County officials suggested that an Inland Port Authority could bring millions of dol-lars to the regional economy and create hundreds of jobs within the Intermountain West . At the time of the Port Authority feasibility study, Salt Lake County had no cen-tralized entity responsible for freight transport, its current transportation infrastructure was expansive, and its trade and transportation potential was not being fully realized . In fact, the study argued that Utah lagged behind in busi-ness climate ratings, describing its more than 80 industri-al parks, and its Foreign Trade Zone facilities as “under-uti-lized .” In addition, the study also pointed out that 14 local freight forwarders were limited by both small volumes of local cargo and distances to major western markets and that there was little cooperation within the region be-tween coast and inland relations .
In their study, LLC Inc pointed out that intermodal far-east traffic experienced dramatic growth in the 1980s . At the time of this dramatic growth, 70 percent of freight markets were international and were mostly trans-Pacific . Due to this trans-Pacific growth, businesses needed assis-tance with exporting activities, especially market research and transportation . However, the study noted that no cur-rent economic development strategies included freight transportation .
In response to their litany of findings, LLC Inc recom-mended the establishment of an Inland Port Authority in three phases . The first phase, which would take place over the first six months of 1990, was to implement a Port Authority within the County government structure . Once implemented within the government system, the next 18 months would see the establishment of a quasi-indepen-dent Port Authority . During this second phase of imple-mentation, a private, non-profit organization would be selected to assume responsibility for the Port Authority and activities and services currently offered through the County would be shifted to the Port Authority . The third and final phase, which would take a maximum of three years, would transition to a self-supporting quasi-inde-pendent Port Authority . The Port Authority and County would establish fee structures and hourly rate schedules for services and facilities offered and would implement an evaluation procedure for the Port Authority .
The task force hoped the establishment of a Port Authority would generate jobs within the region, enhance the status-
* Overland refers to exports and OCP refers to imports .

es for ports of entry and Foreign Trade Zones, and improve service and competition among transportation providers .
Furthermore, much like the Zion Central Board of Trade of the early settlers, the Inland Port Authority would serve the role of facilitator . In other words, it would facilitate the development of transportation of goods, support eco-
nomic development efforts, promote increased trade in the region, and coordinate trade-related opportunities to export Utah products internationally . In essence, the Inland Port Authority would promote transportation ser-vices and help connect local businesses to potential for-eign markets for exporting .
Appendix B: History of Inland Port Policy Discussion in Utah (Prepared by Salt Lake County)
Enabling legislation
Senate Bill 25 was introduced by E . LaMar Buckner and Karl G . Swan on January 22, 1974 . Through S .B . 25, Buck-ner and Swan hoped to authorize the establishment of port authorities throughout the state . The bill granted the State or any political entity or combination of entities the authority to establish port authorities within or outside (or a combination of both) municipal boundaries and ex-tending police power to the port authority . The bill also authorized port authorities to be established, construct-ed, operated, and maintained using public funds . The bill passed unanimously in both the Senate and the House .
According to the bill, a port authority is defined as “a com-mission established with authority to designate a port district and to plan, finance, develop, operate or regulate transportation, distribution or other facilities, includ-ing manufacturing or assembling all types of personal property, which promote and protect commerce .”
Salt Lake County Inland Port and Foreign Trade Zone
Despite the passage of legislation authorizing the establishment of port authorities in 1974, little else was done to create an Inland Port Authority or a Port District in Salt Lake County until 1987 when the County created an Inland Port Task Force . The task force was created to identify weaknesses in trade and transportation and to propose means for overcoming those weaknesses . The task force was granted $30-$50,000 to perform the feasibility study in 1989 .
According to a Deseret News article dated May 19, 1990, a Port Authority was established, but lacked the funds to be fully functional . In December of the same year, State and Salt Lake County economic development officials petitioned the Legislature for $150,000 to establish the Inland Port Authority . While Salt Lake County headed up the charge and would establish the Port Authority with-in County limits, the benefits, according to the feasibility
study, would extend beyond Salt Lake County, having a positive impact on the state as a whole . To help persuade the legislature, Salt Lake County committed $300,000 to the Port Authority . But in October of 1991, a panel of 19 members failed to agree on whether a statewide Inland Port Authority would be beneficial to the State’s econo-my . Some thought that Port Authorities are more bene-ficial at the local level, as opposed to a state level . One point of agreement, however, was that the issue deserved further investigation .
Despite the lack of an Inland Port Authority in the State or the County, in 1992, Salt Lake County’s Export Assistance Program was named the best in the nation . Salt Lake City’s Foreign Trade Zone #30 was established in 1977 and was operational until its deactivation in 1996 due to lack of use . In 2006, Salt Lake City partnered with the Rockefeller Group to reactivate the Foreign Trade Zone . In a memo-randum to the Salt Lake City Council, dated January 11, 2008, the Redevelopment Agency of Salt Lake City sug-gested a desire to reactivate the Foreign Trade Zone and outlined the benefits . The Foreign Trade Zone reactiva-tion was approved in 2009, and in 2013 the Foreign Trade Zone was completed .
Another Memorandum to the Salt Lake City Council, dated February 26, 2015, outlined the application for ex-pansion of the Foreign Trade Zone through the creation of two “subzones,” both of which fall outside the existing foreign trade zone . These subzones would be located at two company expansion sites in Salt Lake City: one at the Red Wing Shoes facility located at 1841 S 5070 W and one at the Oemeta facility located at 2339 S Decker Lake Blvd . Salt Lake County’s Export Assistance Program, coupled with a 55-acre Foreign Trade Zone (No . 30) adjacent to the Union Pacific intermodal terminal with access to Salt Lake International Airport and international highways, con-tinue to help local businesses and manufacturers export goods and materials to and from Salt Lake City .
I N F O R M E D D E C I S I O N S TM 21 gardner .utah .edu

Appendix C: Salt Lake County Global Cities Initiative and Regional Export Plan (Prepared by Salt Lake County)
In 2014 Salt Lake County applied to take part in the Global Cities Initiative established by the Brookings Institute . The Global Cities Initiative is a five-year project with a goal of helping U .S . cities engage more fully in global markets . According to the 2014 application, Salt Lake County had no current export plan despite accounting for 70% of Utah’s total exports . Furthermore, according to the appli-cation, Salt Lake County stakeholders underestimate the impact of exports due to an incomplete understanding of the subject .
The application further explained that in 2013, Salt Lake County exported $11 .85 billion in goods and materials to over 40 countries, but half of those exports came from a single industry .
Understanding the need to diversify its exports, Salt Lake County desired to proactively approach the challenges it faced through joining the Global Cities Initiative . The application was accepted and in 2015, Salt Lake County joined the Global Cities Initiative .
As part of the Initiative, Salt Lake County developed a Regional Export Plan in 2016, which outlined the current state of exporting in the County as well as goals and steps to accomplish those goals . According to the Plan, most Salt Lake County companies are content with domestic markets, export support services were not fully under-stood, and 60% of businesses that responded to inquiries were not currently exporting goods or materials .
This lack of involvement in export is in part due to a lack of understanding and a suite of challenges that compa-nies—especially small companies—face . These challeng-es range from navigating foreign government regulations, to developing global sales contracts . All of this is height-ened by a general lack of expert knowledge . Furthermore, respondents requested services such as training work-shops, mentorship programs, networking opportunities, and individual export coaching .
In order to overcome the challenges, provide these ser-vices, and diversify exports, Salt Lake County proposed 5 core strategies, which they would accomplish through the Global Cities Initiative and in partnership with the World Trade Center Utah, one of which included the es-tablishment of an Inland Port Authority . While the estab-lishment of an Inland Port Authority is only a piece of the larger picture, it is a vital piece that will help enhance the region’s transport infrastructure and provide services that will empower local businesses to engage more complete-ly with global markets .
The Regional Export Plan set forth by the County in April 2016 is currently underway . As a follow-up to the Plan, the county has also submitted a Foreign Direct Investment ap-plication (May 2016), which will proactively facilitate job creation and enhance the quality of life for Salt Lake Coun-ty residents . Salt Lake County acknowledges the essential link between Foreign Direct Investments and exports, and understands the role that an inland port will play in helping accomplish its economic development goals .
I N F O R M E D D E C I S I O N S TM 22 gardner .utah .edu
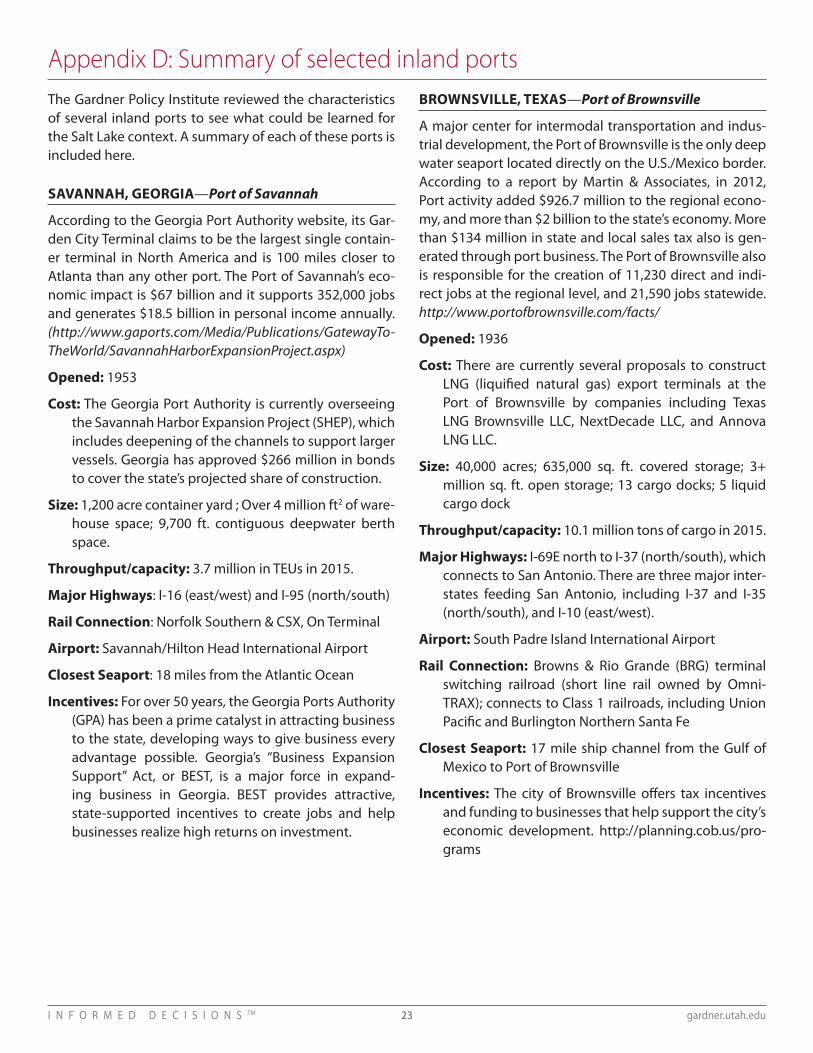
Appendix D: Summary of selected inland portsThe Gardner Policy Institute reviewed the characteristics of several inland ports to see what could be learned for the Salt Lake context . A summary of each of these ports is included here .
SAVANNAH, GEORGIA—Port of Savannah
According to the Georgia Port Authority website, its Gar-den City Terminal claims to be the largest single contain-er terminal in North America and is 100 miles closer to Atlanta than any other port . The Port of Savannah’s eco-nomic impact is $67 billion and it supports 352,000 jobs and generates $18 .5 billion in personal income annually . (http://www.gaports.com/Media/Publications/GatewayTo-TheWorld/SavannahHarborExpansionProject.aspx)
Opened: 1953
Cost: The Georgia Port Authority is currently overseeing the Savannah Harbor Expansion Project (SHEP), which includes deepening of the channels to support larger vessels . Georgia has approved $266 million in bonds to cover the state’s projected share of construction .
Size: 1,200 acre container yard ; Over 4 million ft2 of ware-house space; 9,700 ft . contiguous deepwater berth space .
Throughput/capacity: 3 .7 million in TEUs in 2015 .
Major Highways: I-16 (east/west) and I-95 (north/south)
Rail Connection: Norfolk Southern & CSX, On Terminal
Airport: Savannah/Hilton Head International Airport
Closest Seaport: 18 miles from the Atlantic Ocean
Incentives: For over 50 years, the Georgia Ports Authority (GPA) has been a prime catalyst in attracting business to the state, developing ways to give business every advantage possible . Georgia’s “Business Expansion Support” Act, or BEST, is a major force in expand-ing business in Georgia . BEST provides attractive, state-supported incentives to create jobs and help businesses realize high returns on investment .
BROWNSVILLE, TEXAS—Port of Brownsville
A major center for intermodal transportation and indus-trial development, the Port of Brownsville is the only deep water seaport located directly on the U .S ./Mexico border . According to a report by Martin & Associates, in 2012, Port activity added $926 .7 million to the regional econo-my, and more than $2 billion to the state’s economy . More than $134 million in state and local sales tax also is gen-erated through port business . The Port of Brownsville also is responsible for the creation of 11,230 direct and indi-rect jobs at the regional level, and 21,590 jobs statewide . http://www.portofbrownsville.com/facts/
Opened: 1936
Cost: There are currently several proposals to construct LNG (liquified natural gas) export terminals at the Port of Brownsville by companies including Texas LNG Brownsville LLC, NextDecade LLC, and Annova LNG LLC .
Size: 40,000 acres; 635,000 sq . ft . covered storage; 3+ million sq . ft . open storage; 13 cargo docks; 5 liquid cargo dock
Throughput/capacity: 10 .1 million tons of cargo in 2015 .
Major Highways: I-69E north to I-37 (north/south), which connects to San Antonio . There are three major inter-states feeding San Antonio, including I-37 and I-35 (north/south), and I-10 (east/west) .
Airport: South Padre Island International Airport
Rail Connection: Browns & Rio Grande (BRG) terminal switching railroad (short line rail owned by Omni-TRAX); connects to Class 1 railroads, including Union Pacific and Burlington Northern Santa Fe
Closest Seaport: 17 mile ship channel from the Gulf of Mexico to Port of Brownsville
Incentives: The city of Brownsville offers tax incentives and funding to businesses that help support the city’s economic development . http://planning .cob .us/pro-grams
I N F O R M E D D E C I S I O N S TM 23 gardner .utah .edu

GREER, SOUTH CAROLINA— Inland Port Greer:
According to a report by University of South Carolina, Inland Port Greer has had a $53 billion annual impact. Its opera-tions supported nearly 95,000 jobs and $5.2 billion in labor income, mostly in the upstate area.
Opened: October 2013
Cost: $50 million invested by South Carolina State Ports Authority
Size: 37 .5 acres, but looking at expanding on an addition-al 25 acres .
Throughput/capacity: 40,000 containers initially, ex-pandable to 100,000 containers annually at full build-out . In 2015, Inland Port Greer handled 58,000 con-tainers .
Rail Connection: Exclusively provided by Norfolk South-ern
Closest Seaport: Connected to the Port of Charleston, South Carolina
Incentives: The state of South Carolina and South Car-olina State Ports Authority is investing $2 billion in South Carolina ports and port-related infrastructure over ten years, with $50 million invested directly in Inland Port Greer . There is also a foreign trade zone (FTZ) in Greer .
DALLAS, TEXAS—International Inland Port of Dallas (IIPOD):
Opened: The IIPOD initiative was jumpstarted with the opening of Union Pacific’s Dallas Intermodal Terminal in 2005 .
Size: The active project’s impact area encompasses more than 7,000 acres and six municipalities, including Dal-las County . 12 million plus sq ft of warehouse space has been built or is currently under construction .
Throughput: The IIPOD area handled 480 million short tons of cargo in 2007, according to a 2008 TransSys-tems study .
Rail connection: The project takes advantage of the re-gion’s superior transportation infrastructure, which includes five interstate highways and two Class I rail-roads (Union Pacific and Burlington Northern Santa Fe), and is focused at the confluence of Interstates 35, 45, and I20 .
Closest seaport: Houston, TX
Incentives: The IIPOD is a public private partnership . Much of IIPOD is located within a Foreign Trade Zone (FTZ) .
The main IIPOD impact area is encompassed by Loop 12 to the north, the Dallas County/Ellis
County line to the south, the Trinity River to the east, and Interstate 35 E to the west .
HOUSTON, TEXAS —Port of Houston:
Opened: 1914
Size: The Port of Houston FTZ has over 700 acres of land and building space for development and lease . There are three major components to the Port . The Port Au-thority of Houston owns, operates, and leases public facilities that include the Barbours Cut terminal (235 acres of developed land), Bayport container terminal (376 acres of container yard and a 123 acre intermodal facility), and the general cargo terminals at the Turn-ing Basin, Jacintoport, Woodhouse, and Care .
Throughput: Processed 1 .4 million TEUs, or 33 .5 million tons of cargo in 2011
Rail connection: The main rail companies are Burlington Northern Santa Fe, Union Pacific, and the Port Termi-nal Railroad Association . Note that the port also has road and air connections, with two major internation-al airports nearby .
Closest seaport: Handles the majority of containerized cargo traveling through the Gulf of Mexico . Note that the Port of Houston is located off of Galveston Bay .
Incentives: The Port of Houston Authority manages a for-eign trade zone (FTZ) made up of private and port-owned sites across Harris County and Houston . The Houston Zone offers users special benefits . For exam-ple, customs duties on imported goods entering the FTZ can be delayed until the cargo is removed from the zone . No duty is paid if the merchandise is export-ed directly from the zone .
CHICAGO, ILLINOIS—Centerpoint Intermodal Center
Chicago is considered the nation’s largest inland port. Almost 3.4 million SF and 168 acres of space are dedicated to Walmart’s distribution center here alone.
Opened: In August 2002 BNSF Logistics Park Chicago opened and Union Pacific Joliet Intermodal Terminal followed in August 2010 .
I N F O R M E D D E C I S I O N S TM 24 gardner .utah .edu

Cost: $1 billion Centerpoint investment for Centerpoint Intermodal Center (located in Elwood, IL) plus $2 bil-lion Centerpoint investment for Centerpoint Inter-modal Center (located in Joliet, IL) .
Size: Almost 6,000 acres between Centerpoint Intermod-al and BNSF intermodal facility (2,500 acre logistics center at Centerpoint Intermodal Center in Elwood plus 770 acre BNSF logistics park facility plus 3,600 acre logistics center at Centerpoint Intermodal Center in Joliet plus 785 acre Union Pacific Joliet Intermodal Terminal) .
Throughput: Expected to handle 46 million TEUs per annum in the future . 5,000 containers processed per year in Joliet .
Rail connection: Union Pacific and BNSF
Closest seaport: Port Elizabeth, New Jersey
Incentives: Centerpoint Intermodal Center in Joliet is a public private partnership . Foreign Trade Zone (FTZ) benefits and flexible zoning in the logistics park pro-vide an incentive for companies and logistics provid-ers to locate here . The village of Elwood supported the Elwood facility with $150 million of tax increment financing (TIF) funding .
KANSAS CITY, MISSOURI—Port of Kansas City & Centerpoint KCS Intermodal Center:
Opened: The terminal dates back to the 1860s, but the port closed in 2007 and reopened in August 2012, renovations are ongoing in 2016 .
Size: Port of Kansas City is located on 6 acres, while the Centerpoint KCS Intermodal Center contains a 370acre intermodal park and a 970acre industrial park .
Throughput: Designed to handle 800,000 tons of cargo per season .
Rail connection: Served by the Union Pacific Class I Rail-road, Highway Access to I35, I70/670, I435, I635, I29, I470, Rte . 71, Rte . 24, Rte . 69 . On the Missouri River at mile 367 .1 .
Closest seaport: Rail access to the deepwater Port of Lazaro Cardenas in Mexico, the Panama Canal, and Gulf Coast seaports .
Incentives: Eventual public private partnership of the port . Between 2007 and 2010, approximately $110 million of private capital was generated in the state of Missouri to fund port infrastructure projects . This
funding was generated by the leveraging of local, state and Federal funds granted in the amount of $15 million . The Port Authority has applied for grants to pay for rail upgrade to the port .
The CenterPoint KCS Intermodal Center is in a For-eign Trade Zone and within the transcontinental and NAFTA trade corridors . The Centerpoint KCS Inter-modal Center is within the Missouri Enhanced Enter-prise Zone .
ST. LOUIS, MISSOURI—Port of Metropolitan St. Louis:
The second largest inland port by tripton miles and the third largest by tonnage.
Opened: The legal entity was created in 1959, in 1962 the port acquired its first property via a land lease from the U .S . Army Corps of Engineers .
Size: 70 miles long, includes both sides of Mississippi Riv-er, from river mile 138 .8 to 208 .8 .
Throughput: Handles more than 36 million tons of freight each year .
Rail connection: Served by 6 Class One railroads (Union Pacific, Burlington Northern Santa Fe, Canadian Na-tional Railway, CSX, Kansas City Southern, Norfolk Southern) 7 Interstate highways, and 2 international airports, the Lambert St . Louis of MO and the Mid-America Airport of IL .
Closest seaport: Norfolk, VA
Incentives: A two year declining State appropriation of $50,904 was initially provided to help finance the startup operations . The site has access to two Foreign Trade Zones . Foreign Trade Zone number 31 is a pub-lic private venture operated by the America’s Central Port District in Granite City, IL . Foreign Trade Zone 102 is operated by the St . Louis County Port Authority .
Additional project funds have been provided by com-petitive state and federal grants .
ATLANTA, GEORGIA—Cordele Intermodal Services:
Opened: December 2011
Size: 40 acres (option to expand to 1,200 acres)
Throughput: 6,000 containers in 2014
Rail connection: CSX and Norfolk Southern . The facility is located one mile from I75 .
Closest seaport: Port of Savannah and Port of Brunswick
I N F O R M E D D E C I S I O N S TM 25 gardner .utah .edu

Incentives: Georgia Port Authority and Cordele Intermod-al Services recently signed a Memorandum of Under-standing, creating a partnership which provides cost savings, traffic mitigation, and additional operational services benefiting shippers, truckers, and steamship lines .
MEMPHIS, TENNESSEE —Port of Memphis:
The fifth largest inland port in the U.S. and the second larg-est inland port on the Mississippi River with jurisdiction from miles 715 to 741. The Port of Memphis consists of three sep-arate harbors: Pidgeon Industrial Harbor, McKellar Lake Har-bor, and Wolf River Harbor.
Opened: Industrial project opened in 1951
Size: A 1,000 acre water-fronted industrial park raised to a flood free elevation .
Throughput: Handled 13 .6 million short tons in 2012, with a peak of 19 .1 million short tons in 2006 . The Port of Memphis ranks 41st among all U .S . coastal and in-land ports based on total annual tonnage .
Rail connection: Interstate 40, Interstate 55 and seven major U .S . highways converge near the Port of Mem-phis . Five Class I rail systems serve Memphis: BN, CN, CSX, Norfolk Southern and Union Pacific . Air service via FedEx . Port-related operations ship or receive a small proportion of goods and materials by barge .
Closest seaport: Savannah, GA
Incentives: The port is designated as a Port of Entry and a FTZ . In addition, the Port Commission applied for a $35 .3 million TIGER V grant in June from the U .S . De-partment of Transportation . The requested funds from the TIGER grant will complement existing state and pri-vate investments and help leverage the $34 .1 million in committed funds from the Port and their partners . The multi-modal expansion project is a true public-private partnership, with public and private contributions rep-resenting nearly 50 percent of the total funds needed towards the total $69 .5 million project cost .
COLUMBUS, OHIO—Rickenbacker Inland Port:
Average asking rate is $2.64 per SF for warehouse and distri-bution space, which is significantly lower than comparable space in Atlanta, Chicago, Dallas, and Newark. Rickenback-er Inland Port includes access to an international airport fo-cused on cargo.
Opened: The first large scale development occurred at Rickenbacker in 1985 . In 1993 Forward Air purchased their first site of what would become a multi-site op-eration at Rickenbacker that today is its North Ameri-can trucking hub
Size: 1,576 acre master planned logistics park with 60 million square feet of distribution space with room for expansion .
Throughput: 400,000 containers annually
Rail connection: Norfolk Southern and CSX provide rail service . Air service is provided via Rickenbacker Inter-national Airport .
Closest seaport: Norfolk, Virginia is a short 1 .5 day drive
Incentives: Rickenbacker inland port is a public private partnership, with $150 million in federal/state/local investment in the Heartland Corridor Project and $63 million in investment at the intermodal yard . Signifi-cant public investments have been made in roads and utilities in the area . The port falls within U .S . Foreign Trade Zone #138, a site that is legally considered out-side of Customs territory, so goods may be brought into the site duty free and without formal customs en-try . This provides FTZ users the opportunity to lower costs and remain competitive with international com-panies . Rickenbacker adjusts rates for carriers that serve Rickenbacker with regularity on a long term ba-sis . Air cargo carrier flying scheduled and/or charter freighter flights with a minimum average of 8 month-ly revenue frequencies per month over the previous 6 7 month period are eligible to have their rate lowered to the Signatory Landing Fee rate should they not otherwise qualify for it .
EAST OF LOS ANGELES, CALIFORNIA—Inland Empire / Victorville / Southern California Logistics Airport (SCLA):
Opened: The late 1980s saw a surge in warehousing away from the Port of Los Angeles
Size (acres): 700 acres dedicated to Southern California Logistics Airport . The Inland Empire is made up of a variety of properties spread across a large region to the east of Los Angeles .
Throughput: 65-80 percent of state’s imported cargo is processed here, or approximately 5 .26-6 .48 million containers annually .
I N F O R M E D D E C I S I O N S TM 26 gardner .utah .edu
Rail connection: Burlington Northern Santa Fe Railway and Union Pacific Railroad rail lines serve this area .
Closest seaport: Long Beach, CA
Incentives: Tax revenues from new airport businesses and city bonds help pay for infrastructure improve-ments .
CHARLOTTE, NORTH CAROLINA—Charlotte Regional Intermodal Facility or Charlotte Inland Terminal:
The N.C. Ports Authority operates an inland terminal in Char-lotte, linking port facilities in Wilmington with businesses in Charlotte. Freight is moved either by rail or by “Sprint Truck Service” from the port at Wilmington to Charlotte, and the shipper is only charged for a oneway trip.
Opened: December 2013
Cost: $90 million ($16 million public funds)
Size: 170 acres
Throughput: 140,000 containers annually (expandable to 200,000)
Rail connection: Four major rail rail systems connected, both Norfolk Southern and CSX Transportation have major operations in Charlotte . Also connected to I-85 and I77 corridors . Air service provided via Charlotte Douglas International Airport .
Closest seaport: Wilmington, NC and Charleston, SC are equidistant to Charlotte . Morehead City, NC is also close by .
Incentives: Foreign Trade Zone (FTZ) . Inland port status in Charlotte also provides speedier processing of in-ternational shipments through U .S . Customs . Char-lotte Inland Terminal is bonded by US Customs and Border Protection .
Appendix E: ContributorsStuart Adams, Utah SenateNathan Anderson, Union PacificStuart Clason, Salt Lake CountyJason Combes, Rio Tinto Larry Coughlin/Matt Linn, BoeingLisa Cox, Freightlink Lew Cramer, Coldwell Banker Commercial Advisors Paul Devine, Orient Overseas Container LineBecky Edwards, Utah House of RepresentativesTJ England, C .R . England Inc .Dave Fiscus, Dept . of Commerce Utah Export Center Theresa Foxley, Governor’s Office of Economic
DevelopmentLara Fritts, Salt Lake CityTerry Grant, Key BankJeff Harris, Utah Department of TransportationPatrick Hogle, Salt Lake Garfield & Western Railway Co .Michael Hughes, Salt Lake Garfield & Western Railway Co .Tom Jacobson, Law Offices of Thomas N . Jacobson
Dan Kunz, Utah Department of TransportationDean Luikart, Wells FargoMariana Mavor, Salt Lake Garfield & Western Railway Co .Darin Parker, Parker InternationalSteve Price, Price Real EstateKyle Roberts, Newmark GrubbJosh Scholz, Orient Overseas Container LineWalter Steinvorth, Utah Department of TransportationBrad Wilson, Utah House of Representatives
Special thanks to Darin Mellott, Director, Research and Analysis, CBRE, Southwest Region for sharing data and research insights. Stuart Clason and Blake Thomas with Salt Lake County also contributed to the research and writing about the history of the inland port discussion in Utah. Jennifer Leaver, Nick Thiriot, Vanessa Calder, and Tucker Samuelson also provided valuable data collection, research and writing support.
I N F O R M E D D E C I S I O N S TM 27 gardner .utah .edu

A D V I S O R Y B O A R D
Advisory Board members provide stra-tegic direction to the institute and help establish it as an enduring community asset that assists elected officials, busi-ness and community leaders, and the public make informed decisions .
ConvenersMichael O . LeavittMitt Romney
BoardScott Anderson, Co-ChairGail Miller, Co-ChairDoug AndersonDeborah BayleLane BeattieCynthia A . BergRoger Boyer
Ken BullockWilford ClydeSophia M . DiCaroLisa EcclesSpencer P . EcclesMatt EyringKem C . GardnerChristian GardnerMatthew S . HollandClark IvoryRon JibsonMike S . LeavittVivian S . LeeKimberly Gardner MartinAnn MillnerCristina OrtegaJason PerryTaylor Randall
Jill Remington LoveBrad RencherJosh RomneyCharles W . SorensonJames Lee SorensonVicki VarelaRuth V . WatkinsTed WilsonNatalie Gochnour, Director
Ex OfficioSenator Orrin HatchGovernor Gary HerbertSpeaker Greg HughesSenate President Wayne NiederhauserMayor Ben McAdamsRepresentative Brian KingSenator Gene Davis
S T A F F A N D F A C U L T Y A D V I S O R S
Natalie Gochnour, DirectorJennifer Robinson, Associate DirectorJames A . Wood, Ivory-Boyer
Senior FellowDianne Meppen, Director of
Survey ResearchPamela S . Perlich, Director of
Demographic ResearchJuliette Tennert, Director of
Economics and Public PolicyAdam Meirowitz, Faculty AdvisorMatt Burbank, Faculty AdvisorSamantha Ball, Research Associate
DJ Benway, Research AnalystAnna Bergevin, Research AssociateCathy Chambless, Senior Research
AssociateJohn C . Downen, Senior Research
AnalystKen Embley, Senior Research AssociateEmily Harris, Demographic AnalystMichael T . Hogue, Senior Research
StatisticianMike Hollingshaus, DemographerCollen Huber, Administrative Manager
Shelley Kruger, Accounting and Finance Manager
Jennifer Leaver, Research AnalystDavid LeBaron, Research AssociateSara McCormick, Senior Research
AssociateLevi Pace, Research AnalystNicholas Thiriot, Communications
SpecialistEffie Johnson Van Noy, Utah State
Data Center CoordinatorNatalie Young, Research Analyst
Kem C. Gardner Policy Institute 411 East South Temple Street, Salt Lake City, Utah 84111
801-585-5618 I gardner .utah .edu